Article

Numerical Analysis of Phosphorus Concentration Distribution in a Silicon Crystal during Directional Solidification Process

Research Institute for Applied Mechanics, Kyushu University, 6-1 Kasuga-koen, Kasuga, Fukuoka 816-8580, Japan
*
Author to whom correspondence should be addressed.
Crystals 2021, 11(1), 27; https://doi.org/10.3390/cryst11010027
Submission received: 4 December 2020 / Revised: 26 December 2020 / Accepted: 28 December 2020 / Published: 30 December 2020
(This article belongs to the Special Issue Crystal Growth from Liquid Phase)

Abstract

:
For bulk doping, boron and phosphorus are usually used as p-type and n-type dopants, respectively. The distribution of these dopant concentrations in a silicon crystal along the vertical direction is governed by the segregation phenomena. As the segregation coefficient of phosphorus is small, phosphorus concentration distribution in a silicon crystal becomes inhomogeneous; inhomogeneous phosphorus concentration distribution affects the distribution of resistivity in the crystal. Therefore, it is important to control the phosphorus concentration distribution in a silicon crystal and make it uniform. In this study, by numerical analysis, we investigated the effect of the evaporation flux at the melt surface on phosphorus concentration distribution during the directional solidification process. To obtain a homogeneous phosphorus concentration distribution in the silicon crystal, we had to control the phosphorous evaporation flux at the melt surface and maintain approximately the same phosphorus concentration in the melt during the entire solidification process even though the growth rate was always changing.

1. Introduction

The photovoltaic market has rapidly advanced over the last two decades. Compared with multicrystalline materials, single-crystalline silicon has proven advantages such as high quality and very low dislocation density, but the production cost of single-crystalline silicon is high. Therefore, multicrystalline materials are typically used in solar cells because they are more cost-effective than their single-crystalline silicon counterparts. The most widely used method for growing multicrystalline materials is directional solidification (DS). Moreover, technological progress regarding solar cells has been developed significantly within the last decade, leading to enhanced efficiency of solar cells and accounting for the increased use of phosphorus-doped n-type crystalline silicon materials [1,2].
To reduce production costs, the impurity distribution along the axis direction should be controlled and kept constant. However, ingots grown by most manufacturers have an inhomogeneous phosphorus concentration distribution along their height because of the small segregation coefficient of phosphorus. A small segregation coefficient leads to the low production yield and high production cost of silicon crystals because of the specific range of resistivity required in the crystals by industrial manufacturers. The resistivity of a p-doped CZ silicon crystal is widely distributed over the length of the crystal. The minority carrier lifetime of solar cells decreases as a function of the resistivity along the silicon crystal length [3]. Resistivity distribution is very effective regarding solar cell capability [4,5,6].
One method of improving the inhomogeneous resistivity distribution along the vertical direction could be simultaneous doping using two different impurities. Using numerical analysis, Lee conducted a study and reported that codoping Ga and Bi could improve the vertical distribution of Ga [7]. Using numerical simulation, Wang et al. conducted a study and presented that the codoping method is useful for improving silicon crystal growth [8]. Forster et al. proposed codoping with P, B, and Ga during ingot crystallization [9]. However, compensational doping may have negative effects such as the degradation of minority carrier lifetime and formation of recombination centers. Thus, it may not be suitable for high-efficiency solar cells.
Another method, the enhancement of dopant evaporation at the melt surface, is also effective in controlling the vertical resistivity distribution of grown crystals. Buchovska et al. have reported that traveling magnetic fields can enhance melt stirring and evaporation rate to control the phosphorus distribution along the vertical direction of the crystal [10]. In CZ silicon crystal growth, the growth rate, which is related to the incorporation flux of the dopant impurity at the melt–crystal interface, could be controlled accurately and kept constant during the growth process. However, the growth rate in the directional solidification (DS) method will always change during the entire solidification process; therefore, it is difficult to precisely control the growth rate.
In this study, we focus on the incorporation flux of phosphorus at the melt–crystal interface and evaporation flux of phosphorus at the melt surface. By numerical analysis, we investigate how to obtain a homogeneous phosphorus concentration distribution along the crystal’s vertical direction via the DS method, even when the growth rate is not constant.

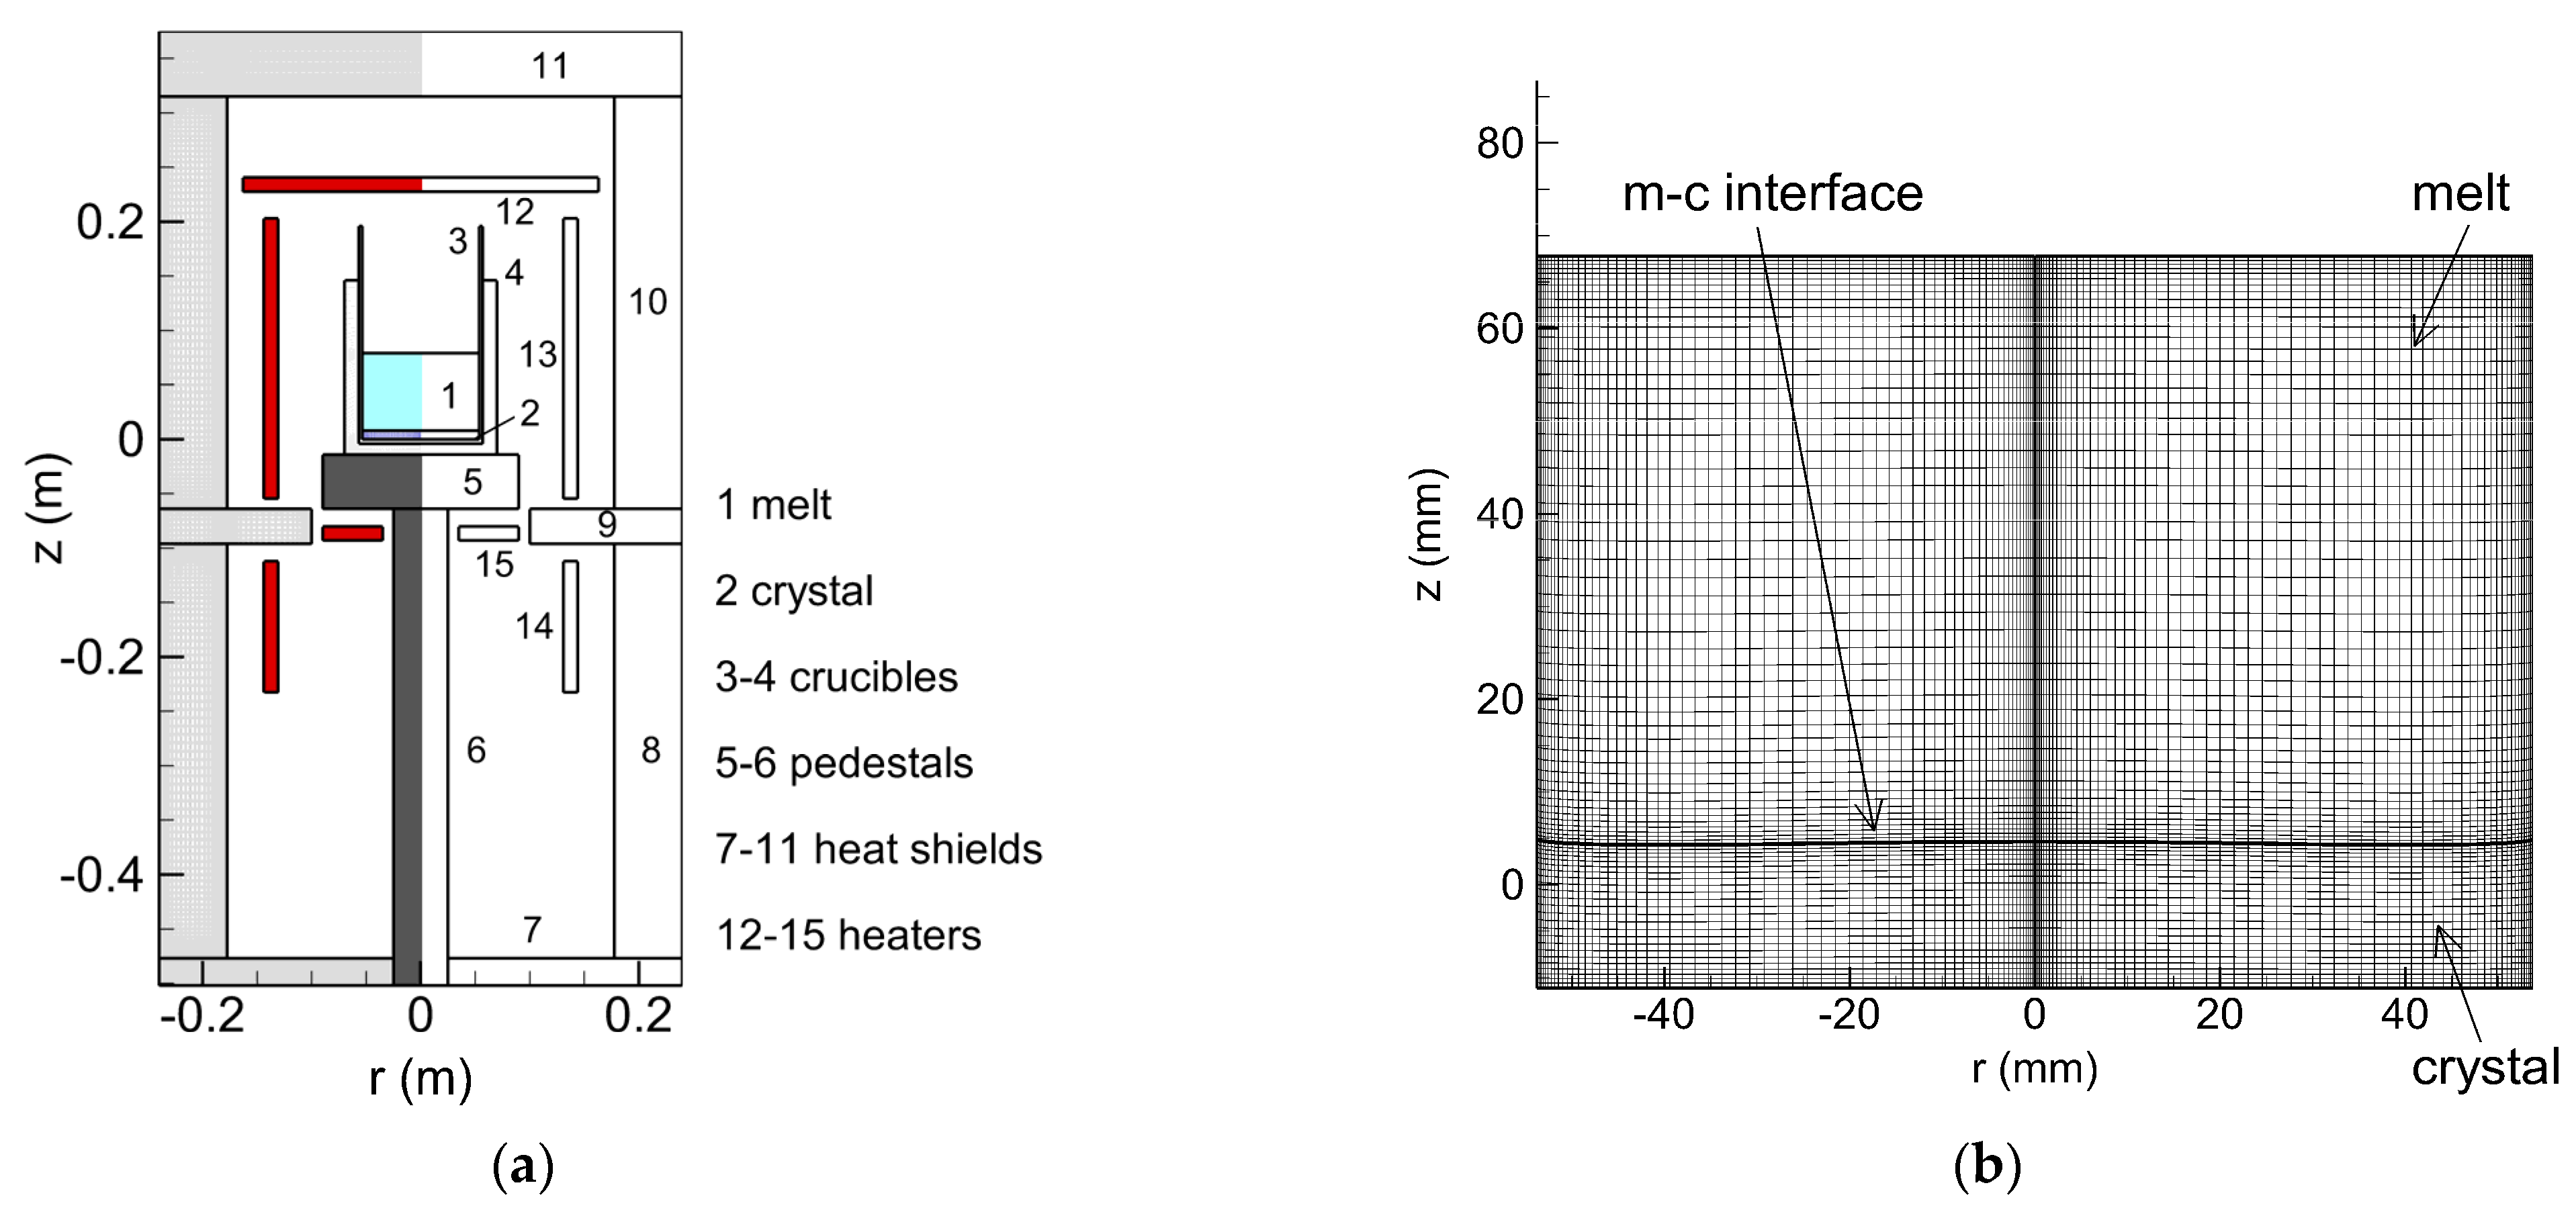
2. Materials and Methods

The DS furnace used in this study consisted of a crystal, silicon melt, crucibles, pedestals, heat shields, and heaters, as shown in Figure 1a. The crystal’s height was 80 mm and its diameter was 108 mm. Figure 1b shows the computational grid of the melt–crystal domain. The melt–crystal interface is calculated using a dynamic interface tracking method. The melt–crystal interface is moving upward as a function of time. The grid size of boundary areas such as the melt–crystal interface, melt surface and melt–crucible wall interface is 0.007–0.1 mm. We developed our own simulation code as follows. A transient global model was developed for the DS process to study the global heat transfer in the entire furnace, flow field in the melt, and shape of the melt–crystal interface as a function of time. The global heat transfer in the entire furnace included the convective heat transfer of the silicon melt, conductive heat transfer in all of the solid components, and radiative heat transfer in all of the diffusive surfaces of the furnace. A dynamic interface tracking method was also included to obtain the shape of the melt–crystal interface. The following major assumptions were made for the simulations: (i) The geometry of the furnace configuration is axisymmetric; (ii) the melt flow is incompressible and laminar; (iii) the radiative heat transfer can be modeled as a diffuse-gray surface; and (iv) the effect of the gas flow in the furnace is negligible and can be ignored. The governing equations for melt flow under these conditions are as follows:
· V = 0
ρ ( V t + V · V ) = p + · [ μ ( V + V T ) ] ρ g β T ( T T m )
ρ c ( T t + V · T ) = · ( k T )
where V , ρ , p , μ , g , β T , c and k represent melt velocity, melt density, melt pressure, melt viscosity, gravitational acceleration, thermal expansion coefficient, heat capacity and thermal conductivity, respectively. Radiative heat exchange between diffuse surfaces is important in heat transport in a unidirectional solidification furnace [11]. The calculation details, including the impurity transport in the melt, have already been reported elsewhere [12,13,14].
The governing equation of phosphorus transport in the silicon melt is
V · C = D · ( C )
where C and D are the phosphorus concentration and diffusion coefficient [5] in the silicon melt, respectively.
We considered the phosphorus evaporation flux at the melt surface to be represented as follows [15]:
F l u x m e l t   s u r f a c e = D C n
where D is the diffusion coefficient in the silicon melt and C is the phosphorus concentration at the melt surface. We applied the phosphorus incorporation flux at the melt–crystal interface, Fluxinterface, to the phosphorus evaporation flux at the melt surface, Fluxmelt surface. The phosphorus incorporation flux at the melt–crystal interface was represented as follows:
F l u x i n t e r f a c e = V g × C i × ( 1 k )
where V g is the growth rate, C i is the phosphorus concentration at the melt–crystal interface, and k is the segregation coefficient of phosphorus. We take k = 0.35 [16]. The initial value of the phosphorus concentration in the melt was 1016 (atoms/cm3).

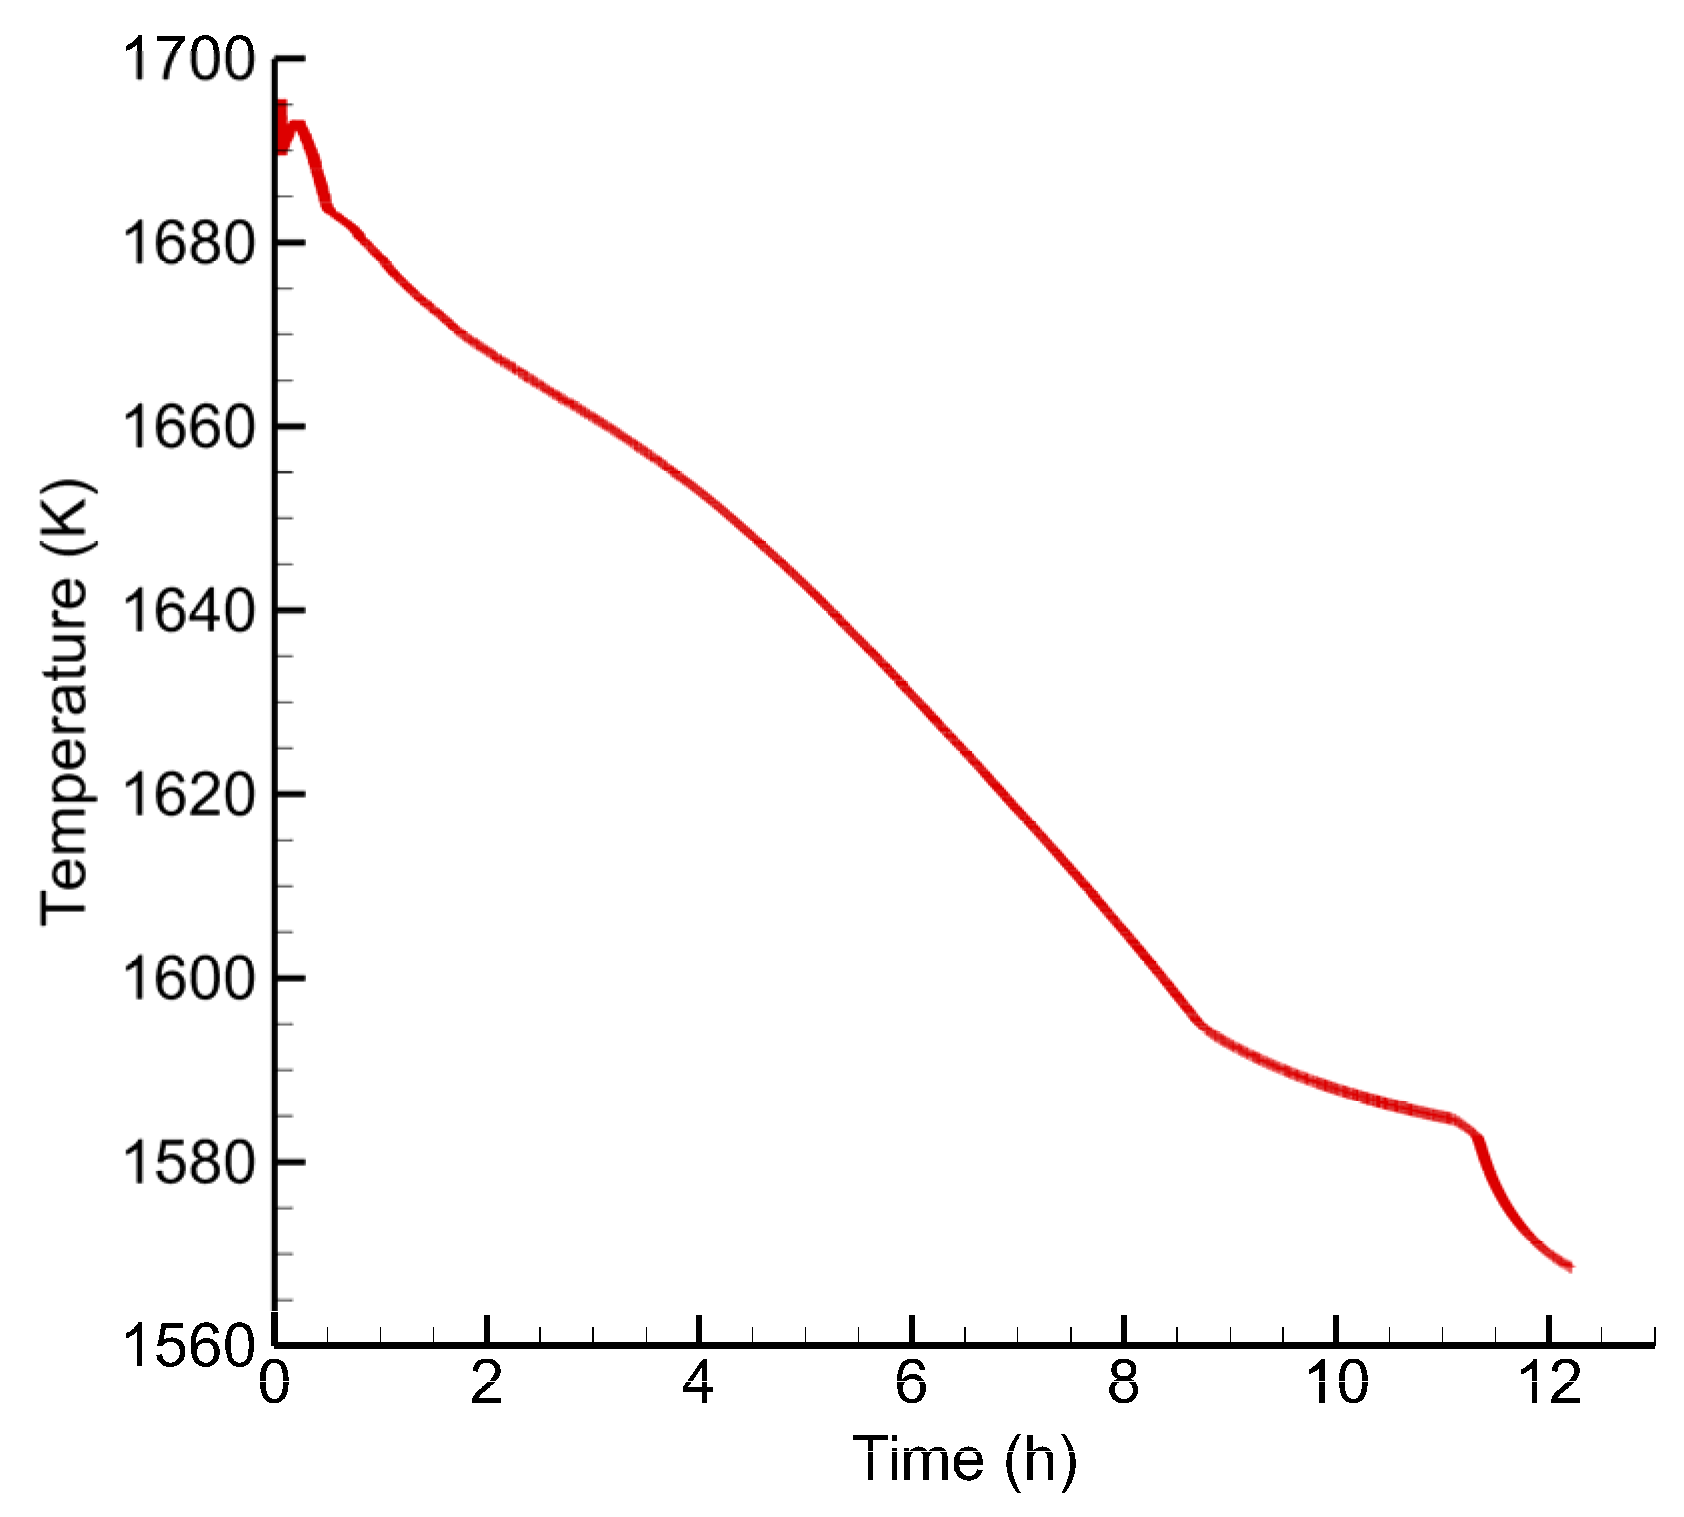
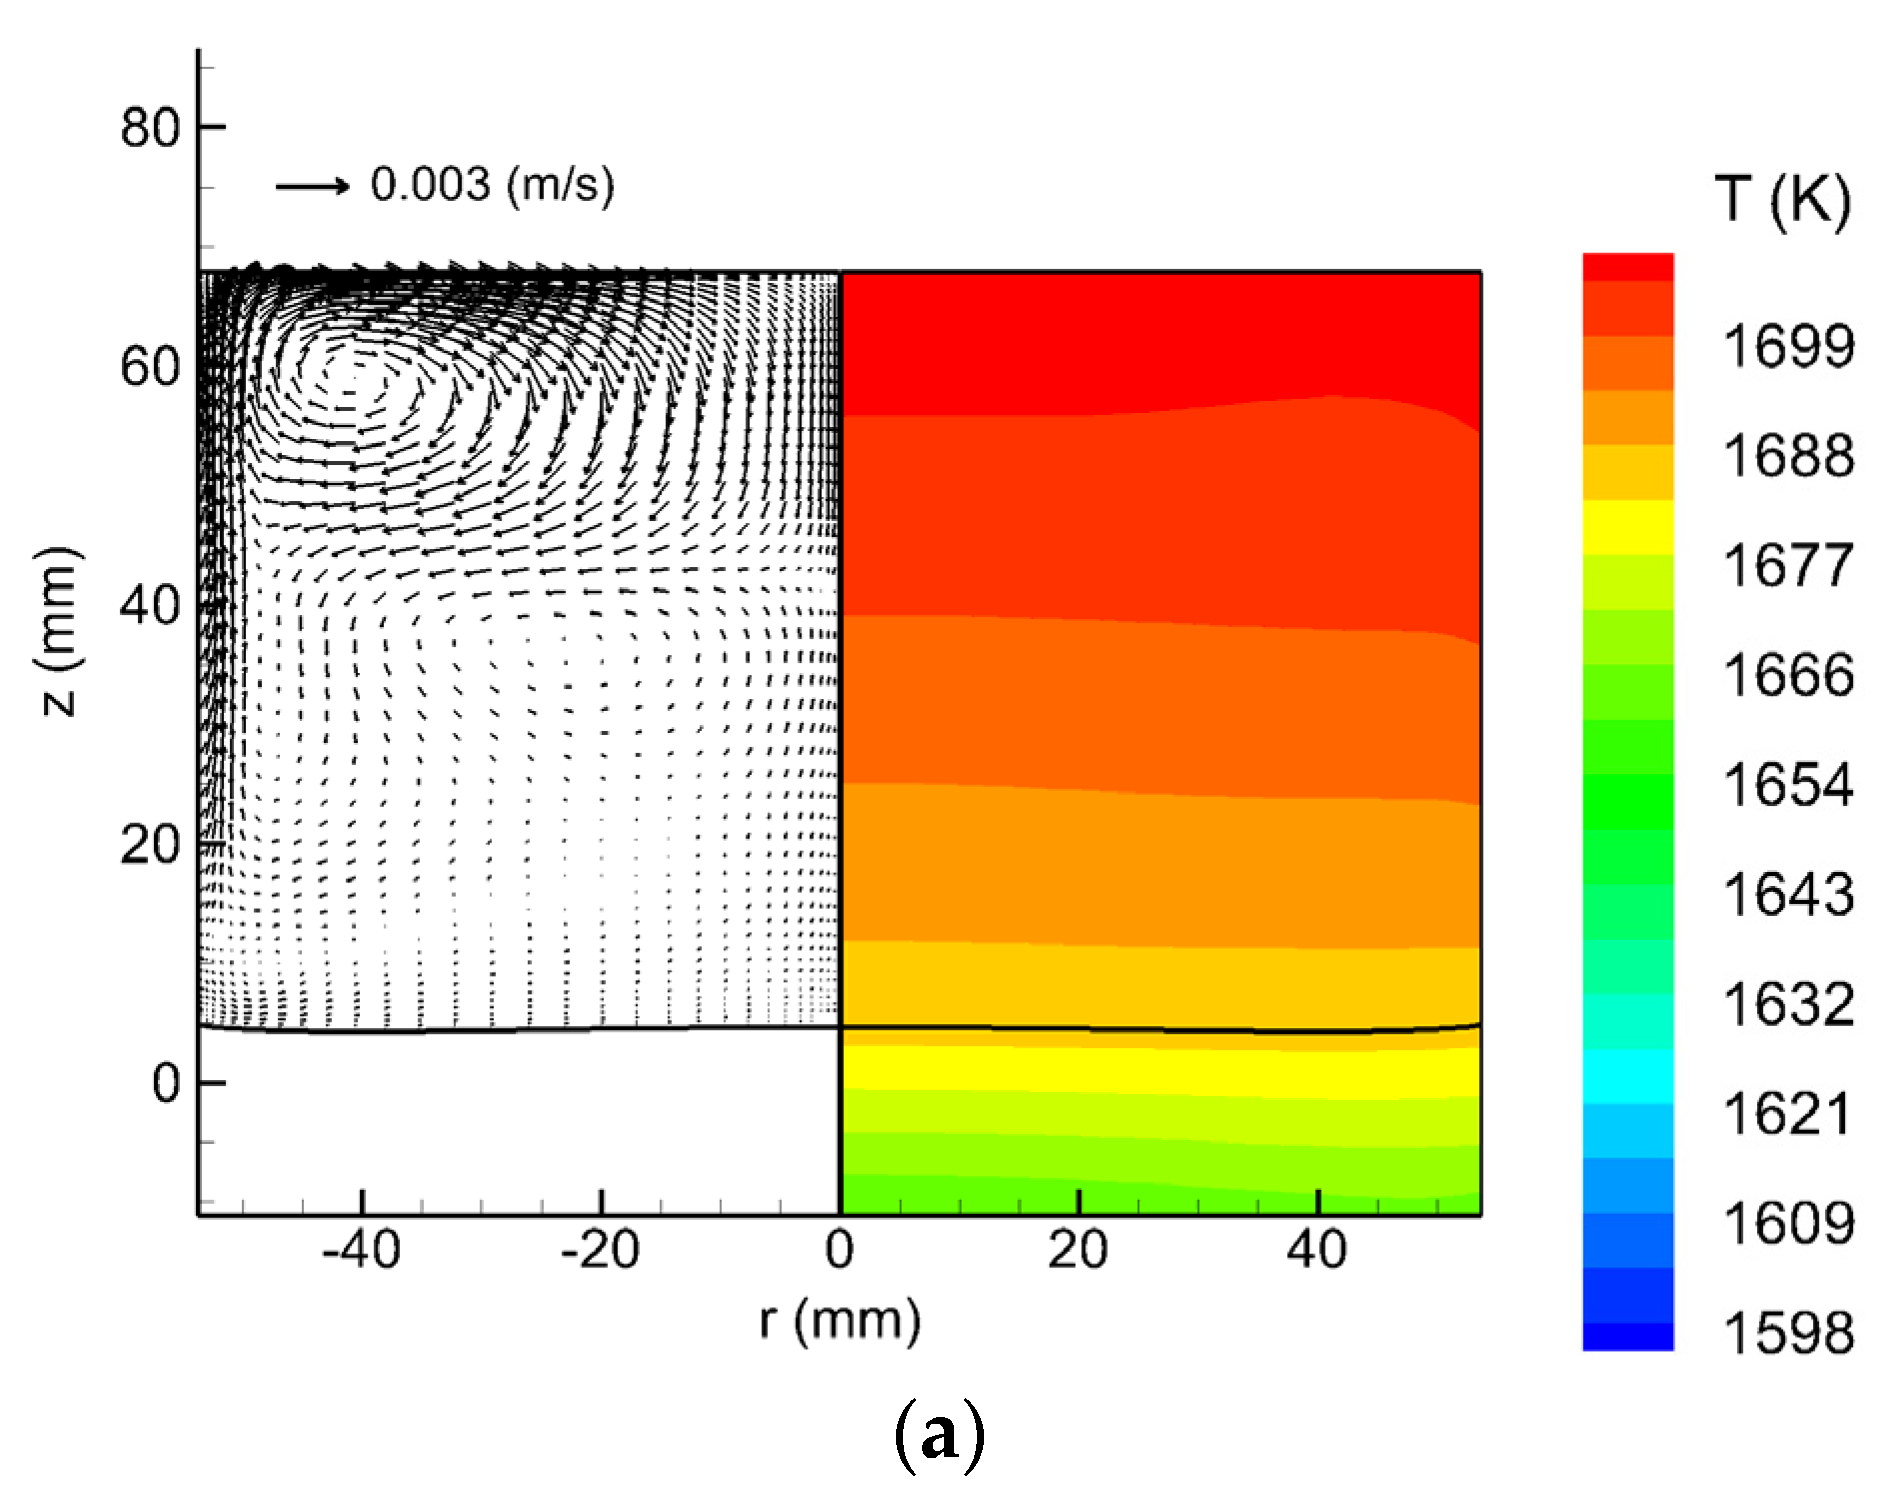
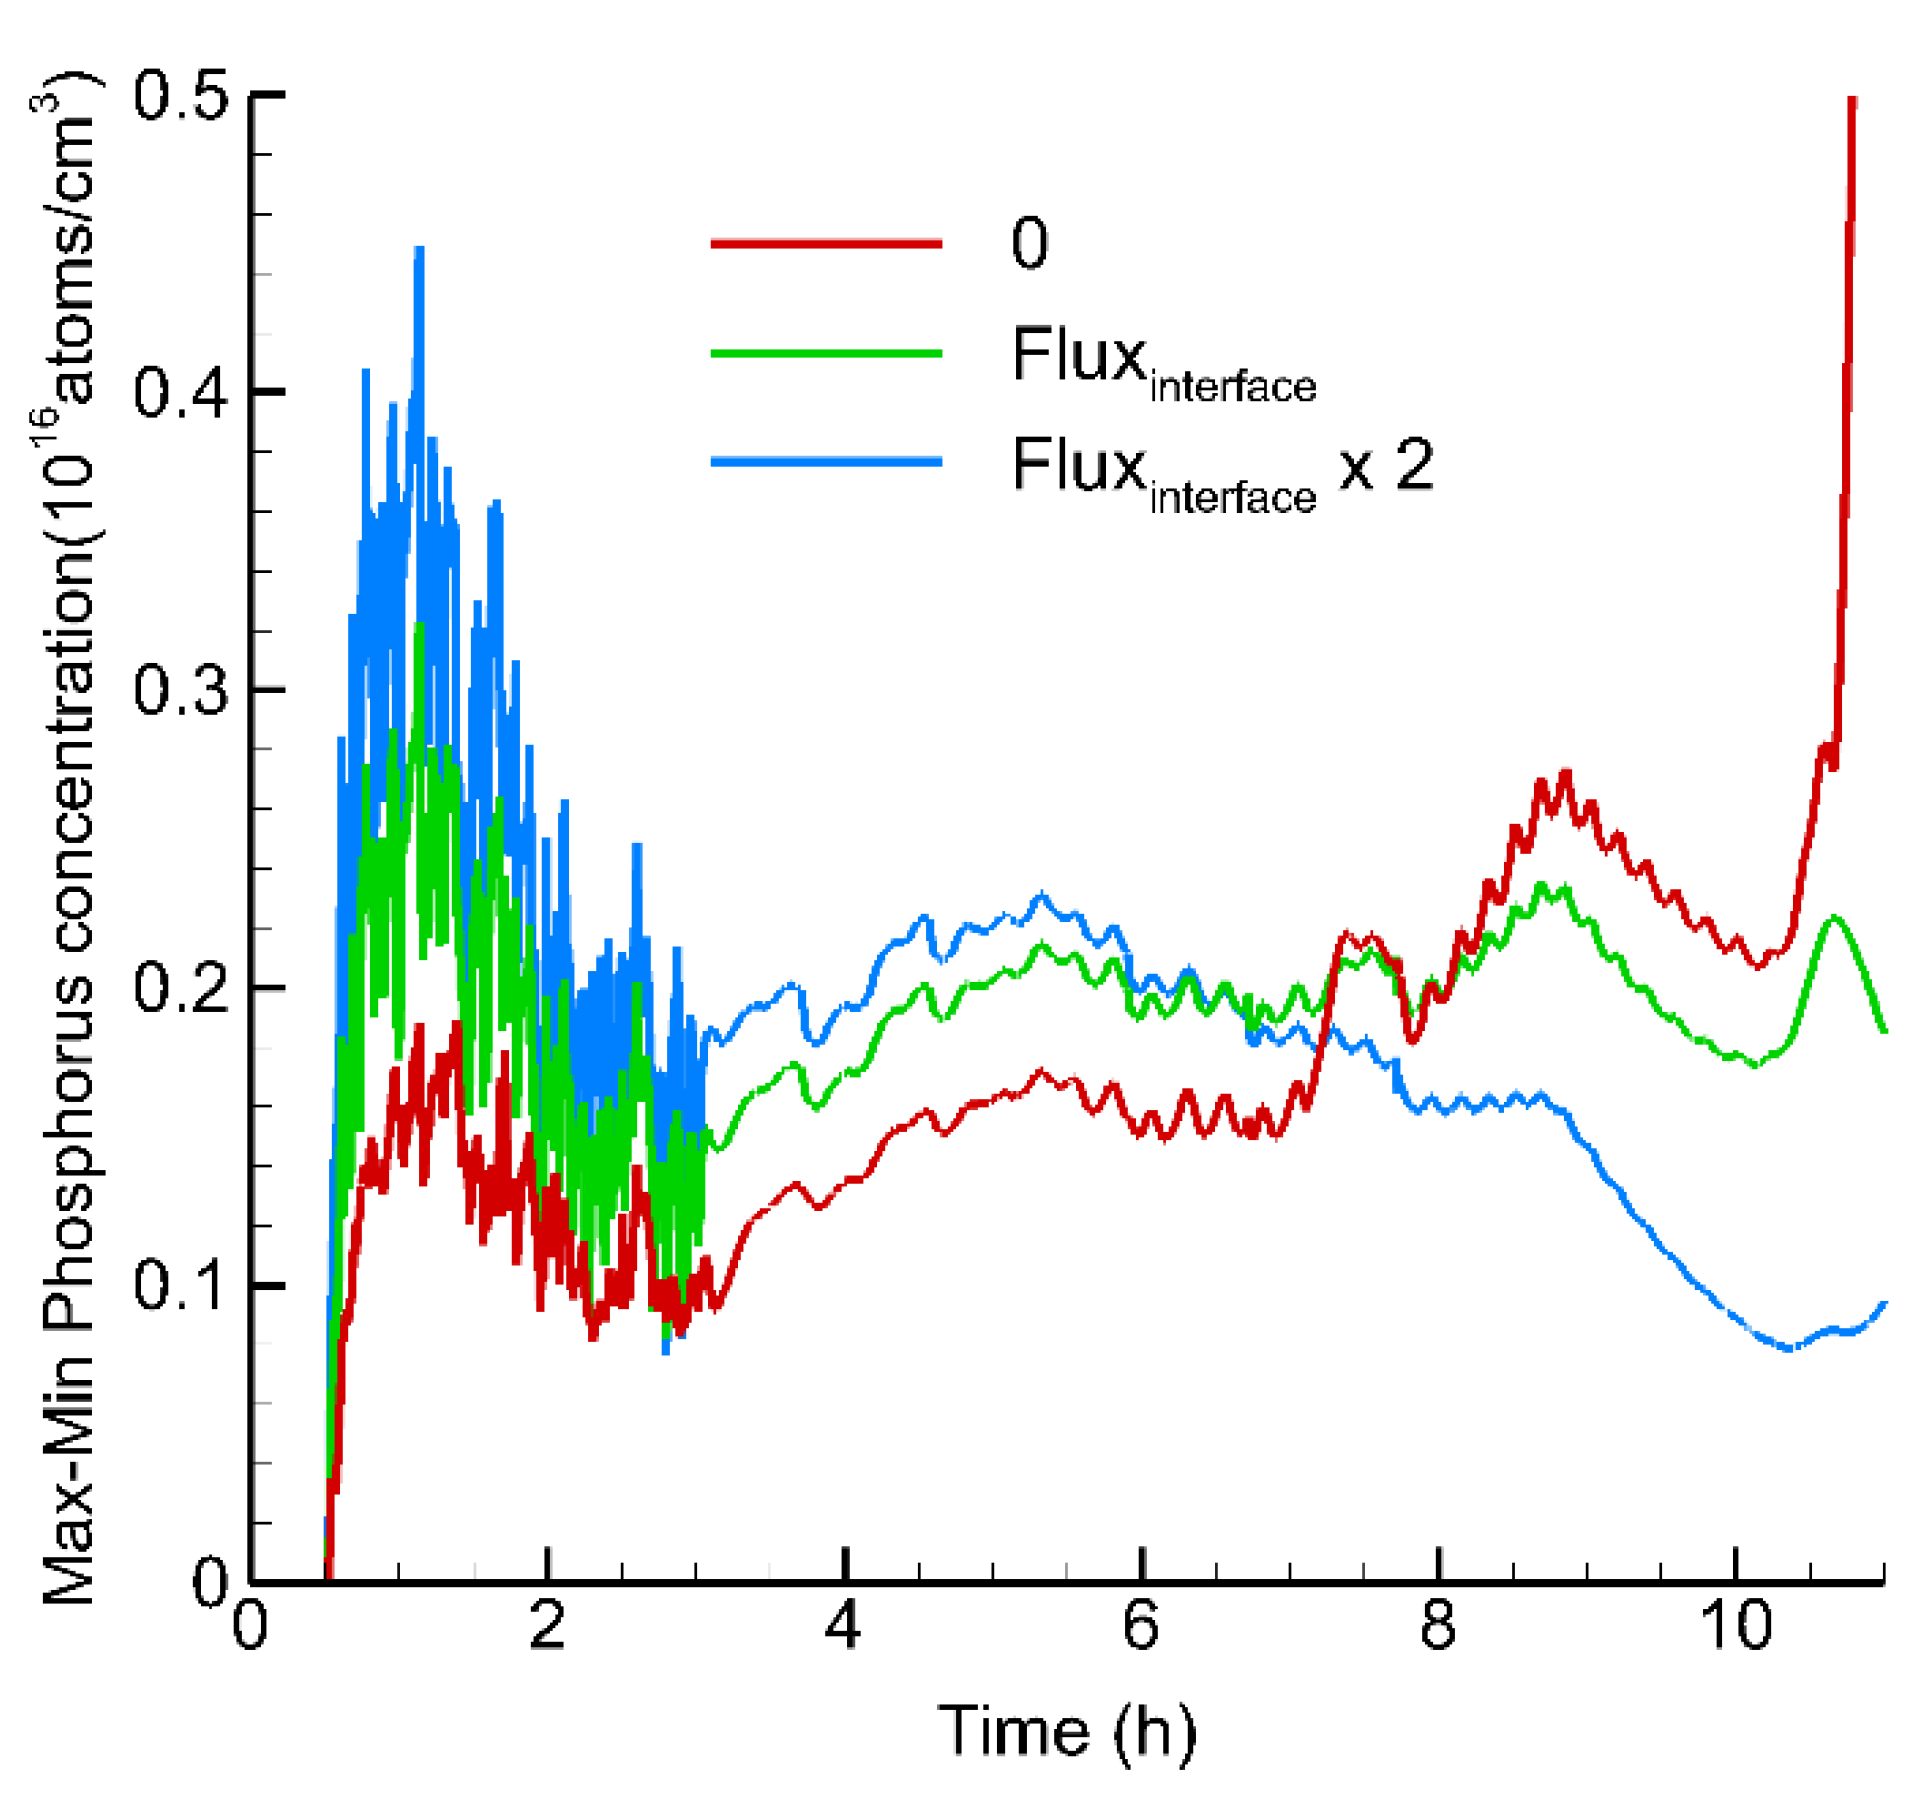
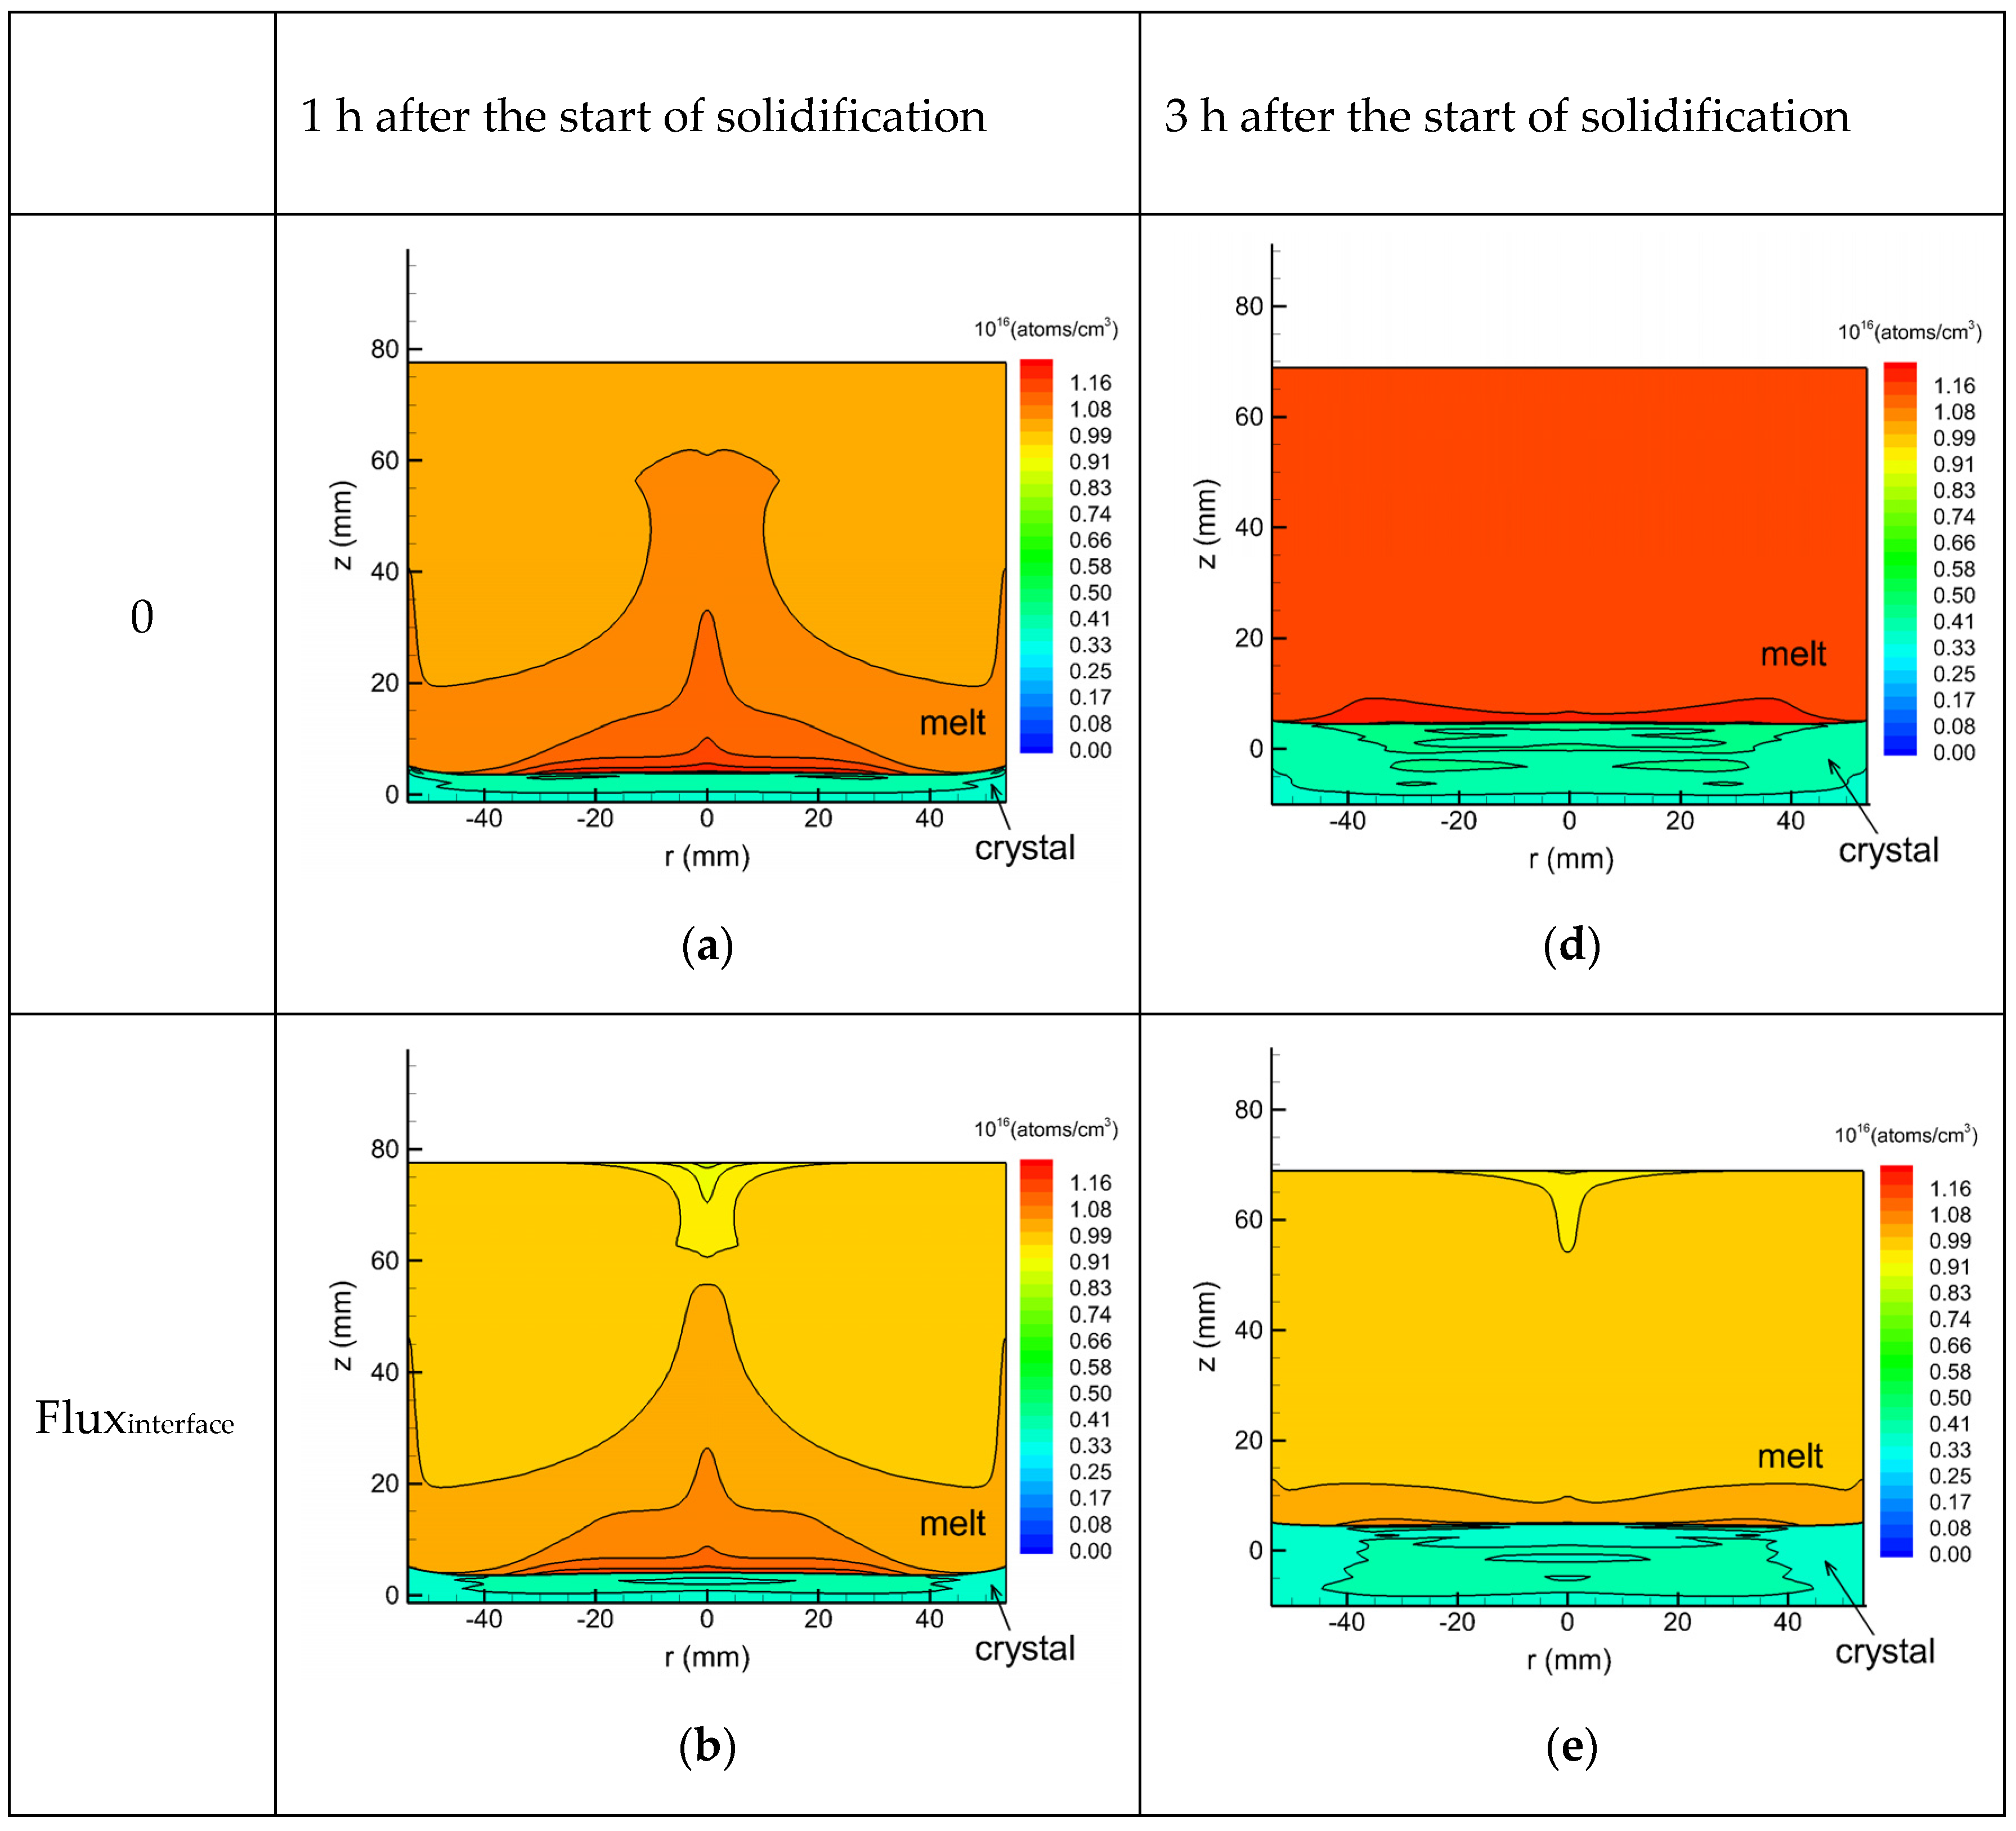
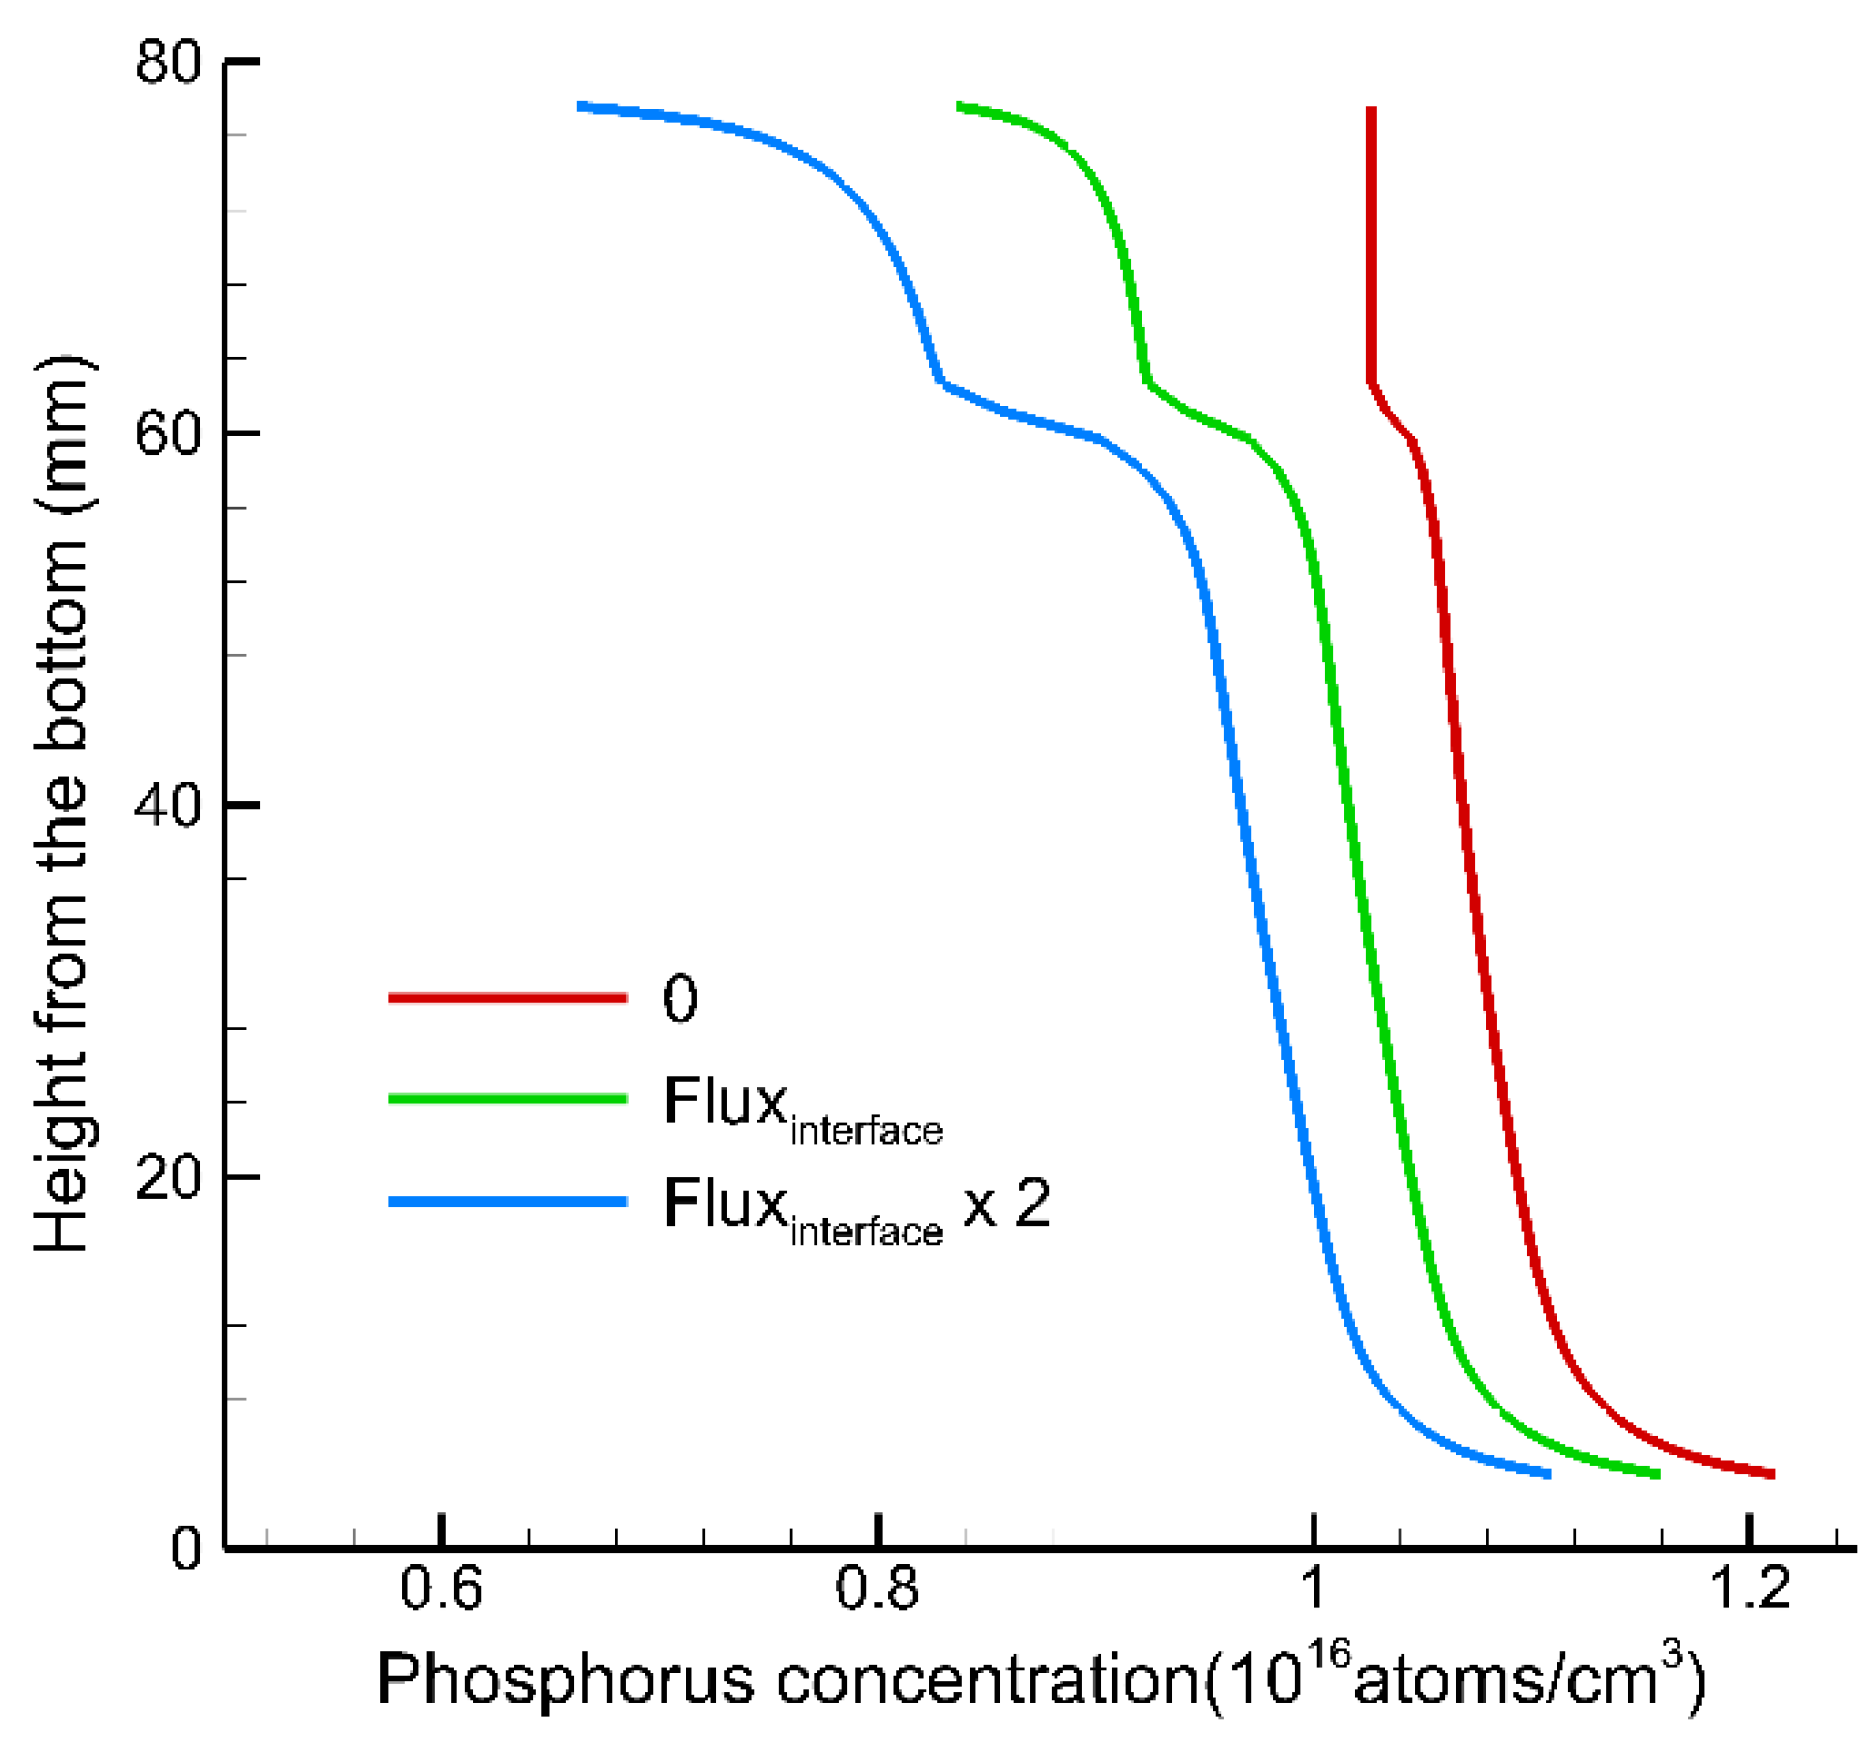
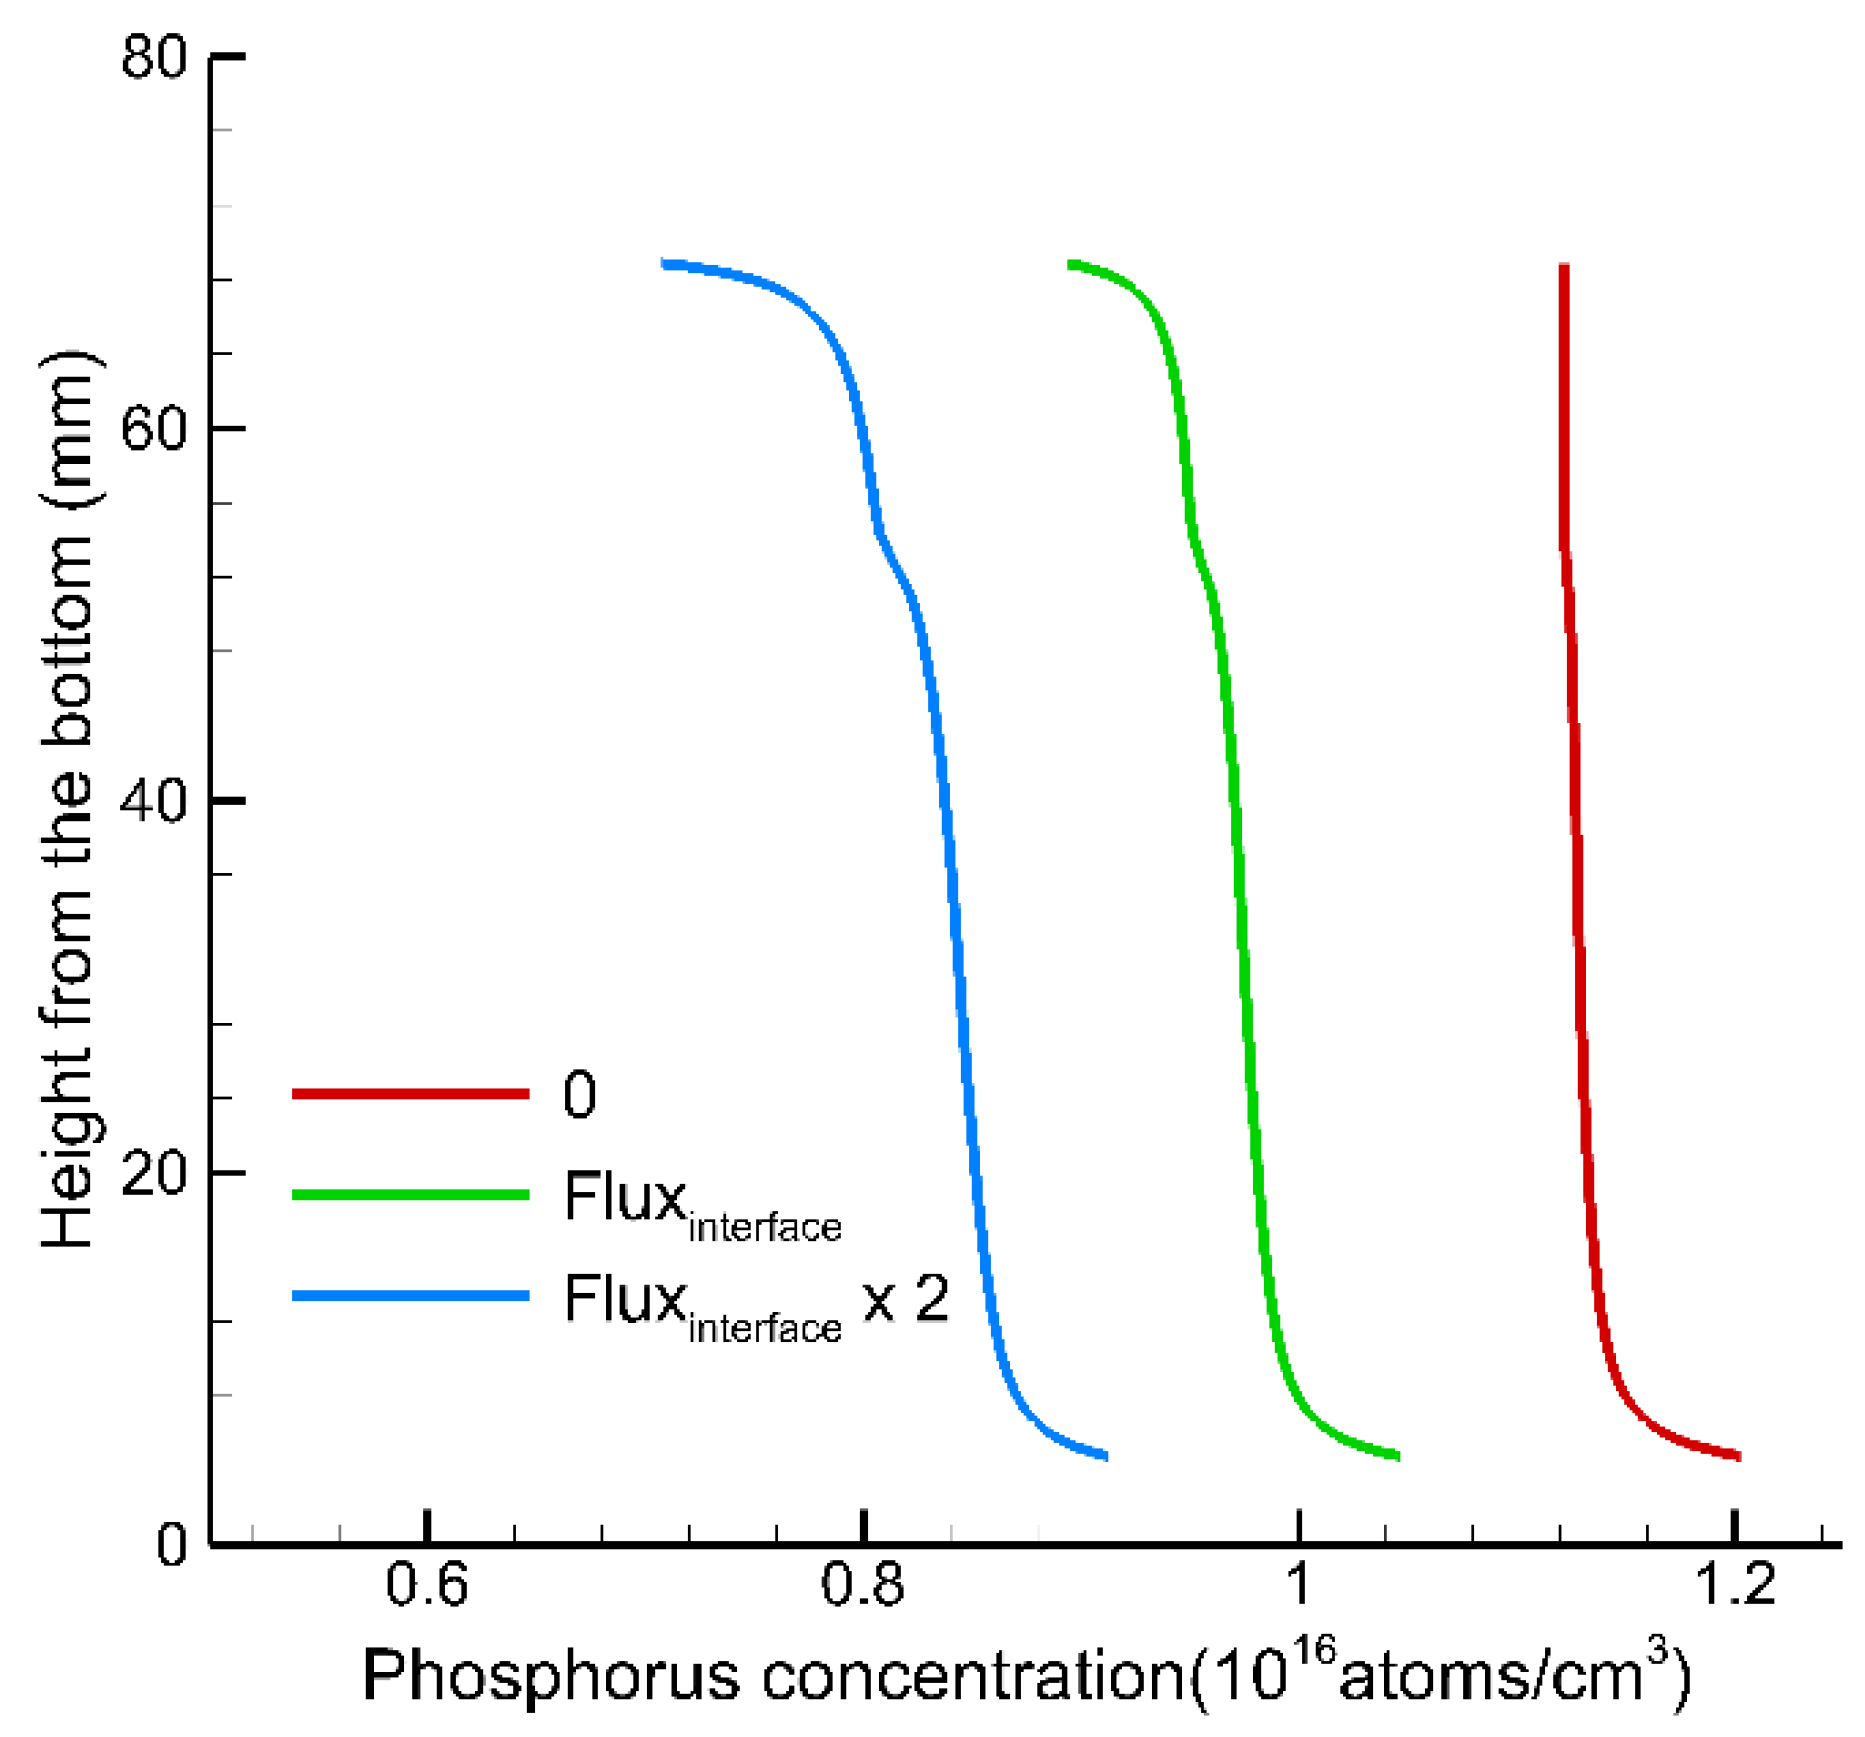
3. Results and Discussion

Figure 2 shows the temperature history in the center at the bottom of the crystal. Figure 3a–c show the temperature distribution and flow field in the melt and crystal with fraction solidified of (a) 20%, (b) 50% and (c) 80%. Figure 4a–c show the distribution of phosphorus concentration in the crystal for different evaporation fluxes at the melt surface. The distribution of phosphorus concentration in the crystal for the case shown in Figure 4b was almost homogeneous. In the other two cases, inhomogeneous distribution was noticed. Figure 5a shows the phosphorus concentration distribution in the center of the crystal along the vertical direction with different evaporation fluxes at the melt surface. The distribution in case (i) was close to the normal freezing model because the phosphorus evaporation flux at the melt surface was zero. The distribution in case (iii) decreased as a function of the height from the bottom because phosphorus evaporation flux at the melt surface was larger than phosphorus incorporation flux at the melt–crystal interface. However, the distribution of phosphorus concentration in the center of the crystal along the vertical direction in case (ii) was almost homogeneous because the phosphorus evaporation flux at the melt surface was the same as the phosphorus incorporation flux at the melt–crystal interface. This meant that the incoming and outgoing phosphorus concentrations in the melt were the same even though the growth rate always changes during the solidification process. We also investigated antimony concentration distribution with different evaporation fluxes to confirm our simulation result even when the segregation coefficient is different. Figure 5b shows the antimony concentration distribution in the center of the crystal along the vertical direction with different evaporation fluxes at the melt surface. The segregation coefficient of antimony is 0.023 [16]. Tendency is similar as that of phosphorus.
Figure 6 shows the difference between the maximum and minimum phosphorus concentrations in the melt as a function of time; Figure 7 displays the history of the phosphorus evaporation flux at the melt surface as a function of time. At the beginning of the solidification time, the difference between the maximum and minimum phosphorus concentrations in the melt in case (i) was small because the phosphorus evaporation flux at the melt surface was zero. However, at the end of the solidification time, the difference between the maximum and minimum phosphorus concentrations in the melt in case (i) rapidly increased because of the effect of the small segregation coefficient of phosphorus. Therefore, the phosphorus concentration in the melt in case (i) substantially changes from the beginning to the end of the solidification time. Moreover, at the beginning of the solidification time, the difference between the maximum and minimum phosphorus concentrations in the melt in case (iii) was larger than that in the other two cases because of the large evaporation flux at the melt surface. However, at the end of the solidification time, the difference between the maximum and minimum phosphorus concentrations in the melt in case (iii) was smaller than that in the other two cases. The phosphorus evaporation flux at the melt surface was related to the growth rate and phosphorus concentration at the melt–crystal interface, as shown in Equation (6). In this case, the phosphorus concentration in the melt had a large effect on the behavior of the phosphorus evaporation flux at the melt surface in case (iii) because the growth rates in cases (ii) and (iii) were the same. The phosphorus concentration in the melt in case (iii) was lower at the end of the solidification time because the phosphorus had already evaporated considerably at the beginning. Therefore, the phosphorus concentration in the melt in case (iii) also changed substantially from the beginning to the end of the solidification time. In contrast, the difference between the maximum and minimum phosphorus concentrations in the melt in case (ii) remained almost constant throughout the solidification time. This caused the enhancement of the phosphorus evaporation at the beginning of the solidification time and almost kept the same phosphorus evaporation flux until the end of the solidification time, as shown in Figure 7. Therefore, we needed to maintain nearly the same phosphorus concentration in the melt during the whole solidification process to obtain a crystal with a homogeneous phosphorus concentration distribution along the vertical direction.
Figure 8a–c show the distribution of the phosphorus concentration in the melt with different evaporation fluxes at the melt surface one hour after the start of solidification. The difference of phosphorus concentration in the melt was large, as shown in Figure 6 and Figure 8a–c. The effect of the phosphorus evaporation flux at the melt surface on the phosphorus concentration at the melt–crystal interface was small because the melt volume was large, velocity of the melt convection was small, and solidification time was short. Figure 9 shows the distribution of the phosphorus concentration in the center of the melt along the vertical direction with different evaporation fluxes at the melt surface at one hour after the start of solidification. We could identify that there was a large difference in the phosphorus concentration at the melt surface because the phosphorous evaporation flux was very effective. However, the phosphorus concentration at the melt–crystal interface was close even though the evaporation flux at the melt surface was different because the phosphorous evaporation flux at the melt surface had little effect on the phosphorus concentration at the melt–crystal interface. Figure 8d–f show the phosphorus concentration distribution in the melt with different evaporation fluxes at the melt surface three hours after the start of solidification. In these three hours, the melt volume decreased and solidification time increased. Thus, the phosphorus concentration in the melt could have been more homogeneous, and the difference between the maximum and minimum phosphorus concentrations in the melt was small because the melt mixing was enhanced and the effect of the evaporation flux of phosphorus at the melt surface on the phosphorus concentration at the melt–crystal interface subsequent to three hours after the start of solidification was larger than that subsequent to one hour after the start of solidification. Figure 10 shows the distribution of the phosphorus concentration in the center of the melt along the vertical direction with different evaporation fluxes at the melt surface at three hours after the start of solidification. We can say that there was a considerable difference in the phosphorous concentration not only at the melt surface but also at the melt–crystal interface, and the phosphorous concentration in the melt subsequent to three hours after the start of solidification was more homogeneous than that subsequent to one hour after the start of solidification. Thus, the effect of phosphorus evaporation flux at the melt surface on the phosphorus concentration at the melt–crystal interface at the beginning of the solidification process is minor.

4. Conclusions

We investigated the relationship between the phosphorus concentration distribution in a silicon crystal and phosphorus evaporation flux at the melt surface during the DS process by numerical analysis. We focused on the incorporation flux of phosphorus at the melt–crystal interface and phosphorus evaporation flux at the melt surface. To realize a homogeneous phosphorus concentration distribution in the silicon crystal, we had to control the evaporation flux of phosphorous at the melt surface and maintain approximately the same phosphorus concentration in the melt during the entire solidification process and we had to consider the incoming and outgoing phosphorus concentrations in the melt, such as the phosphorus incorporation flux at the melt–crystal interface and evaporation flux of phosphorous at the melt surface during the solidification process even though the growth rate was always changing.

Author Contributions

Conceptualization, K.K.; methodology, S.N., X.-F.H. and X.L.; software, S.N.; writing—original draft preparation, S.N. All authors have read and agreed to the published version of the manuscript.

Funding

This research received no external funding.

Acknowledgments

This work was partly supported by the New Energy and Industrial Technology Development Organization (NEDO) under the Ministry of Economy, Trade and Industry (METI), Japan.

Conflicts of Interest

The authors declare no conflict of interest.

References

  1. Schindler, F.; Michl, B.; Krenckel, P.; Riepe, S.; Feldmann, F.; Benick, J.; Warta, W.; Schubert, M.C. Efficiency potential of p- and n-type high performance multi-crystalline silicon. Energy Procedia 2015, 77, 633–638. [Google Scholar] [CrossRef]
  2. Benick, J.; Richter, A.; Müller, R.; Hauser, H.; Feldmann, F.; Krenckel, P.; Riepe, S.; Schindler, F.; Schubert, M.C.; Hermle, M.; et al. High-efficiency n-type HP mc silicon solar cells. IEEE J. Photovolt. 2017, 7, 1171–1175. [Google Scholar] [CrossRef]
  3. Meemongkolkiat, V.; Nakayashiki, K.; Rohatgi, A.; Crabtree, G.; Nickerson, J.; Jester, T.L. Resistivity and lifetime variation along commercially grown Ga- and B-Doped Czochralski Si ingots and its effect on light-induced degradation and performance of solar cells. Prog. Photovolt. Res. Appl. 2006, 14, 125. [Google Scholar] [CrossRef]
  4. Richter, A.; Benick, J.; Feldmann, F.; Fell, A.; Hermle, M. n-Type Si solar cells with passivating electron contact: Identifying sources for efficiency limitations by wafer thickness and resistivity variation. Sol. Energy Mater. Sol. Cells 2017, 173, 96–105. [Google Scholar] [CrossRef]
  5. Rehman, A.U.; Lee, S.H. Advancements in n-type base crystalline silicon solar cells and their emergence in the photovoltaic industry. Sci. World J. 2013, 2013, 1–13. [Google Scholar] [CrossRef] [PubMed]
  6. Solanki, C.S. Solar Photovoltaics: Fundamentals, Technologies and Application, 3rd ed.; PHI Learning Pvt. Ltd.: New Delhi, India, 2015. [Google Scholar]
  7. Lee, K.H. Axial Distribution of Gallium in Silicon Crystals for Photovoltaic Applications. Jpn. J. Appl. Phys. 2007, 46, 2831. [Google Scholar] [CrossRef]
  8. Wang, J.H.; Im, J.I. Resistivity distribution in bulk growth of silicon single crystals. Jpn. J. Appl. Phys. 2004, 43, 4079. [Google Scholar] [CrossRef]
  9. Forster, M.; Dehestru, B.; Thomas, A.; Fourmond, E.; Einhaus, R.; Cuevas, A.; Lemiti, M. Compensation engineering for uniform n-type silicon ingots. Sol. Energy Mater. Sol. Cells 2013, 111, 146–152. [Google Scholar] [CrossRef]
  10. Buchovska, I.; Dropka, N.; Kayser, S.; Kiessling, F.M. The influence of travelling magnetic field on phosphorus distribution in n-type multi-crystalline silicon. J. Cryst. Growth 2019, 507, 299–306. [Google Scholar] [CrossRef]
  11. Dupret, F.; Nicodeme, P.; Ryclmans, Y.; Wouters, P.; Crochet, M.J. Global modelling of heat transfer in crystal growth furnaces. Int. J. Heat Mass Transf. 1990, 33, 1849. [Google Scholar] [CrossRef]
  12. Liu, L.J.; Nakano, S.; Kakimoto, K. Dynamic simulation of temperature and iron distributions in a casting process for crystalline silicon solar cells with a global model. J. Cryst. Growth 2006, 292, 515. [Google Scholar] [CrossRef]
  13. Kakimoto, K.; Liu, L.J.; Nakano, S. Analysis of temperature and impurity distributions in a unidirectional-solidification process for multi-crystalline silicon of solar cells by a global model. Mater. Sci. Eng. B 2006, 134, 269. [Google Scholar] [CrossRef]
  14. Liu, L.; Nakano, S.; Kakimoto, K. Investigation of oxygen distribution in electromagnetic CZ-Si melts with a transverse magnetic field using 3D global modeling. J. Cryst. Growth 2007, 299, 48. [Google Scholar] [CrossRef]
  15. Togawa, S.; Huang, X.; Izunome, K.; Terashima, K.; Kimura, S. Oxygen transport analysis in Czochralski silicon melt by considering the oxygen evaporation from the melt surface. J. Crystal Growth 1995, 148, 70. [Google Scholar] [CrossRef]
  16. Zulehner, W.; Huber, D. Crystals-Growth, Properties and Applications; Grabmaier, J., Ed.; Springer: Berlin/Heidelberg, Germany, 1988; Volume 8, p. 1. [Google Scholar]
Figure 1. (a) Schematic configuration of the directional solidification furnace: melt (1), crystal (2), quartz crucible (3), carbon crucible (4), pedestals (5, 6), heat shields (7–11), heaters (12–15), and (b) a local view of the computational grid in the melt–crystal domain.
Crystals 11 00027 g001
Figure 2. The temperature history in the center at the bottom of the crystal.
Crystals 11 00027 g002
Figure 3. Temperature distribution and flow field in the melt and crystal with a solidified fraction of (a) 20%, (b) 50% and (c) 80%.
Crystals 11 00027 g003aCrystals 11 00027 g003b
Figure 4. Distribution of phosphorus concentration in the crystal. The phosphorus evaporation flux at the melt surface was (i) 0 (a), (ii) the same as the phosphorus incorporation flux at the melt–crystal interface (b), and (iii) twice as large as that of case (ii) (c).
Crystals 11 00027 g004
Figure 5. Distribution of the (a) phosphorus and (b) antimony concentration in the center of the crystal along the vertical direction with different evaporation fluxes at the melt surface. The evaporation flux at the melt surface was (i) 0, (ii) the same as the incorporation flux at the melt–crystal interface, and (iii) twice as large as that of case (ii).
Crystals 11 00027 g005
Figure 6. The difference between the maximum and minimum phosphorus concentrations in the melt as a function of time. The phosphorus evaporation flux at the melt surface was (i) 0, (ii) the same as the phosphorus incorporation flux at the melt–crystal interface, and (iii) twice as large as that of case (ii).
Crystals 11 00027 g006
Figure 7. History of the phosphorus evaporation flux at the melt surface as a function of time. The phosphorus evaporation flux at the melt surface was (i) 0, (ii) the same as the phosphorus incorporation flux at the melt–crystal interface, and (iii) twice as large as that of case (ii).
Crystals 11 00027 g007
Figure 8. Distribution of the phosphorus concentration in the melt with different evaporation fluxes at the melt surface after one hour and three hours of solidification. The phosphorous evaporation flux at the melt surface was (i) 0 (a,d), (ii) the same as the phosphorus incorporation flux at the melt–crystal interface (b,e), and (iii) twice as large as that of case (ii) (c,f).
Crystals 11 00027 g008aCrystals 11 00027 g008b
Figure 9. Distribution of the phosphorus concentration in the center of the melt along the vertical direction with different evaporation fluxes at the melt surface one hour after the start of solidification. The phosphorus evaporation flux at the melt surface was (i) 0, (ii) the same as the phosphorus incorporation flux at the melt–crystal interface, and (iii) twice as large as that of case (ii).
Crystals 11 00027 g009
Figure 10. Distribution of the phosphorus concentration in the center of the melt along the vertical direction with different evaporation fluxes at the melt surface three hours after the start of solidification. The phosphorus evaporation flux at the melt surface was (i) 0, (ii) the same as the phosphorus incorporation flux at the melt–crystal interface, and (iii) twice as large as that of case (ii).
Crystals 11 00027 g010
Publisher’s Note: MDPI stays neutral with regard to jurisdictional claims in published maps and institutional affiliations.

