Article

Tensile Creep Behavior of Single-Crystal High-Entropy Superalloy at Intermediate Temperature

1
Department of Nanoscience and Nanoengineering, Waseda University, 3-4-1 Okubo, Shinjuku, Tokyo 169-8555, Japan
2
Research Center for Structural Materials, National Institute for Materials Science, 1-2-1 Sengen, Tsukuba 305-0047, Japan
3
Superalloys and High Temperature Materials Group, Research Center for Structural Materials, National Institute for Materials Science, 1-2-1 Sengen, Tsukuba 305-0047, Japan
4
Department of Materials Science, Waseda University, 3-4-1 Okubo, Shinjuku, Tokyo 169-8555, Japan
5
Department of Materials Science and Engineering, National Tsing Hua University, 101, Sec.2, Kuang-Fu Road, Hsinchu 30013, Taiwan
*
Author to whom correspondence should be addressed.
Crystals 2021, 11(1), 28; https://doi.org/10.3390/cryst11010028
Submission received: 12 November 2020 / Revised: 26 December 2020 / Accepted: 28 December 2020 / Published: 30 December 2020

Abstract

:
In this study, we investigated the creep deformation mechanism of a single-crystal high-entropy superalloy (HESA) with the spherical γ′ precipitates at 760 °C. Before the creep tests, long-term aging tests at 760 °C without load were conducted, which showed Ostwald ripening of the secondary γ′ precipitates up to 50 h. The creep tests revealed that in the range of 500 and 600 MPa at 760 °C, the creep deformation mechanism of HESA was independent of applied stress in both the primary and secondary creep regions. The deformation mechanism of HESA was further investigated under the condition of 760 °C and 520 MPa by performing creep interrupted tests and microstructural analysis. Scanning electron microscope observation showed elongated γ′ precipitates along the applied stress axis near the ruptured surface. This could have been caused by the multi-slip around <100> preceded by the lattice rotation into <100> along the tensile axis, which was confirmed by the electron backscatter diffraction analysis. Transmission electron microscope observation of the creep interrupted and ruptured specimens showed bypass and climb motion of dislocations in the 2-h interrupted, shearing of the γ′ precipitates by the paired straight dislocations in the 50-h interrupted, and shearing of the γ′ precipitates by both the straight and the curved paired dislocations in the ruptured specimens, respectively. The secondary γ′ precipitates do not affect creep behavior as long as the deformation mechanism is a bypass and climb motion of dislocations.

1. Introduction

The novel alloy design concept of “high-entropy” alloys (HEAs) offers the composition space of a single phase for alloy developments [1,2]. Furthermore, HEAs with a single phase of face-centered cubic (FCC) structure have been reported to show excellent mechanical properties at cryogenic temperatures among the other alloys with a single phase of FCC structure [3,4,5]. To explain the deformation mechanism realizing the superior mechanical properties, many experiments and simulations have been reported. However, alloys with FCC single phase have not shown sufficient mechanical properties for actual use at higher temperatures [6]. To enhance mechanical properties at higher temperatures, the concept of high-entropy superalloys (HESAs) has been proposed from the composition space of HEAs [7]. The microstructure of HESAs consists of γ′ precipitates with an L12 structure and the γ matrix with an FCC structure. This microstructure is identical to that of Ni-based superalloys practically used for turbine materials at higher temperatures.
A creep property is one of the most important mechanical properties for components used especially at higher temperatures such as in turbine engines. However, only few results with regard to creep properties of HESAs have been reported [8]. Furthermore, the dominant deformation mechanism of HESAs in the creep test has not been examined so far. Therefore, the deformation mechanism of HESAs needs to be understood.
This research focuses on recently developed HESA [8]. HESA has an approximately 70 % volume fraction of the γ′ precipitates, which could make it a candidate for such materials as turbine blades [9,10]. The previous research on microstructural characterizations of HESA by heat treatment conditions revealed that the primary γ′ precipitates grow rapidly and change in their shape from the original microstructure over 870 °C [11]. To evaluate the mechanical properties without a large degree of coarsening, a creep condition at 760 °C was selected. Moreover, in the region of intermediate temperatures such as 760 °C, there are many previous studies on creep deformation kinetics of Ni-based single-crystal superalloys. For instance, Leverant and Kear investigated the deformation mechanism of Mar-M200 at 760 °C and 690 MPa [12], Mackay and Maier showed the orientation dependence of Mar-M247 at 774 °C and 724 MPa [13], Link and Feller-Kniepmeier proposed the γ′ shear mechanisms in SRR99 at 760 °C and 780 MPa [14], and Rae and Read systematically investigated the primary creep deformation of CMSX-4 at 750 °C and from 450 to 750 MPa [15]. Therefore, the results of this research could be compared with the previous studies on Ni-based superalloys.
Conventional Ni-based single-crystal superalloys for a turbine blade usually exhibit larger strain depending on crystal orientation at the primary creep under sufficient applied stress such as 750 MPa around 760 °C [15]. This is because shearing of the γ′ precipitates by propagation of a dislocation ribbon consisting of superlattice intrinsic stacking fault (SISF), anti-phase boundary (APB), and superlattice extrinsic stacking fault (SESF) becomes easier with the assist of reordering atoms [16] at specified crystal orientation and above critical applied stress [15]. It is of interest to compare the operative deformation mechanism of conventional Ni-based superalloys and HESA.
This study examines the detailed deformation mechanism of HESA with random distributed spherical γ′ precipitates during creep at the intermediate temperature, 760 °C.

2. Materials and Methods

2.1. Single-Crystal Casting

Single crystal bars of HESA with a diameter of 11 mm and a longitudinal length of 140 mm were obtained using a directional solidification furnace. Mixed pellets of pure raw materials with a total weight of 2 kg were melted in an Al2O3 crucible by high-frequency induction heating. The molten metal was poured into a mold with 8 cylindrical rods with a grain selector of a pigtail type on the copper cold plate. The mold was pulled into a cooling zone at a rate of 150 mm/h.
The nominal composition of HESA in this study is 48.0Ni-16.9Co7.5Cr-8.9Fe-0.9Mo-0.5W-5.8Ti-10.3Al-1.2Nb (at. %) [8]. The composition of the alloy after casting was confirmed to be almost the same as the nominal composition by inductivity coupled plasma–optical emission spectrometry (ICP-OES) [11]. The crystal orientations of the single-crystal bars were then measured by the X-ray back Laue method using the X-ray generator (SA-HF3, Rigaku Co., Tokyo, Japan) with a tungsten target. The crystal orientations of the bars are plotted in Figure 1.

2.2. Heat Treatment

All the heat treatments for creep specimens were performed in an electric furnace (MSFT-1520-P, NIKKATO Co., Osaka, Japan). The heat treatment condition is shown in Table 1. Before the heat treatment, each single crystal bar was put into a quartz glass tube filled with argon gas to prevent oxidation during the heat treatment. The argon gas pressure was set to reach 1 atmospheric pressure when the sample was heated to the maximum temperature during the solution treatment.
Moreover, to examine microstructural evolution during creep, long-term aging tests at the same temperature as in creep, 760 °C, were performed for the fully heat-treated samples, as shown in Table 1. The heat treatment history during the long-term aging test was also the same as that in the creep tests, which consists of the heating stage from room temperature to 760 °C for 5 h and the aging stage at 760 °C, which simulated the thermal history of creep tested samples as described later. The aging times were 0.5, 2.5, 10.5, 20, 50, 100, 200, and 500 h. Note that in the creep test, the sample temperature was kept at the testing temperature for 0.5 h before the loading. Therefore, the difference in microstructural changes with or without loads can be investigated by comparing, for instance, the 2.5-h aged sample and the 2-h creep interrupted samples.

2.3. Creep Tests

The specimens for the creep tests were fabricated based on JIS Z 2271:2010 from single-crystal bars preceded by the heat treatment shown in Table 1. In the specimen, the length of the gauge and the diameter of the gauge are 22 mm and 4 mm, respectively. Using these specimens, tensile creep tests were performed at 760 °C in air atmosphere under controlled load. The strain during creep was measured using the extensometer with a dial gauge. The heat treatment history before loading consisted of the heating stage from room temperature to 760 °C for 5 h, then being kept at 760 °C for 0.5 h. Table 2 summarizes the crystal orientation of specimens and the creep conditions.

2.4. Microstructural Observation

The microstructure of the samples was observed using a field emission type scanning electron microscope (FE-SEM, JSM-7200, JEOL Ltd., Tokyo, Japan). The secondary electron images were displayed in this study. Moreover, the lattice rotation behavior of the creep specimens was measured using an electron backscatter diffraction (EBSD) detector attached to the FE-SEM. The accelerated voltage for the FE-SEM and EBSD analysis was 20 kV. For both analyses, samples embedded in phenolic resin were mechanically polished using SiC paper of grits 320, 400, 600, and 800 followed by 3 μm diamond slurry and 0.02 μm colloidal silica. The mechanically polished samples were then subjected to electrochemical polishing using 20 % phosphoric acid solution at a condition of 2.5 V only for the observation of the microstructure in secondary electron images using the FE-SEM.
Specimens after creep tests were also observed using a transmission electron microscope (TEM, JEM-2010F, JEOL Ltd., Tokyo, Japan) at a voltage of 200 kV to observe dislocation characteristics. A TEM foil was prepared by an electrochemical polishing method using a twin-jet apparatus (Model 110, Fischione Instruments Inc., Pennsylvania, PA, USA) with a digital power controller (Model 140, E.A. Fischione Instruments Inc., Pennsylvania, PA, USA) after mechanical polishing using SiC paper of grits 400, 600, and 1200 achieving approximately 50-μm thickness. The solution used in the electrochemical polishing consisted of 90% ethanol and 10% perchloric acid. The electrochemical polishing was performed with the solution temperature of approximately −30 °C and the applied voltage of 30 V.

3. Results and Discussion

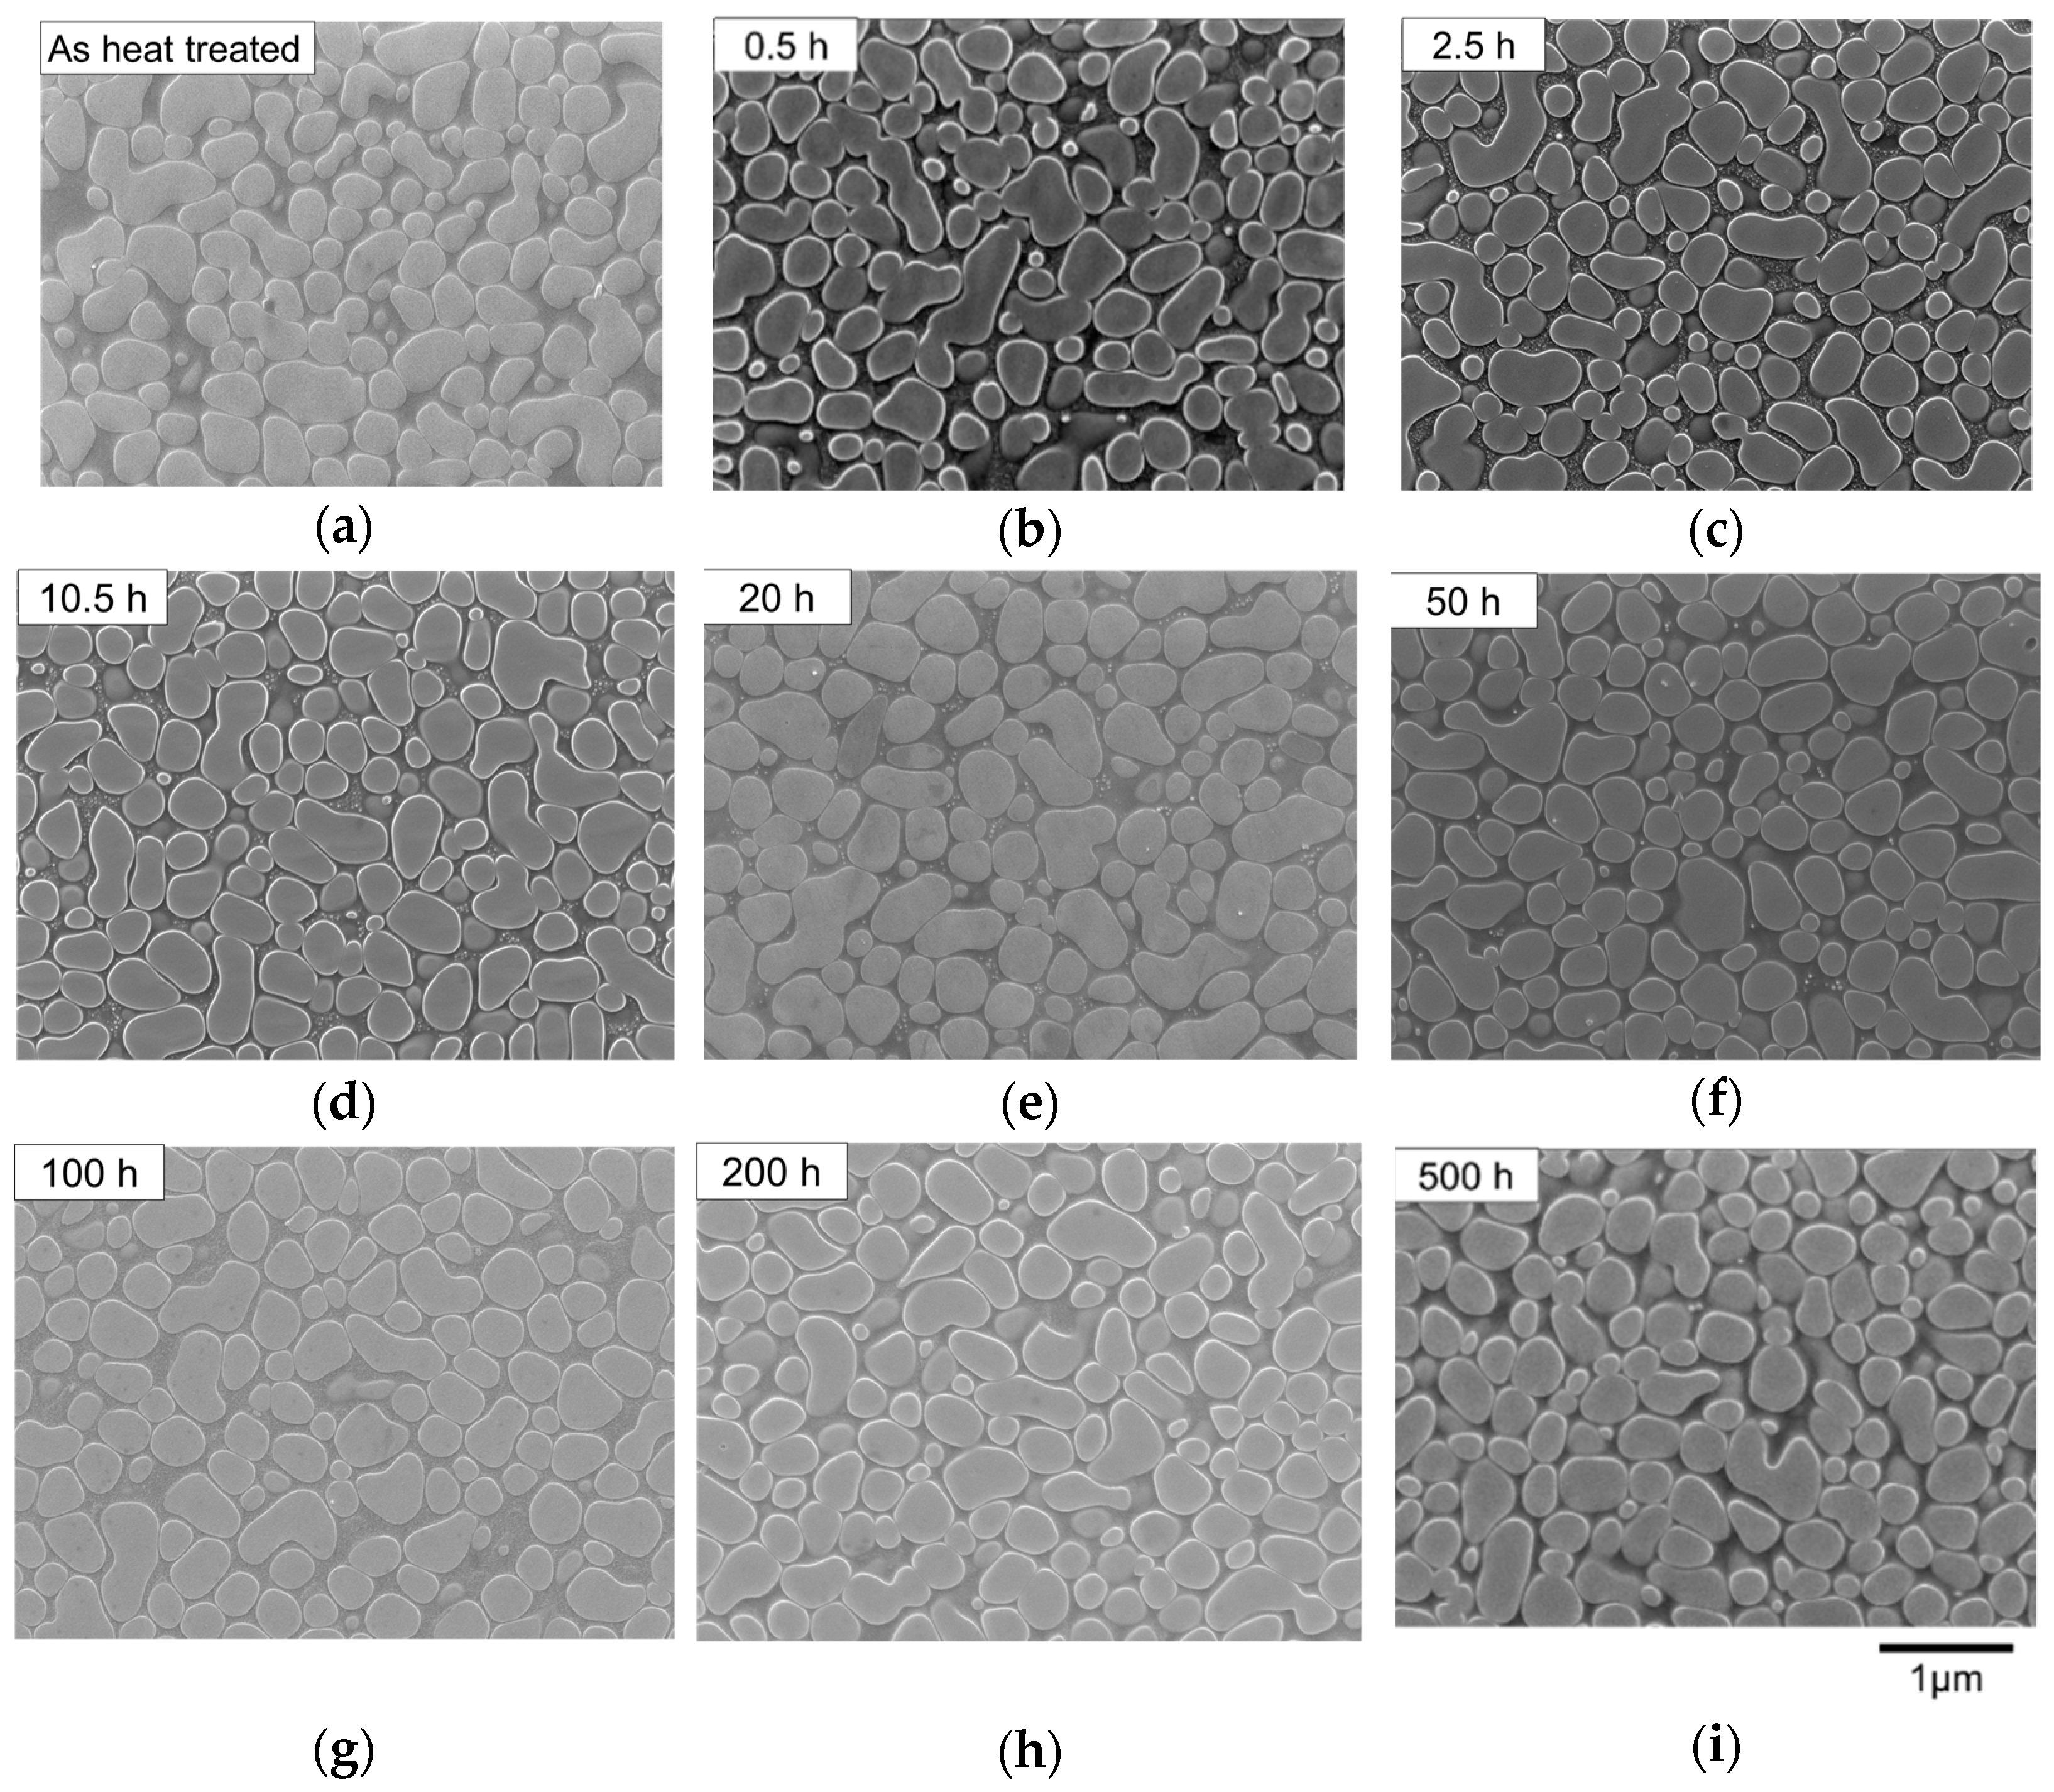
3.1. Long-Term Aging Test

Figure 2 shows the microstructural evolution caused by the long-term aging at 760 °C, and Figure 3 shows their magnified images, respectively. In Figure 2, the morphology of the primary γ′ precipitates shows no significant change, whereas at higher magnitude, coarsening of the secondary γ′ precipitates was observed from 0.5 to 50 h of aging time in Figure 3b–f, then the coarsened secondary γ′ precipitates disappeared by 100 h of aging as shown in Figure 3g indicative of Ostwald ripening. After the disappearance of the coarsened secondary γ′ precipitates, much finer secondary γ′ precipitates with uniform distribution were discerned in Figure 3g–h indicating that these secondary γ′ precipitates form during cooling from the aging treatment at 760 °C.
To summarize these observations, the secondary γ′ precipitates should disappear between an aging time of 50 and 100 h at 760 °C due to Ostwald ripening. This Ostwald ripening in the secondary γ′ precipitates should be active in the creep tests. Furthermore, the disappearance of the secondary γ′ precipitates could affect the creep deformation behavior. The effect of the secondary γ′ precipitates on creep behavior will be explained in Section 3.2.5.

3.2. Creep Properties
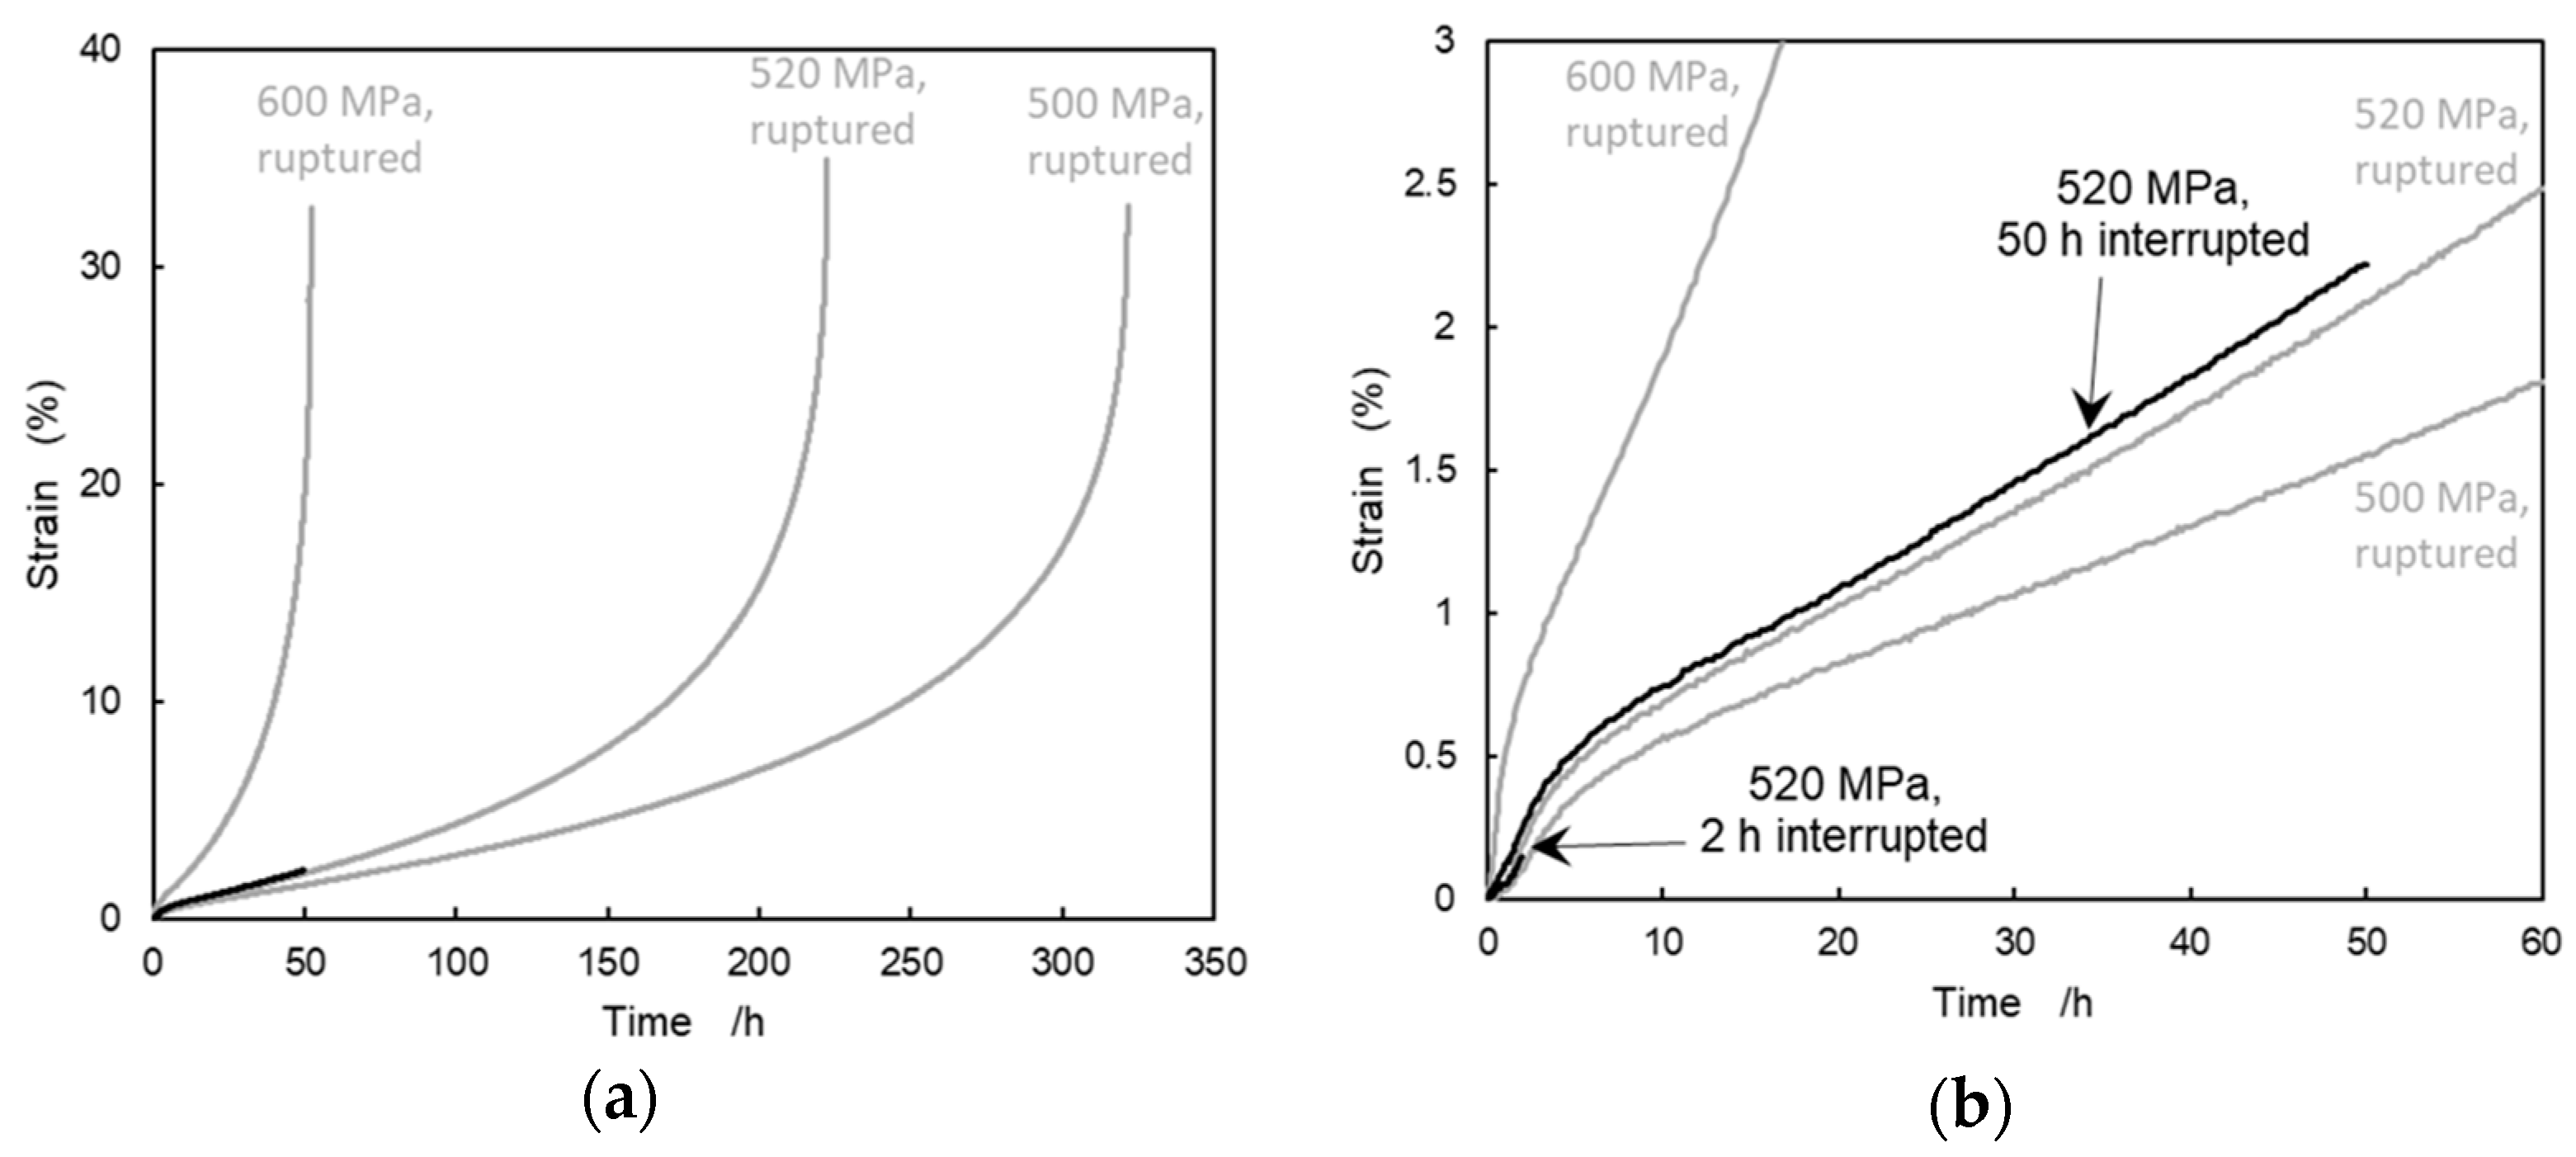
3.2.1. Creep Curves

Creep rupture tests were performed at 760 °C with 500, 520, and 600 MPa of applied tensile stresses to investigate the effect of the applied stress on the deformation mechanism. Figure 4 shows creep curves for these conditions. The creep rupture life decreases as the applied stress increases in the range of 500 to 600 MPa. To assume a difference in deformation mechanism, Norton’s equation was used in the primary and the secondary creep regions, respectively [17]. Norton’s equation is shown in Equation (1),
ε ˙ = K σ n
where ε ˙ (/h) stands for the strain rate during creep, K (/h(MPa)n) stands for the constant value, and σ (MPa) stands for the applied stress level, n represents stress exponents obtained from several creep data to estimate the deformation mechanism, respectively. To estimate strain rates from creep curves at different stress levels, fitting equations of creep curves were used [18]. The maximum strain rates were used for evaluating the primary creep, whereas the minimum strain rates were used for evaluating the secondary creep, to obtain n values, respectively. Figure 5 depicts the strain and strain rate relationship in the primary creep region and secondary creep region, respectively, showing the maximum strain rate in the primary creep and the minimum strain rate in the secondary creep region. Figure 6 summarizes the stress and strain rate relationship. The plots for both the strain rates follow the straight lines, respectively. This indicates that dominant deformation mechanism in the primary creep is similar within the stress range from 500 to 600 MPa. Furthermore, the dominant deformation mechanism in the secondary creep is also similar in the stress range. This result suggests that to understand the creep deformation mechanism under the stress condition ranging from 500 to 600 MPa, only the creep condition within the stress range is sufficient. Examining one condition of creep at 760 °C between 500 and 600 MPa of applied stress could represent the deformation mechanisms of the creep at 760 °C between 500 and 600 MPa applied stress levels at both the primary and the secondary creep regions, respectively.
Therefore, we focused on the creep condition under 520 MPa of the applied stress at 760 °C in order to further investigate the deformation mechanism. We also conducted creep interrupted tests at 2 h, showing the maximum strain rate in the primary creep, and at 50 h, showing the minimum strain rate in the secondary creep, respectively. Creep curves for these interrupted tests are almost identical to that of the ruptured creep curve obtained by the same applied stress as shown in Figure 4b.

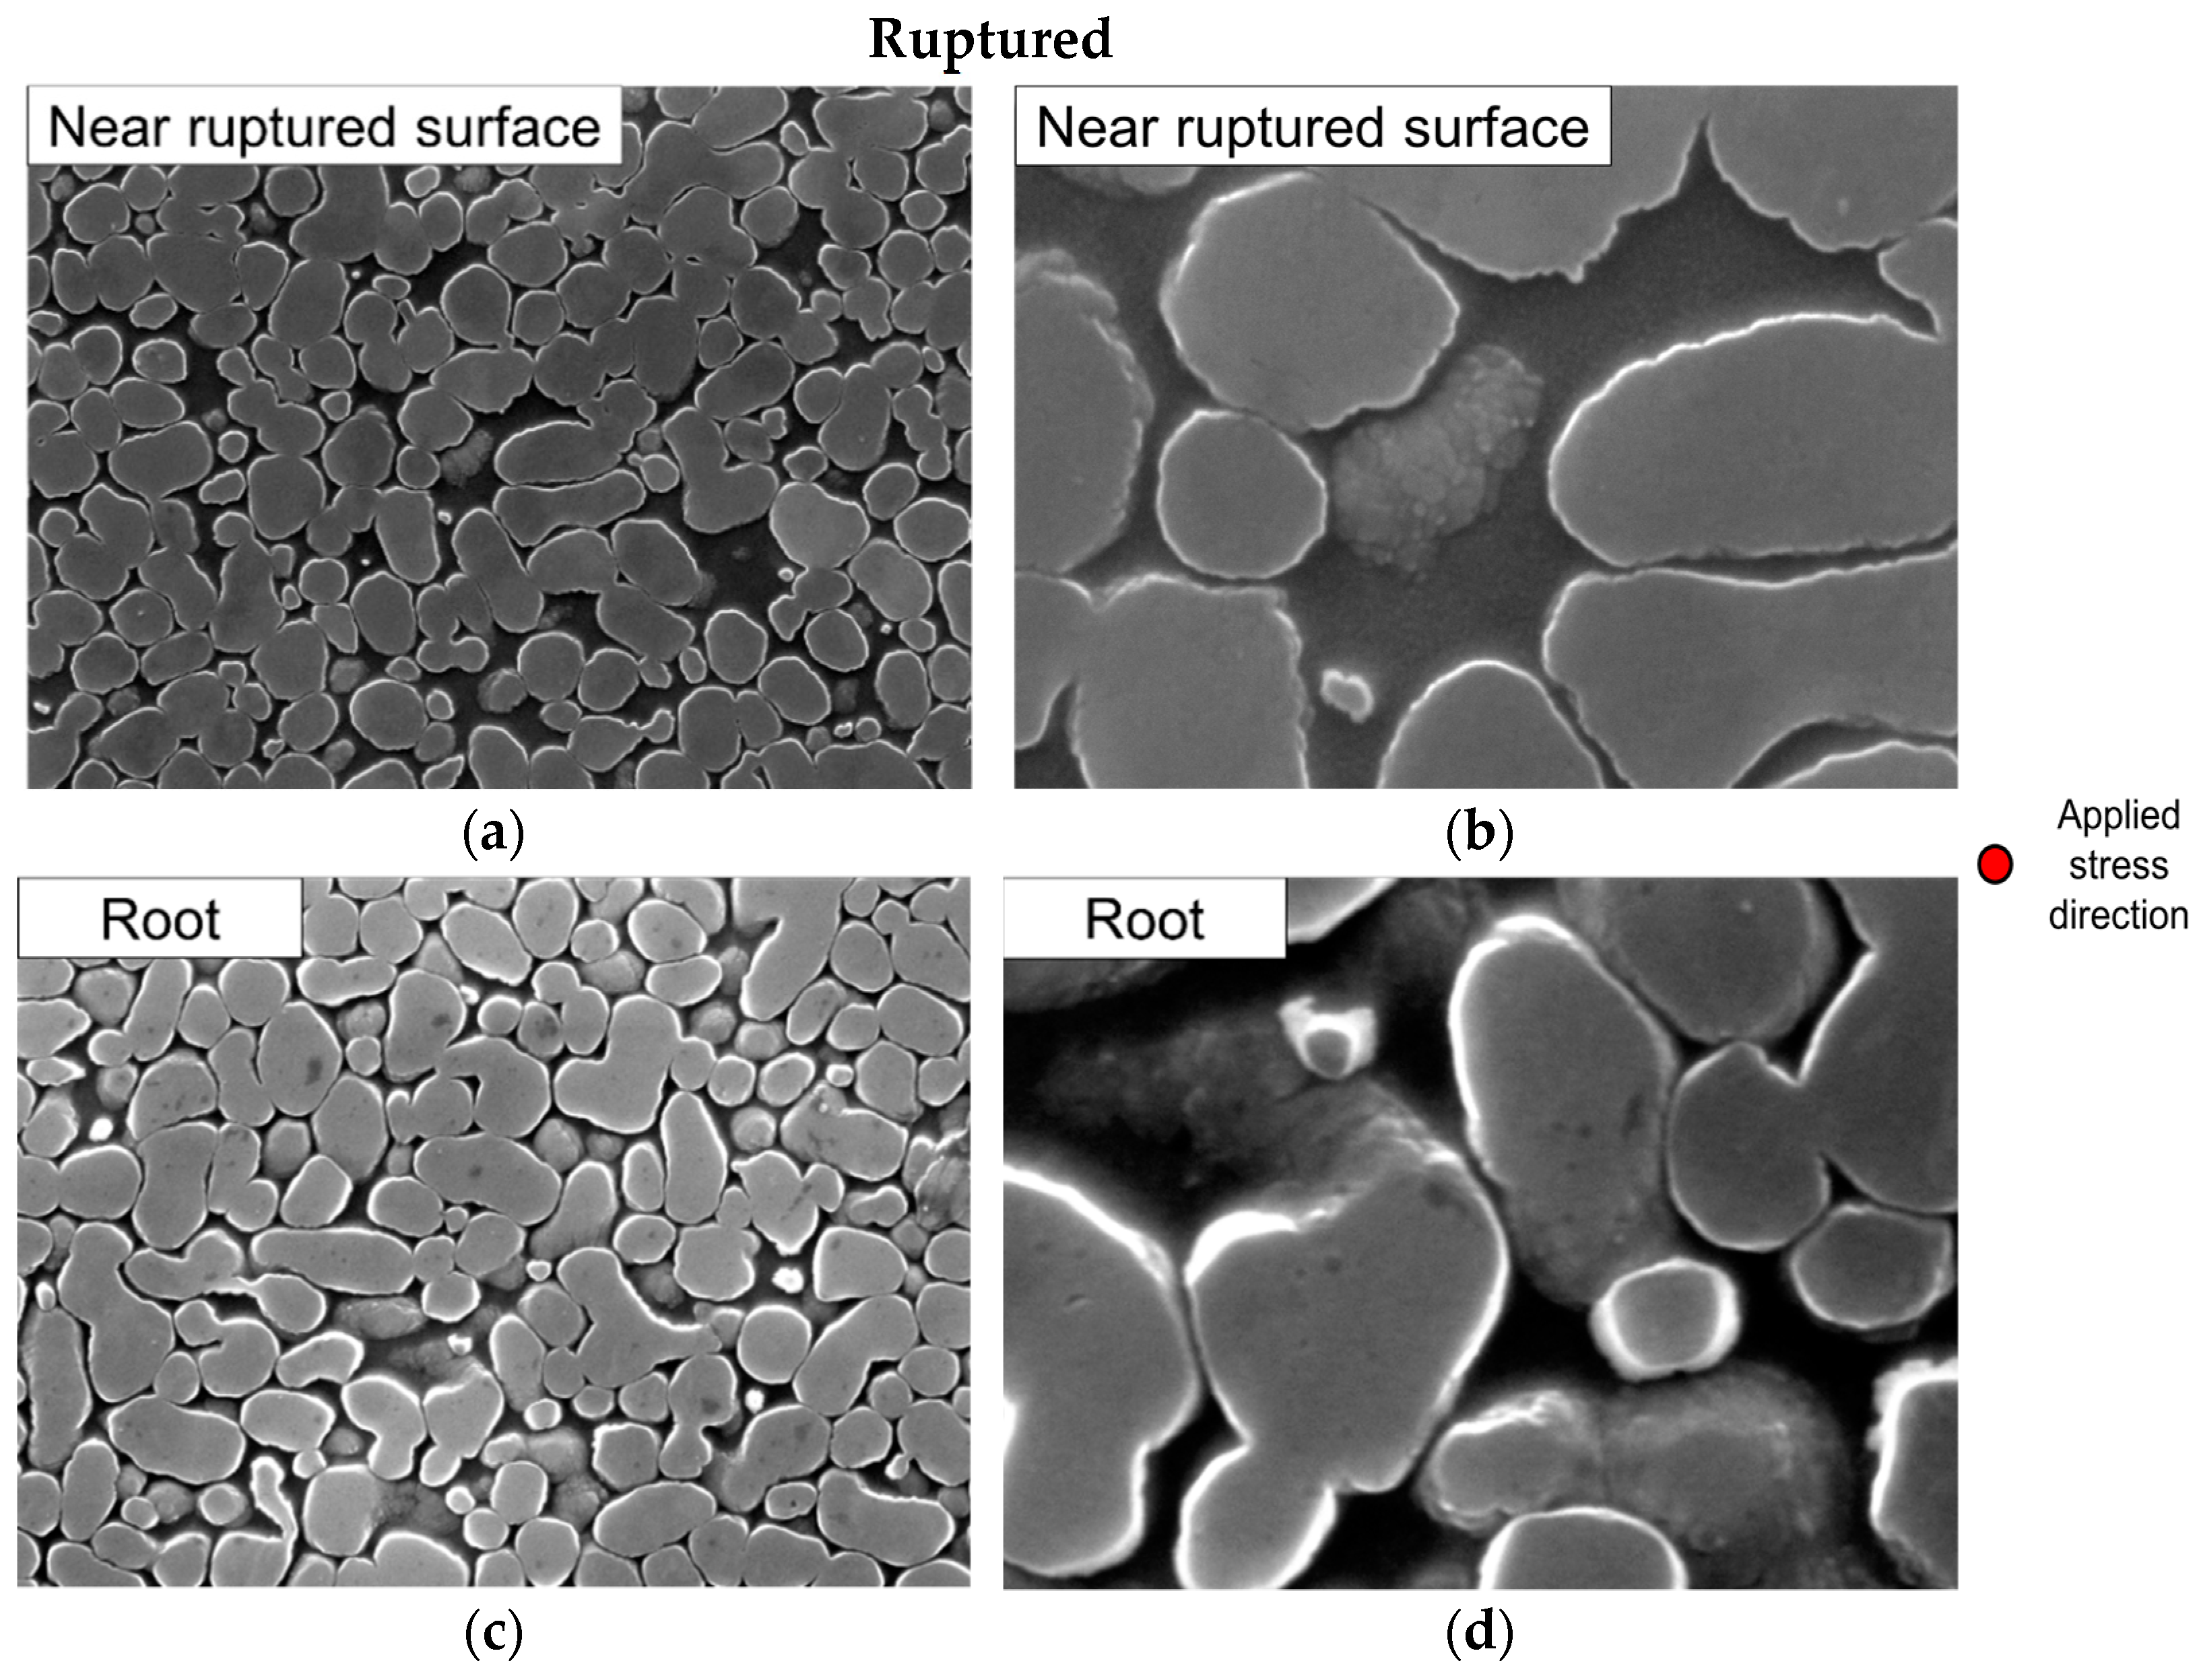
3.2.2. Morphology of Microstructure

The creep-ruptured specimens tested at 760 °C and 520 MPa were examined. They were cut parallel to the applied stress axis and observed using FE-SEM to evaluate the morphological change of the γ′ precipitates during deformation. The microstructure is shown in Figure 7. The figure indicates that the γ′ precipitates present in the region of 15 mm to 5 mm from the ruptured surface, appear to maintain their morphology, as shown in Figure 7e,g,i. However, some steps at the γ/γ′ interfaces and in the γ′ precipitates start to be observed, as shown in Figure 7f,h,j, at a higher magnitude. Regions up to 2 mm from the ruptured surface contain the elongated γ′ precipitates roughly parallel to the applied stress, as shown in Figure 7a,c. Change in the degree of the elongation of the γ′ precipitates as a function of distance from the ruptured surface was evaluated by applying an aspect ratio of the γ′ precipitates as shown in Figure 8. The aspect ratio decreases with increasing distance from the ruptured surface, however, the aspect ratio between 15 and 5 mm from the ruptured surface is almost the same value. This phenomenon should indicate the origin of deformation, but not directional coarsening based on thermal equilibrium, as the elongated γ′ precipitates could be observed everywhere within the gauge of the ruptured specimen. Furthermore, creep specimens including ruptured and interrupted tests were also observed from the view perpendicular to the applied stress axis. These results are shown in Figure 9. The cross-sectional view of the γ′ precipitates perpendicular to the stress axis maintained circular morphology in both creep-ruptured and interrupted specimens, as shown in Figure 9. Based on observations of the elongated γ′ precipitates in the direction of the applied stress axis and the circular γ′ precipitates near the ruptured surface, these observations indicate that multi-slip around <100> could cause the elongated γ′ precipitates into <100> to maintain cylindrical shape along the applied stress axis. This is because eight slip systems equivalent to ( 111 ) [ 10 1 ¯ ] or another eight slip systems equivalent to ( 111 ) [ 11 2 ¯ ] from the viewpoint of Schmid factor are equally operative when the applied stress axis is along [001]. Crystal orientation near the ruptured surface should be moved into <100> from the other crystal orientations if this hypothesis is reasonable.
It should be noted that, in addition to the elongated primary γ′ precipitates, the coarsened secondary γ′ precipitates were frequently observed in the 2-h interrupted creep specimen, as shown in Figure 9h. This indicates that Ostwald ripening described in Section 3.1. occurred during creep deformation in the early stage of creep.

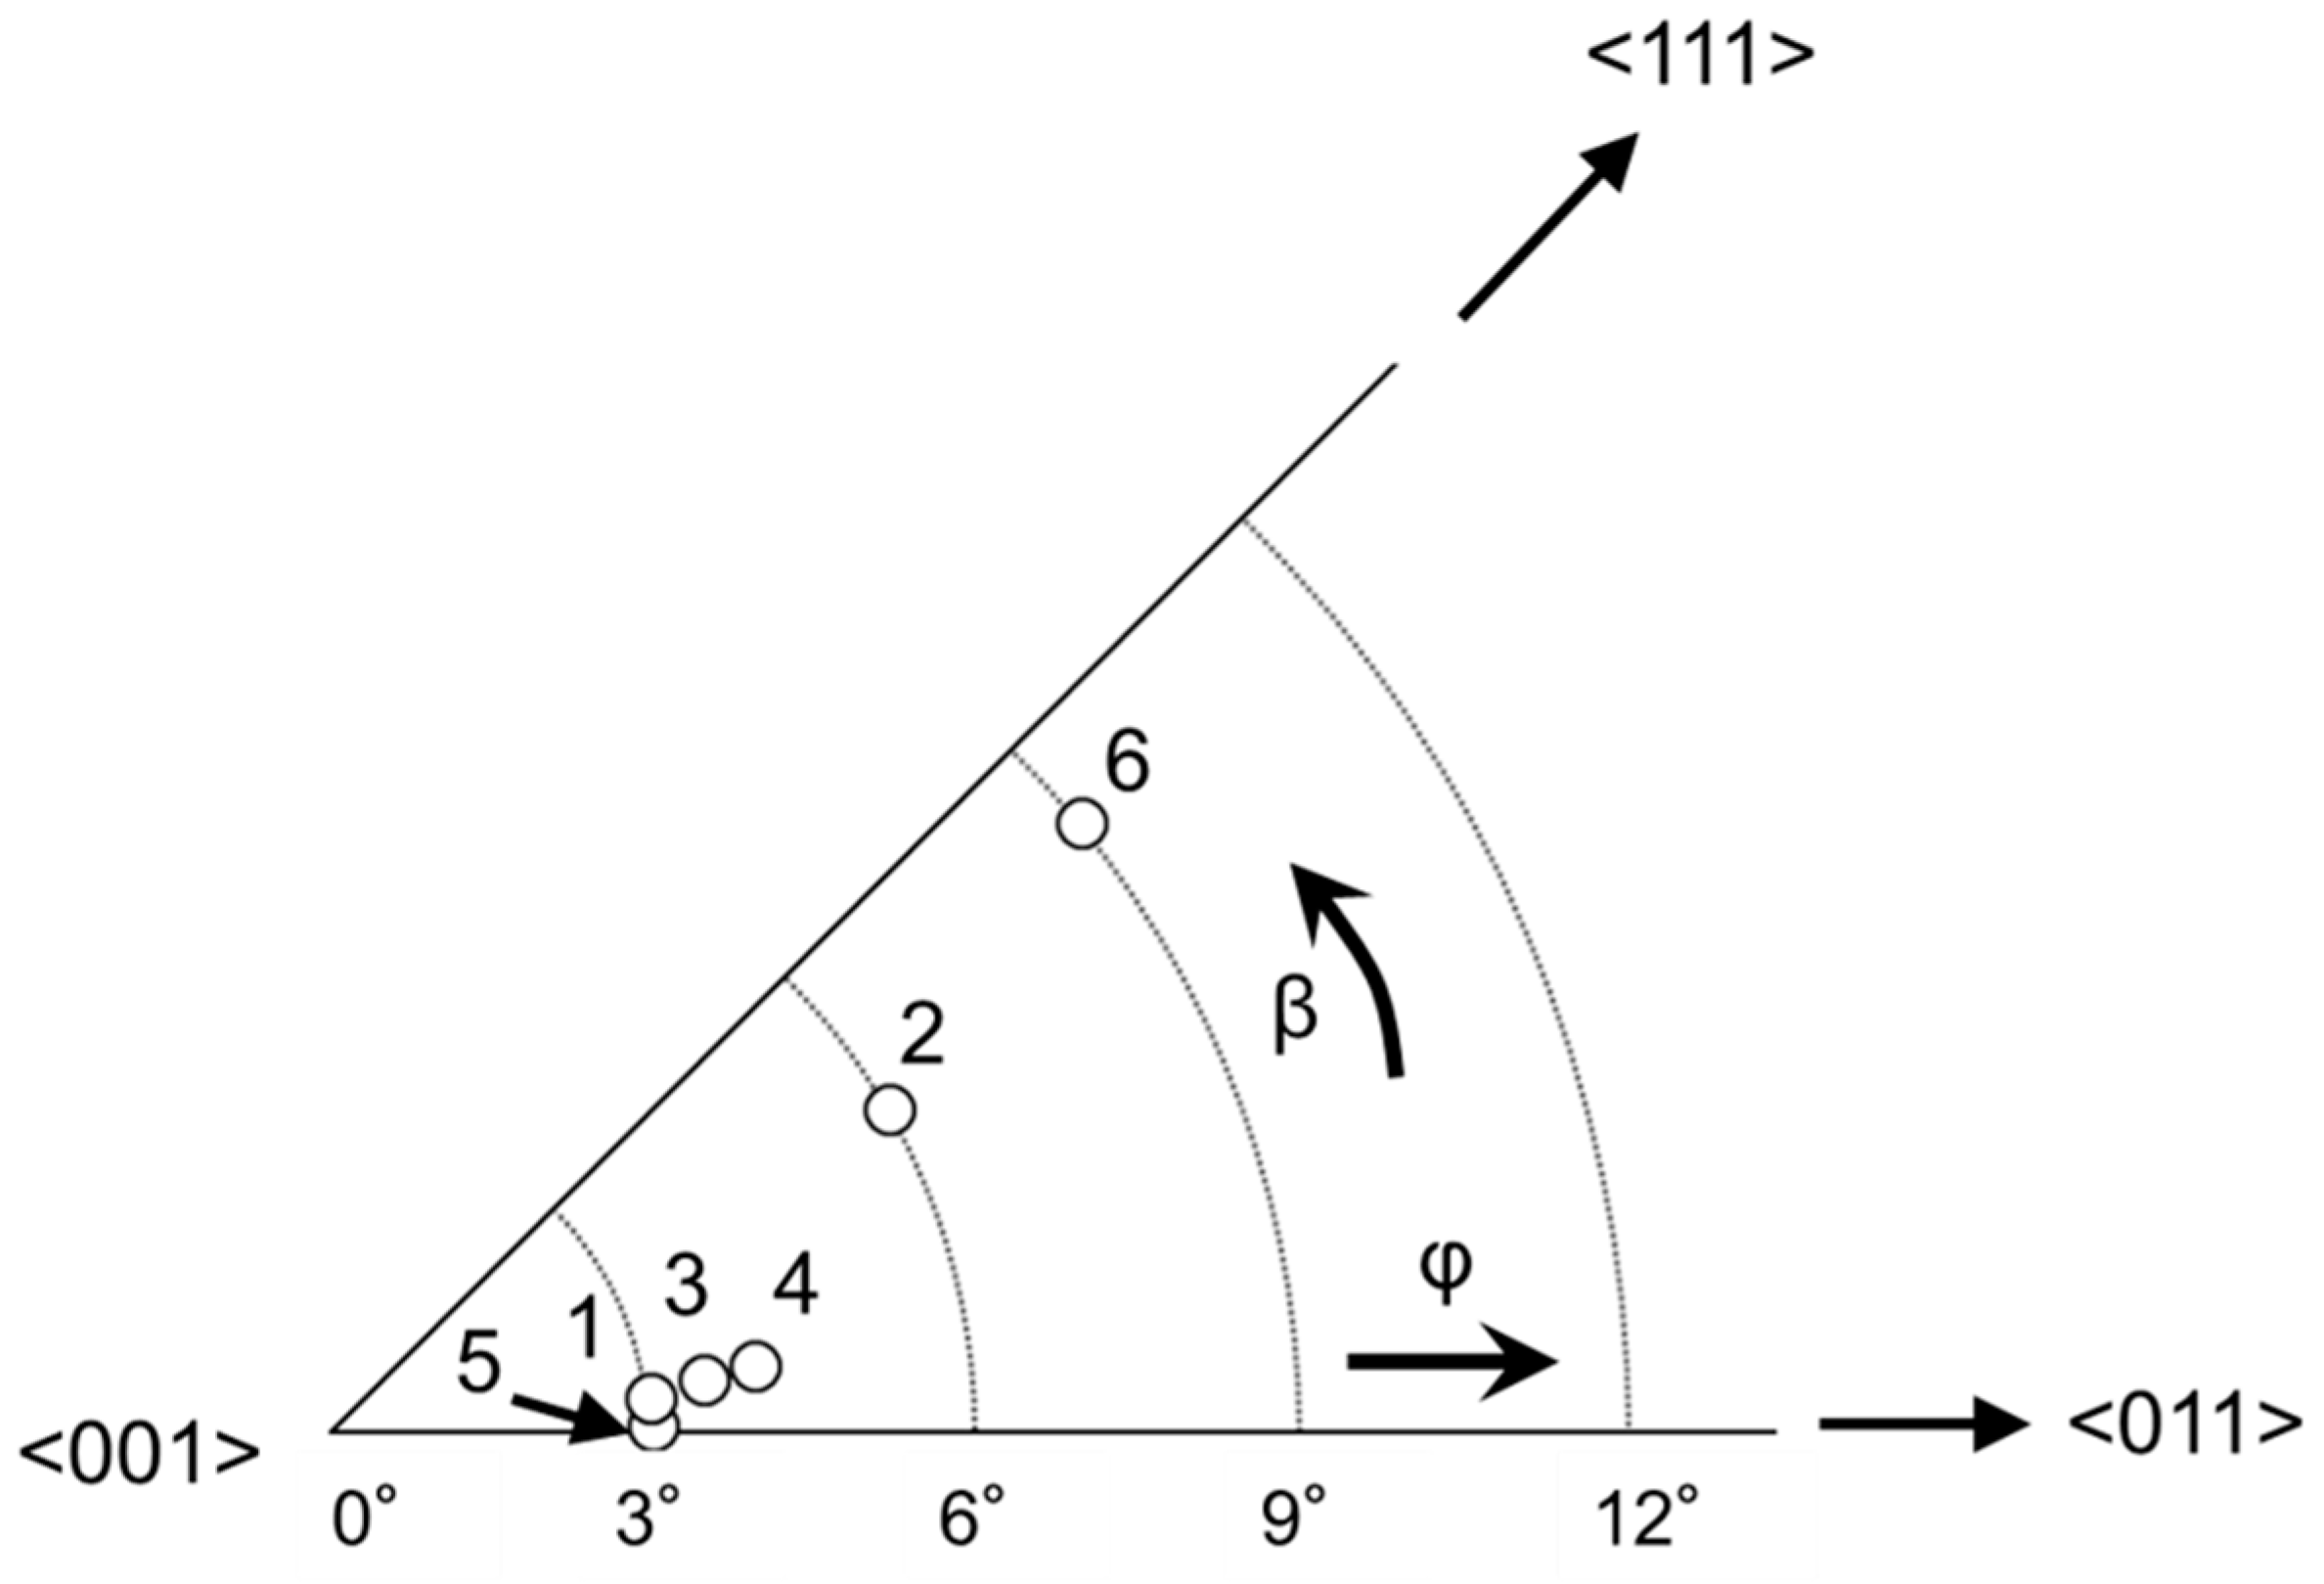
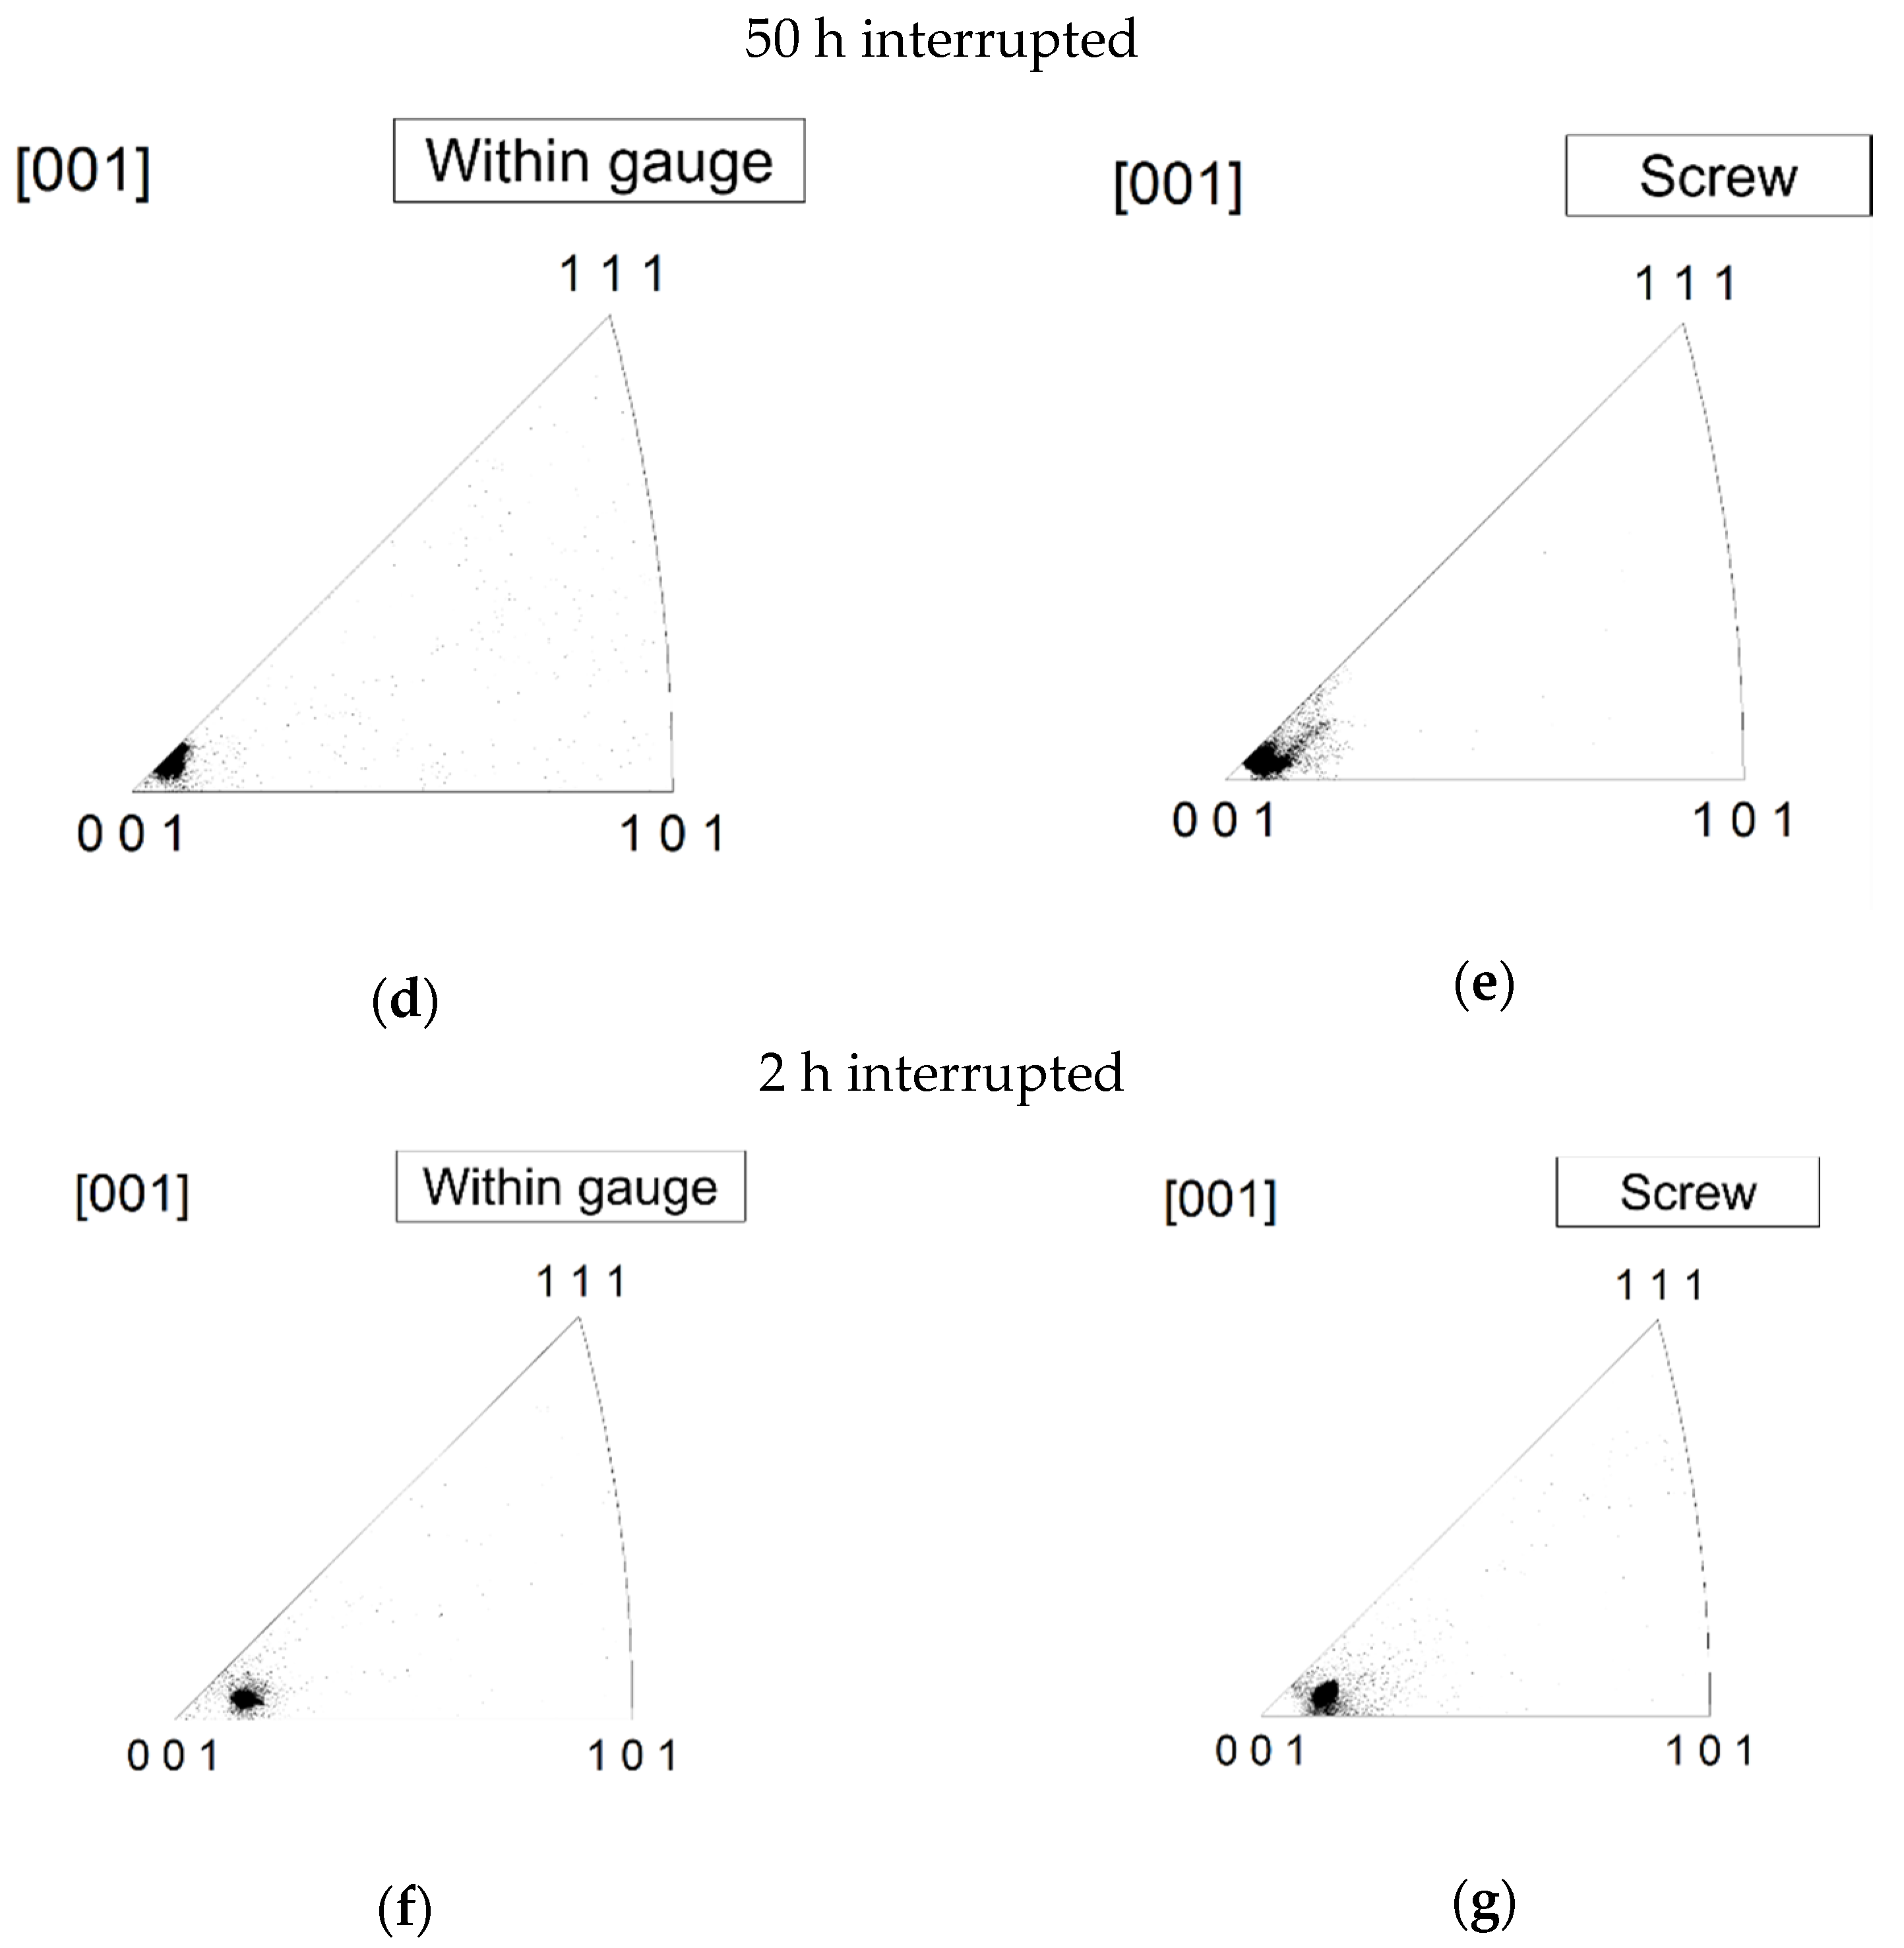
3.2.3. Lattice Rotation

It is well reported that, during creep, crystal orientation of the tensed region changes, which is termed as the lattice rotation. To understand the lattice rotation during creep, EBSD analysis was performed for creep tested specimens. Figure 10 shows the results of the ruptured specimen parallel to the applied stress axis, whereas Figure 11 shows the results of the creep specimens including the rupture and the interruption perpendicular to the applied stress axis. Figure 10a–d confirms that the crystal lattice in the specimen was oriented to <100> after the creep rupture within the gauge portion. According to Figure 7, the elongated γ′ precipitates were not clearly observed in the range between 5 and 10 mm from the ruptured surface although the crystal lattice rotates to reaches <100>. Considering the interrupted specimens shown in Figure 11, neither the 2-h in Figure 11f,g nor the 50-h interrupted specimen in Figure 11d,e show arrival to <100>. Furthermore, Figure 10e and Figure 11c,e,g show the crystal orientation away from <100> outside the gauge portion which can be regarded as the original crystal orientation including the gauge portion before the severe creep deformation. These results indicate that a large amount of deformation based on the multi-slip around <100> after reaching <100> for some time could cause the elongated γ′ precipitates along the direction of the applied stress axis. Based on the above results, the crystal can reach <100> from the original crystal orientation of specimens, between 50 h in the creep and the rupture.

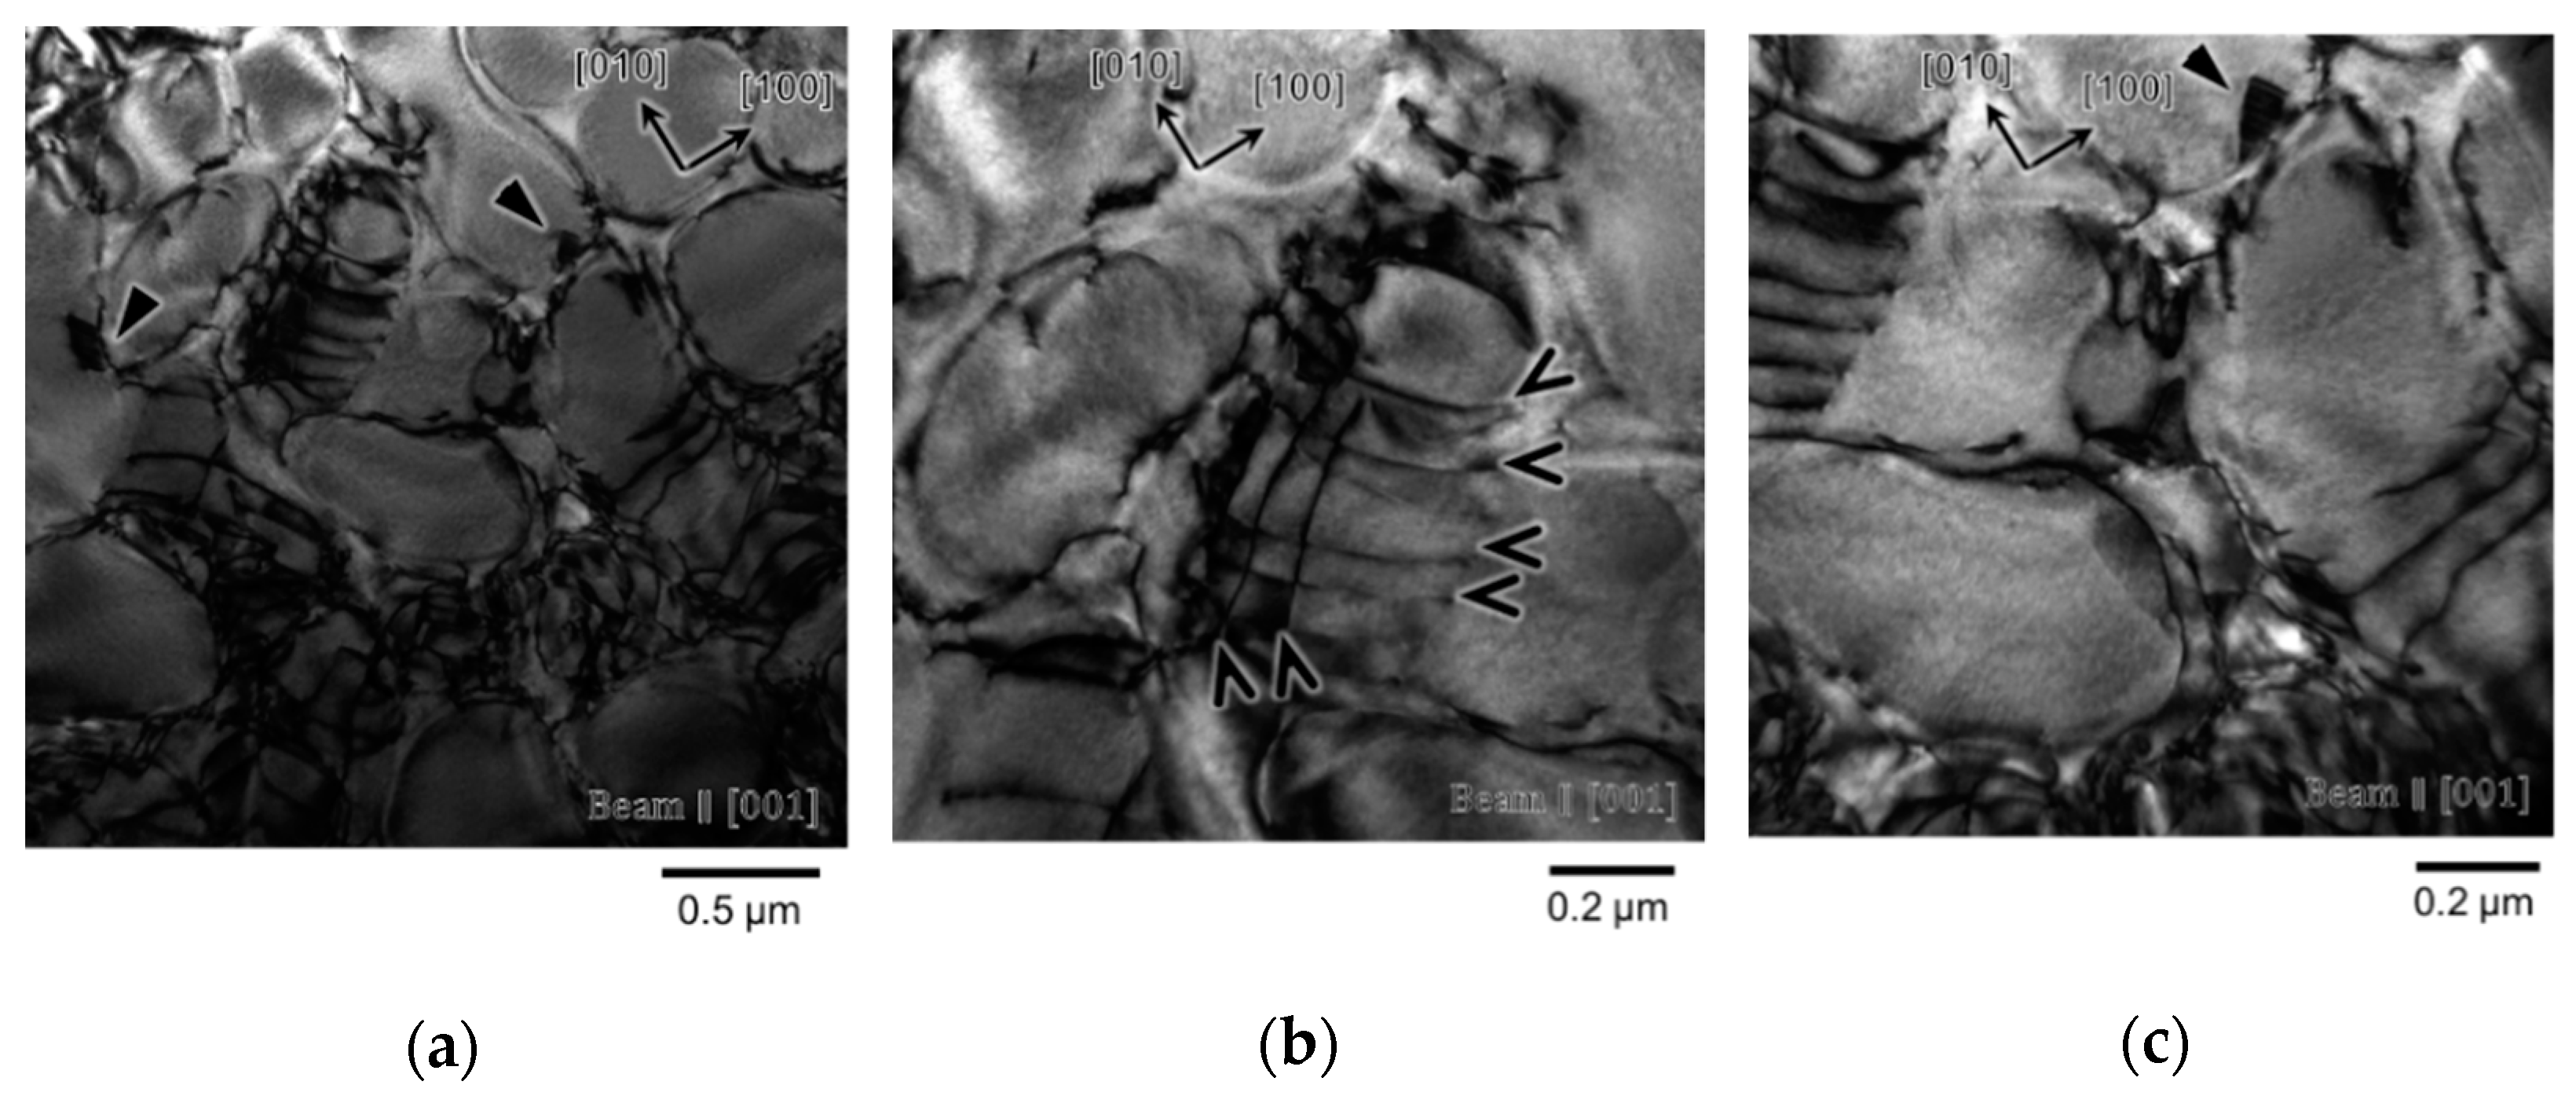
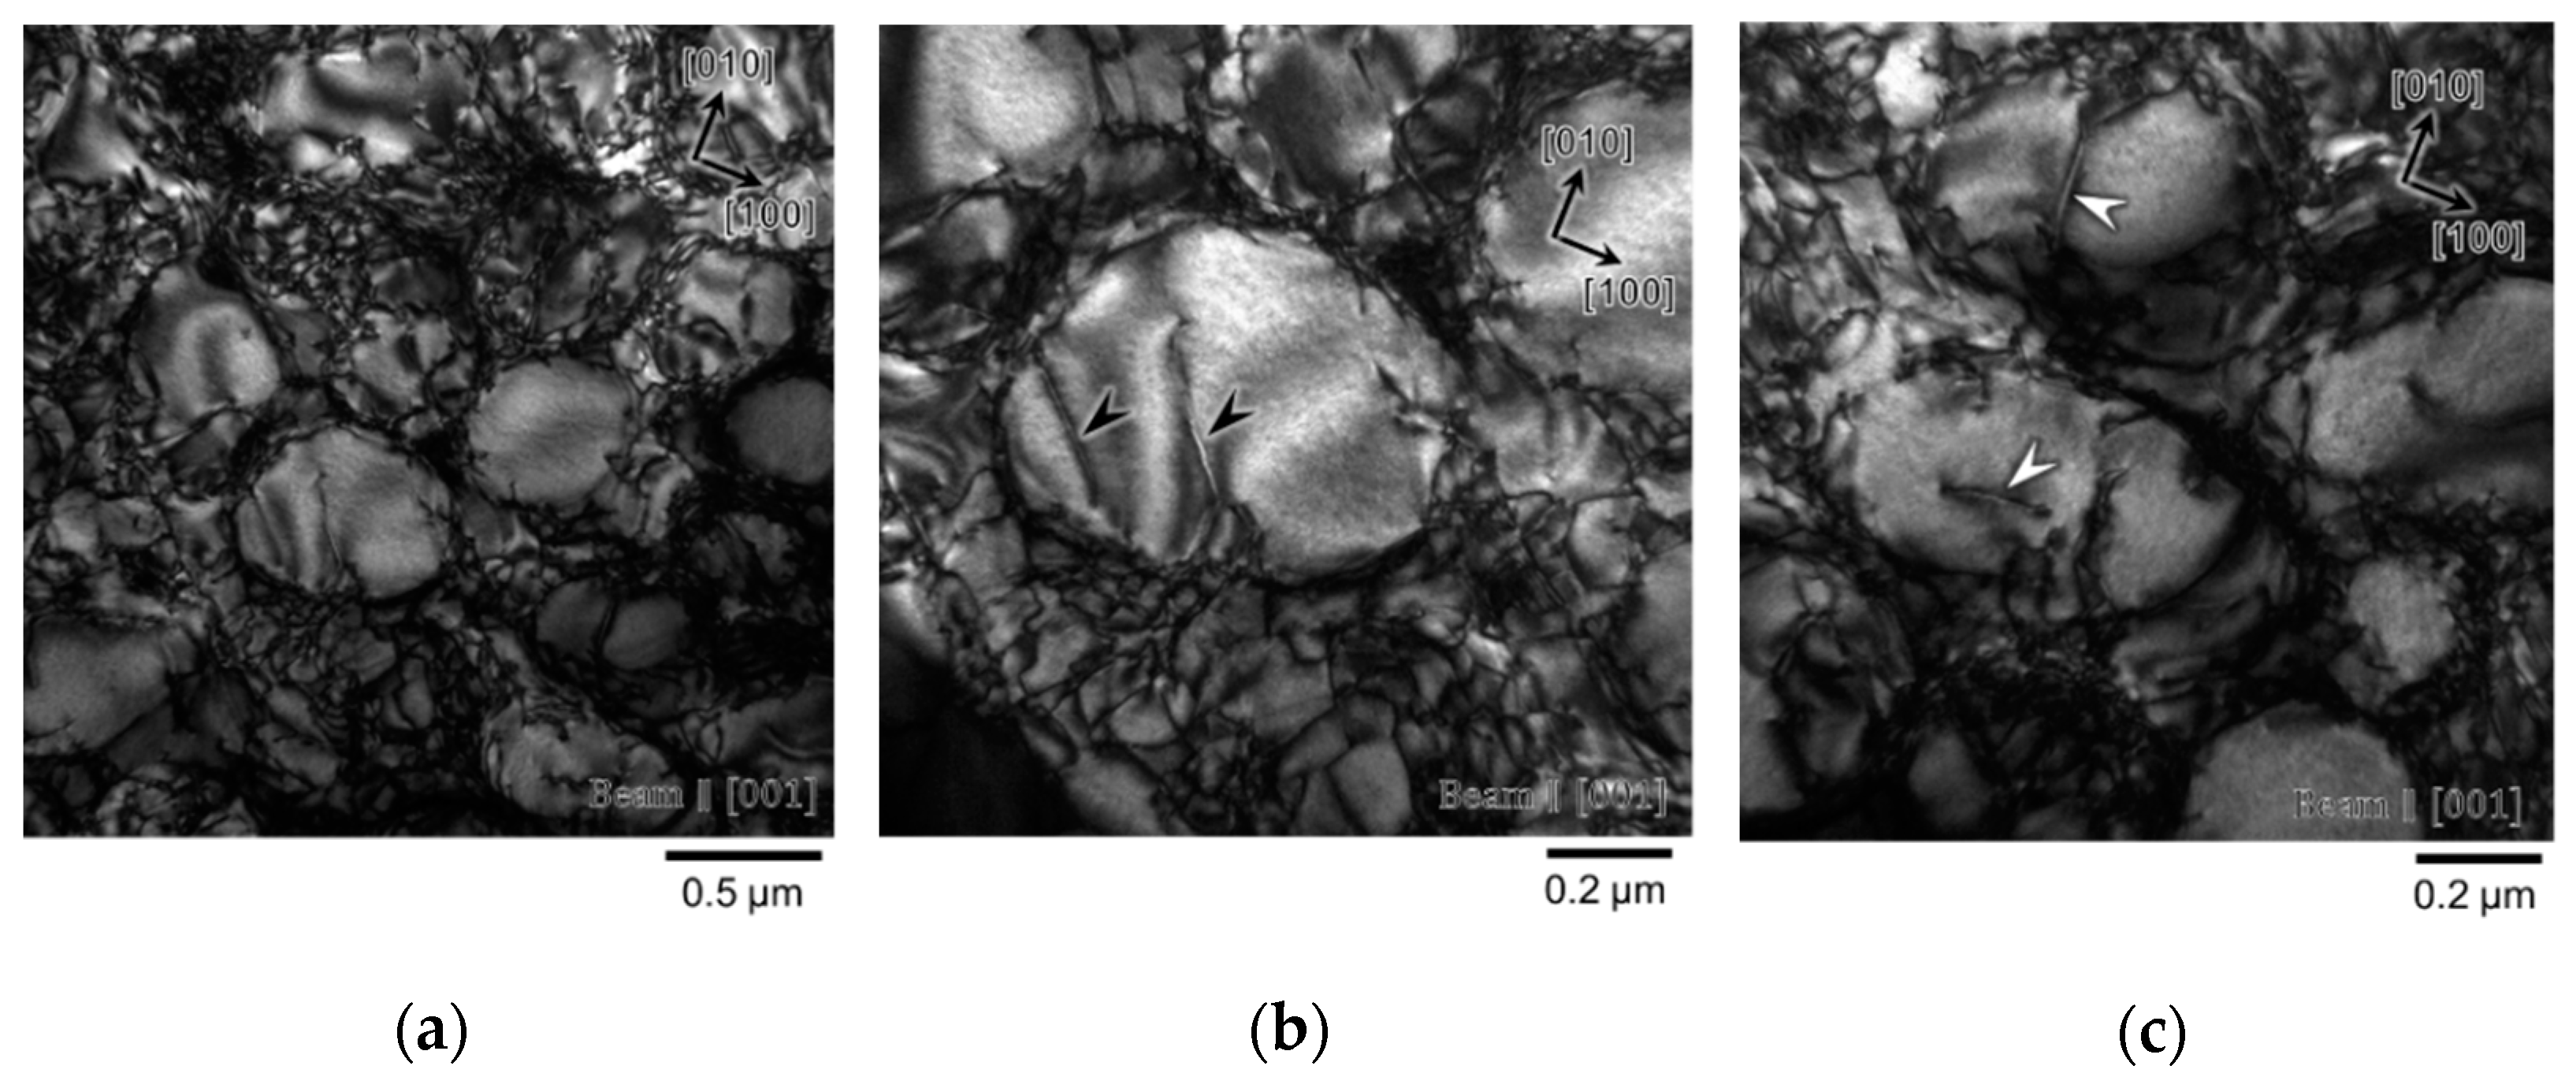
3.2.4. Morphology of Dislocations

To further understand the deformation character during creep, TEM was used to observe dislocations in the creep-ruptured and interrupted specimens.

2-h interrupted specimen

Almost all the dislocations in the 2-h interrupted specimen can be observed within the γ phase and at the γ/γ′ interface as shown in Figure 12a. Shearing of the γ′ precipitates by dislocations with widely separated stacking faults, which can be observed in the conventional Ni-based single-crystal superalloy under sufficient applied stress such as 750 MPa at 750 °C when tensed along the vicinity of the [001] direction [15], was hardly observed. Furthermore, shearing of the γ′ precipitates by a dislocation pair was not observed frequently. Stacking faults in the γ′ precipitates are marked with black triangle arrows in Figure 12a,c. These observations indicate that the by-pass motion of dislocations in the γ matrix appears to be the dominant deformation mechanism in the 2-h interrupted specimen. The observed dislocation character is identical to that in the previous report in CMSX-4 under the condition of 760 °C and 550 MPa with the smaller primary creep strain and strain rate than that under a higher stress level such as 750 MPa [15]. The relatively smaller applied stress at 520 MPa in this study might retard the propagation of the dislocation ribbon causing larger strain and strain rate in the primary creep [15].
Dislocation arrays on the γ/γ′ interface were found, which are indicated by V-shaped arrows in Figure 12b. This type of dislocation is in the <110> direction. According to the previous research in <001>-oriented Ni-based single-crystal superalloys, <110>-directed dislocation from the view of [001] appears to be 60° dislocations deposited on the γ/γ′ interface [19]. An accumulation of the 60° dislocations on the γ/γ′ interface perpendicular to the applied stress axis has been reported in a Ni-based single-crystal superalloy of SC16 [20].

30-h interrupted specimen

In the case of the 50-h interrupted specimen, shearing of the γ′ precipitates by paired straight dislocations which might be a pair of superpartial dislocations with APB was observed, as shown in Figure 13b,c. Stacking faults in the γ′ precipitates were hardly observed. There were two types of paired straight dislocations with a line directed along <110> indicated by black arrows in Figure 13b and directed along <100> indicated by white arrows in Figure 13c, respectively. In a similar manner to previous research [16], the <110>-directed paired dislocation appears to be 60° superpartial paired dislocation. The same previous research also shows that the <100>-directed paired dislocation from the view of [001] appears to be screw superpartial paired dislocation [19].

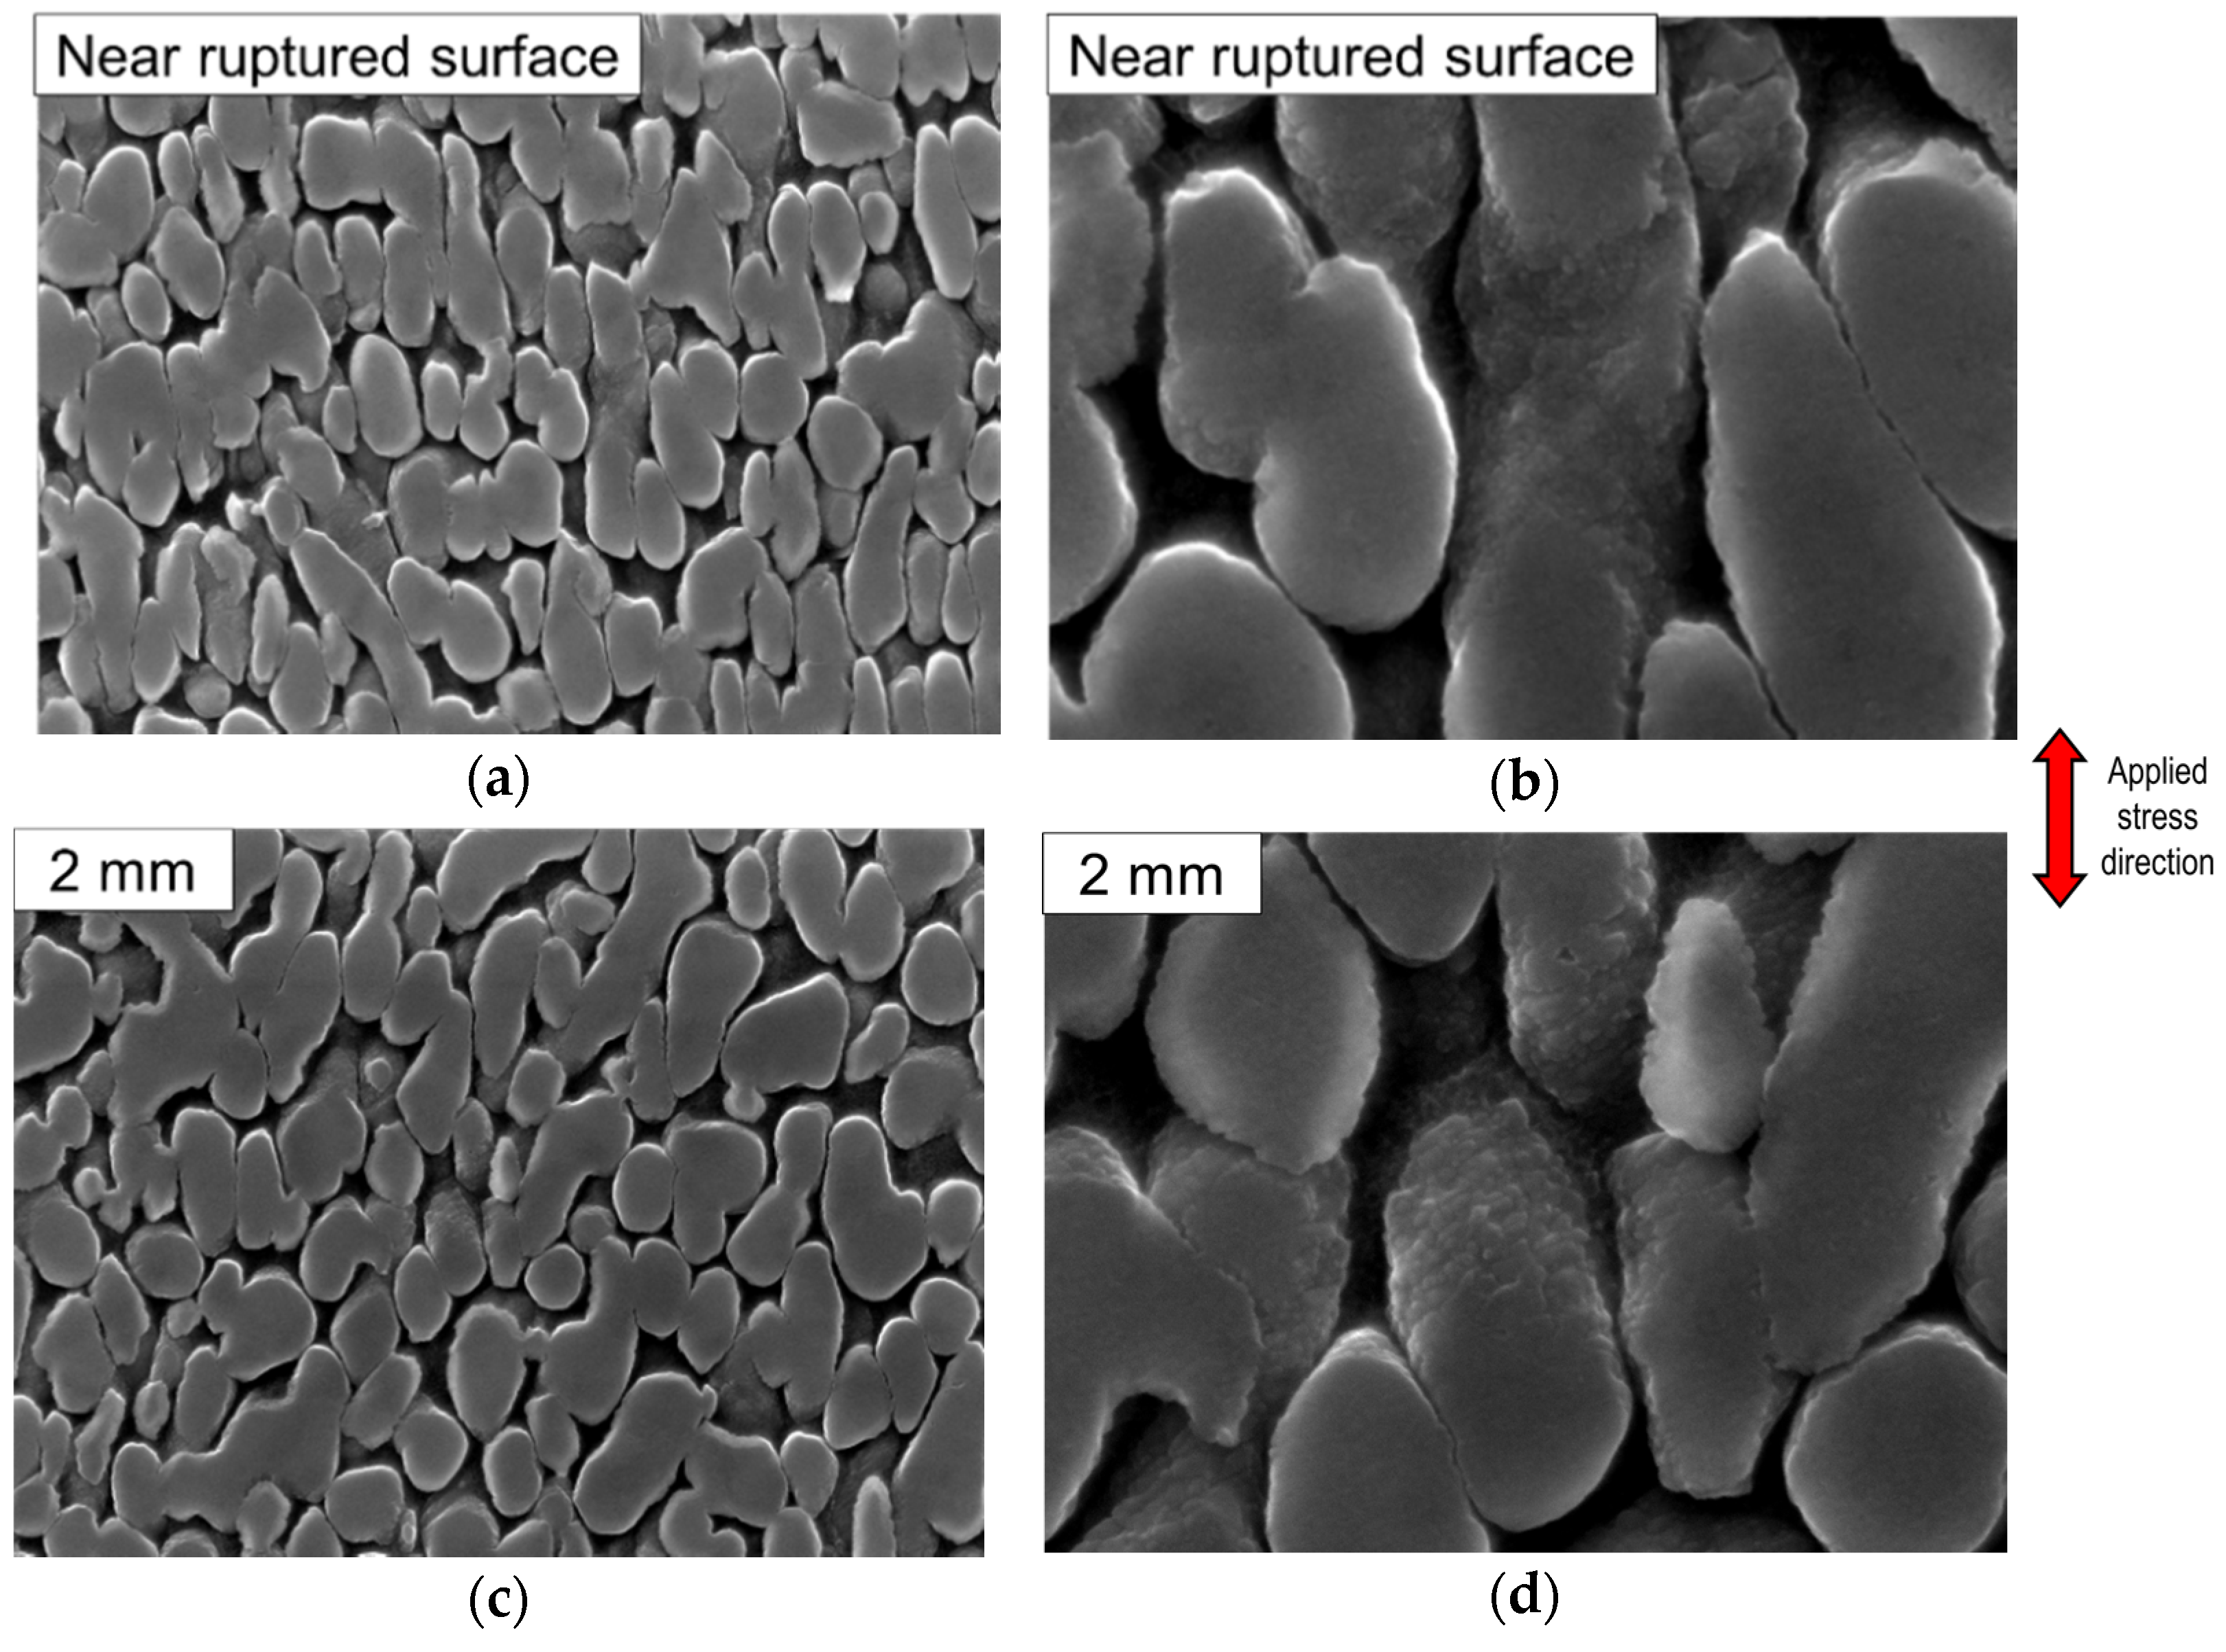
Root of Ruptured Specimen

Shearing of the γ′ precipitates by paired dislocations was more frequently observed in the root of the ruptured specimen, as shown in Figure 14a–c, compared with the 50-h interrupted specimen. Some paired dislocations are curved form as shown in Figure 14 indicated by the red arrow, although straight paired dislocations which are, respectively, indicated by the white arrows for the <100> directions and black arrows for the <110> directions can be observed. This suggests that more straight paired dislocations bow out between 50 h and the rupture. These curved dislocations do not seem to be caused by the cross-slip because, if it takes place, dislocation with zig-zag morphology should be observed, but such a form did not confirm in the curved dislocations observed in this study.
To confirm a plane bowed out the paired dislocations, specimens were observed with several tilting directions in TEM because some curved dislocation pairs with a <101> of total Burger’s vector at the condition of 850 °C and 414 MPa using Mar-M200 have been reported to lay on {100} with the assistance of climb motion [21]. The result is shown in Figure 15. Figure 15b shows a slight bowing out of the paired dislocations from the view of [001]. Figure 15a is a micrograph tilted along Kikuchi band with ( 2 2 ¯ 0 ) from the view of [001] into the side of [ 11 ¯ 1 ] . The bowing out of paired dislocations can be observed in Figure 15a. This indicates that the paired dislocations bow out on ( 11 ¯ 1 ) . Figure 15c is a micrograph tilted from the view of [001] into the side of [ 111 ] along Kikuchi band with ( 2 2 ¯ 0 ) . The tilted angle between Figure 15a,b was calculated to be 20.3° into the side of [ 11 ¯ 1 ] ; on the other hand, that between Figure 15b,c was calculated to be 32.4° into the side of [ 111 ] . Based on these results, the curved dislocation appears to be on ( 11 ¯ 1 ) . However, some question remains about this curved dislocation. Figure 15c shows straight paired dislocation showing a wide contrast peak. If this width of contrast peak is the width of APB separated by two dislocations, it should be minimized in the side of [ 111 ] compared with that of [ 11 ¯ 1 ] , as the widest separation of dislocations appears at the plane where the dislocation bows out. Further research is necessary to identify the nature of these curved dislocations. It should be noted that these tilting experiments did not reach actual [ 11 ¯ 1 ] and [ 111 ] because of a limitation of the tilting capability of the TEM holder.
Based on the above results, at the root of a ruptured specimen showing microstructure at the late stage of secondary creep, more paired dislocations take a curved form in the γ′ precipitates compared with the 50-h interrupted specimen.

3.2.5. Effect of Secondary γ′ Precipitates on Creep Properties

As mentioned in Section 3.1, the secondary γ′ precipitates are coarsened up to 50 h in the aging at 760 °C without load. A similar type of coarsened secondary γ′ precipitate during creep were confirmed in the 2-h creep interrupted specimen in Section 3.2.2. This coarsening based on Ostwald ripening might affect creep deformation kinetics. To understand the role of the secondary γ′ precipitates on creep properties, a creep rupture test at a condition of 760 °C and 520 MPa was conducted for the specimen aged in the furnace of the creep machine for 100 h before applying a load to remove the secondary γ′ precipitates and cooling γ′ precipitates based on the results shown in Figure 3. Creep curves of the specimens with and without 100 h aging are compared as shown in Figure 16. Surprisingly, the two creep curves almost overlap in both the primary and the secondary creep regions, respectively, resulting in almost the same creep-ruptured lives. This indicates that the secondary γ′ precipitates do not affect the motion of dislocations in the γ matrix when the creep test without 100 h aging was conducted at 760 °C and 520 MPa. As mentioned in Section 3.2.4, dislocations took the motion of the bypass in the γ matrix in the primary creep region. If dislocations glide only on the same slip plane combined with the motion of the bypass, the primary creep strain rate is expected to be smaller in the sample without 100 h aging because the smaller net γ channel width originating from the existence of the secondary γ′ precipitates should contribute to the larger critical shear stress determined by Orowan stress for dislocations to bow out dislocations [22,23]. However, the primary creep strain rates with and without 100 h aging are almost identical as shown in Figure 16. This indicates that dislocations taking the bypass motion observed in the 2-h interrupted specimen in Figure 12 can change their slip plane easily as forms of a climb motion or a cross slip with the glide motion instead of only gliding on the same slip plane. Furthermore, observed dislocations are expected to be zig-zag shape if the cross slip is operative [24]. However, dislocations observed in the 2-h interrupted test in Figure 12 exhibited smooth curves. Therefore, the easy climb and glide motion combined with the bypass motion of dislocations can be operative for passing through the γ channel separated by the secondary γ′ precipitates instead of shearing the secondary γ′ precipitates.
This result is different from the previous research of the secondary γ′ precipitates on the creep behavior of Ni-based single-crystal superalloys. The previous research on the effect of heat treatments of CMSX-4 on creep properties at a condition of 760 °C and 800 MPa shows the effect of the secondary γ′ precipitates on the motion of dislocations [25]. This research shows that the secondary γ′ precipitates equivalent to a smaller net γ channel width promotes shearing of both the primary and the secondary γ′ precipitates by the dislocation ribbon resulting in the larger strain at the end of the primary creep.

4. Conclusions

The tensile creep tests of a single-crystal high entropy superalloy were conducted at 760 °C. Based on the results, following can be concluded.
(1) Ostwald ripening in the secondary γ′ precipitates was observed. The secondary γ′ precipitates were shown to continuously grow up to 50 h in the long-term aging tests without load. The existence of the secondary γ′ precipitates do not have any significant effect on creep behavior in the primary and secondary creep regions, because bypass and climb motions of dislocations can be operative to pass through the narrower γ channel separated by the secondary γ′ precipitates instead of shearing the secondary γ′ precipitates.
(2) The dominant deformation mechanisms in the primary creep are the by-pass and the climb motion of dislocations in the γ matrix.
(3) Paired dislocations in the γ′ precipitates were frequently observed in the secondary creep and after the rupture. More paired dislocations took curved form after the rupture than 50 h in the creep.
(4) A crystal lattice started to move into <100> and finally reached <100> between 50 h and the rupture in the creep. The multi-slip along {111} planes resulted in the elongated γ′ phase to almost parallel to the applied stress axis near the ruptured surface.

Author Contributions

Conceptualization, T.S., A.-C.Y. and H.M.; data curation, T.S. and M.Y.; formal analysis, T.S. and A.I.; funding acquisition, H.M.; investigation, T.S.; methodology, M.Y.; project administration, H.M.; resources, Y.T. and K.K.; supervision, H.M.; writing—original draft, T.S.; writing—review and editing, A.I. and H.M. All authors have read and agreed to the published version of the manuscript.

Funding

This research received no external funding.

Acknowledgments

The authors would like to thank Kazuyuki Ogawa in National Institute of Materials Science (NIMS) for teaching the fundamental operation of TEM, Hong Gao in NIMS for teaching the fundamental operation of SEM and EBSD, Toru Hara and Taku Moronaga in NIMS for helping us with the operation of TEM.

Conflicts of Interest

The authors declare no conflict of interest.

References

  1. Yeh, J.-W.; Chen, S.-K.; Lin, S.-J.; Gan, J.-Y.; Chin, T.-S.; Shun, T.-T.; Tsau, C.-H.; Chang, S.-Y. Nanostructured High-Entropy Alloys with Multiple Principal Elements: Novel Alloy Design Concepts and Outcomes. Adv. Eng. Mater. 2004, 6, 299–303. [Google Scholar] [CrossRef]
  2. Cantor, B.; Chang, I.T.H.; Knight, P.; Vincent, A.J.B. Microstructural development in equiatomic multicomponent alloys. Mat. Sci. Eng. A 2004, 375–377, 213–218. [Google Scholar] [CrossRef]
  3. Wu, Z.; Bei, H.; Pharr, G.M.; George, E.P. Temperature dependence of the mechanical properties of equiatomic solid solution alloys with face-centered cubic crystal structures. Acta Mater. 2014, 81, 428–441. [Google Scholar] [CrossRef]
  4. Miao, J.; Slone, C.E.; Smith, T.M.; Niu, C.; Bei, H.; Ghazisaeidi, M.; Pharr, G.M.; Mills, M.J. The evolution of the deformation substructure in a Ni-Co-Cr equiatomic solid solution alloy. Acta Mater. 2017, 132, 35–48. [Google Scholar] [CrossRef]
  5. Gludovatz, B.; Hohenwarter, A.; Thurston, K.V.S.; Bei, H.; Wu, Z.; George, E.P.; Ritchie, R.O. Exceptional damage-tolerance of a medium-entropy alloy CrCoNi at cryogenic temperatures. Nat. Commun. 2016, 7, 10602. [Google Scholar] [CrossRef]
  6. Ro, Y.; Koizumi, Y.; Harada, H. High temperature tensile properties of a series of nickel-base superalloys on a γ/γ′tie line. Mater. Sci. Eng. A 1997, 223, 59–63. [Google Scholar] [CrossRef]
  7. Yeh, A.-C.; Chang, Y.-J.; Tsai, C.-W.; Wang, Y.-C.; Yeh, J.-W.; Kuo, C.-M. On the Solidification and Phase Stability of a Co-Cr-Fe-Ni-Ti High-Entropy Alloy. Met. Mat. Trans. A 2014, 45, 184–190. [Google Scholar] [CrossRef]
  8. Tsao, T.-K.; Yeh, A.-C.; Kuo, C.-M.; Kakehi, K.; Murakami, H.; Yeh, J.-W.; Jian, S.-R. The High Temperature Tensile and Creep Behaviors of High Entropy Superalloy. Sci. Rep. 2017, 7, 12658. [Google Scholar] [CrossRef]
  9. Tsao, T.-K.; Yeh, A.-C.; Yeh, J.-W.; Chiou, M.-S.; Kuo, C.-M.; Murakami, H.; Kakehi, K. High Temperature Properties of Advanced Directionally-Solidified High Entropy Superalloys. In Proceedings of the 13th International Symposium on Superalloys (Superalloys 2016), Seven Springs, PA, USA, 11–15 September 2016; pp. 1001–1009. [Google Scholar] [CrossRef]
  10. Chen, Y.-T.; Chang, Y.-J.; Murakami, H.; Sasaki, T.; Hono, K.; Li, C.-W.; Kakehi, K.; Yeh, J.-W.; Yeh, A.-C. Hierarchical microstructure strengthening in a single crystal high entropy superalloy. Sci. Rep. 2020, 10, 12163. [Google Scholar] [CrossRef]
  11. Saito, T.; Chen, Y.-T.; Takata, Y.; Kawagishi, K.; Hsu, W.-C.; Yeh, A.-C.; Murakami, H. Effect of heat treatments on microstructural evolution of a single crystal high entropy superalloy. Metals 2020, 10, 1600. [Google Scholar] [CrossRef]
  12. Leverant, G.R.; Kear, B.H. The mechanism of creep in gamma prime precipitation-hardened nickel-base alloys at intermediate temperatures. Met. Mater. Trans. B 1970, 1, 491–498. [Google Scholar] [CrossRef]
  13. MacKay, R.A.; Maier, R.D. The influence of orientation on the stress rupture properties of nickel-base superalloy single crystals. Met. Trans. A 1982, 13, 1747–1754. [Google Scholar] [CrossRef]
  14. Link, T.; Feller-Kniepmeier, M. Shear mechanisms of the γ′ phase in single-crystal superalloys and their relation to creep. Met. Trans. A 1992, 23, 99–105. [Google Scholar] [CrossRef]
  15. Rae, C.M.F.; Reed, R.C. Primary creep in single crystal superalloys: Origins, mechanisms and effects. Acta Mater. 2007, 55, 1067–1081. [Google Scholar] [CrossRef]
  16. Kovarik, L.; Unocic, R.R.; Li, J.; Sarosi, P.; Shen, C.; Wang, Y.; Mills, M.J. Microtwinning and other shearing mechanisms at intermediate temperatures in Ni-based superalloys. Prog. Mater. Sci. 2009, 54, 839–873. [Google Scholar] [CrossRef]
  17. Drew, G.L.; Reed, R.C.; Kakehi, K.; Rae, C.M.F. Single crystal superalloys: The transition from primary to secondary creep. In Proceedings of the Tenth International Symposium on Superaloys (Superalloys 2004), Seven Springs, PA, USA, 19–23 September 2004; pp. 127–136. [Google Scholar] [CrossRef]
  18. Izuno, H.; Koizumi, Y.; Yokokawa, T.; Harada, H. Long time creep prediction of a creep constitutive equation of Ni-base single crystal superalloys. J. Jpn. Inst. Met. 2007, 71, 712–715. [Google Scholar] [CrossRef] [Green Version]
  19. Zhang, J.X.; Murakumo, T.; Koizumi, Y.; Kobayashi, T.; Harada, H. Slip geometry of dislocations related to cutting of the γ′ phase in a new generation single-crystal superalloy. Acta Mater. 2003, 51, 5073–5081. [Google Scholar] [CrossRef]
  20. Gabrisch, H.; Mukherji, D.; Wahi, R.P. Deformation-induced dislocation networks at the γ-γ′ interfaces in the single-crystal superalloy SC16: A mechanism-based analysis. Philos. Mag. A 1996, 74, 229–249. [Google Scholar] [CrossRef]
  21. Leverant, G.R.; Kear, B.H.; Oblak, J.M. Creep of precipitation-hardened nickel-base alloy single crystals at high temperatures. Met. Trans. 1973, 4, 355–362. [Google Scholar] [CrossRef]
  22. Reppich, B. Some new aspects concerning particle hardening mechanisms in γ′ precipitating Ni-base alloy- 1. Theoretical concept. Acta Met. 1982, 1, 87–94. [Google Scholar] [CrossRef]
  23. Reppich, B.; Schepp, P.; Wehner, G. Some new aspects concerning particle hardening mechanisms in γ’ precipitating nickel-base alloys—II. Experiments. Acta Met. 1982, 30, 95–104. [Google Scholar] [CrossRef]
  24. Zhang, J.X.; Wang, J.C.; Harada, H.; Koizumi, Y. The effect of lattice misfit on the dislocation motion in superalloys during high-temperature low-stress creep. Acta Mater. 2005, 53, 4623–4633. [Google Scholar] [CrossRef]
  25. Kakehi, K.; Takahashi, S. Influence of aging heat treatment on creep strength of CMSX4. J. Sociery Mater. Sci. Jpn. 2005, 54, 136–142. [Google Scholar] [CrossRef]
Figure 1. The crystal orientations of single-crystal rods for the tensile tests. Numbers in the figure denote specimens which appear in Table 2.
Crystals 11 00028 g001
Figure 2. Microstructure after long-term aging at 760 °C without load. (a) As heat treated, (b) 0.5, (c) 2.5, (d) 10.5, (e) 20, (f) 50, (g) 100, (h) 200, (i) 500 h aged at 760 °C.
Crystals 11 00028 g002
Figure 3. Microstructure after long-term aging at 760 °C without load at higher magnitude of Figure 2. (a) As heat treated, (b) 0.5, (c) 2.5, (d) 10.5, (e) 20, (f) 50 h, (g) 100, (h) 200, (i) 500 h aged at 760 °C.
Crystals 11 00028 g003aCrystals 11 00028 g003b
Figure 4. Creep curves at 760 °C. (a) Whole region of creep tests, (b) early stage of creep tests.
Crystals 11 00028 g004
Figure 5. Change in the strain rate as a function of strain in the (a) primary creep region, (b) secondary creep region.
Crystals 11 00028 g005
Figure 6. Summary of stress and strain rate relationship in the primary and secondary creep regions.
Crystals 11 00028 g006
Figure 7. Microstructure parallel to the applied stress axis in a creep-ruptured specimen at a condition of 760 °C and 520 MPa. (a,b) Near the ruptured surface, (c,d) 2, (e,f) 5, (g,h) 10, (i,j) 15 mm away from the ruptured surface. Except for the region 15 mm from the ruptured surface, observed regions were within gauge of the specimen.
Crystals 11 00028 g007aCrystals 11 00028 g007b
Figure 8. Relationship between the aspect ratio of the γ′ precipitates and distance from the ruptured surface.
Crystals 11 00028 g008
Figure 9. Microstructural transition perpendicular to the applied stress axis in creep at a condition of 760 °C and 520 MPa. (a,b) Near the ruptured surface of the ruptured specimen, (c,d) root of the ruptured specimen, (e,f) 50-h interrupted, (g,h) 2-h interrupted. All observed regions were within the gauge of the specimen.
Crystals 11 00028 g009aCrystals 11 00028 g009b
Figure 10. Standard stereographic triangles analyzed using electron backscatter diffraction (EBSD) in ruptured specimen parallel to applied stress axis as a function of distance from the ruptured surface. The creep test was conducted under the condition of 760 °C and 520 MPa. The analyzed area was rectangular with approximately 1000 μm in the applied stress axis and approximately 2000 μm in the direction perpendicular to applied stress axis. EBSD analysis was conducted at the step size of approximately 5 μm. (a) Near the ruptured surface, (b) 2, (c) 5, (d) 10, (e) 15 mm away from the ruptured surface.
Crystals 11 00028 g010
Figure 11. Standard stereographic triangles analyzed using EBSD in specimens perpendicular to the applied stress axis at a condition of 760 °C and 520 MPa. The analyzed area within the gauge was a square with approximately 4000 μm edge length, and EBSD analysis was conducted at the step size of approximately 10 μm. The analyzed area in the screw part was a square with approximately 8000 μm edge length, and EBSD analysis was conducted at the step size of approximately 20 μm. (ac) Ruptured specimen, (d,e) 50-h interrupted, (f,g) 2-h interrupted.
Crystals 11 00028 g011aCrystals 11 00028 g011b
Figure 12. Bright-field images in the 2-h interrupted specimen using TEM from the view of the [001]-zone axis. Black triangle arrows indicate stacking faults in γ′ precipitates. V-shaped arrows indicate <110>-directed dislocations on the γ/γ′ interface.
Crystals 11 00028 g012
Figure 13. Bright-field images in the 50-h interrupted specimen using TEM from the view of the [001] zone axis. Black arrows indicate <110>-directed paired dislocations. White arrows indicate <100>-directed paired dislocations.
Crystals 11 00028 g013
Figure 14. Images in the root of the ruptured specimen using TEM within the gauge of the ruptured specimen. Black arrows indicate <110> directed paired dislocation recognized from the view of [001]. White arrows indicate <100> directed paired dislocation recognized from the view of [001]. Red arrows mark wavy paired dislocation. (a) Bright-field image where the beam direction is parallel to [001], (b) bright-field image with g = (220), (c) weak beam image with g = (220).
Crystals 11 00028 g014
Figure 15. Bright-field image in the root of the ruptured specimen using TEM in the various tilting conditions within the gauge of the ruptured specimen. The red arrow indicates bowed out paired dislocation, which is focused on: (a) 20.3° from [001] along Kikuchi band with ( 2 2 ¯ 0 ) on the side of [ 1 ¯ 1 ¯ 1 ] with g = ( 2 2 ¯ 0 ) , (b) from the view of [ 001 ] , (c) 32.4° from [001] along Kikuchi band with ( 2 2 ¯ 0 ) on the side of [ 111 ] with g = ( 2 2 ¯ 0 ) .
Crystals 11 00028 g015
Figure 16. Creep curves at 760 °C and 520 MPa comparing the results between specimens with and without additional 100-h aging at 760 °C. (a) Whole region of creep curves, (b) early stage of creep curves.
Crystals 11 00028 g016
Table 1. Heat treatment condition of high-entropy superalloy (HESA) in this study.
Heat TreatmentProcedure
Solution treatmentR.T.→(2.0 h)→1175 °C/2 h→(0.5 h)→1215 °C/5 h→A.C.
Primary aging950 °C/20 h
Secondary aging850 °C 20 h
Table 2. The crystal orientations of creep specimens and creep conditions. (Number refers to the specimen number in Figure 1).
Numberβ (deg)φ (deg)Temperature /°CStress/MPaDetailCross Section
16.03.0760500RupturedRound
230.06.0760520RupturedRound
38.03.5760600RupturedRound
49.04.0760520Interrupted at 2 hRound
51.03.0760520Interrupted at 50 hRound
639.09.0760520Ruptured after 100 h aging at 760 °C in creep machineRound
Publisher’s Note: MDPI stays neutral with regard to jurisdictional claims in published maps and institutional affiliations.

