Article

Analysis of the Phase Stability of LiMO2 Layered Oxides (M = Co, Mn, Ni)

by
Mariarosaria Tuccillo
1,
Oriele Palumbo
1,
Michele Pavone
2,
Ana Belen Muñoz-García
2,
Annalisa Paolone
1 and
Sergio Brutti
1,3,*
1
CNR-ISC, U.O.S. La Sapienza, Piazzale A. Moro 5, 00185 Rome, Italy
2
Department of Chemical Sciences and Department of Physics E. Pancini, University of Naples Federico II, Via Cintia 21, 80126 Napoli, Italy
3
Department of Chemistry, University of Rome La Sapienza, Piazzale Aldo Moro 5, 00185 Rome, Italy
*
Author to whom correspondence should be addressed.
Crystals 2020, 10(6), 526; https://doi.org/10.3390/cryst10060526
Submission received: 27 April 2020 / Revised: 4 June 2020 / Accepted: 8 June 2020 / Published: 20 June 2020

Abstract

:
Transition-metal (TM) layered oxides have been attracting enormous interests in recent decades because of their excellent functional properties as positive electrode materials in lithium-ion batteries. In particular LiCoO2 (LCO), LiNiO2 (LNO) and LiMnO2 (LMO) are the structural prototypes of a large family of complex compounds with similar layered structures incorporating mixtures of transition metals. Here, we present a comparative study on the phase stability of LCO, LMO and LNO by means of first-principles calculations, considering three different lattices for all oxides, i.e., rhombohedral (hR12), monoclinic (mC8) and orthorhombic (oP8). We provide a detailed analysis—at the same level of theory—on geometry, electronic and magnetic structures for all the three systems in their competitive structural arrangements. In particular, we report the thermodynamics of formation for all ground state and metastable phases of the three compounds for the first time. The final Gibbs Energy of Formation values at 298 K from elements are: LCO(hR12) −672 ± 8 kJ mol−1; LCO(mC8) −655 ± 8 kJ mol−1; LCO(oP8) −607 ± 8 kJ mol−1; LNO(hR12) −548 ± 8 kJ mol−1; LNO(mC8) −557 ± 8 kJ mol−1; LNO(oP8) −548 ± 8 kJ mol−1; LMO(hR12) −765 ± 10 kJ mol−1; LMO(mC8) −779 ± 10 kJ mol−1; LMO(oP8) −780 ± 10 kJ mol−1. These values are of fundamental importance for the implementation of reliable multi-phase thermodynamic modelling of complex multi-TM layered oxide systems and for the understanding of thermodynamically driven structural phase degradations in real applications such as lithium-ion batteries.

1. Introduction

Industrial and academic research efforts have been focusing on lithium-ion batteries (LIBs) since the late 70s: the commercial success of this technology is indubitable, thanks to its large energy densities [1]. LIBs are now enabling the transition to massive electric transportation, as the competitive technologies seem less suitable: (a) Pb-acid batteries are the cheapest among existing automotive battery systems but they use toxic materials and exhibit poor energy densities [2]; (b) Ni metal hybrid (Ni-MH) batteries show good energy and power densities, but the self-discharge is remarkable and they require complex charging protocols [3]. LIBs are relatively more expensive than other cell chemistries, but can supply the highest power and energy densities, as well as a longer cycle life [4,5].
Focusing on LIB positive electrode materials, Transition Metal (TM) oxide layered phases have been attracting considerable attention and commercial success in recent decades, e.g., LiCoO2 [6]. Others LiMO2 (M = TM) materials are valuable alternatives, such as LiNiO2 [7], LiMnO2 [8] or mixed TM solution phases [9], to enhance the working potentials or increase the materials’ environmental benignity. All these compounds have been intensively studied, both from the technological and fundamental perspectives [10].
Here, we present a comparative first-principles study of the phase stability of LiCoO2 (LCO), LiNiO2 (LNO) and LiMnO2 (LMO). We considered three different lattices for all oxides identified hereafter by adopting the corresponding Pearson symbols, namely hR12, mC8 and oP8 for rhombohedral, monoclinic and orthorhombic cells, respectively, as shown in Figure 1. Our goal is to develop a detailed analysis at the same level of theory to compare geometry, electronic and magnetic structures for all three formulations in the competitive structural arrangements. In fact, although LCO, LMO and LNO, share the similar stoichiometries and short-range-ordering motifs (TMO6 and LiO6 octahedral coordination and a regular stacking of TM/O/Li/O planar layers), these three phases crystallize in different ground-state lattices and show remarkable differences in the magnetic ordering and polymorphism. Our aim is to develop a careful comprehension of the lattice stability based on accurate electronic structure calculations, thus paving the way to more complex modeling efforts, for example, the new innovative over-lithiated layered oxide chemistries with extended mixing between TM and lithium [10,11]. Compared to recent computational analyses on layered lithium transition metal oxides [12,13,14,15], our study reports an original analysis of the formation thermodynamics of the considered polymorphs, derived using simple thermodynamic cycles. Our aim is to develop a benchmark analysis using the same computational approach and details for all three mixed oxides. These new data are necessary requirements for multi-element system assessment and pseudo-binary/ternary/quaternary phase diagram modelling [16,17,18,19,20]. These modeling approaches are mandatory to tackle the analysis of the degradation chemistry of complex layered oxides under reactive conditions, such as in batteries upon electrochemical lithium de-intercalation/intercalation.

2. Materials and Methods

All calculations were carried out with the Vienna Ab-initio Simulation Package (VASP, Universitat Wien, Austria), which performs periodic ab-initio quantum mechanical calculations within the Kohn–Sham density functional theory (DFT) [21,22] framework, with projector-augmented wave potentials and plane wave basis sets. We applied the generalized-gradient approximation (GGA) with the exchange–correlation density functional by Perdew, Burke and Ernzenhof (PBE) [21].
We used the DFT + U method [23,24], which has been extensively validated for correcting the large self-interaction error in transition metal oxides [25,26,27], caused by the approximate form of the standard exchange-correlation density functional when applied to strongly localized unpaired electrons, as in the d manifold of Co, Ni and Mn. Ab initio derived U values depend on the number of unpaired d electrons; thus, the reported U parameters for Ni, Mn and Co are 6.0, 4.0 and 3.3 eV, respectively [28,29]. We have chosen an intermediate value (4.0 eV) since we are modelling electronic structures of lattices containing ions possibly in different oxidation states, due to the occurrence of electronic disorder (e.g., Jahn-Teller distortions, see below). One may recall that the choice of different U values for different metals is also a possible choice. However, optimal U values can be slightly different even for identical metals when comparing different oxidation states. Here, our aim is to develop and evaluate the accuracy/precision of a computational approach capable of mimicking realistically different structural environments and redox states (e.g., induced by lithium de-intercalations, vacancy formation, doping, etc.) with the minimal computational complexity. The goal of our analysis is to pave the way for other computational studies, where supercells containing several transition metals will be considered. In this view, the adoption of selected values of U, tailored to each metal, in complex materials possibly including a variety of redox states (due to point defects, lithium content, doping) may weaken the meaningfulness of computational predictions.
All calculations are spin-polarized. We used a kinetic energy cut-off of 520 eV and a Gamma–centered k-point mesh (hR12 11 × 11 × 4; mC8 9 × 11 × 9; oP8 11 × 9 × 9). We optimized the structural parameters of LCO, LNO and LMO for each structure. Atomic positions and lattice parameters have been optimized separately by minimizing total energy and forces without any symmetry constraints until the residual force on each atom was <0.01 eV Å−1. This procedure has been repeated iteratively in order to ensure that lattice constants and atomic positions are simultaneously minimized.
For LCO and LNO, we modelled a single unit cell containing 12 atoms in the lattice hR12 (3 Li, 3 Co/Ni, 6 O) and 8 atoms for both mC8 and oP8 lattices (2 Li, 2 Co/Ni, 4 O). Turning to LMO in order to account for the antiferromagnetic properties, we used a 2 × 2 supercell containing 48 atoms in the lattice hR12 (12 Li, 12 Mn, 24 O), 24 atoms in the lattice mC8 (8 Li, 8 Mn, 16 O), while for the orthorhombic structure, oP8, we used a 2 × 2 × 2 supercell containing 64 atoms (16 Li, 16 Mn, 32 O) (Figure 2). The antiferromagnetic (AFM) spin configuration was found to be the most stable in the case of LMO by magnetic measurement: for the Pmmn space group, Greedan et al. found antiferromagnetic alignment along the a and b directions [30], while for the mC8 lattice, Singh found antiferromagnetic alignment along the b direction [31]. Our total energy calculations confirmed that antiferromagnetic configurations were energetically favorable by 0.214 eV for hR12, 0.112 eV for mC8 and 0.074 eV for oP8 compared to FM ones, in line with the available literature [30,31]. Thus, all results hereafter refer to AFM configurations for LMO.

3. Results

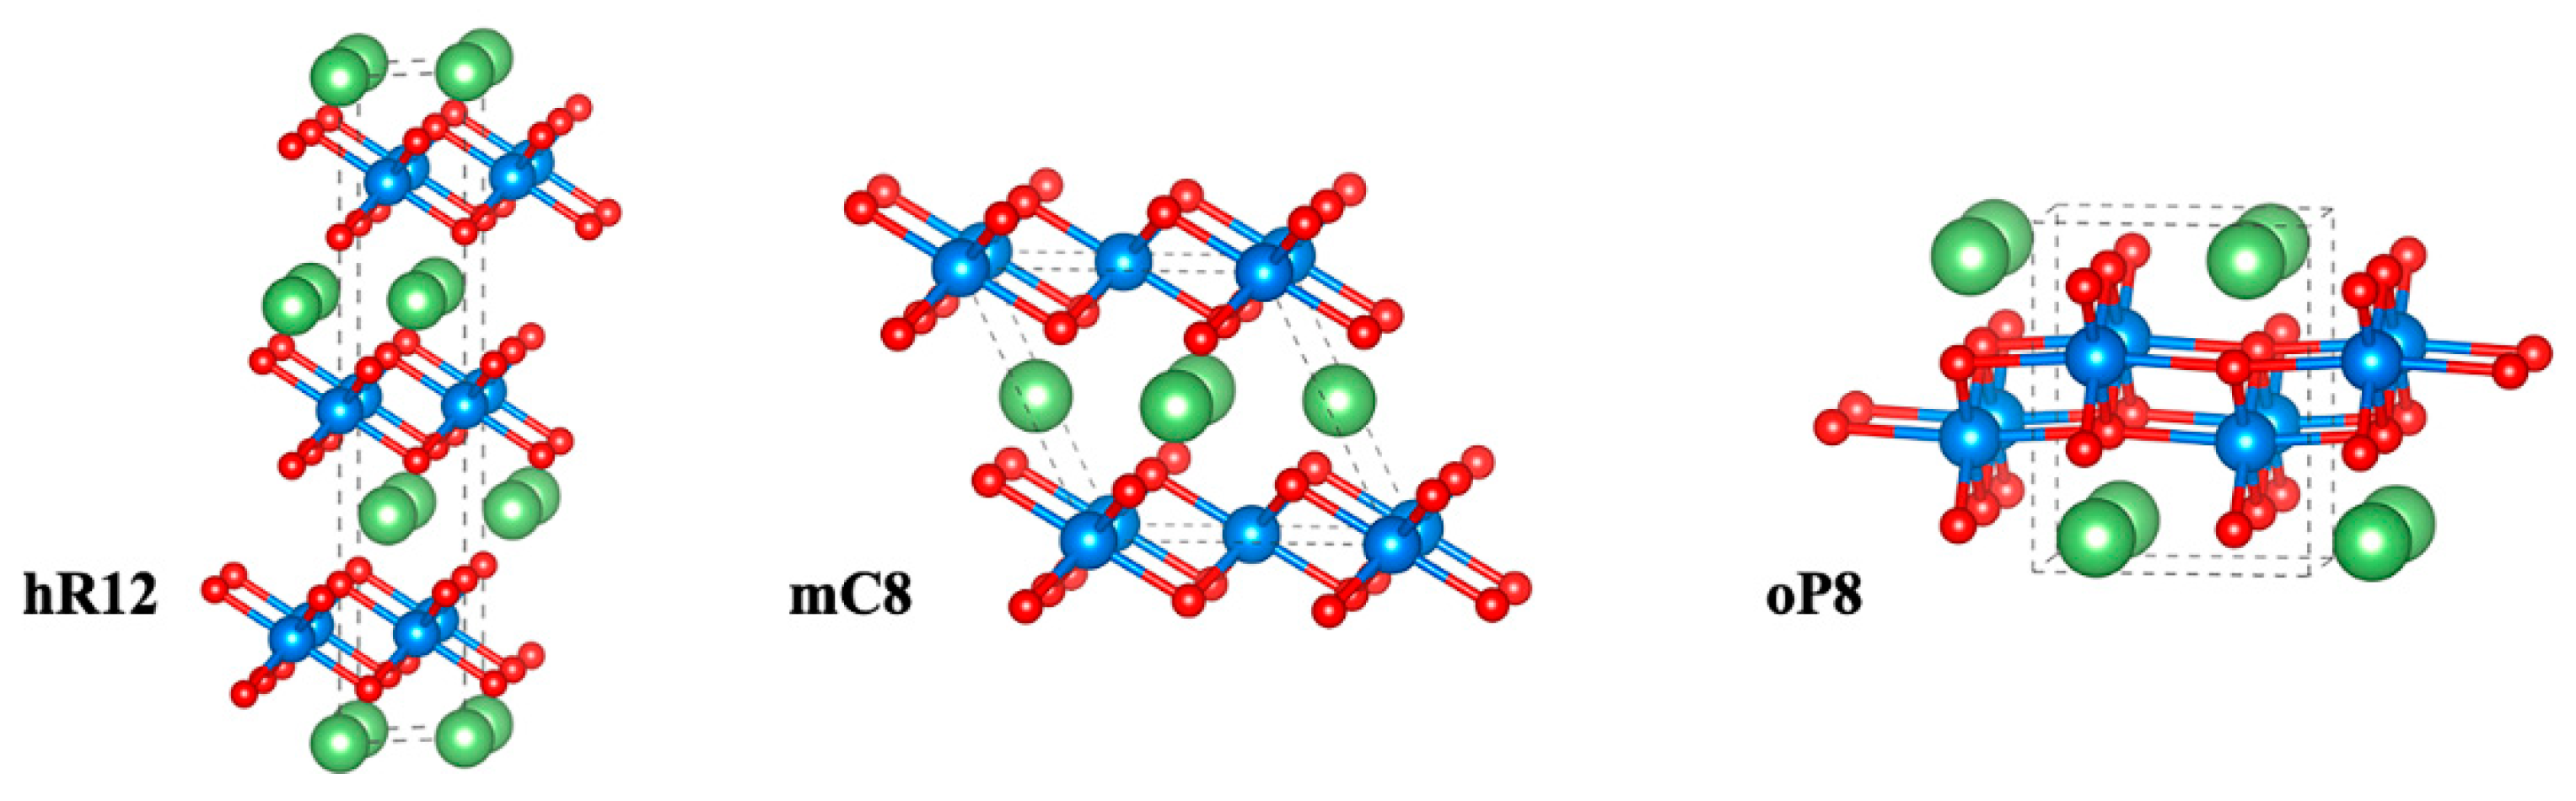
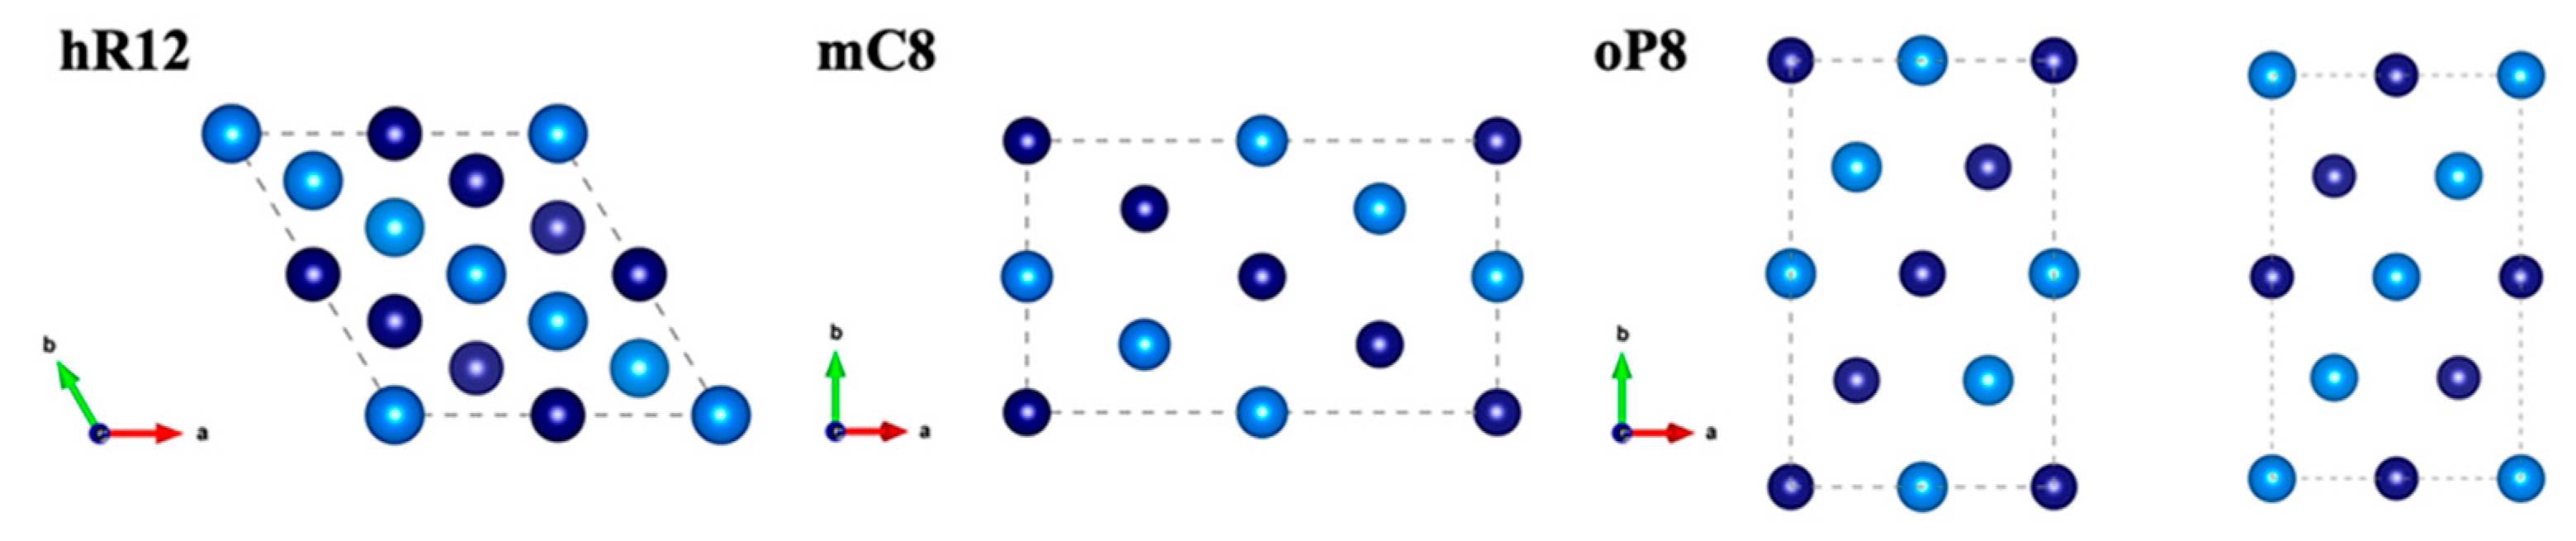
3.1. Structural Analysis

Experimentally, LiCoO2 crystallizes in a rhombohedral (hR12) structure belonging to the R3 ̅m space group [6,32], with a α-NaFeO2-type structure (or O3-type), consisting of layers of Co3+-based edge-sharing CoO6 octahedra, separated by layers of Li+, where the oxygen planes have an ABCABC stacking sequences.
LiNiO2 is known to crystalize both in the hR12 structure (R3 ̅m space group) and in a metastable monoclinic (mC8) structure, at low temperature, belonging to the C2/m space group [7,33,34,35,36]. This polymorphism is induced and controlled by preparation conditions [7,33,34]. The hR12 lattice is the same as the α-NaFeO2-type, whereas the monoclinic structure is a α-NaMnO2-type structure. LiNiO2 polymorphs suffer spontaneous antisite mixing between Li+ and Ni3+ ions in the lithium plane [37] and Jahn-Teller distortions associated with the low-spin state [35,36,38].
Finally, LiMnO2 crystalizes in an orthorhombic (oP8) structure belonging to the Pmmn space group, with a α-NaMnO2-type structure, consisting of layers of Mn3+-based edge-sharing MnO6 octahedra, separated by layers of Li+ [8,39]. Under specific synthesis conditions, the LiMnO2 stoichiometry can crystallize in a mC8 metastable lattice [30,40]. Pictorial representations of the hR12, mC8 and oP8 lattice are shown in Figure 1.
In the present computational study, all possible structures for all stoichiometries have been fully relaxed and Table 1 summarizes the obtained structural constants.
LCO experimentally crystallizes in the hR12 structure [6] and the calculated cell parameters demonstrate good agreement with the literature values. The mC8 and oP8 structures are not experimentally stable and thus, no comparison is possible. LMO crystallizes in the oP8 structure [39], but a metastable mC8 structure was obtained by ion-exchange processes starting from the layered α-NaMnO2 precursor [8]. A rhombohedral LMO has not been reported to date. In this case, our results are in good agreement with the literature for both oP8 and mC8 lattices. For LNO, both hR12 and mC8 structures have been observed experimentally [7]: our results are in good agreement with experimental values for the hR12 lattice, while some distortions are observed in the case of the mC8 lattice. These minor deviations may originate from the softness of the adopted mean U value (4 eV) compared to the 6 eV value commonly adopted for nickel oxides [28,29]. However, as (a) the observed volume expansion of the mC8 lattice of the LNO phase below 6% between DFT and experiments and (b) the calculated structure of the hR12 lattice in very close agreement with the experimental benchmark, we conclude that our approach allows one to model lithium nickel mixed oxides with satisfactory accuracy.
From a general perspective, all compounds show slightly expanded cell volumes (+3%) compared to the experimental values. This trend is expected since the GGA (PBE) + U method has been reported to systematically overestimate the TM-O bond distances [41].
For all the experimentally observed structures, the Bulk modulus (B0) values have been evaluated by applying the Birch–Murnaghan equation to fit the changes in the cohesion energy of the various lattices along an isotropic compression/expansion [43]. Computational details about the derivation of the bulk modulus are summarized in the Supplementary Information (Supplementary note 2).
For the hR12 lattice of LCO, the calculated bulk modulus B0 = 1.15 ± 0.03 eVA−3 is in satisfactory agreement with the experimentally available data (B0 = 0.997 eVA−3 [44]). For the other lattices, the LCO bulk moduli are: mC8 B0 = 1.17 ± 0.03 eVA−3; oP8 B0 = 0.82 ± 0.02 eVA−3. The corresponding bulk moduli for LNO (mC8 lattice B0 = 1.01 ± 0.02 eVA−3 hR12 lattice B0 = 0.94 ± 0.02 eVA−3; oP8 lattice B0 = 0.97 ± 0.02 eVA−3) and LMO (oP8 lattice B0 = 0.93 ± 0.02 eVA−3; mC8 lattice B0 = 1.00 ± 0.03 eVA−3; hR12 lattice B0 = 0.90 ± 0.02 eVA−3) cannot be compared with experiments due to lack of previous determinations [14]. It is worth noting that the energy vs. volume plots shown in the Supplementary Information suggest that mC8 and hR12 lattices for LMO and LNO, respectively, are not high-pressure polymorphs of the ground state oP8 and mC8 structures, due to the lack on any possible tangent line between the corresponding Birch–Murnaghan equation fits. This unavoidably implies that their formation is driven by the crystal growth kinetics in specific synthesis conditions at high temperature.

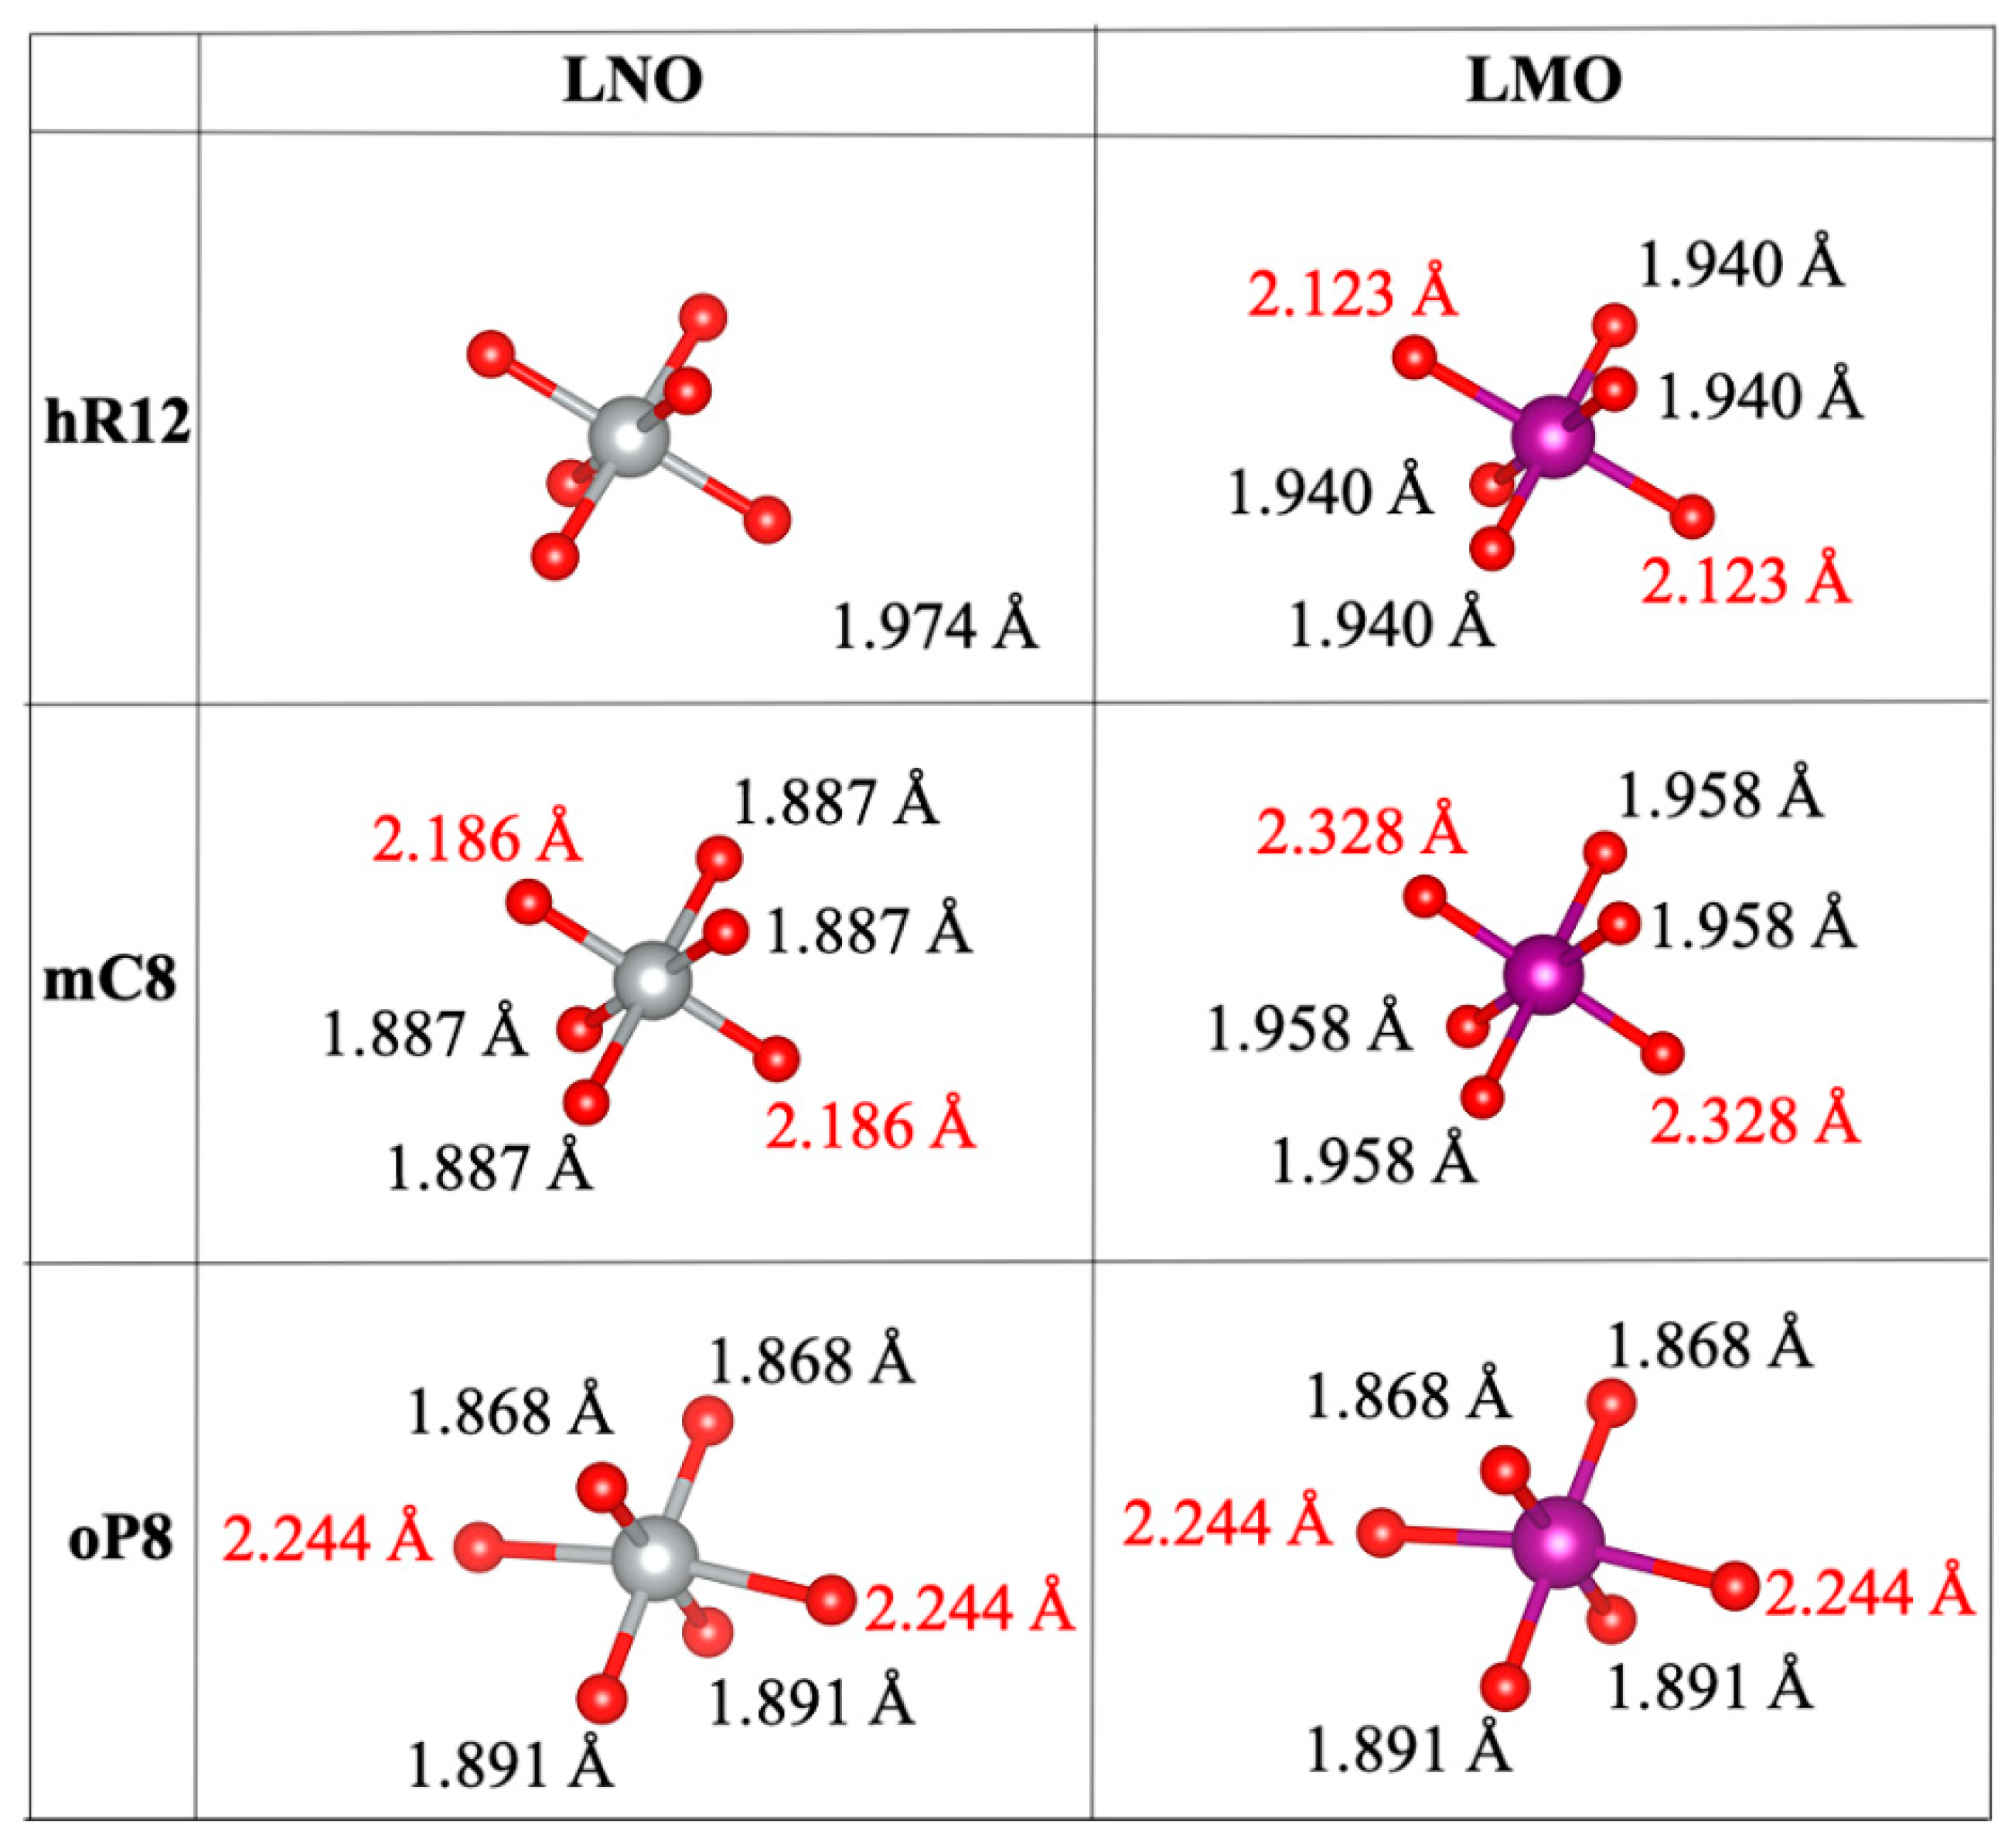
3.2. Bond Distances and Jahn-Teller Distortions

The structures of all the hR12, mC8, and oP8 lattices are constituted qualitatively by layers of TMO6 octahedra stacked along the c-axis and alternated by layers of lithium ions. TM-O bond distances in the MO6 octahedra are reported in the Supplementary Information (Table S1) for the LCO, LNO and LMO compounds in the three hR12, mC8, oP8 lattices together with the available experimental data [37,45,46,47,48]. Overall, good agreement is found between the experimental results and our DFT + U computational modeling, with the computational precision being smaller than ± 2.6%.
The electronic configuration of Co3+ ions cannot cause JT distortions, and therefore, all CoO6 bond distortions are induced by the symmetry of cells. On the other hand, due to their electronic configurations, Ni3+ and Mn3+ can cause JT distortions [45]. These ions all have an octahedral symmetry and the partial occupancy of frontier orbitals causes JT distortion, leading to an increase in the oxygen-metal bond length. In one type of JT distortion, the symmetry between occupied and empty levels is broken by an increase in two of the metal-oxygen bonds along the dz2 orbital: usually, the axial bond length increases and the four equatorial bond lengths decrease [46]. Our calculations nicely model JT-distortions in the LNO and LMO lattices in the M/O and R/M/O lattices, respectively. The NiO6 and MnO6 octahedra are shown in Figure 3—the JT distortions are highlighted.
It is widely known that Mn3+ ions likely induce J-T distortions in oxides [47]. Our computational approach nicely matches the occurrence of these structural distortions in all hR12, oP8 and mC8 lattices and the bond lengths in the MnO6 octahedra nicely agree with the literature values.
Turning to LNO, our calculations suggest the occurrence of JT distortion of the NiO6 octahedra in the mC8 lattice is in close agreement with the experimental observations by EXAFS [36,48] and neutron diffraction [37]. On the contrary, in the hR12 lattice, the NiO6 octahedra are highly symmetric in agreement with the available literature [49].

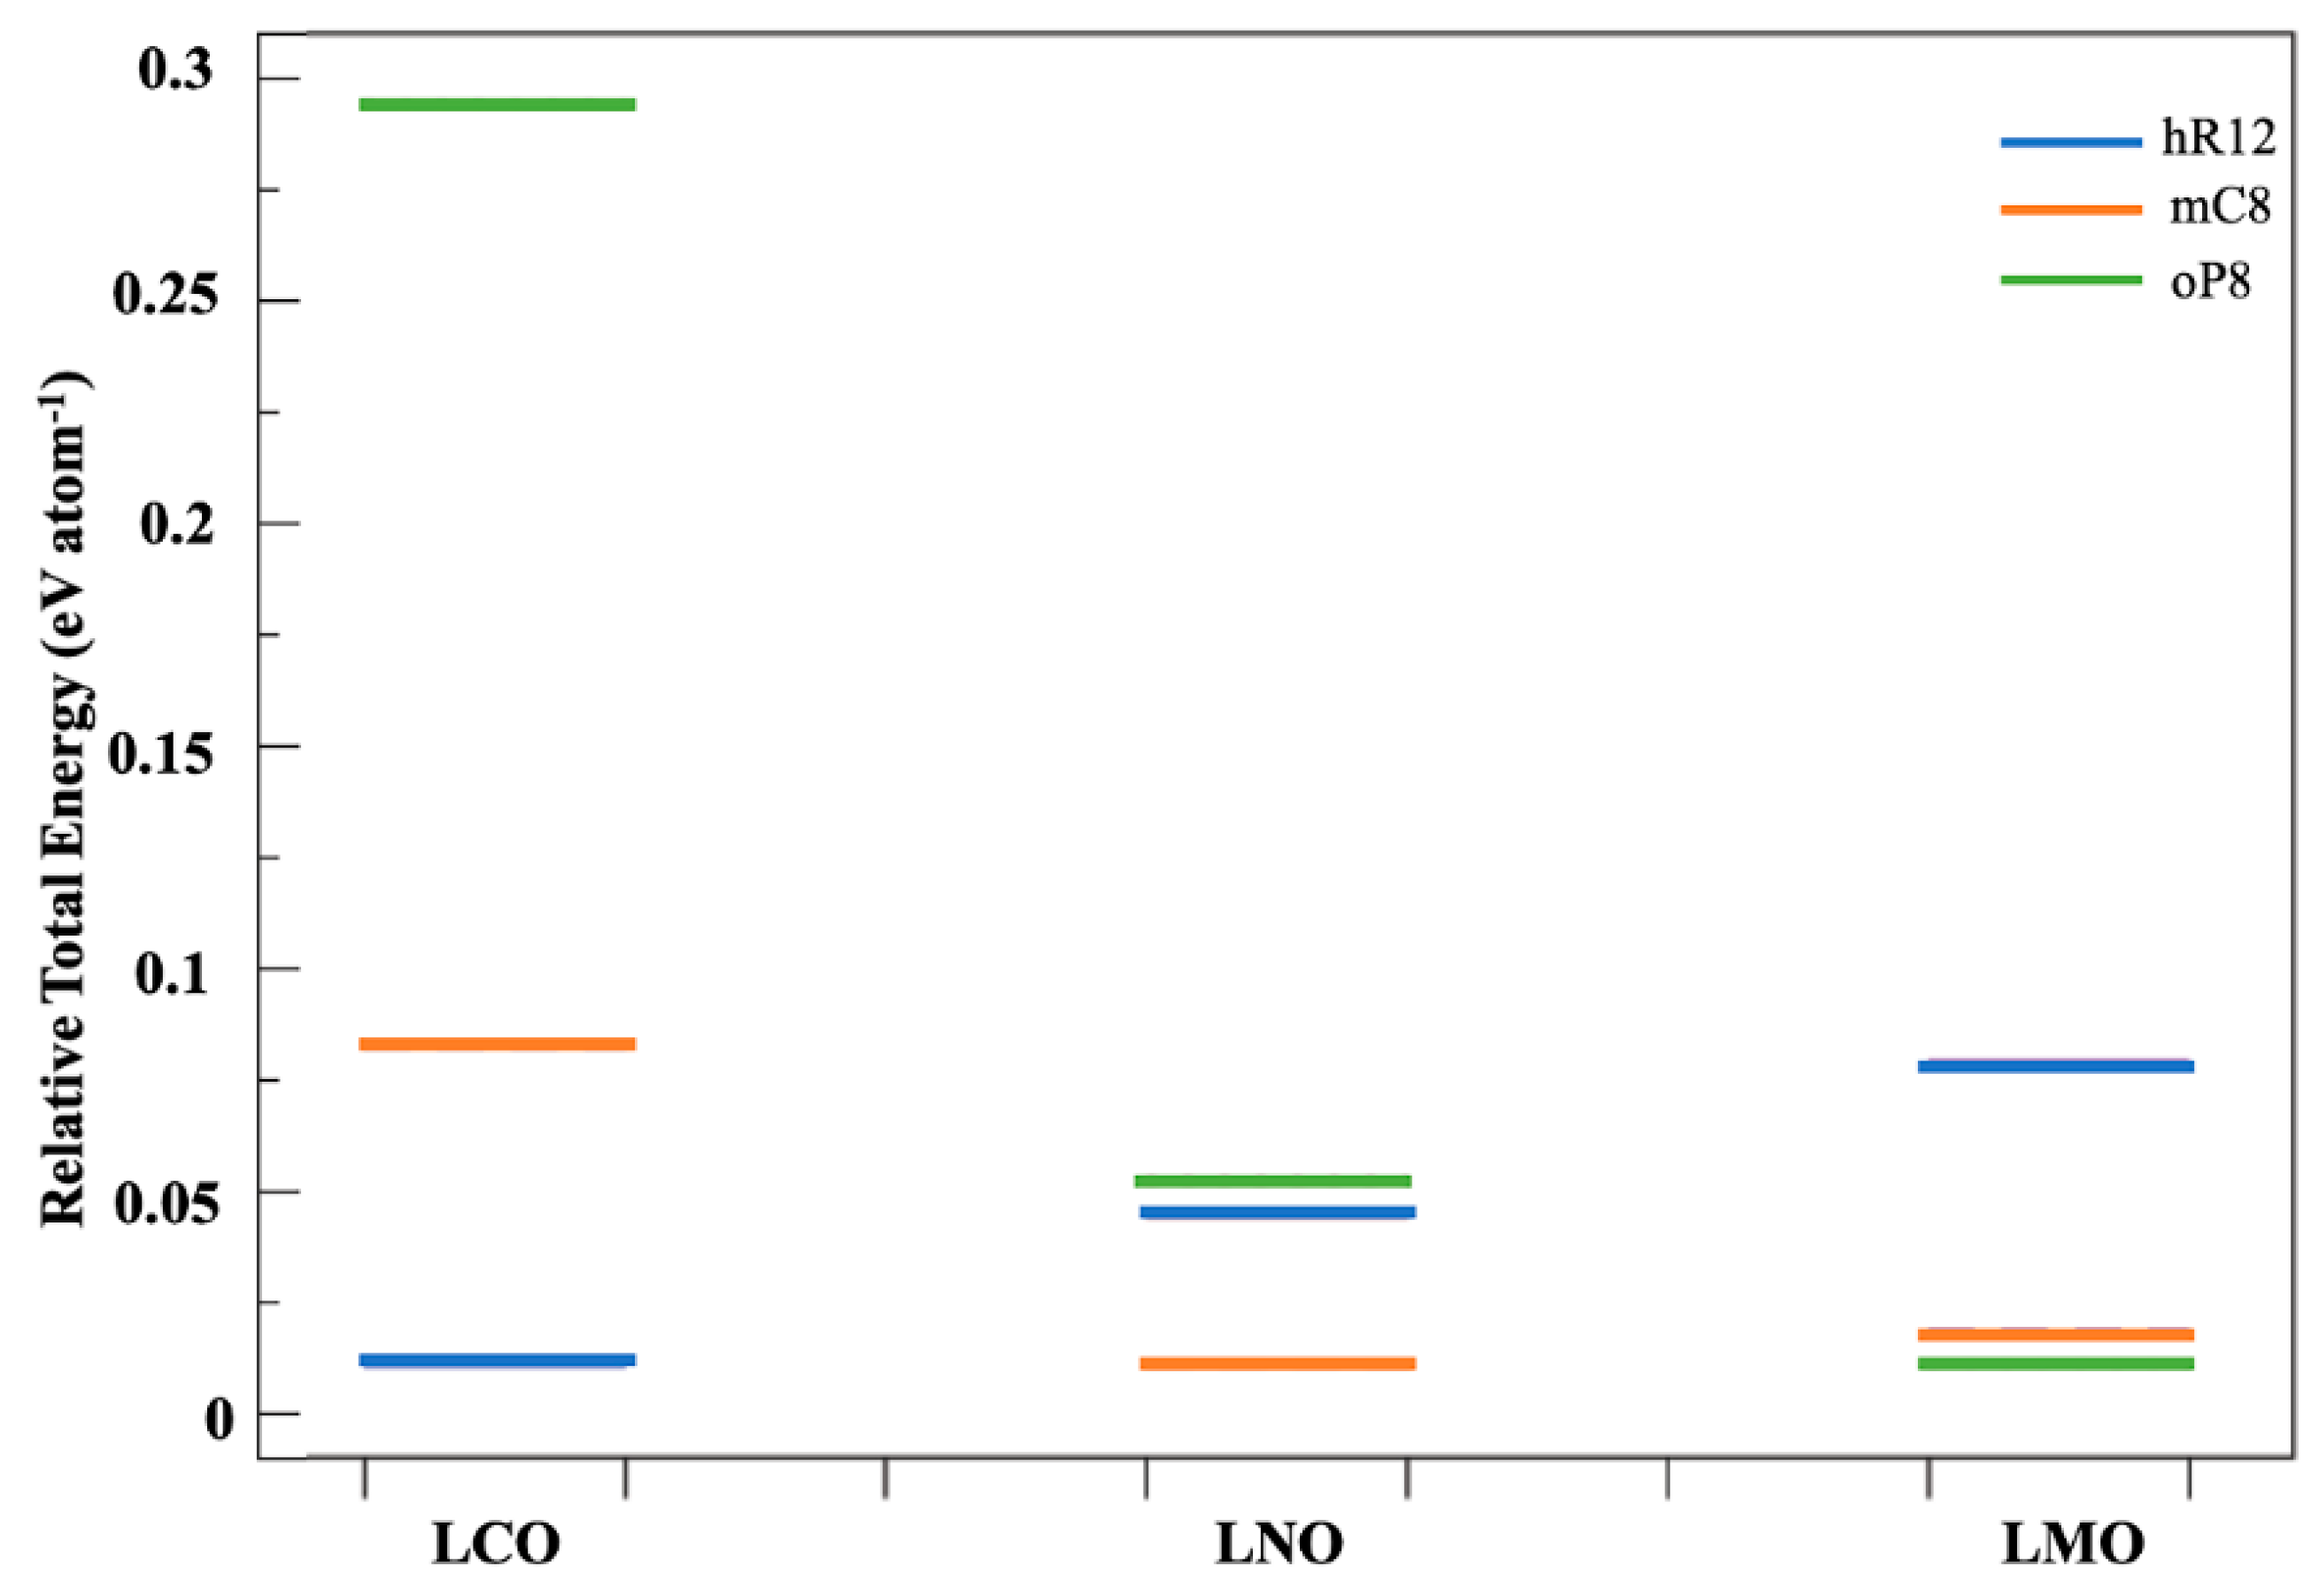
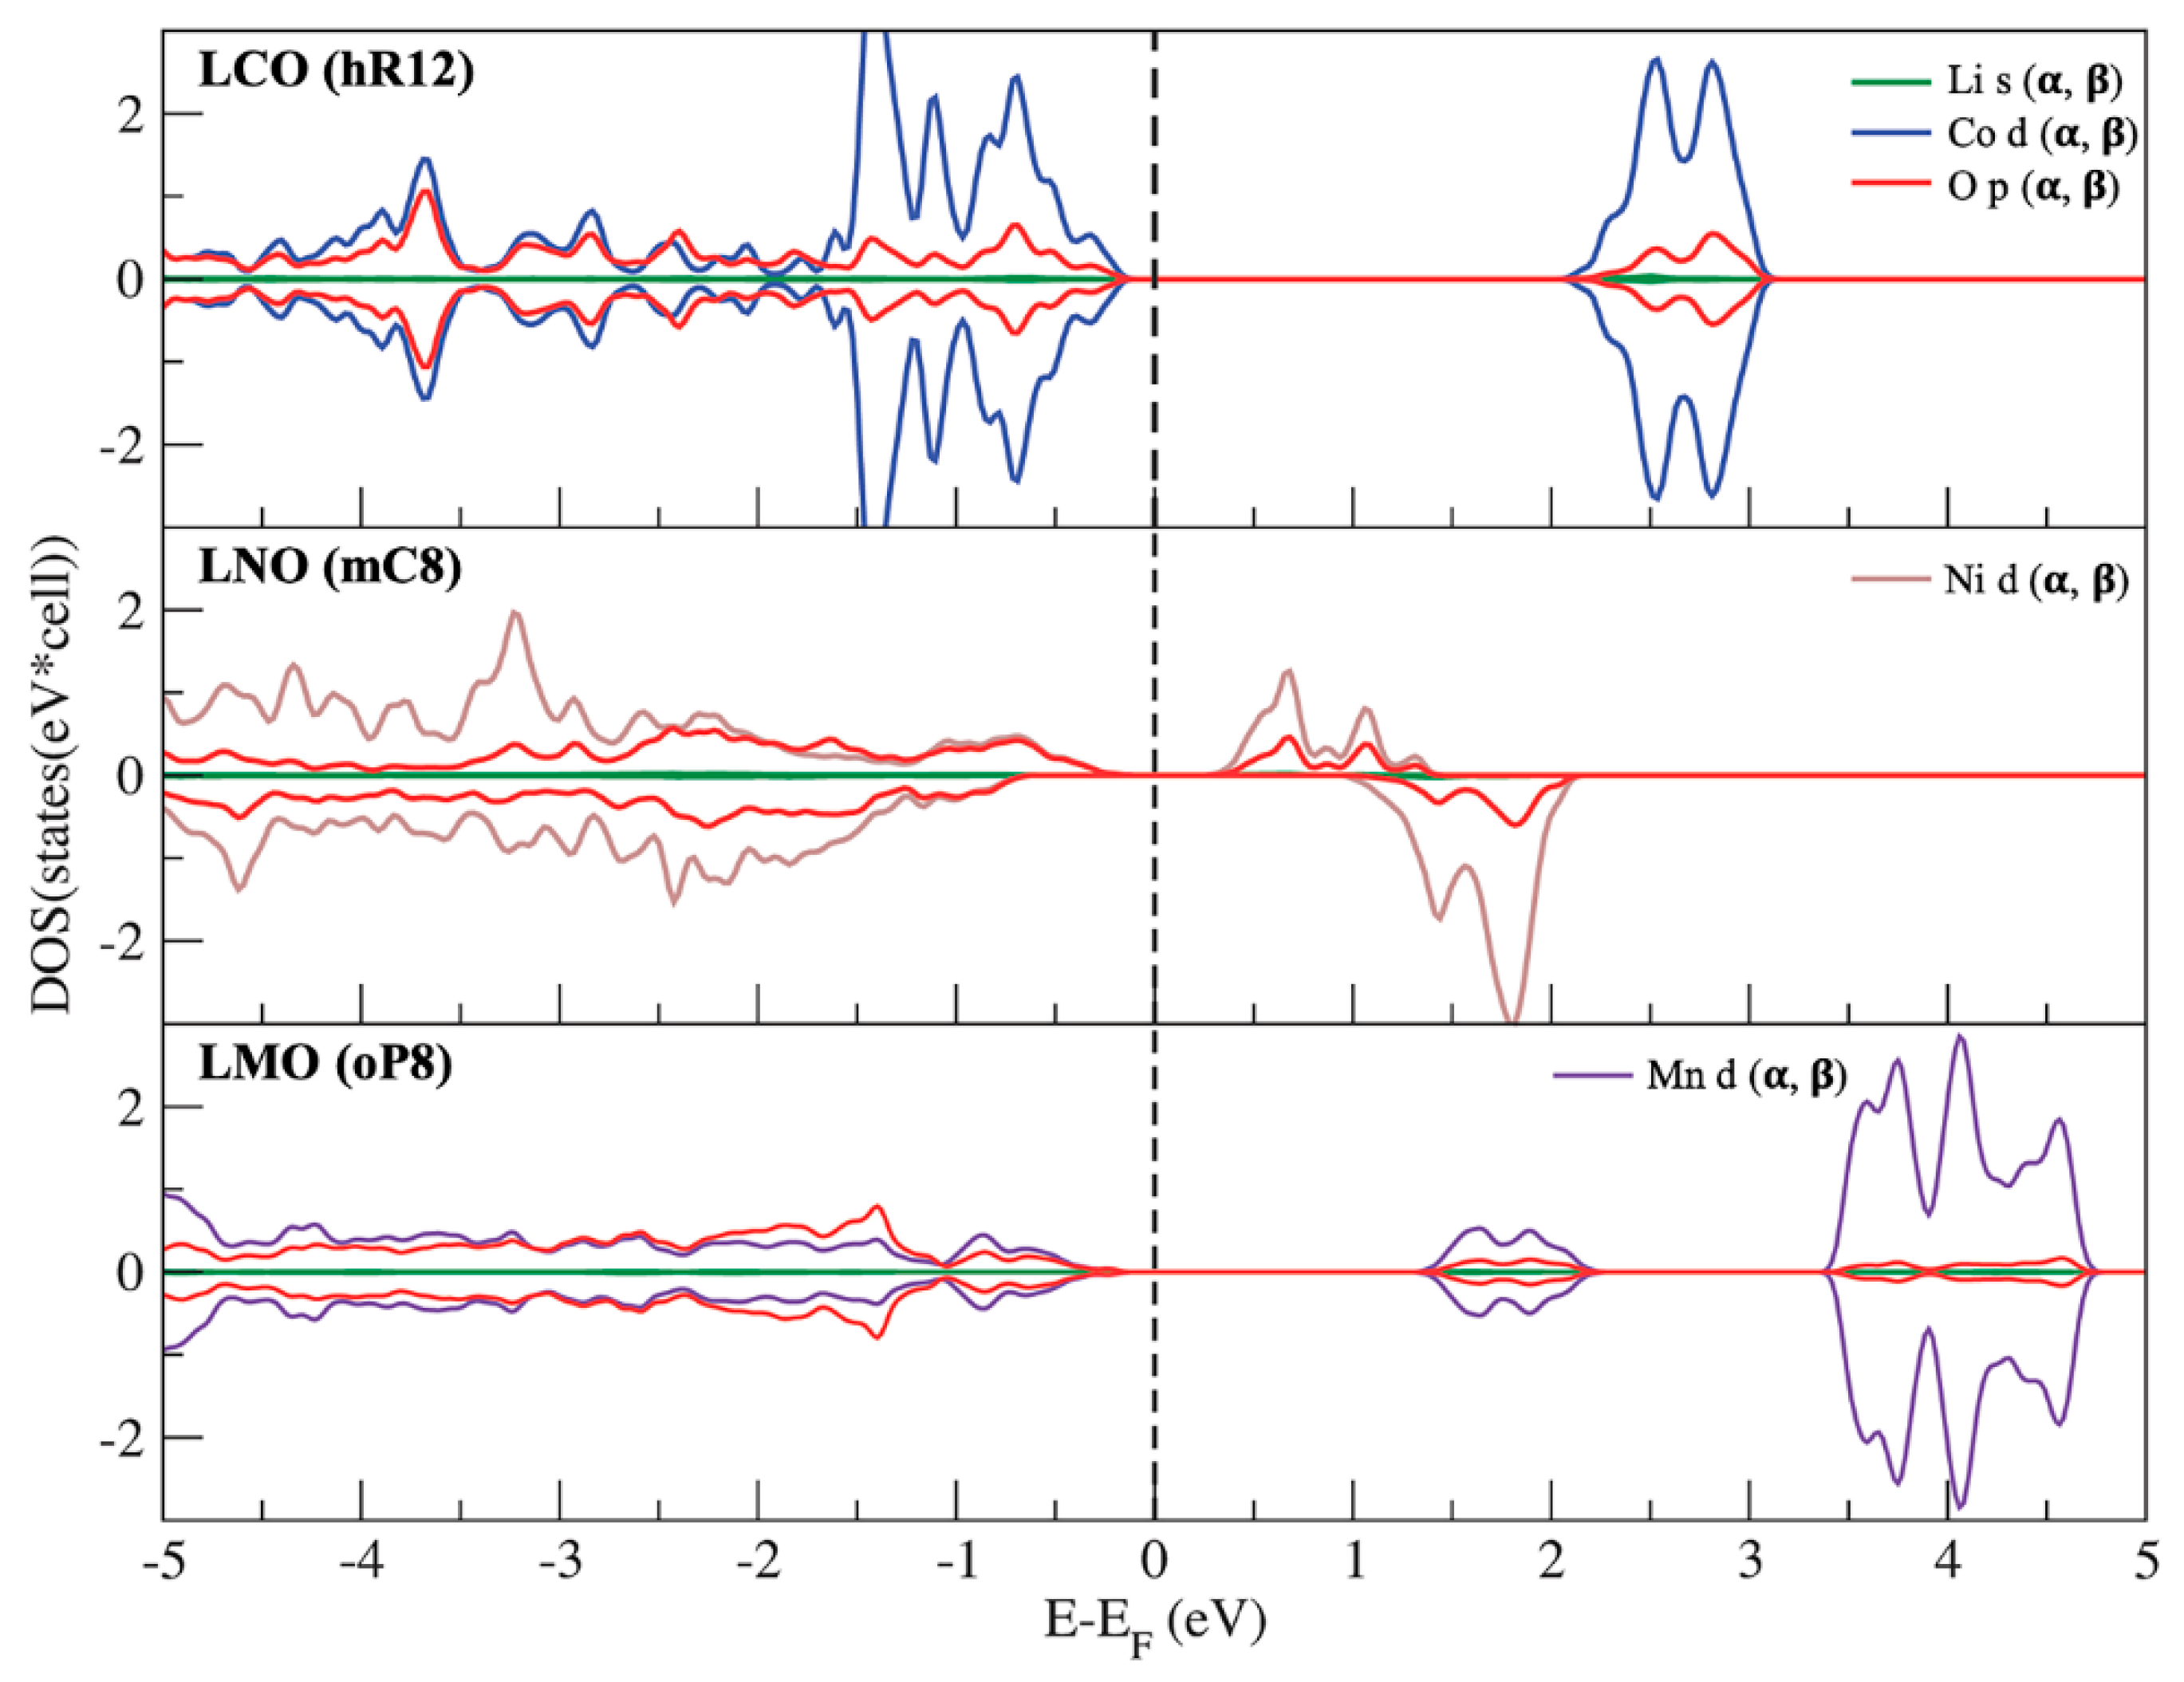
3.3. Phase Stability and Electronic Structures of the Ground States

For each composition, the relative phase stability among lattices can be evaluated by comparing the cohesion energy of all crystal structures. The cohesion energy, ΔcohE, of a compound with stoichiometric formula AxByCz is defined by Equations (1) and (2) with respect to the isolated constituent atoms A, B and C:
xA(g) + yB(g) + zC(g) →AxByCz(solid)
ΔcohE(AxByCz) = Etot(AxByCz)–(x· Etot(A)+ y· Etot(B)+ y· Etot(C))
where x, y, and z are the stoichiometric coefficients of the formula unit of the AxByCz compound and Etot values are the electronic total energies calculated at the DFT + U level of theory for all species. The calculated cohesion energies for all lattices and stoichiometries are listed in Table 2.
The relative stabilities of the lattices are shown in the Figure 4 for the three different compounds.
Our calculations suggest that the ground-state structures are hR12, mC8 and oP8 for LCO, LNO and LMO. Our findings are in agreement with the available literature [35,42,50].
In the case of the LCO stoichiometry, the mC8 and oP8 polymorphs are higher in total energy—about 0.172 and 0.671 eV atom−1. In the case of LNO, the three lattices are very close in energy, with the hR12 and oP8 polymorphs having higher energies of about 0.093 and 0.095 eV atom−1. It is interesting to note that although the oP8 lattice is only 2 meV atom−1 above the hR12 lattice, it has never been reported experimentally as a metastable phase. Turning to LMO, the experimentally observed metastable mC8 phase is only 16 meV atom−1 higher in energy compared to the ground-state oP8 lattice, whereas the hR12 polymorph is less stable—about 0.164 eV atom−1. Overall, only small energy differences are observed between ground-state structures and the closest metastable ones, particularly for LNO and LMO. In light of this, detailed phonon structures would allow for improved accuracy of these determination by incorporating zero-point energies. However, as the relative stability of the various polymorphs obtained by our DFT calculations are in perfect agreement with the experimental results, we suggest that vibration contributions may alter only marginally the here-reported phase stability plot.
The electronic structures for LCO, LNO and LMO ground-state structures, hR12, mC8 and oP8, respectively, are shown in Figure 5, where the spin-, angular-momentum- and atom-projected density of states (PDOS) are represented. The PDOS plots for metastable structures are shown in Supplementary Figures S2–S4.
For LCO in the hR12 lattice, we observe strong hybridization between Co−3 d and O-2 p and we can further note that the t2 g band of Co is completely occupied in both spin channels, while eg is unoccupied, reflecting a low-spin (LS) state of Co. The analysis of the magnetic properties suggests a local magnetic moment on Co sites of 0.00 μB. These results are in line with the consensus in the literature (all Co ions are in the 3+ oxidation state in the LS electronic configuration, i.e., t2g6 (|↑↓|↑↓|↑↓|) eg0 (| | |), leading to an overall diamagnetic character [36]). The computed bandgap of the LCO phase in hR12 structure is 2.36 eV. The bandgap for the hR12 lattice is in good agreement with the available literature data (2.1–2.7 eV) [51].
For LNO in the mC8 structure, we observe a strong hybridization between Ni-3d and O-2p. Further, we note that the t2g band of Ni is completely occupied in both spin channels, while eg up channel is partially occupied, reflecting the LS state of Ni. The mC8 lattice has a small gap insulator being the CB →VB gap 0.30 eV (i.e., conduction band CB and valence band VB). The calculated local magnetic moment on Ni sites in the mC8 lattice is 0.86 μB, a value in line with the LS state of Ni3+ ions. Our picture is in line with the available literature [35]: all the Ni ions are in the 3+ oxidation state in the LS electronic configuration—for Ni3+ it is t2g6 (|↑↓|↑↓|↑↓|) eg1(|↑ | ). This picture matches well with the Jahn-Teller (J-T) distortion observed in the NiO6 octahedra where two different Ni-O bonds lengths can be observed in the converged mC8 structure (see Table 2 above), in agreement with literature [36,37]. Turning to LMO in the oP8 structure, we observe strong hybridization between Mn-d and O-2p. The computed band-gap value is 1.614 eV, a value in line with the available literature data, i.e., 1.68 eV [52]. The calculated local magnetic moment on Mn sites is 3.84 μB, thus reflecting the High Spin (HS) state of Mn3+ ions. Our modeling agrees well with the assessed consensus about the electronic properties of monoclinic LMO. In fact, it is generally accepted that all the Mn ions are in the 3+ oxidation state in the HS electronic configuration, which for Mn3+ is t2g3(|↑ |↑ |↑ |) eg1(|↑ | |) [30,31,52,53]. Here again, the electronic configuration generates J-T distortion, with two different Mn-O bonds lengths, as already discussed in the previous section (see Table 2) [30,31].

4. Discussion

The electronic structure calculations for the LCO, LMO and LNO phases provide a detailed description of the bonding character and structure of these compounds in three different polymorphic lattices. These data are in good agreement with the available literature concerning crystallographic structures, JT distortions, electronic and magnetic properties as well as relative phase stability. By using simple thermochemical cycles, it is possible to derive the Gibbs energy of formation at 0 K for all the modelled phases and thus to draw a thermodynamic description of the relative energetics of the competitive hR12, mC8 and oP8 lattices for all the compounds. In fact, ΔcohE derived from first principles calculations can be combined with other similar computational data or literature values to derive Gibbs Energy of Formation of crystalline phases.
For solid-state transformations involving no gaseous species, the Gibbs energy change ΔG can be calculated from the change in internal energy (ΔE) calculated at 0 K simply by using the relation (ΔG = ΔE + PΔV – TΔS). In fact, vibrational contributions (zero-point energy and phonons) are partially compensated in all-solid reactions between reagents and products, thus leading to negligible net energetic effects (see also the above comments about the zero-point energy). Furthermore, at 0 K, the (PΔV – TΔS) can be neglected without introducing large inaccuracies. ΔE is in the order of few eV per formula unit, whereas PΔV in the order of 10−25 eV and the term TΔS is in the order of the thermal energy (≈ 0.1 – 0.001 eV/at), which is, by definition, null at 0 K.
Thermodynamic formation properties can be derived for all LCO, LMO and LNO phases in all the three hR12, mC8 and oP8 lattices by computing the reaction internal energy changes for the following four chemical reactions:
CoO + Li2O → LiCoO2 + Li
NiO + Li2O → LiNiO2 + Li
MnO + Li2O → LiMnO2 + Li
Mn2O3 + Li2O → 2 LiMnO2
by applying the following thermochemical equations:
ΔE3E = ΔcohELiCoO2 + ΔcohELi − ΔcohECoO − ΔcohELi2O
ΔE4E = ΔcohELiNiO2 + ΔcohELi − ΔcohENiO − ΔcohELi2O
ΔE5E = ΔcohELiMnO2 + ΔcohELi − ΔcohEMnO − ΔcohELi2O
ΔE6E) = 2ΔcohELiMnO2 − ΔcohEMn2O3 − ΔcohELi2O
where ΔcohELiCoO2, ΔcohELiNiO2 and ΔcohELiMnO2 are the cohesion energies of LCO, LNO and LMO in any lattice, respectively, ΔcohELi is the cohesion energy of cubic metallic Li, ΔcohECoO, ΔcohENiO and ΔcohEMnO are the total energies of metal oxides CoO, NiO and MnO, respectively, ΔcohELiO2 is the cohesion energy of the Li2O oxide, and ΔcohEMn2O3 is the cohesion energy of the α-Mn2O3 phase. All cohesion energies of oxides and metallic lithium have been calculated at the same level of theory as for LCO, LNO and LMO, and relaxing all the crystal structures to their energy minimum. A survey of the structures of all these compounds and the computed cohesion energies (eV atom−1) for all phases are summarized in Table S1, in the Supporting Information. The resulting values for the energy changes of reactions E3–E6 are reported in Table 3 for all the polymorphs of the LCO, LMO and LNO compounds.
The ΔE values reported in the Table 4 can be easily combined with literature thermochemical data [54,55,56,57,58,59,60,61] reported in the Supplementary Material (Table S2) to derive the formation energy from elements (Table S3). To derive the formation thermodynamics at room temperature, thermal effects and formation entropies at 298 K are necessary. Unfortunately, apart the case of rhombohedral LCO [61,62], low-temperature heat capacities are unavailable for all mixed oxides. Therefore, we estimated absolute entropies at 298 K for the three mixed oxides LCO, LNO and LMO as means among values obtained by: (a) the semiempirical ionic contribution method by Kellogg and Kubaschewski [63], (b) the semiempirical Neumann–Kopp model [64], (c) the computational estimates from phonon calculations by DFT [12] and (d) the unique experimental value for rhombohedral LCO [61]. Similarly, thermal effects at 298 K have been estimated by adopting the Kellogg and Kubaschewski semiempirical model [63]. Because the semiempirical models were unsensitive towards the crystal structure, we adopted identical thermal effects and absolute entropies (Table S4) to derive formation enthalpies and free energies at 298 K for all polymorphs of a given composition (see Table 4; Table 5 below).
The assessed values reported in the literature of the experimental Gibbs energy of formation for the LCO, LNO and LMO phases in the hR12, mC8, oP8 lattices, respectively, are −632 ± 8, −532 ± 8 and 782 ± 8 [13,54,62,65,66,67] and our computational determinations are in good agreement in all the three cases, with the largest difference between computational and experimental determination below 6%. On passing, one may comment that possible sources of inaccuracies in our computational estimates are (a) the thermodynamic supplementary data, largely estimated, and (b) the adopted DFT + U computational approach where a mean U value is adopted for all metals. This last choice surely affects the final precision, particularly in the case of Ni and Co phases (see above). Thermodynamic predictions closer to experimental values are possibly achievable by adopting different U values for each metal. However, this approach is beyond our adopted methodology that, overall, can provide thermodynamic evaluations with satisfactory precision.
Turning to the thermodynamics of the metastable lattices, both considering the experimentally reported values and those not observed, our values are the first-ever reported determination of the thermochemical data of formation. We want to stress that these new data are necessary requirements for multi-element system assessment and pseudo-binary/ternary/quaternary phase diagram modelling [16,17,18,19,20]. This kind of advanced modeling is necessary for a careful analysis of the synthesis conditions of similar materials, for the comprehension of the degradation chemistry at high temperature or under reactive conditions, and also for the understanding of the structural evolution in batteries upon electrochemical lithium de-intercalation/intercalation.

5. Conclusions

In this work, we have investigated three TM oxide layered materials LiCoO2, LiNiO2 and LiMnO2 using first principle calculations, considering different lattices: rhombohedral, monoclinic and orthorhombic with R3 ̅m, C2/m and Pmmn symmetries, respectively. We have addressed structural, electronic and magnetic properties for each compound. Our analysis describes the structural features of all these phases in detail, their relative stabilities and their electronic properties, in terms of band gap, oxidation state of the transition metal and JT distortion. The obtained description of the bonding and structural properties of the modelled phases is in excellent agreement with the available experimental literature and effectively predict the relative stability of the ground state and metastable phases.
We have determined and discussed—for the first time in the literature—the thermodynamics of formation for all ground and metastable phases of LCO, LNO and LMO. The final Gibbs Energy of Formation values at 298 K from elements are: LCO(hR12) −672 ± 8 kJ mol−1; LCO(mC8) −655 ± 8 kJ mol−1; LCO(oP8) −607 ± 8 kJ mol−1; LNO(hR12) −548 ± 8 kJ mol−1; LNO(mC8) −557 ± 8 kJ mol−1; LNO(oP8) −548 ± 8 kJ mol−1; LMO(hR12) −765 ± 10 kJ mol−1; LMO(mC8) −779 ± 10 kJ mol−1; LMO(oP8) −780 ± 10 kJ mol−1. These values are of fundamental importance for the implementation of reliable multi-phase thermodynamic modelling, for the optimization of the synthesis condition, and for understanding the structural degradation processes in real applications (e.g., lithium-ion batteries).

Supplementary Materials

The following are available online at https://www.mdpi.com/2073-4352/10/6/526/s1, Supplementary note 1. Details about the structure and magnetic properties of transition metal oxides, Li2O and metallic lithium; Supplementary note 2. Bulk modulus calculation; Figure S1: Bulk modulus of LMO, LNO and LCO estimated for all structures; Figure S2: PDOS of LCO compound for mC8 and oP8 structures. Upper panel monoclinic electronic structure of LCO (mC8) and bottom panel orthorhombic electronic structure of LCO (oP8). Color Code: Li green, Co blue, O red. Figure S3: PDOS of LNO compound for hR12 and oP8 structures. Upper panel rhombohedral electronic structure of LNO (hR12) and bottom panel orthorhombic electronic structure of LNO (oP8). Figure S4: PDOS of LMO compound for hR12 and mC8 structures. Upper panel rhombohedral electronic structure of LMO (hR12) and bottom panel monoclinic electronic structure of LMO (mC8). Figure S5: (a) Dingle unit cell of TMs oxide, CoO, NiO and MnO that present cubic structures belonging to F m 3 ¯ m space group. (b) AFM structure of TMs oxide, that are made of alternatively packed ferromagnetic (111) planes along the [1·1·1] direction of the cubic cell. Color code: (a) blue Co, grey Ni, purple Mn, red O; (b) spin up blue, spin down light blue. Figure S6: (a) α-Mn2O3 2 × 2 × 2 supercell. (b) AFM structure of TM oxide. Color code: (a) purple Mn, red O; (b) spin up blue, spin down light blue. Figure S7: Cubic structure of (a) Li2O and (b) Li. Color Code: green Li, red O. Table S1. Calculated bond lengths for LCO [45], LNO [46,47] and LMO [37,48] for all lattices; inter parentheses are reported the corresponding values from experimental structures, where available. Table S2: Computed Cohesion energies (eV/at) for all ground state lattice/phase. Table S2: Energies of formation form the elements at T = 298 K, TMs oxide and Li2O [5,6] Table S3: Calculated Energy of formation at 0K from elements for all the polymorphs (hR12, mC8 and oP8) of the LCO, LMO and LNO compounds. Table S4: Experimental and estimated absolute entropies at 298K and thermal effects at 298 K for the LCO, LMO and LNO compounds.

Author Contributions

Conceptualization, S.B.; methodology, A.B.M.-G.; software, M.P.; validation, A.P., and O.P.; formal analysis, S.B.; investigation, M.T.; resources, S.B.; data curation, M.T. and S.B.; writing—original draft preparation, M.T. and S.B.; writing—review and editing, A.P. and M.P.; visualization, O.P.; supervision, A.B.M.-G.; project administration, S.B.; funding acquisition, A.P. All authors have read and agreed to the published version of the manuscript.

Funding

This research has received funding from the European Union’s Horizon 2020 research and innovation program under grant agreement No 814464 and CINECA grants project IsC76 account ID: HP 10 CH9G4K.

Conflicts of Interest

The authors declare no conflict of interest.

References

  1. Zhang, H.; Li, C.; Eshetu, G.G.; Laruelle, S.; Grugeon, S.; Zaghib, K.; Julien, C.; Mauger, A.; Guyomard, D.; Rojo, T.; et al. From Solid-Solution Electrodes and the Rocking-Chair Concept to Today’s Batteries. Angew. Chem. Int. Ed. 2020, 59, 534–538. [Google Scholar] [CrossRef] [PubMed]
  2. Budde-Meiwes, H.; Drillkens, J.; Lunz, B.; Muennix, J.; Rothgang, S.; Kowal, J.; Sauer, D.U. A review of current automotive battery technology and future prospects. Proc. Inst. Mech. Eng. Part D J. Automob. Eng. 2013, 227, 761–776. [Google Scholar] [CrossRef]
  3. Majeau-Bettez, G.; Hawkins, T.R.; StrØmman, A.H. Life cycle environmental assessment of lithium-ion and nickel metal hydride batteries for plug-in hybrid and battery electric vehicles. Environ. Sci. Technol. 2011, 45, 4548–4554. [Google Scholar] [CrossRef]
  4. Scrosati, B.; Garche, J. Lithium batteries: Status, prospects and future. J. Power Sources 2010, 195, 2419–2430. [Google Scholar] [CrossRef]
  5. Larcher, D.; Tarascon, J.-M. Towards greener and more sustainable batteries for electrical energy storage. Nat. Chem. 2014, 7, 19–29. [Google Scholar] [CrossRef]
  6. Mizushima, K.; Jones, P.C.; Wiseman, P.J.; Goodenough, J.B. LixCoO2 (0 < x ≤1): A new cathode material for batteries of high energy density. Solid State Ionics 1981, 3, 171–174. [Google Scholar]
  7. Bianchini, M.; Roca-Ayats, M.; Hartmann, P.; Brezesinski, T.; Janek, J. There and Back Again—The Journey of LiNiO2 as a Cathode Active Material. Angew. Chem. Int. Ed. 2019, 58, 10434–10458. [Google Scholar] [CrossRef] [PubMed]
  8. Armstrong, A.R.; Bruce, P.G. Synthesis of layered LiMnO2 as an electrode for rechargeable lithium batteries. Nature 1996, 381, 499–500. [Google Scholar] [CrossRef]
  9. Li, T.; Yuan, X.-Z.; Zhang, L.; Song, D.; Shi, K.; Bock, C. Degradation Mechanisms and Mitigation Strategies of Nickel-Rich NMC-Based Lithium-Ion Batteries. Electrochem. Energy Rev. 2019, 3, 43–80. [Google Scholar] [CrossRef] [Green Version]
  10. Lee, W.; Muhammad, S.; Sergey, C.; Lee, H.; Yoon, J.; Kang, Y.; Yoon, W. Advances in the Cathode Materials for Lithium Rechargeable Batteries. Angew. Chem. Int. Ed. 2020, 59, 2578–2605. [Google Scholar] [CrossRef]
  11. Saubanere, M.; McCalla, E.; Tarascon, J.-M.; Doublet, M.-L. The intriguing question of anionic redox in high-energy density cathodes for Li-ion batteries. Energy Environ. Sci. 2016, 9, 984–991. [Google Scholar] [CrossRef]
  12. Du, T.; Xu, B.; Wu, M.; Liu, G.; Ouyang, C. Insight into the Vibrational and Thermodynamic Properties of Layered Lithium Transition-Metal Oxides LiMO 2 (M = Co, Ni, Mn): A First-Principles Study. J. Phys. Chem. C 2016, 120, 5876–5882. [Google Scholar] [CrossRef]
  13. Wang, M.; Navrotsky, A. LiMO2 (M = Mn, Fe, and Co): Energetics, polymorphism and phase transformation. J. Solid State Chem. 2005, 178, 1230–1240. [Google Scholar] [CrossRef]
  14. Yu, Z.; Shang, S.-L.; Gordin, M.L.; Mousharraf, A.; Liu, Z.-K.; Wang, D. Ti-substituted Li[Li 0.26 Mn 0.6-x Ti x Ni 0.07 Co 0.07 ]O 2 layered cathode material with improved structural stability and suppressed voltage fading. J. Mater. Chem. A 2015, 3, 17376–17384. [Google Scholar] [CrossRef]
  15. Koyama, Y.; Arai, H.; Tanaka, I.; Uchimoto, Y.; Ogumi, Z. High temperature defect chemistry in layered lithium transition-metal oxides based on first-principles calculations. J. Power Sources 2013, 244, 592–596. [Google Scholar] [CrossRef]
  16. Brutti, S.; Balducci, G.; Ciccioli, A.; Gigli, G. Thermodynamic assessment of the Yb-Si system. Calphad Comput. Coupling Phase Diagr. Thermochem. 2005, 29, 254–261. [Google Scholar] [CrossRef]
  17. Lalena, J.N.; Cleary, D.A. Principles of Inorganic Materials Design, 2nd ed.; John Wiley and Sons: Hoboken, NJ, USA, 2010; ISBN 9780470404034. [Google Scholar]
  18. Luo, J. Developing Interfacial Phase Diagrams for Applications in Activated Sintering and Beyond: Current Status and Future Directions. J. Am. Ceram. Soc. 2012, 95, 2358–2371. [Google Scholar] [CrossRef]
  19. Jin, L.; Wang, J.; Rousselot, S.; Dollé, M.; Chartrand, P. Experimental and thermodynamic study of Li-O and Li 2O-P 2 O5 systems. Can. J. Chem. Eng. 2019, 97, 2234–2241. [Google Scholar] [CrossRef]
  20. Phan, A.T.; Gheribi, A.E.; Chartrand, P. Modelling of phase equilibria of LiFePO4 -FePO4 olivine join for cathode material. Can. J. Chem. Eng. 2019, 97, 2224–2233. [Google Scholar] [CrossRef]
  21. Perdew, J.P.; Burke, K.; Ernzerhof, M. Generalized gradient approximation made simple. Phys. Rev. Lett. 1996, 77, 3865–3868. [Google Scholar] [CrossRef] [Green Version]
  22. Eyert, V.; Christensen, M.; Wolf, W.; Reith, D.; Mavromaras, A.; Freeman, C.; Wimmer, E. Unravelling the Potential of Density Functional Theory through Integrated Computational Environments: Recent Applications of the Vienna Ab Initio Simulation Package in the MedeA® Software. Computation 2018, 6, 63. [Google Scholar] [CrossRef] [Green Version]
  23. Pavone, M.; Ritzmann, A.M.; Carter, E.A. Quantum-mechanics-based design principles for solid oxide fuel cell cathode materials. Energy Environ. Sci. 2011, 4, 4933–4937. [Google Scholar] [CrossRef]
  24. Dudarev, S.; Botton, G. Electron-energy-loss spectra and the structural stability of nickel oxide: An LSDA+U study. Phys. Rev. B Condens. Matter Mater. Phys. 1998, 57, 1505–1509. [Google Scholar] [CrossRef]
  25. Muñoz-García, A.B.; Pavone, M. Structure and energy level alignment at the dye-electrode interface in p-type DSSCs: New hints on the role of anchoring modes from ab initio calculations. Phys. Chem. Chem. Phys. 2015, 17, 12238–12246. [Google Scholar] [CrossRef]
  26. Muñoz-García, A.B.; Sannino, F.; Vitiello, G.; Pirozzi, D.; Minieri, L.; Aronne, A.; Pernice, P.; Pavone, M.; D’Errico, G. Origin and Electronic Features of Reactive Oxygen Species at Hybrid Zirconia-Acetylacetonate Interfaces. ACS Appl. Mater. Interfaces 2015, 7, 21662–21667. [Google Scholar] [CrossRef]
  27. Muñoz-García, A.B.; Tuccillo, M.; Pavone, M. Computational design of cobalt-free mixed proton-electron conductors for solid oxide electrochemical cells. J. Mater. Chem. A 2017, 5, 11825–11833. [Google Scholar] [CrossRef]
  28. Wang, L.; Maxisch, T.; Ceder, G. Oxidation energies of transition metal oxides within the GGA+ U framework. Phys. Rev. B 2006, 73, 195107. [Google Scholar] [CrossRef] [Green Version]
  29. Jain, A.; Hautier, G.; Ping Ong, S.; Moore, C.J.; Fischer, C.C.; Persson, K.A.; Ceder, G. Formation enthalpies by mixing GGA and GGA + U calculations. Phys. Rev. B 2011, 84, 45115. [Google Scholar] [CrossRef] [Green Version]
  30. Greedan, J.E.; Raju, N.P.; Davidson, I.J. Long Range and Short Range Magnetic Order in Orthorhombic LiMnO2. J. Solid State Chem. 1997, 128, 209–214. [Google Scholar] [CrossRef] [Green Version]
  31. Singh, D.J. Magnetic and electronic properties of LiMnO2. Phys. Rev. B Condens. Matter Mater. Phys. 1997, 55, 309–312. [Google Scholar] [CrossRef]
  32. Thomas, M.G.S.R.; Bruce, P.G.; Goodenough, J.B. Lithium mobility in the layered oxide Li1-xCoO2. Solid State Ion. 1985, 17, 13–19. [Google Scholar] [CrossRef]
  33. Yamada, S.; Fujiwara, M.; Kanda, M. Synthesis and properties of LiNiO2 as cathode material for secondary batteries. J. Power Sources 1995, 54, 209–213. [Google Scholar] [CrossRef]
  34. Ohzuku, T. Electrochemistry and Structural Chemistry of LiNiO2 (R3m) for 4 Volt Secondary Lithium Cells. J. Electrochem. Soc. 1993, 140, 1862. [Google Scholar] [CrossRef]
  35. Chen, H.; Freeman, C.L.; Harding, J.H. Charge disproportionation and Jahn-Teller distortion in LiNiO2 and NaNiO2: A density functional theory study. Phys. Rev. B Condens. Matter Mater. Phys. 2011, 84, 085108. [Google Scholar] [CrossRef] [Green Version]
  36. Rougier, A.; Delmas, C.; Chadwick, A.V. Non-cooperative Jahn-Teller effect in LiNiO2: An EXAFS study. Solid State Commun. 1995, 94, 123–127. [Google Scholar] [CrossRef]
  37. Chung, J.H.; Proffen, T.; Shamoto, S.; Ghorayeb, A.M.; Croguennec, L.; Tian, W.; Sales, B.C.; Jin, R.; Mandrus, D.; Egami, T. Local structure of LiNiO 2 studied by neutron diffraction. Phys. Rev. B Condens. Matter Mater. Phys. 2005, 71, 064410. [Google Scholar] [CrossRef]
  38. Nakai, I.; Takahashi, K.; Shiraishi, Y.; Nakagome, T.; Nishikawa, F. Study of the Jahn-Teller Distortion in LiNiO 2, a Cathode Material in a Rechargeable Lithium Battery, byin SituX-Ray Absorption Fine Structure Analysis. J. Solid State Chem. 1998, 140, 145–148. [Google Scholar] [CrossRef]
  39. Dittrich, G.; Hoppe, R. Zur Kristallstruktur von LiMnO2. Zeitschrift fur Anorganische und Allgemeine Chemie 1969, 368, 262–270. [Google Scholar] [CrossRef]
  40. Hoppe, R.; Brachtel, G.; Jansen, M. Zur Kenntnis der Oxomanganate(III): LiMnO2 und a-NaMnO2. Zeitschrift fur Anorganische und Allgemeine Chemie 1975, 417, 1–10. [Google Scholar] [CrossRef]
  41. Minenkov, Y.; Singstad, Å.; Occhipinti, G.; Jensen, V.R. The accuracy of DFT-optimized geometries of functional transition metal compounds: A validation study of catalysts for olefin metathesis and other reactions in the homogeneous phase. Dalton Trans. 2012, 41, 5526–5541. [Google Scholar] [CrossRef]
  42. Ceder, G.; Mishra, S.K. Stability of orthorhombic and monoclinic-layered LiMnO2. Electrochem. Solid State Lett. 1999, 2, 550–552. [Google Scholar] [CrossRef] [Green Version]
  43. Brutti, S.A.; Nguyen-Manh, D.B.; Pettifor, D.G.C. Lattice stability of Ca, Sr and Yb disilicides. Intermetallics 2006, 14, 1472–1486. [Google Scholar] [CrossRef]
  44. Hu, Y.Q.; Xiong, L.; Liu, X.Q.; Zhao, H.Y.; Liu, G.T.; Bai, L.G.; Cui, W.R.; Gong, Y.; Li, X.D. Equation of state of LiCoO2 under 30 GPa pressure. Chin. Phys. B 2019, 28, 2–6. [Google Scholar] [CrossRef]
  45. Kugel, K.I.; Khomskii, D.I. The jahn-teller effect and magnetism: Transition metal compounds. Sov. Phys. Uspekhi 1982, 25, 621–641. [Google Scholar] [CrossRef]
  46. Longuet-Higgins, H.C.; Öpik, U.; Lecorney Pryce, M.H.; Sack, R.A. Studies of the Jahn-Teller effect II. The dynamical problem. Proc. R. Soc. Lond. Ser. A Math. Phys. Sci. 1958, 244, 1–16. [Google Scholar]
  47. Mishra, S.K.; Ceder, G. Structural stability of lithium manganese oxides. Phys. Rev. B Condens. Matter Mater. Phys. 1999, 59, 6120–6130. [Google Scholar] [CrossRef] [Green Version]
  48. Rao, C.N.R.; Raveau, B. Transition Metal Oxides: Structure, Properties, and Synthesis of Ceramic Oxides; Wiley-VCH: Weinheim, Germany, 1998; ISBN 9780471189718. [Google Scholar]
  49. Li, W.; Reimers, J.N.; Dahn, J.R. Crystal structure of LixNi2-xO2 and a lattice-gas model for the order-disorder transition. Phys. Rev. B 1992, 46, 3236–3246. [Google Scholar] [CrossRef]
  50. Chevrier, V.L.; Ong, S.P.; Armiento, R.; Chan, M.K.Y.; Ceder, G. Hybrid density functional calculations of redox potentials and formation energies of transition metal compounds. Phys. Rev. B Condens. Matter Mater. Phys. 2010, 82, 075122. [Google Scholar] [CrossRef]
  51. Van Elp, J.; Wieland, J.L.; Eskes, H.; Kuiper, P.; Sawatzky, G.A.; De Groot, F.M.F.; Turner, T.S. Electronic structure of CoO, Li-doped CoO, and LiCoO2. Phys. Rev. B 1991, 44, 6090–6103. [Google Scholar] [CrossRef]
  52. Kong, F.; Longo, R.C.; Park, M.S.; Yoon, J.; Yeon, D.H.; Park, J.H.; Wang, W.H.; Kc, S.; Doo, S.G.; Cho, K. Ab initio study of doping effects on LiMnO2 and Li2MnO3 cathode materials for Li-ion batteries. J. Mater. Chem. A 2015, 3, 8489–8500. [Google Scholar] [CrossRef]
  53. Nath Shukla, N.; Prasad, R. Electronic structure of LiMnO2: A comparative study of the LSDA and LSDA + U methods. J. Phys. Chem. Solids 2006, 67, 1731–1740. [Google Scholar] [CrossRef] [Green Version]
  54. Cupid, D.M.; Li, D.; Gebert, C.; Reif, A.; Flandorfer, H.; Seifert, H.J. Enthalpy of formation and heat capacity of Li 2 MnO 3. J. Ceram. Soc. Jpn. 2016, 124, 1072–1082. [Google Scholar] [CrossRef] [Green Version]
  55. Chase, M.W., Jr.; Davies, C.A.; Downey, J.R., Jr.; Frurip, D.J.; McDonald, R.A.; Syverud, A.N. NIST-JANAF Thermochemical Tables; Standard Reference Data Program National Institute of Standards and Technology: Gaithersburg, MD, USA, 1985.
  56. Chang, K.; Hallstedt, B. Thermodynamic assessment of the Li–O system. Calphad 2011, 35, 160–164. [Google Scholar] [CrossRef]
  57. Robie, R.A.; Hemingway, B.S. Low-temperature molar heat capacities and entropies of MnO2 (pyrolusite), Mn3O4 (hausmanite), and Mn2O3 (bixbyite). J. Chem. Thermodyn. 1985, 17, 165–181. [Google Scholar] [CrossRef]
  58. Alcock, C.B.; Zador, S. Thermodynamic study of the manganese/ manganous-oxide system by the use of solid oxide electrolytes. Electrochim. Acta 1967, 12, 673–677. [Google Scholar] [CrossRef]
  59. Fritsch, S.; Navrotsky, A. Thermodynamic Properties of Manganese Oxides. J. Am. Ceram. Soc. 1996, 79, 1761–1768. [Google Scholar] [CrossRef]
  60. Seltz, H.; DeWitt, B.J.; McDonald, H.J. The Heat Capacity of Nickel Oxide from 68-298°K. and the Thermodynamic Properties of the Oxide. J. Am. Chem. Soc. 1940, 62, 88–89. [Google Scholar] [CrossRef]
  61. Kawaji, H.; Takematsu, M.; Tojo, T.; Atake, T.; Hirano, A.; Kanno, R. Low temperature heat capacity and thermodynamic functions of LiCoO2. J. Therm. Anal. Calorim. 2002, 68, 833–839. [Google Scholar]
  62. Wang, M.; Navrotsky, A. Enthalpy of formation of LiNiO2, LiCoO2 and their solid solution, LiNi1-xCoxO2. Solid State Ion. 2004, 166, 167–173. [Google Scholar] [CrossRef]
  63. Spencer, P.J. Estimation of thermodynamic data for metallurgical applications. Thermochim. Acta 1998, 314, 1–21. [Google Scholar] [CrossRef]
  64. Leitner, J.; Chuchvalec, P.; Sedmidubský, D.; Strejc, A.; Abrman, P. Estimation of heat capacities of solid mixed oxides. Thermochim. Acta 2002, 395, 27–46. [Google Scholar] [CrossRef]
  65. Gotcu-Freis, P.; Cupid, D.M.; Rohde, M.; Seifert, H.J. New experimental heat capacity and enthalpy of formation of lithium cobalt oxide. J. Chem. Thermodyn. 2015, 84, 118–127. [Google Scholar] [CrossRef]
  66. Chang, K.; Hallstedt, B.; Music, D.; Fischer, J.; Ziebert, C.; Ulrich, S.; Seifert, H.J. Thermodynamic description of the layered O3 and O2 structural LiCoO 2-CoO2 pseudo-binary systems. Calphad Comput. Coupling Phase Diagr. Thermochem. 2013, 41, 6–15. [Google Scholar] [CrossRef]
  67. Jankovský, O.; Kovařík, J.; Leitner, J.; Růžička, K.; Sedmidubský, D. Thermodynamic properties of stoichiometric lithium cobaltite LiCoO2. Thermochim. Acta 2016, 634, 26–30. [Google Scholar] [CrossRef]
Figure 1. LMO unit cells of rhombohedral (hR12), monoclinic (mC8) and orthorhombic (oP8) structures. Color code: Li green, Co, Ni and Mn light blue and oP8 red.
Crystals 10 00526 g001
Figure 2. AFM configurations (undistorted) of the manganese sublattice in hR12, mC8 and oP8 structures: for oP8 we have considered Greedan et al. [30] antiferromagnetic alignment, while for hR12 and mC8, we have considered Singh antiferromagnetic alignment [31]. For the oP8 lattice, the 2 × 2 × 2 supercell requires two c-stacked manganese ions layers with different magnetic ordering to be modeled. Color Code: spin up blue, spin down light blue.
Crystals 10 00526 g002
Figure 3. MO6 octahedra for Ni-O6 and Mn-O6 for each hR12, mC8 and oP8 lattices. The bond distances for each M-O are reported. The red labels evidence Jahn-Teller (JT)-distortions. Color Code: Ni grey, Mn purple, O red.
Crystals 10 00526 g003
Figure 4. Relative phase stabilities for LCO, LNO and LMO compounds as computed by DFT + U.
Crystals 10 00526 g004
Figure 5. PDOS of LTMO compounds, each at its most stable phase. Upper-panel rhombohedral electronic structure of LCO (hR12), middle-panel monoclinic electronic structure of LNO (mC8) and bottom-panel orthorhombic electronic structure of LMO (oP8). Positive and negative PDOS values refer to spin α and β, respectively.
Crystals 10 00526 g005
Table 1. Calculated lattice constants for the equilibrium structures, volumes and bond widths (referred to the monoclinic structure) for LiCoO2 (LCO), LiNiO2 (LNO) and LiMnO2 (LMO). In parentheses, experimental values for the stable structures are reported for comparison [6,7,39,42].
LCO
hR12mC8oP8
a (Å)2.836 (2.816)5.2292.721
b (Å) 2.7634.411
c (Å)14.111 (14.054)5.1415.572
β (°) 115.412
V (Å3 at−1)8.191 (8.043)8.3868.359
LMO
hR12mC8oP8
a (Å)3.0025.480 (5.44)2.851 (2.806)
b (Å) 2.867 (2.80)4.623 (4.550)
c (Å)14.5505.387 (5.39)5.839 (5.747)
β (°) 115.412 (116)
V (Å3 at−1)9.4639.556 (9.224)9.620 (9.172)
LNO
hR12mC8oP8
a (Å)2.884 (2.879)5.288 (4.969)2.759
b (Å) 2.767 (2.877)4.473
c (Å)14.271 (14.203)5.199 (4.997)5.650
β (°) 115.412 (109.20)
V (Å3 at−1)8.566 (8.460)8.589 (8.715)8.716
Table 2. Calculated cohesion energies for the LCO, LMO and LNO phases.
ΔcohE (eV Atom−1)
hR12mC8oP8
LCO−22.361−22.189−21.690
LNO−20.521−20.614−20.519
LMO−26.173−26.321−26.337
Table 3. Calculated internal energy changes for reactions at 0 K R3-R4-R5-R6 for all the polymorphs (hR12, mC8 and O) of the LCO, LMO and LNO compounds. Energy evaluations involving experimentally reported phases are in bold.
ΔE0 K (eV mol−1)
ReactionhR12mC8oP8
ΔE3ECoO + Li2O → LiCoO2 + Li1.0921.2641.763
ΔE4ENiO + Li2O → LiNiO2 + Li2.3802.2872.382
ΔE5EMnO + Li2O → LiMnO2 + Li1.7531.6051.589
ΔE6EMn2O3 + Li2O → 2 LiMnO2−0.771−1.067−1.099
Table 4. Calculated Gibbs Energy of formations at 0 K from elements for all the polymorphs (hR12, mC8 and O) of the LCO, LMO and LNO compounds. Errors have been estimated by propagating the accuracy of the thermochemical supporting data. Energy evaluations involving experimentally reported phases are in bold.
Δf298 K (kJ mol−1)
ReactionhR12mC8oP8
LiCoO2Co(s) + Li(s) + O2(g) → LiCoO2(s)−734 ± 7−717 ± 7−669 ± 7
LiNiO2Ni(s) + Li(s) + O2(g) → LiNiO2(s)−610 ± 7−619 ± 7−609 ± 7
LiMnO2Mn(s) + Li(s) + O2(g) → LiMnO2(s)−820 ± 6−834 ± 6−836 ± 6
Table 5. Calculated Gibbs Energy of formations at 0 K from elements for all the polymorphs (hR12, mC8 and O) of the LCO, LMO and LNO compounds. Errors have been estimated by propagating the accuracy of the thermochemical supporting data. Energy evaluations involving experimentally reported phases are in bold.
Δf298 K (kJ mol−1)
ReactionhR12mC8oP8
LiCoO2Co(s) + Li(s) + O2(g) → LiCoO2(s)−672 ± 8−655 ± 8−607 ± 8
LiNiO2Ni(s) + Li(s) + O2(g) → LiNiO2(s)−549 ± 8−557 ± 8−548 ± 8
LiMnO2Mn(s) + Li(s) + O2(g) → LiMnO2(s)−765 ± 10−779 ± 10−780 ± 10

