Article

Nickel-Based Catalysts for Hydrogen Production Through Partial Oxidation: The Role of KIT-6 and Promoter Effects


by
Yasameen Ahmed
1,
Ghzzai Almutairi
2,*,
Abdulaziz A. M. Abahussain
3,
Omalsad H. Odhah
4,
Khaled M. Banabdwin
3,
Ahmed Yagoub Elnour
3,
Fekri Abdulraqeb Ahmed Ali
5,
Fazal Raziq
6,
Ahmed A. Ibrahim
3 and
Ahmed S. Al-Fatesh
3,*
1
Department of Physics, College of Science, Princess Nourah bint Abdulrahman University, Riyadh 13415, Saudi Arabia
2
Hydrogen Technologies Institute, King Abdulaziz City for Science & Technology (KACST), Riyadh 11442, Saudi Arabia
3
Department of Chemical Engineering, College of Engineering, King Saud University (KSU), P.O. Box 800, Riyadh 11421, Saudi Arabia
4
Department of Mathematical Sciences, College of Science, Princess Nourah bint Abdulrahman University, P.O. Box 84428, Riyadh 11671, Saudi Arabia
5
Chemical Engineering Department, College of Engineering, Imam Mohammad Ibn Saud Islamic University (IMSIU), Riyadh 11432, Saudi Arabia
6
School of Physics and Electrical Energy Engineering, Chuxiong Normal University, Chuxiong 675000, China
*
Authors to whom correspondence should be addressed.
Catalysts 2026, 16(2), 201; https://doi.org/10.3390/catal16020201
Submission received: 15 January 2026 / Revised: 15 February 2026 / Accepted: 20 February 2026 / Published: 23 February 2026

Abstract

Partial oxidation of methane (POM) is a good way to make syngas because it uses exothermic reactions to keep itself going. This study made a series of Ni/KIT-6 catalyst precursors with Gd (0.5–2 wt.%) added to them and then carefully looked at how they changed into active catalysts. The first tests on the precursors using N2 physisorption, XRD, and H2-TPR showed that they had a high surface area and changed how they reduced. However, the high-temperature activation (700 °C) and reaction (682 °C) conditions caused thermal evolution and sintering. Tests of catalytic performance and RSM optimization found that the 5Ni + 1Gd/KIT-6 formulation was the best. Under the best conditions, it converted 89.0% of CH4 and 87.4% of H2. Using TEM and Raman spectroscopy to look at the used catalysts showed that 1 wt.% Gd was able to control the size distribution of the metallic particles and stop disordered carbon from forming, even after thermal recrystallisation. A 24 h stability test confirmed these findings, indicating a stable H2 yield (85–87%) and minimal performance degradation, thereby demonstrating that Gd promotion maintains the stability of the active metallic phase under operational stress.

1. Introduction

The global need and the pursuit of cleaner energy and lower greenhouse gas emissions has intensified the search for efficient hydrogen production technologies [1]. The partial oxidation of methane (POM) is a promising approach due to its exothermic nature, which allows autothermal operation and direct synthesis gas (H2 and CO) production without external heat input [1]. Compared to the common steam methane reforming (SMR), POM offers distinct advantages, including faster start-up [2], reduced reactor size [3], and lower water consumption [4], features that are highly attractive for modular and decentralized hydrogen generation systems [4,5]. POM proceeds via two primary mechanisms: the direct oxidation pathway [6], where methane converts directly to syngas:
C H 4 + 0.5 O 2 C O + 2 H 2   Partial   Oxidation   of   Methane   Δ H 298 ° = 36   k J / m o l
or the indirect combustion-reforming mechanism [7], involving initial total oxidation to CO2 and H2O:
C H 4 + 2 O 2 C O 2 + 2 H 2 O   Total   Oxidation   of   Methane   Δ H 298 ° = 891   k J / m o l
followed by reforming, as shown in the equations below [8].
C H 4 + C O 2 2 C O + 2 H 2   Dry   Reforming   of   Methane   Δ H 298 ° = 247   k J / m o l
C H 4 + H 2 O C O + 3 H 2   Steam   Reforming   of   Methane   Δ H 298 ° = 206   k J / m o l
Nickel-based catalysts are widely used in methane reforming due to their high performance and cost-effectiveness compared to noble metals [9]. However, their application in POM is limited by fast deactivation caused by carbon deposition and sintering [10,11], particularly under high-temperature and carbon-rich conditions [12]. To solve these limitations, recent efforts have focused on tailoring catalyst composition and structure through advanced supports and promoters [13]. Han [9] reported that adding ceria (CeO2) to Ni@SiO2 catalysts helped reduce carbon build-up and showed high stability during catalytic performance. Khani [14] synthesized a Ni-based catalyst with a mix of Ce, Zr, and Gd, and they found that Gd efficiently improves oxygen mobility and reduces coke formation. Al-Fatesh et al. [15] found that using Gd with Ni/Y2O3 increased H2 production and improved the catalyst’s CO2 conversion efficiency. Mesoporous silica frameworks such as KIT-6, with their high surface area and interconnected pore networks, provide excellent platforms for dispersing Ni nanoparticles and enhancing active site accessibility [16,17]. Huang et al. [18] found that using KIT-6 as a support for NiO helped improve methane combustion. The KIT-6 structure provided good pore connection and large surface area, which allowed better oxygen flow and heat control [18]. This helped the catalyst stay active and stable during the reaction. Incorporating rare-earth elements like Gd as promoters has shown great promise in further enhancing catalyst stability [19]. Zhang et al. [20] reported that the incorporation of Gd into Ni-based catalysts improves the dispersion of Ni particles and enhances metal support interaction, which helps suppress Ni sintering during high-temperature reactions. They also observed that Gd increases oxygen mobility and thermal stability, contributing to better resistance against deactivation in methane reforming processes [21]. Da Costa et al. [21] found that yttrium-promoted catalysts supported on KIT-6 significantly enhanced excess-methane dry reforming. Compared to unpromoted catalysts, the addition of yttrium led to exceptionally stable syngas production and reduced deactivation, achieved by increasing basicity and lowering nickel reduction temperatures [22]. In the partial oxidation of methane (POM), two main mechanisms are involved: the Langmuir–Hinshelwood (LH) and the Mars–van Krevelen (MvK) [22,23]. In the LH mechanism, both methane and oxygen adsorb on the surface of the nickel catalyst and react to form hydrogen and carbon monoxide [24]. In the MvK mechanism, lattice oxygen from the support helps oxidize methane, and this oxygen is later restored from gas-phase O2 [25]. When Gd is added as a promoter, it enhances the oxygen storage and release ability of the support, especially when incorporated into materials like KIT-6 [26]. This helps improve the lattice oxygen contribution in the MvK mechanism, which can reduce carbon build-up and improve catalyst stability [27]. This work differs from prior Ni/KIT-6 and rare-earth-promoted Ni studies in two ways. First, it targets partial oxidation of methane with low Gd loadings (0.5–2.0 wt.%) on KIT-6, while much of the existing work centres on DRM or higher promoter levels. Second, it couples performance mapping with a response-surface design to define an operating window that meets the H2/CO ≈ 2.4 target for downstream use. Structure performance links are drawn using BET/XRD/TEM, H2-TPR, and Raman on spent catalysts.

2. Results

2.1. BET Analysis

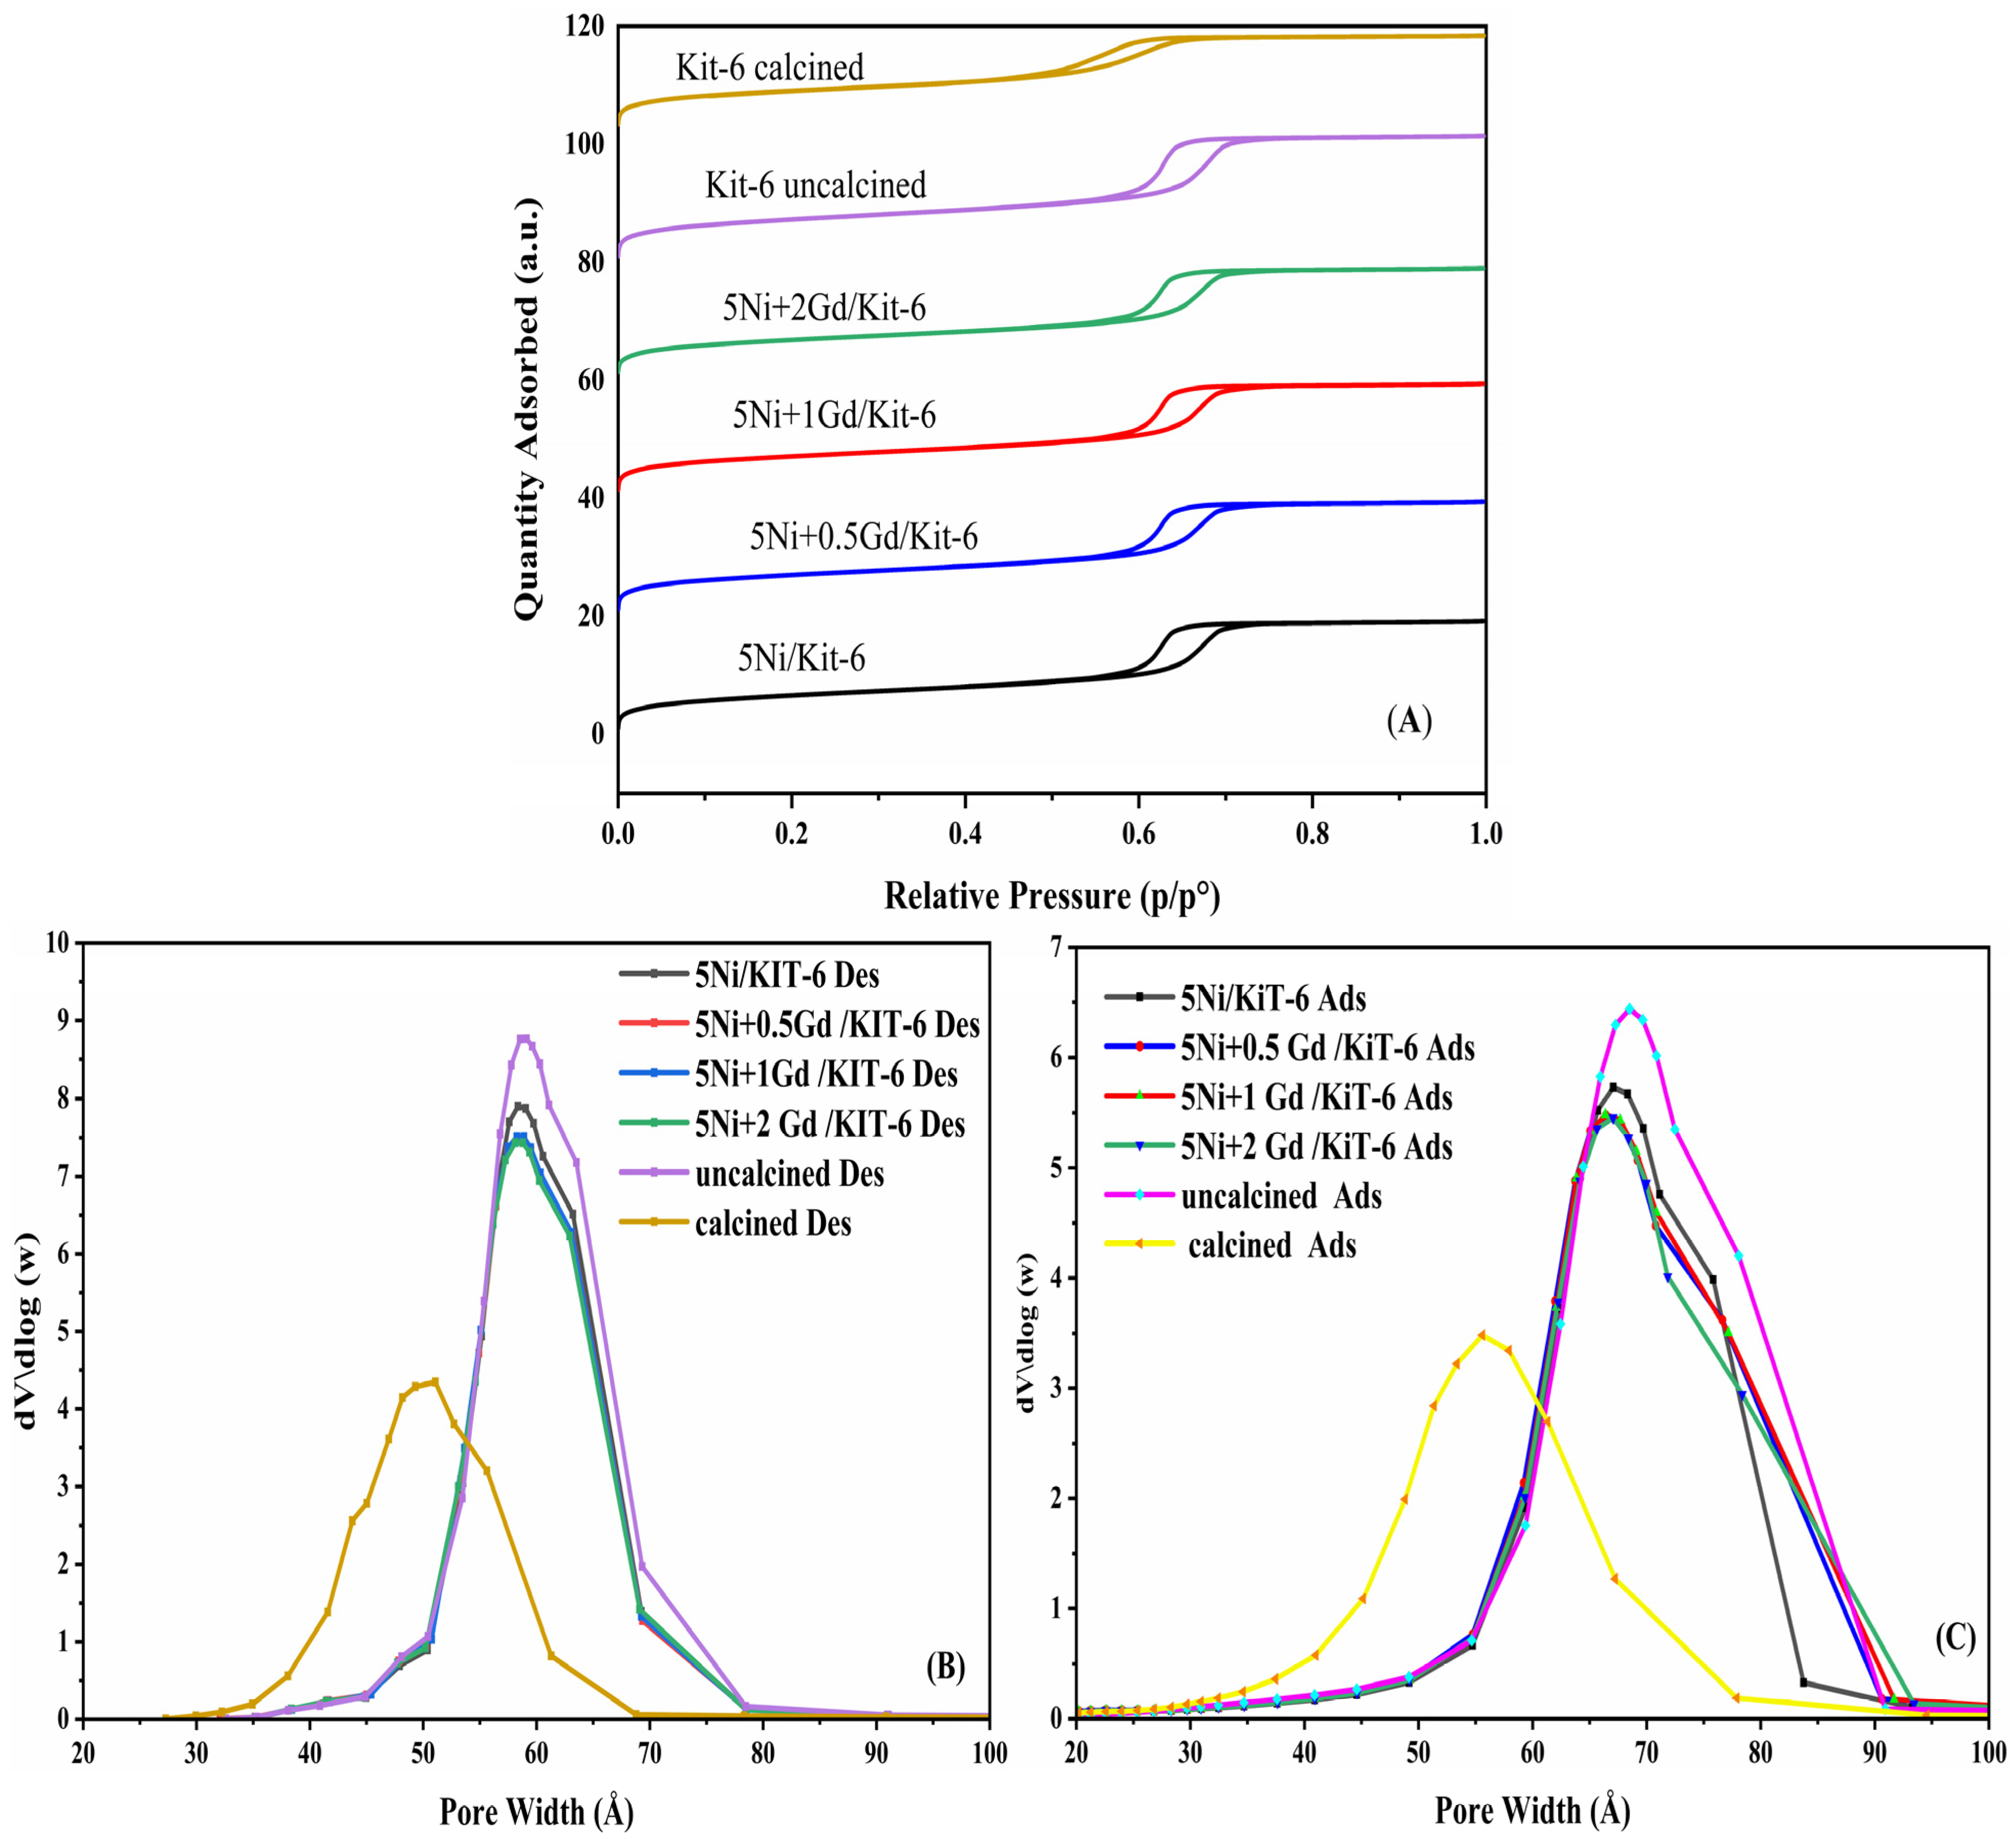
The N2 isotherms depicted in Figure 1A show type-IV behaviour with H1 hysteresis (p/p0 ≈ 0.5–0.8) for all samples, consistent with capillary condensation in uniform, interconnected mesopores typical of KIT-6 [27]. The pore-size distributions from the desorption and adsorption branches (Figure 1B–C) are narrowly centred at 5.7–6.0 nm with only minor shifts across the series. The textural properties of the catalysts are summarized in Table 1. All samples exhibit a high surface area (509–529) m2/g and consistent pore diameters 6.0 nm, confirming that the mesoporous KIT-6 framework remains structurally robust despite Gd promotion and metal impregnation. These modest variations indicate limited pore filling/surface coverage upon metal promoter addition and, importantly, preservation of the KIT-6 mesostructured after impregnation and calcination [28]. Figure 1B (Desorption Curve) and Figure 1C (Adsorption curve) display the pore size distribution curves, confirming the mesoporous nature of the KIT-6 support, displaying a sharp, uniform peak centred around 58 Å across all catalyst samples. The position of this primary pore width remains stable, indicating that structural integrity upon Gd addition remains intact. However, increasing the Gd loading slightly decreases the peak intensity (dV/d\log(w)), which is attributed to minor pore filling or narrowing caused by the deposition of the Ni and Gd precursor species onto the inner channel walls.

2.2. X-Ray Diffraction (XRD)

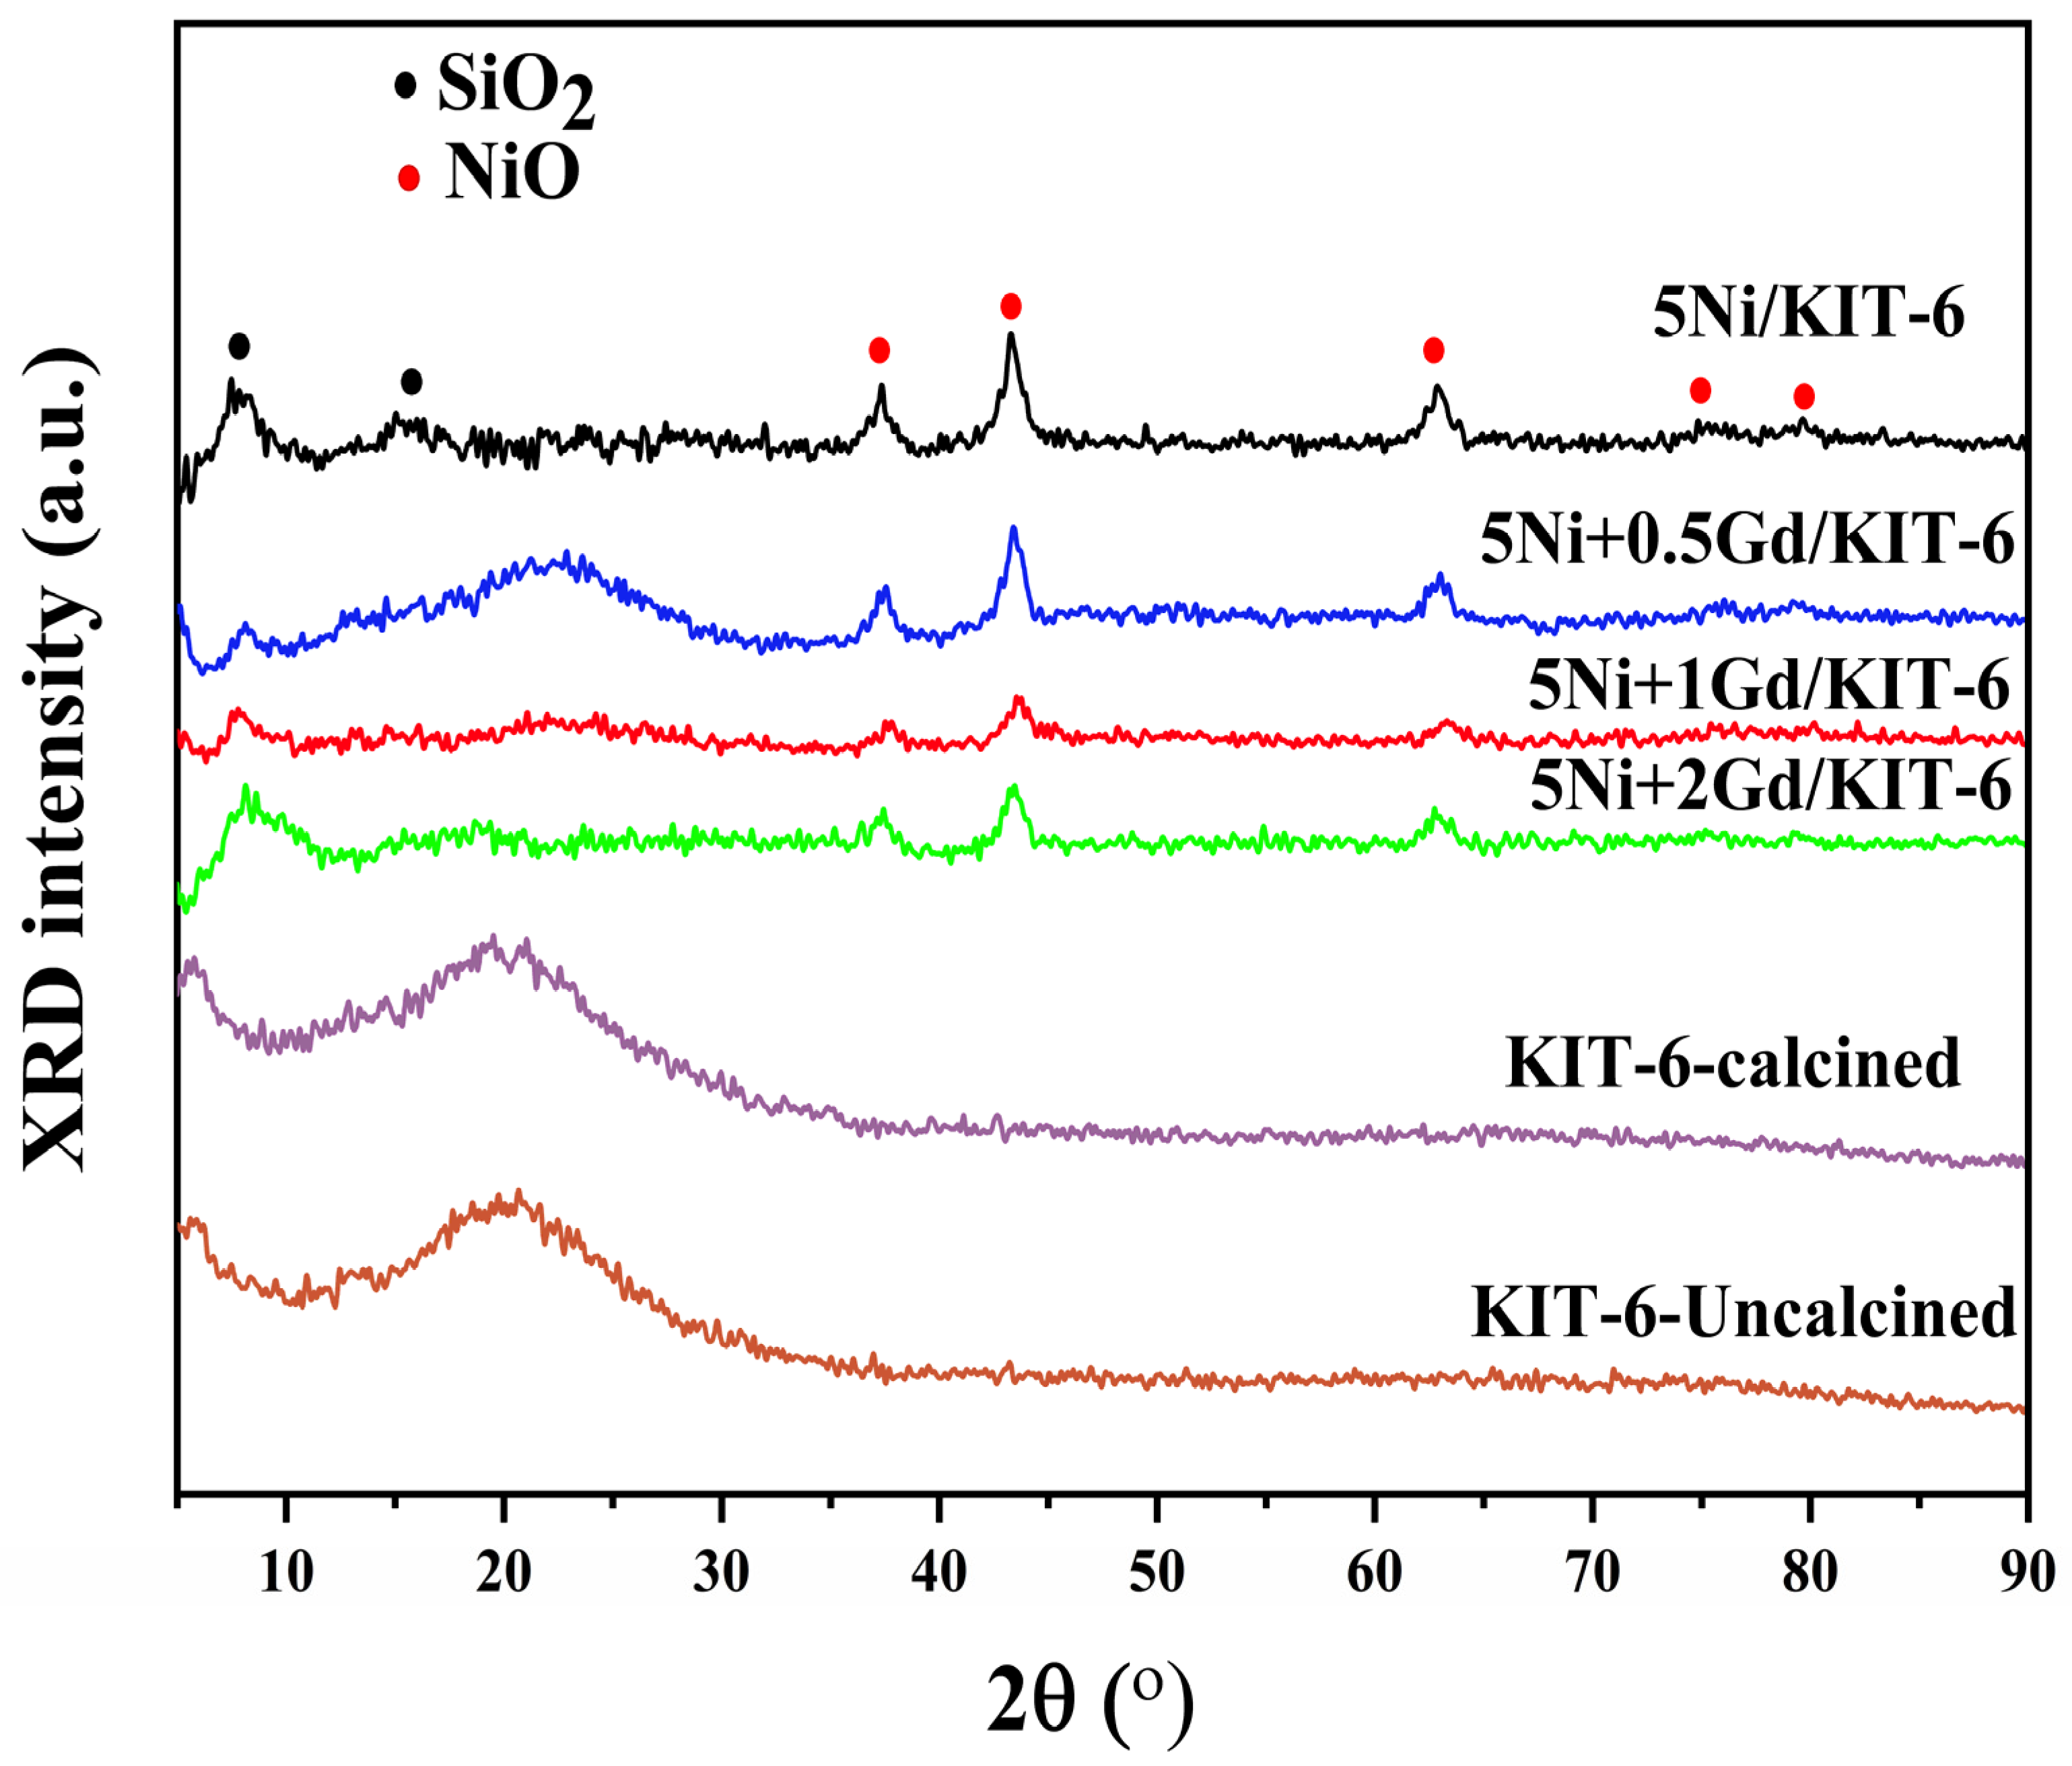
Powder XRD of Figure 2 was recorded for the calcined Ni/KIT-6 series to identify crystalline phases and check structure stability. The characteristic crystalline peaks for KIT-6 are observed below 10° Bragg’s angle [29], whereas the broad signal in the 20–30° 2θ range corresponds to the amorphous nature of the KIT-6 silica structure. The crystalline silica peak of KIT-6 is preserved after calcination and it is shifted to the higher Bragg’s angle after loading of Ni and Gd. The retention of crystalline framework of KIT-6 after doping (with Ni and Gd) and after calcination justify its stability against high temperature and dopant incorporation. For the unpromoted 5Ni/KIT-6, distinct reflections at 37.2°, 43.3°, 62.9°, 75.4°, and 79.4° 2θ are indexed to cubic NiO corresponding to the (111), (200), (220), (311), and (222) planes (JCPDS 47-1049). The crystalline size of NiO for 2θ (43.3°) over 5Ni/KIT-6 is 16.1 nm. Upon increasing loading of Gd, the crystalline size of cubic NiO does not fluctuate much; it remains between 17.3 and 20.1 nm.

2.3. TEM Analysis

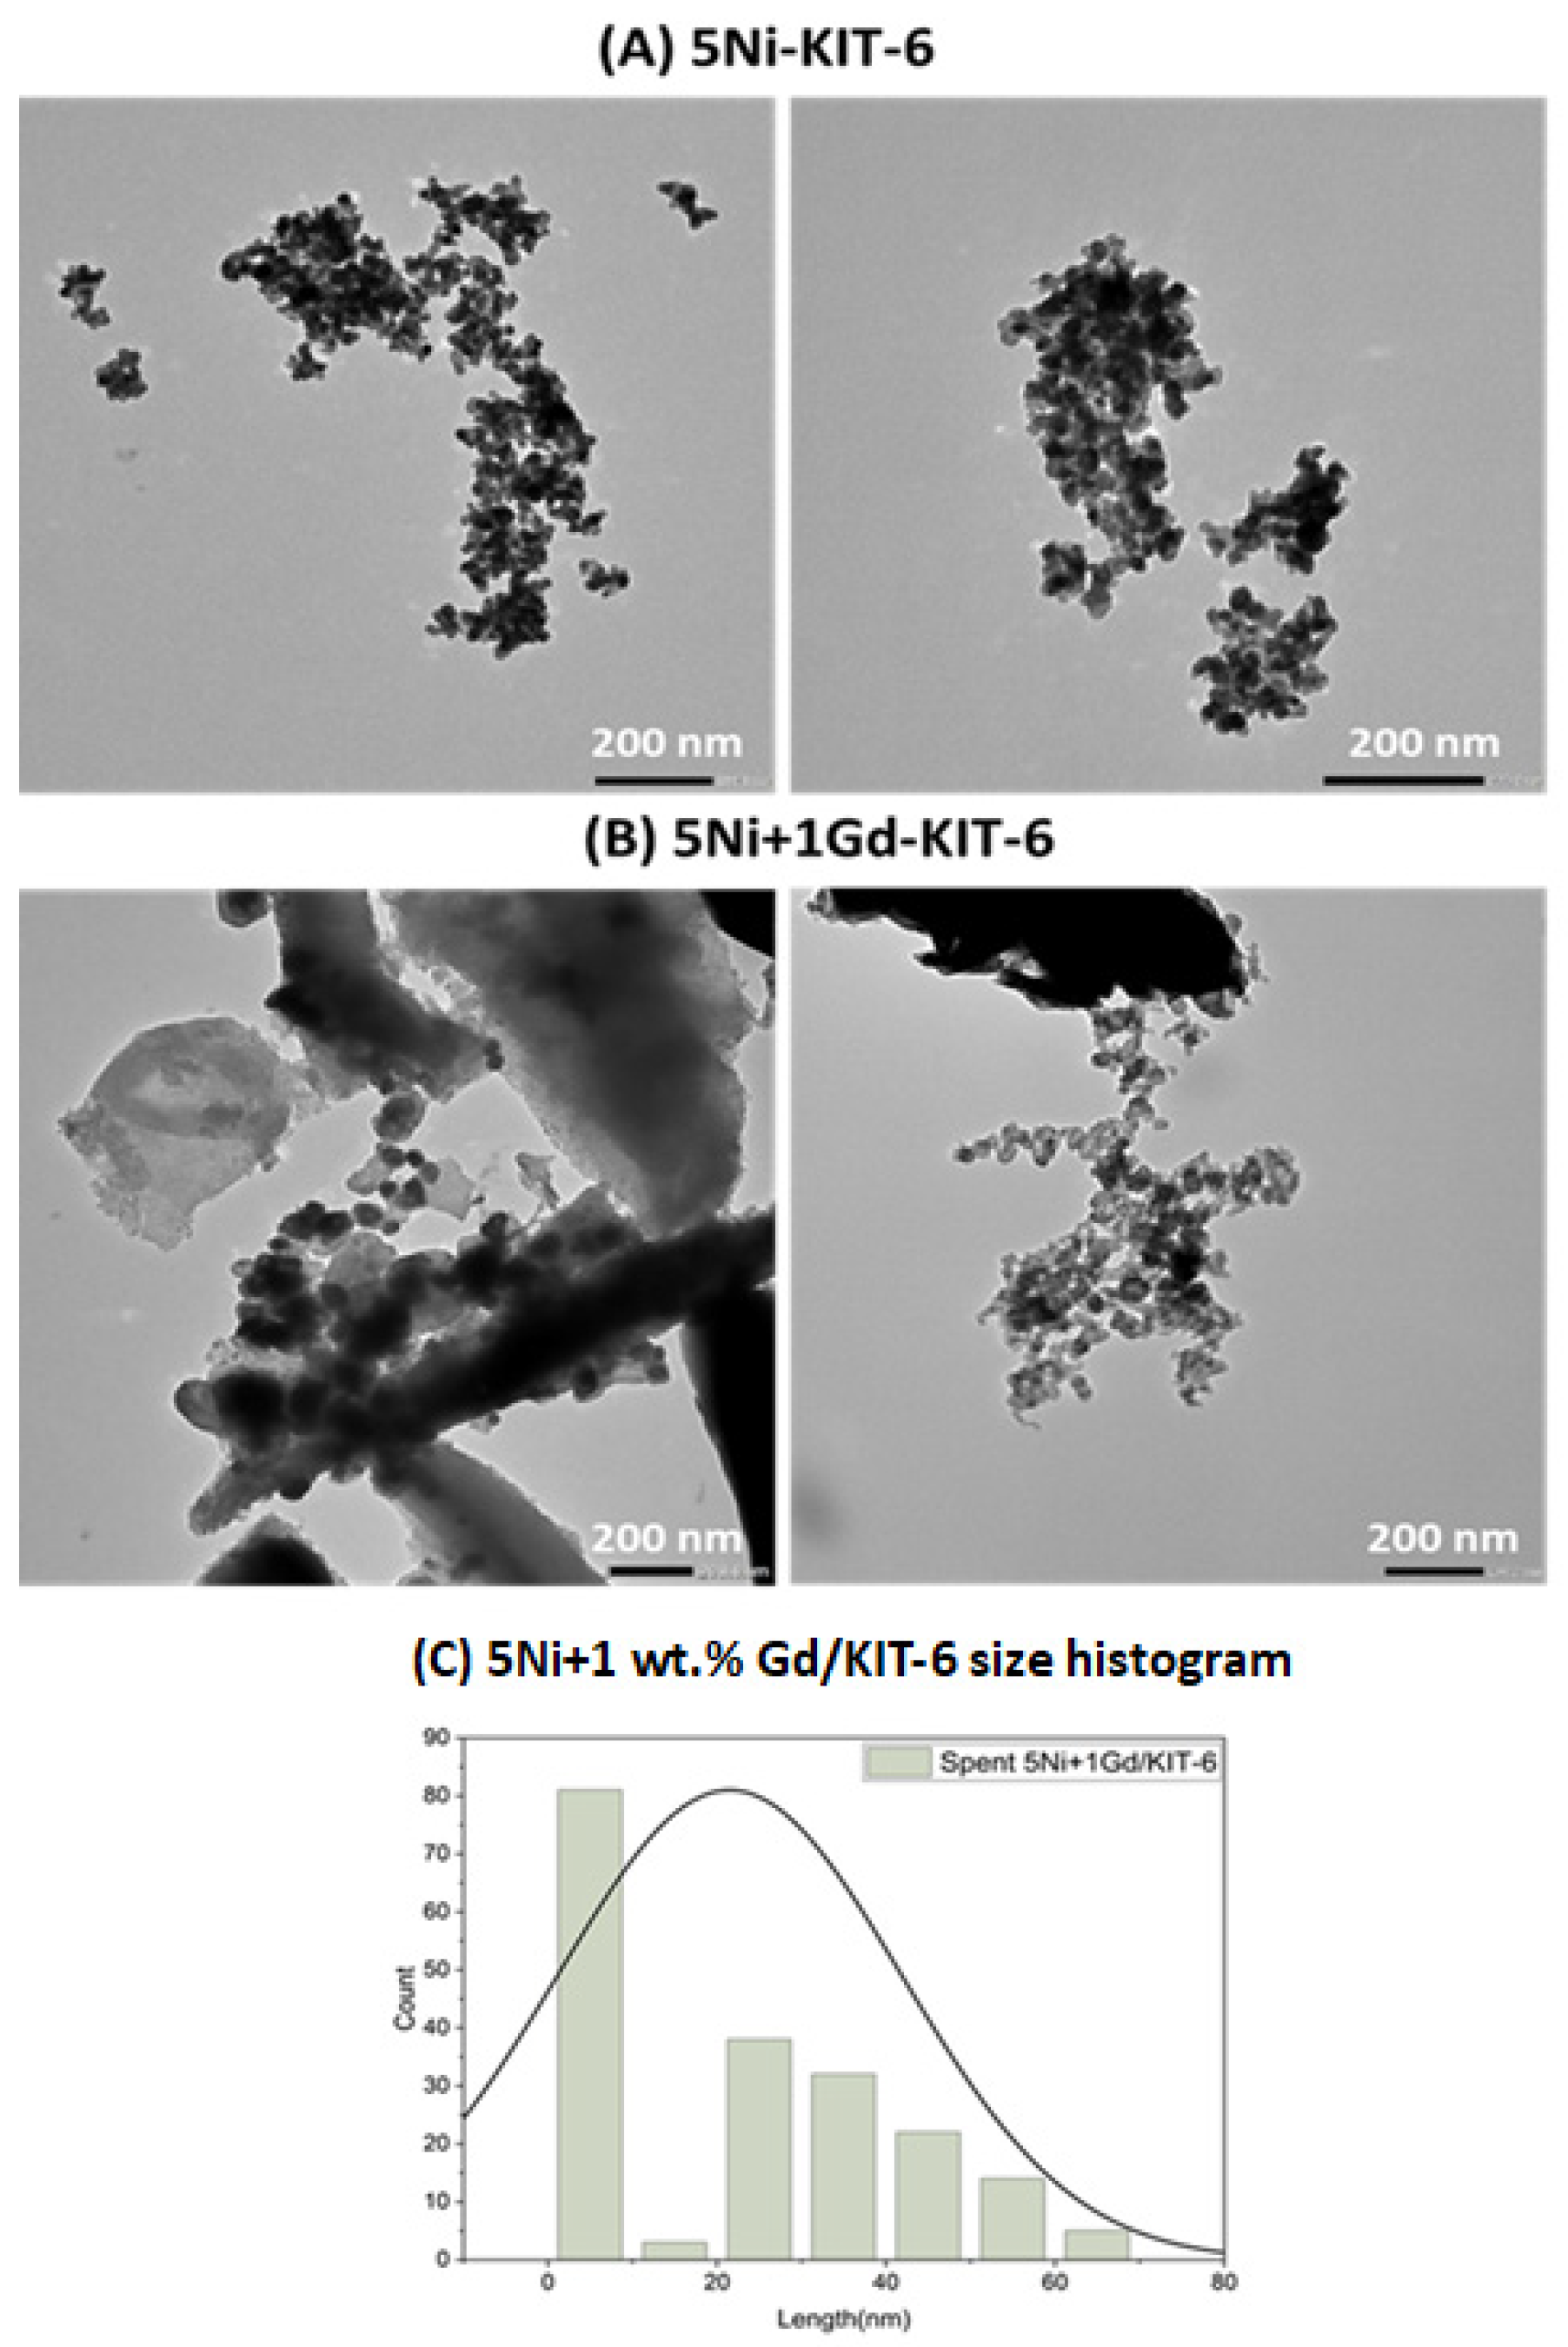
To confirm the structure of the catalysts, TEM analysis was performed in Figure 3. Figure 3A displays the results of Ni/KIT-6 catalyst. The images reveal a well-ordered mesoporous structure with a clear honeycomb-like pattern, which is typical for KIT-6 [24]. This indicates that the KIT-6 framework remains intact after Ni loading. The results for the fresh Ni + 1Gd/KIT-6 catalyst is shown in Figure 3B. The TEM image verifies that the indicated highly dispersed NiO crystallites are uniformly distributed throughout the pores, exhibiting no substantial agglomerations. Furthermore, the average particle size distribution for the Ni + 1Gd/KIT-6 catalyst is depicted in Figure 3C. The Ni + 1 Gd/KIT-6 image shows particles distributed within the mesopores without large agglomerates; the corresponding histogram indicates a narrow size distribution, further validating the high dispersion of the metal phase.

2.4. Raman and UV–Vis Spectroscopy

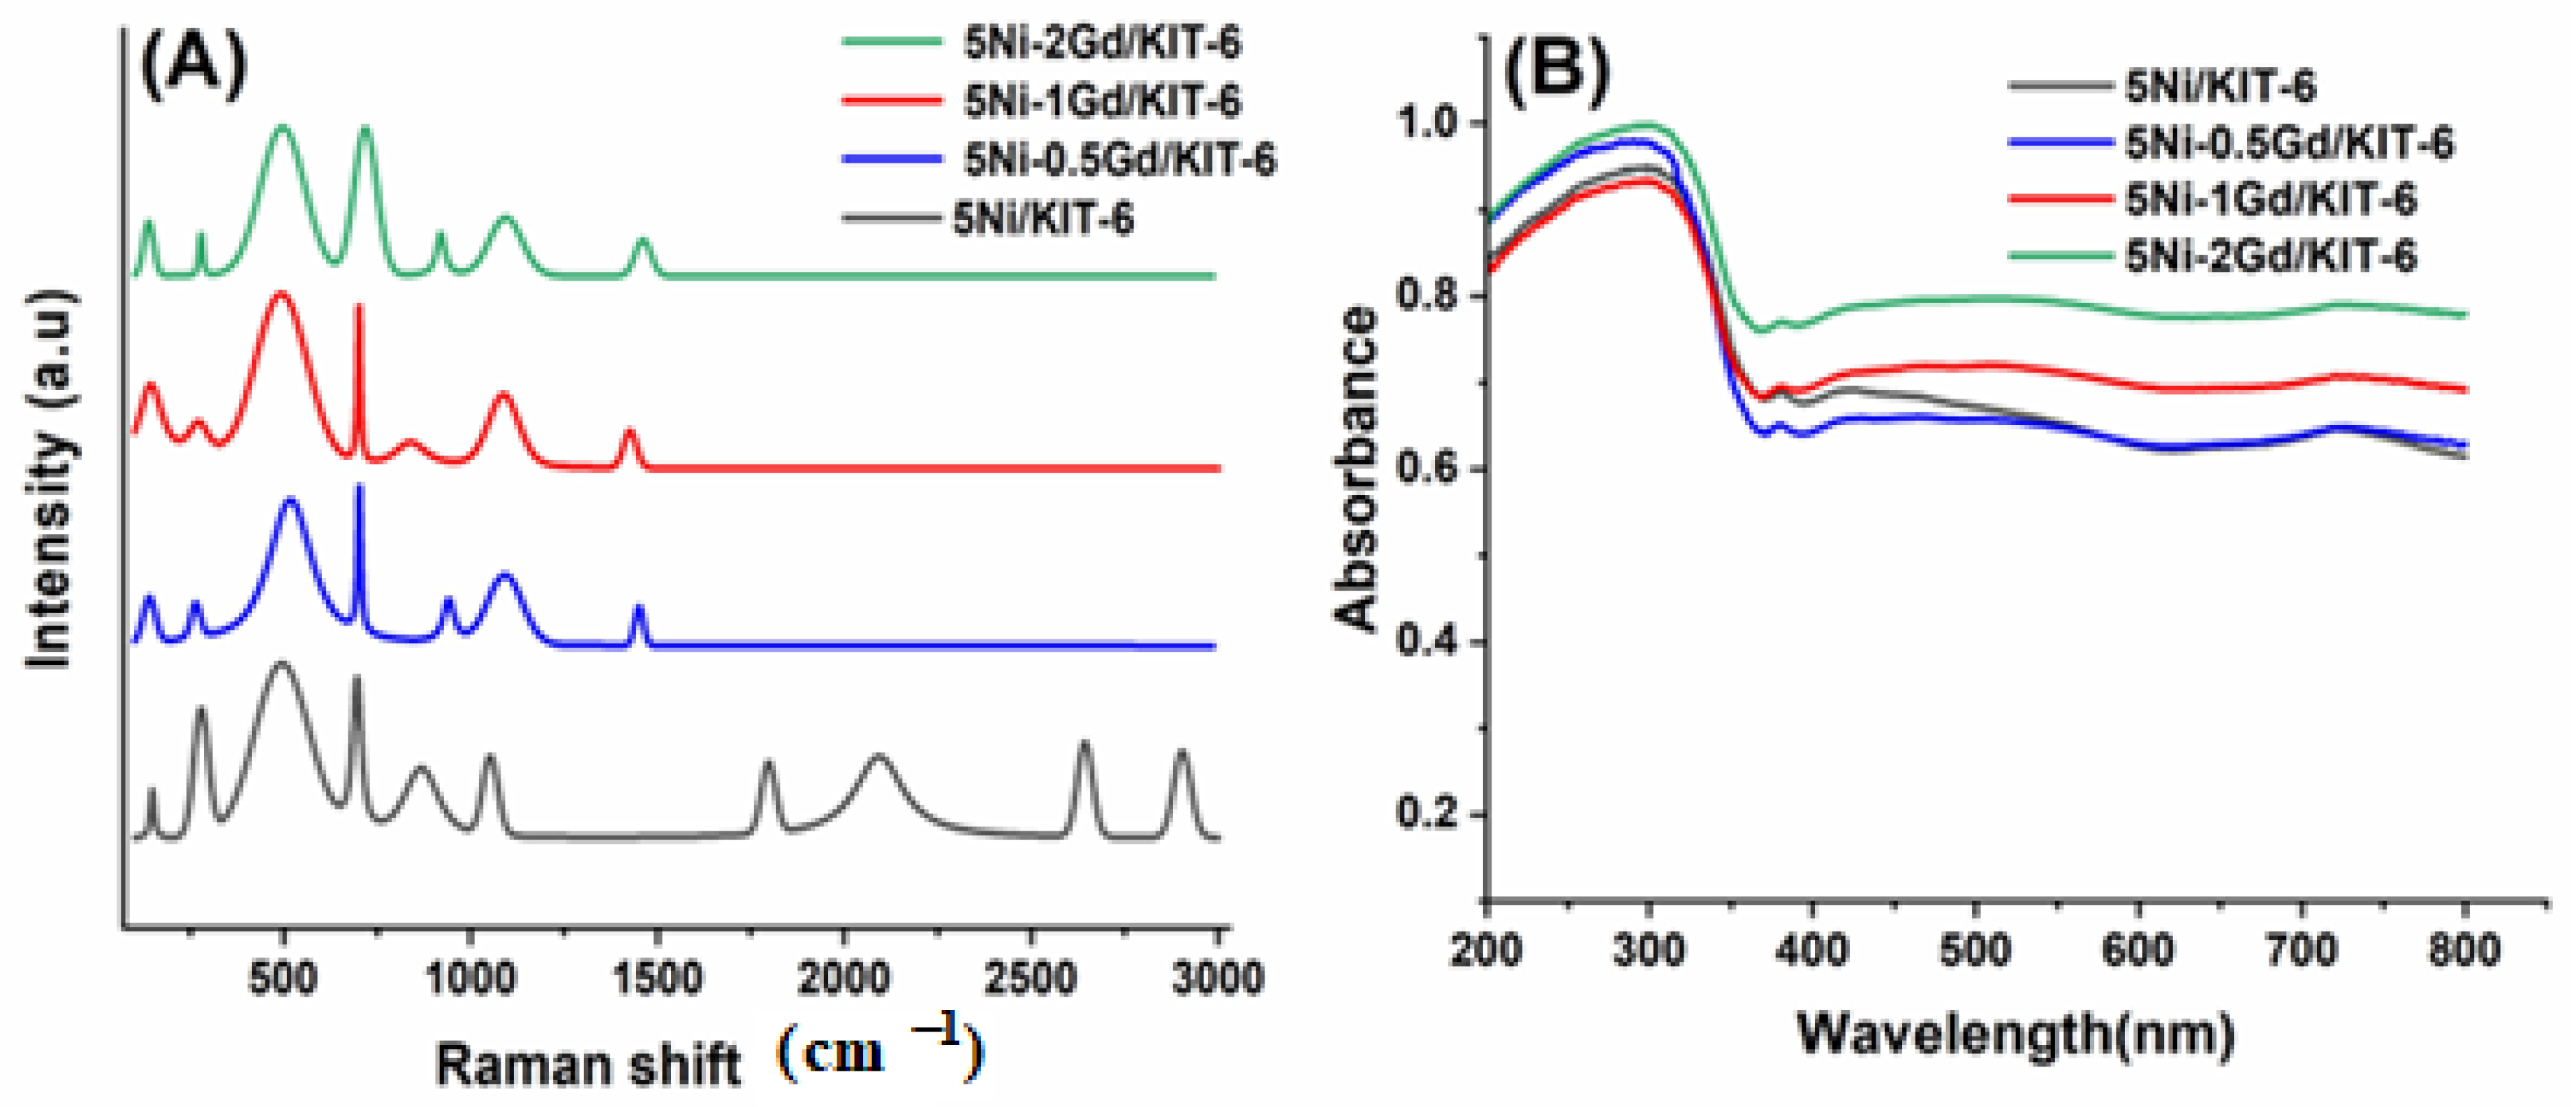
Figure 4A illustrates the Raman spectra of fresh 5Ni/KIT-6 promoted with 0–2 wt.% Gd. The primary bands at about 500 cm−1 and 700 cm−1 are due to the stretching modes of Ni-O in cubic NiO and surface nickel silicates, respectively. As the loading of Gd increases from 0.5 to 2 wt.%, the NiO bands exhibit slight shifts and sharpening, indicating that Gd modulates the size and dispersion of the nickel oxide crystallites. The broad features between 1800 cm−1 and 2800 cm−1 in the unpromoted 5Ni/KIT-6 sample, attributed to nickel oxide overtones or surface defects, significantly diminish in the Gd-modified samples. This quenching effect suggests a strong interaction between Gd and Ni, facilitating a more ordered surface structure. At higher concentrations of Gd, new, subtle peaks appear at 1450 cm−1, which suggests that Gd-associated surface complexes are forming. These complexes may help keep the nickel active sites from sintering. Figure 4B of UV-V is absorbance spectra show the oxidation states and electronic environment of the metal species in the KIT-6 framework. All samples display broad UV absorption with similar onsets, and no systematic edge shift, which implies that the optical band gap remains relatively stable as observed with Gd loading [26]. The strong absorption bands in the ultraviolet range (200–350 nm) are due to ligand-to-metal charge transfer transitions, specifically from O2 to Ni2+ and from O2 to Gd3+. This shows that these metal ions have been successfully added to the silica matrix. The wide peaks between 600 and 800 nm in the visible range are typical of d-d transitions for octahedral Ni2+ ions in a NiO lattice. As the amount of Gd increases, the absorbance across the whole spectrum becomes stronger. This suggests that there are more surface-active species and more electronic states that can be excited. This trend suggests that Gd is a good structural promoter that makes the Ni species and the support interact better. This could lead to a stronger electronic structure that is better for catalytic processes like DRM.

2.5. H2-TPR

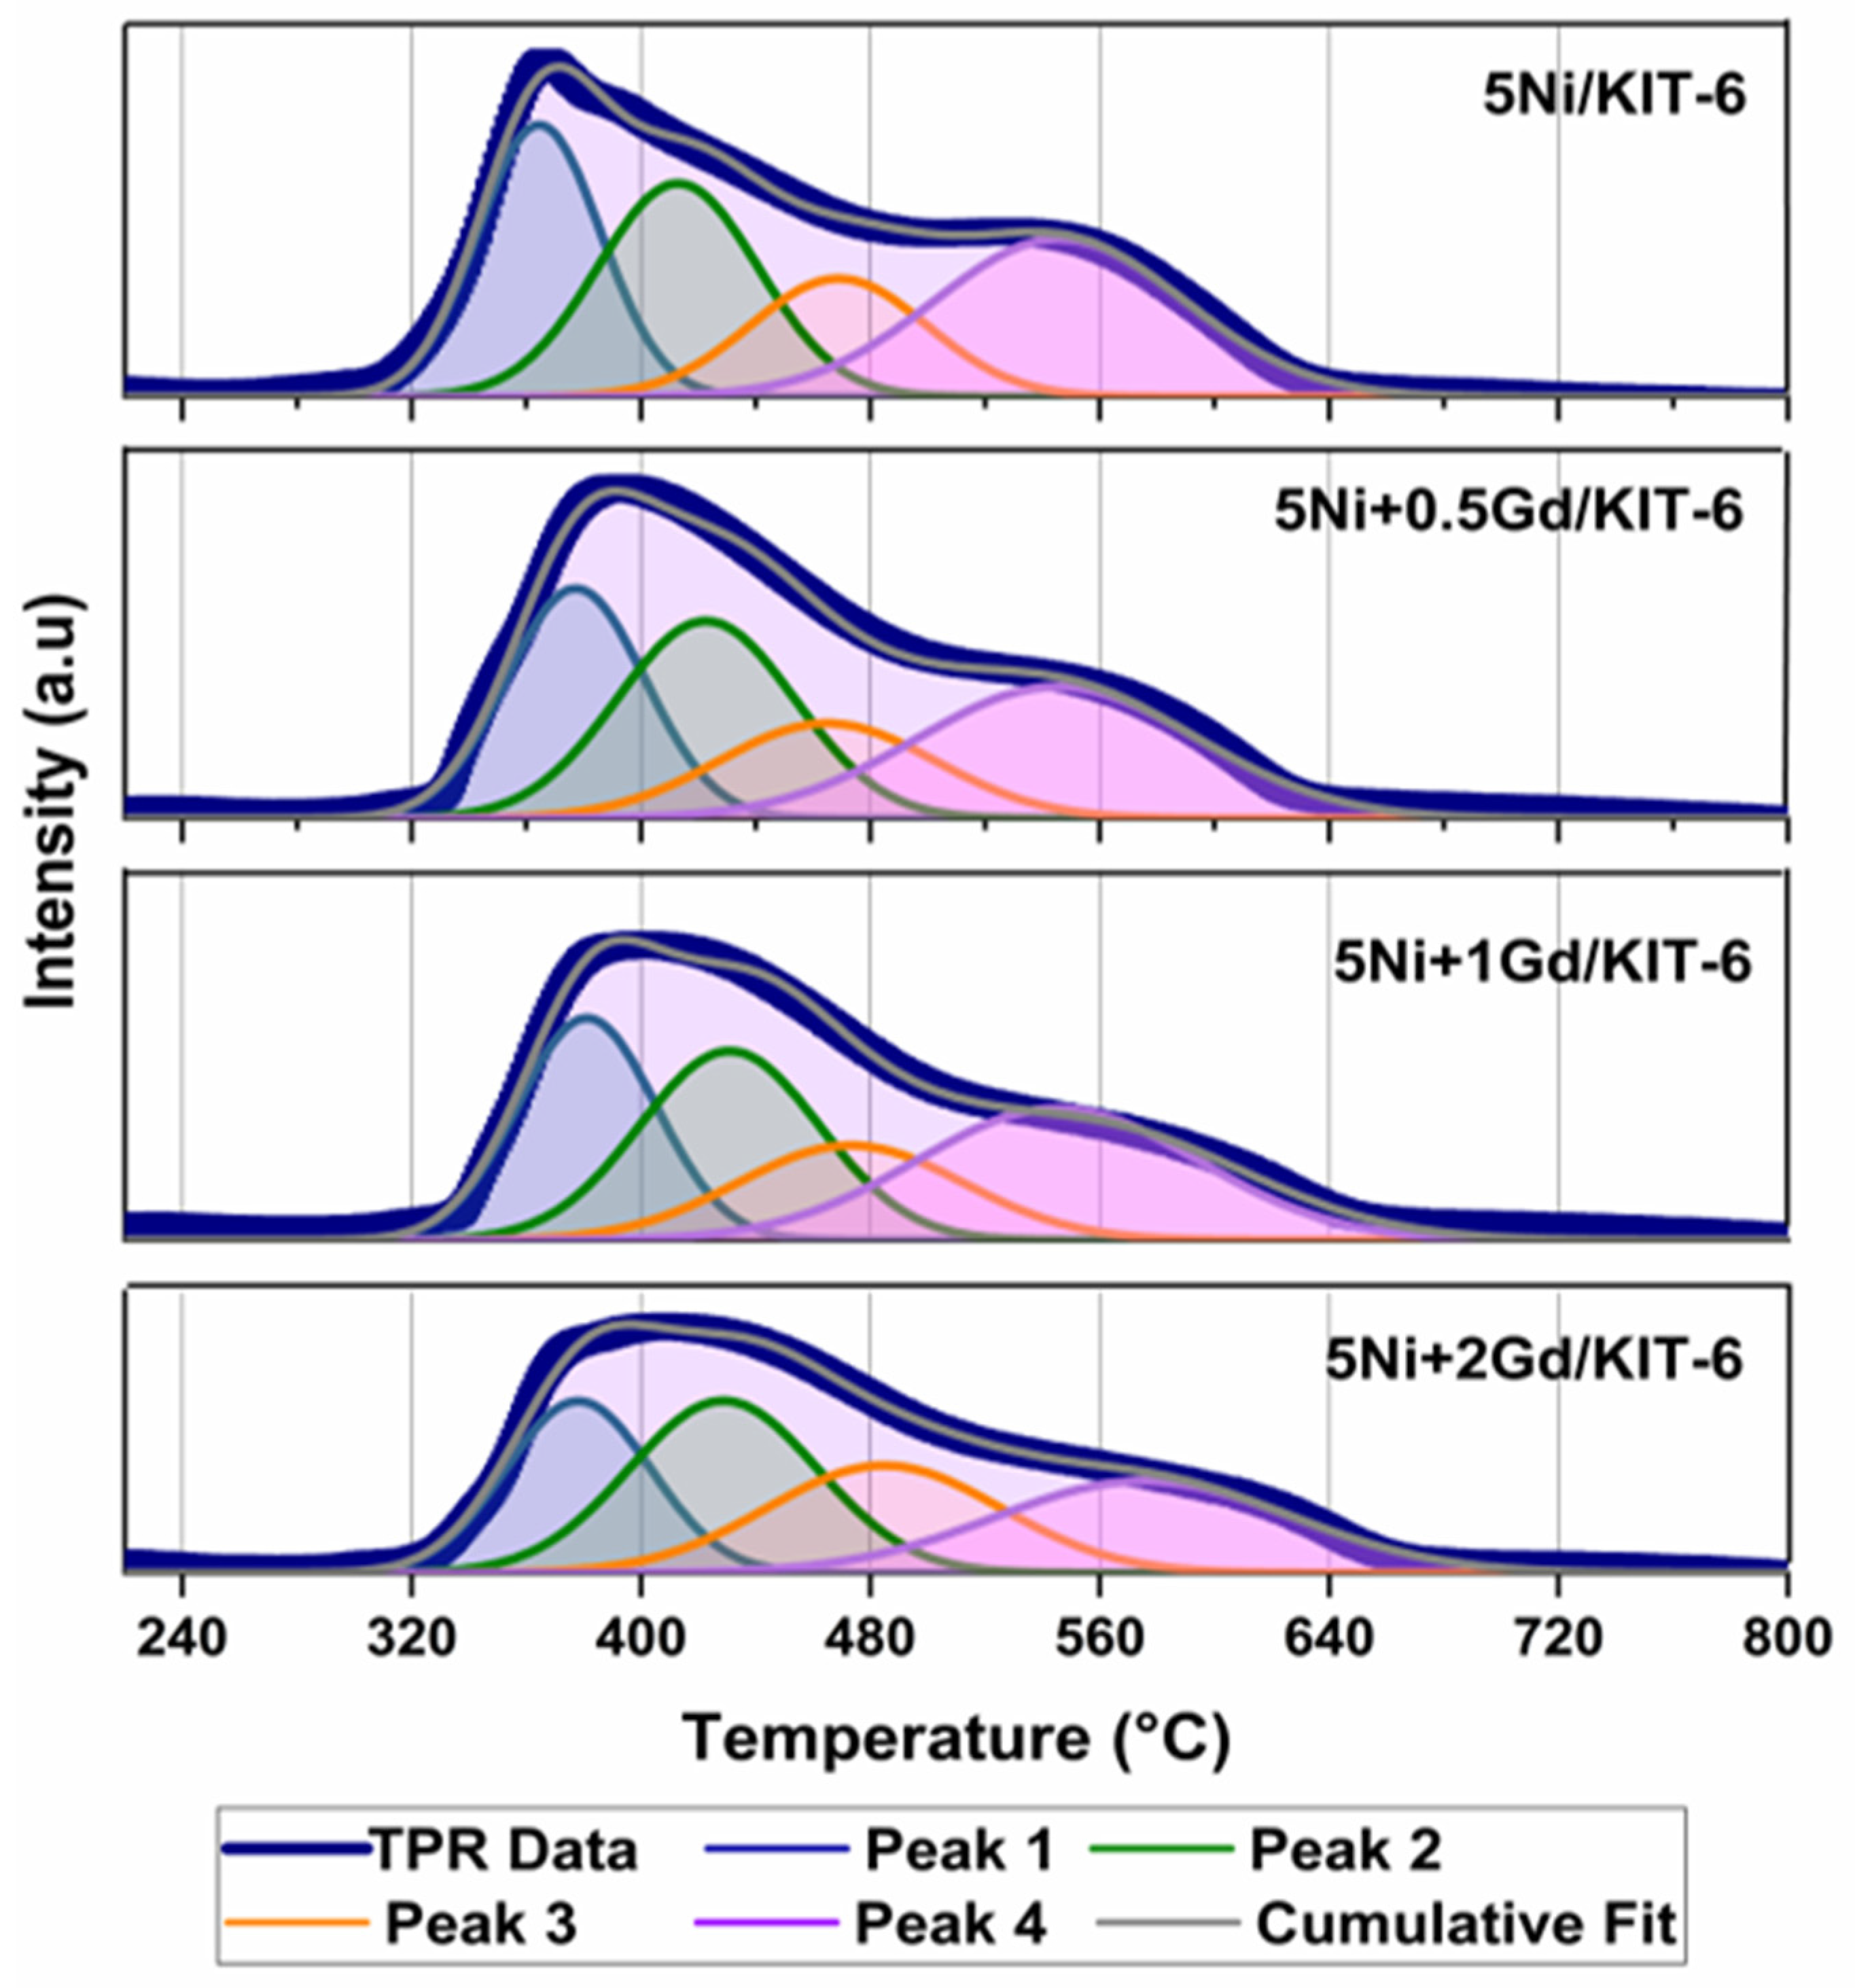
Figure 5 shows the H2-TPR profiles of 5Ni + xGd/KIT-6 (x = 0, 0.5, 1.0, 2.0 wt.%). All samples exhibit a main reduction feature between 300 and 700 °C, assigned to the reduction of NiO to Ni on silica. With Gd, the main peak shifts slightly and broadens, indicating a modified Ni-support interaction [19]. The H2/Ni molar ratios for the Gd-promoted and 5Ni/KIT-6 samples are presented in Table 2. The unpromoted catalyst has an H2/Ni ratio that is just above the stoichiometric 1:1 requirement for turning NiO into Ni0. This is probably because there are bulk-like NiO species that can be easily reduced. Adding Gd brings the ratio closer to one, which means that the reduction process is more controlled. This decrease means that promoting Gd improves the interaction between the metal and the support, which successfully traps Ni species in the KIT-6 framework. This slightly lowers the total amount of H2 used while greatly increasing the thermal stability of the active sites by stopping the formation of large, easily reducible Ni clusters that can easily sinter. Among the promoted catalysts, 1 wt.% Gd shows the lowest T-max and a more symmetric low-temperature contribution, suggesting a more accessible distribution of Ni, whereas at 2 wt.% Gd the peak area/uptake drops further, consistent with partial site blocking (over-promotion). Gd2O3 is not reduced in this range; the measured uptake therefore reflects NiO reduction.

2.6. Catalytic Performance

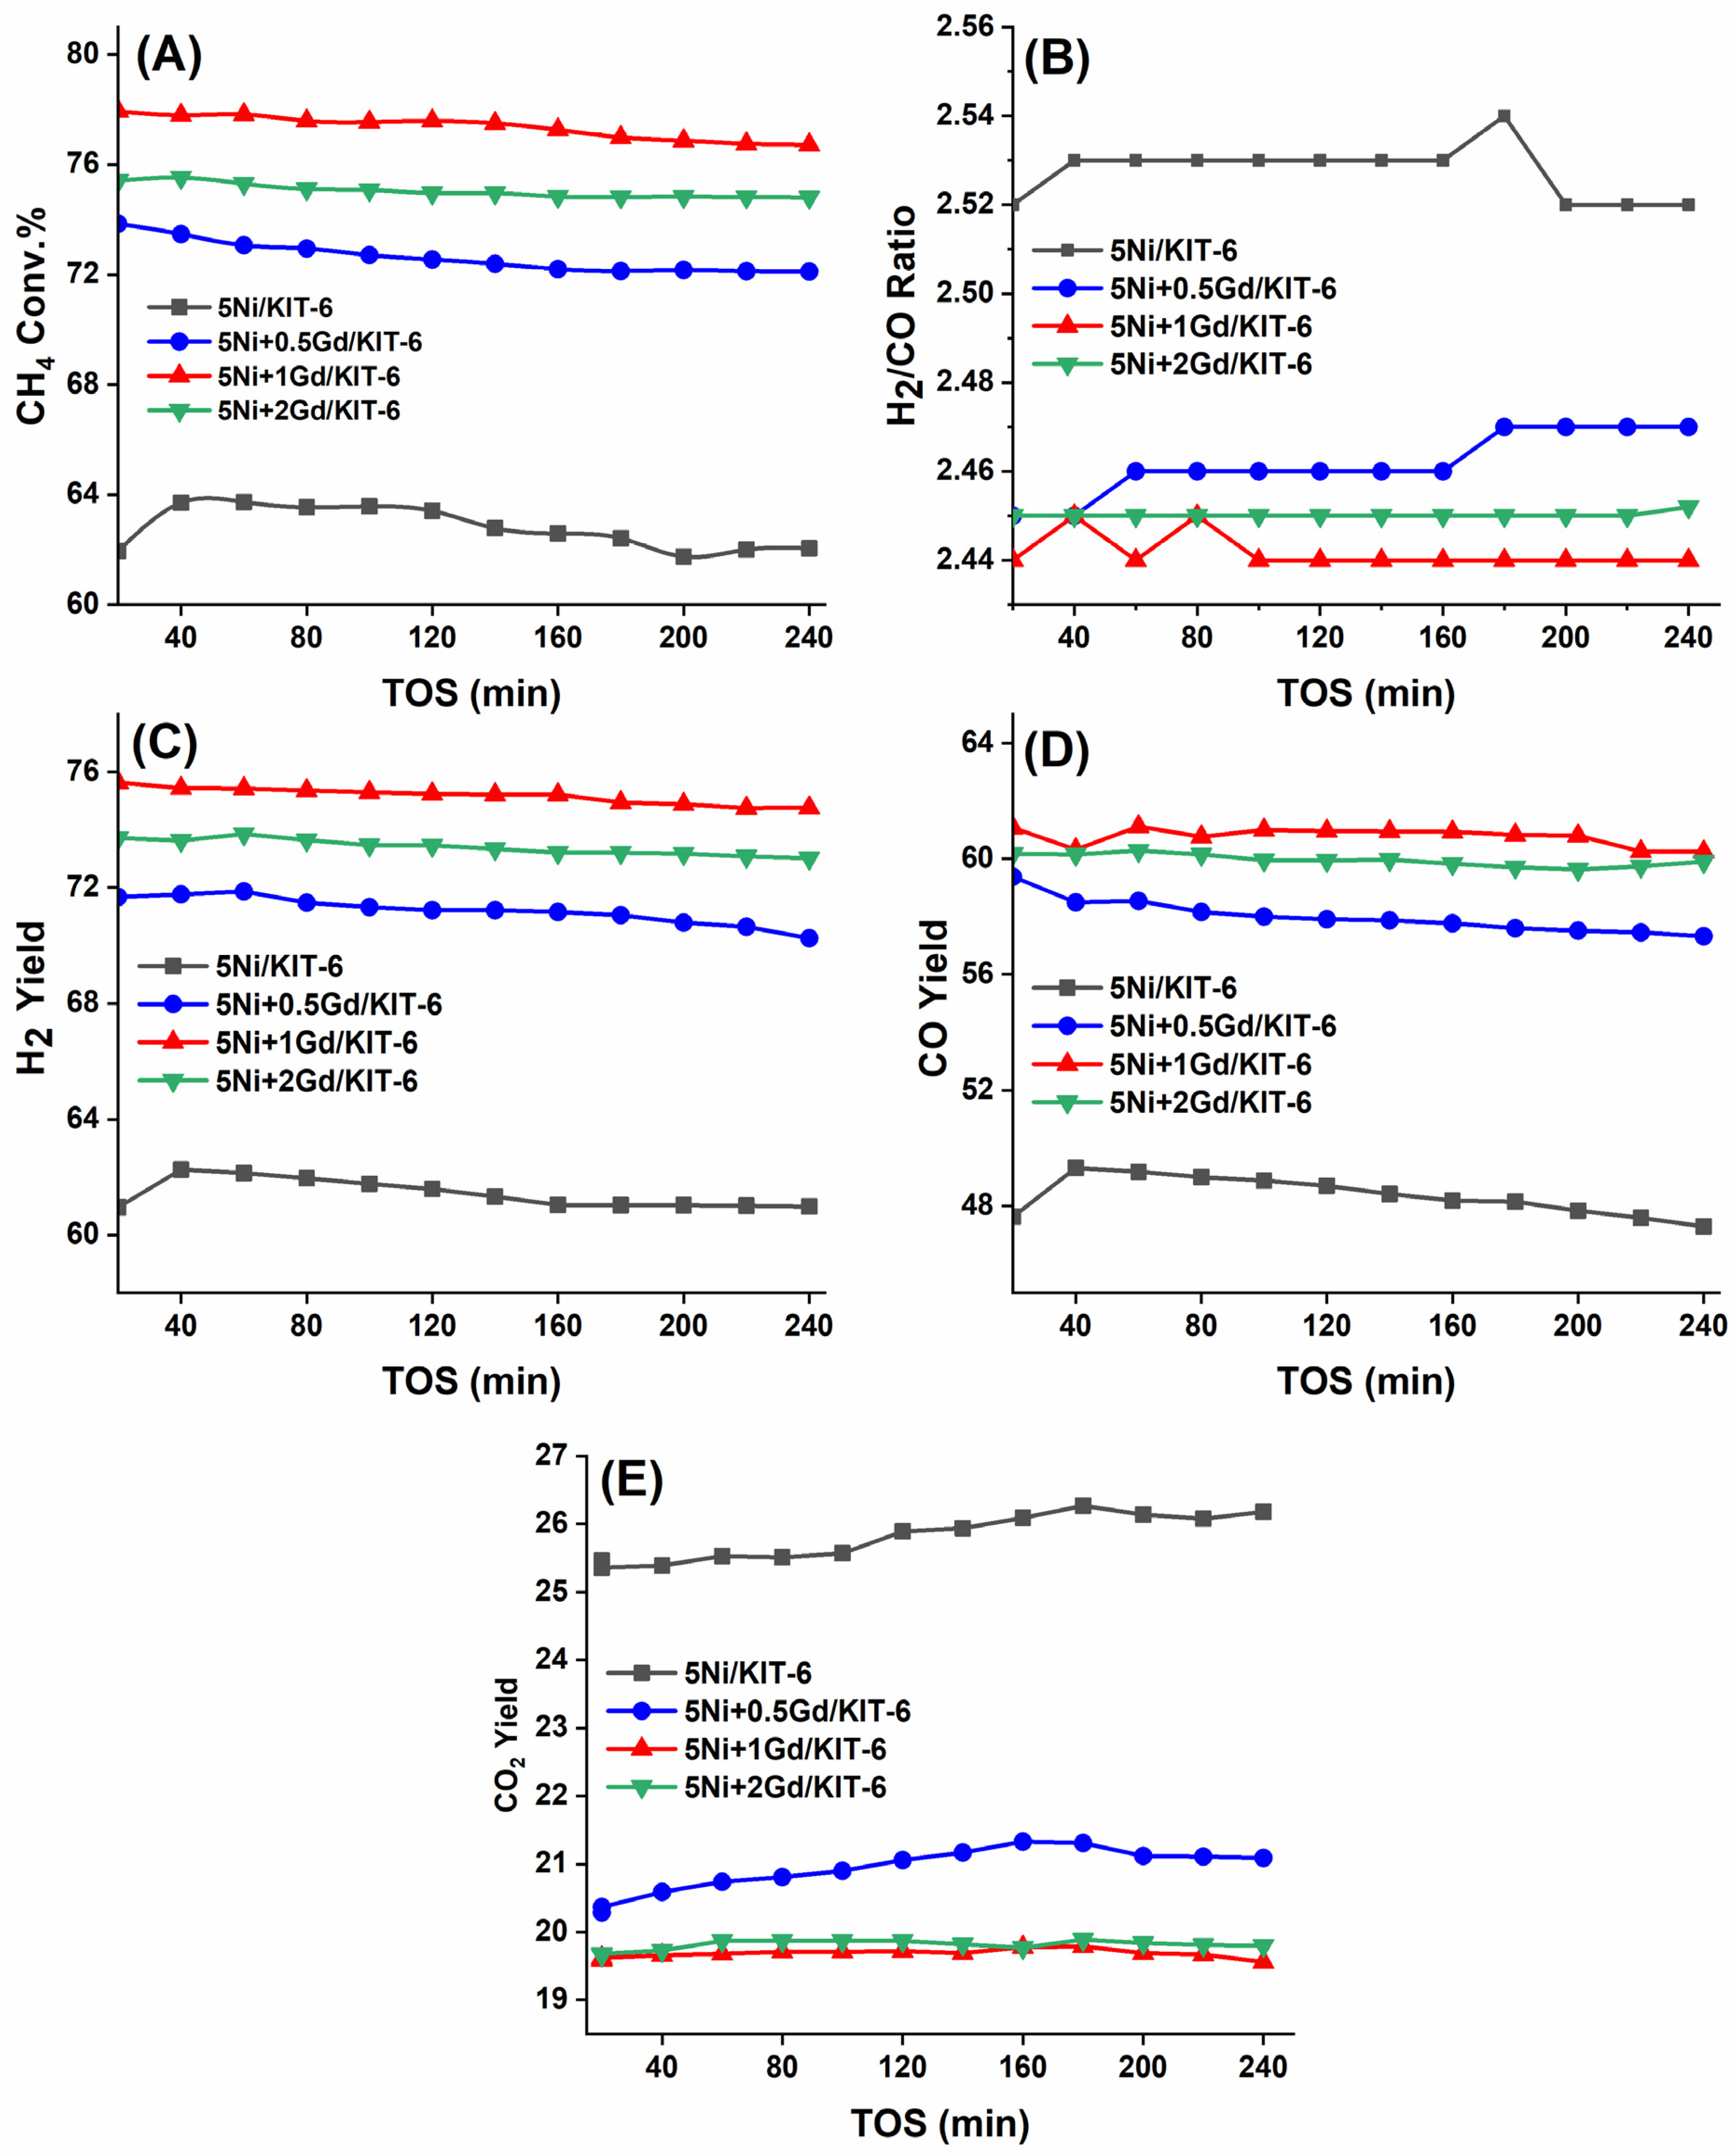
The catalytic performance of Ni + xGd/KIT-6 (x = 0.0, 0.5,1, 2) catalysts was evaluated at 650 °C for the POM, as shown in Figure 6. The unpromoted 5Ni/KIT-6 catalyst exhibited the lowest activity, with a CH4 conversion of 62.8%, an H2 yield of 62%, and a CO yield of 49%. The resulting H2/CO ratio was 2.5, indicating limited syngas quality and optimization. Introducing 0.5 wt.% Gd led to a mild improvement, increasing CH4 conversion to 73.8%, with corresponding H2 and CO yields of 72.6% and 59.4%, respectively. The H2/CO ratio decreased slightly to 2.45. It is noted that H2/CO ratios > 2.0, exceeding the stoichiometry of direct POM (Equation (1)), suggest the occurrence of concurrent steam reforming or water–gas shift reactions (WGSR) utilizing H2O produced from combustion pathways. The best performance was observed with 1 wt.% Gd, achieving 77.9% CH4 conversion, a 75.6% H2 yield, and a 61% CO yield. The H2/CO ratio was 2.4, indicating better syngas selectivity and suppressed CO2 formation. These improvements are consistent with stronger metal–support interactions and literature-reported basicity effects for rare-earth promotion [30]. However, at 2 wt.% Gd, the catalytic performance slightly declined, with CH4 conversion dropping to 75.4%, H2 yield to 73.8%, and CO yield to 60%. This decrease may result from excessive Gd loading, which could block active sites or lead to the formation of inactive Gd-containing phases. When the amount of Gd increases, Gd2O3 can fill the pores of the catalyst. This reduces Ni dispersion, which lowers the density of available active sites. As a result, the catalyst becomes less effective. Table S3 presents the activity performance in tabular form. Sápi et al. [31] establish a crucial benchmark for the efficacy of mesoporous materials in dry reforming (DRM) and CO2 hydrogenation. This study investigates the POM using Gd-promoted Ni/KIT-6 catalysts. It asserts that secondary reactions such as DRM and steam reforming are crucial for elevating the H2/CO ratio to 2.4–2.5. Sápi et al. demonstrate that mesoporous NiO exhibits significant activity independently of noble metal promotion due to its intrinsic formation of metallic Ni/NiOx sites. Both findings demonstrate that ordered mesoporous frameworks, particularly those employing supports such as KIT-6 or SBA-15, are superior in maintaining uniform metal distribution and mitigating sintering in Ni-based catalysts. Sápi has observed that the H2/CO ratios in DRM can exceed unity at elevated temperatures (973 K). This aligns with the primary study’s conclusions that intricate side reactions significantly influence final hydrogen yields, underscoring the critical role of structural engineering in optimizing syngas production.

2.7. TEM Analysis of the Spent Catalysts

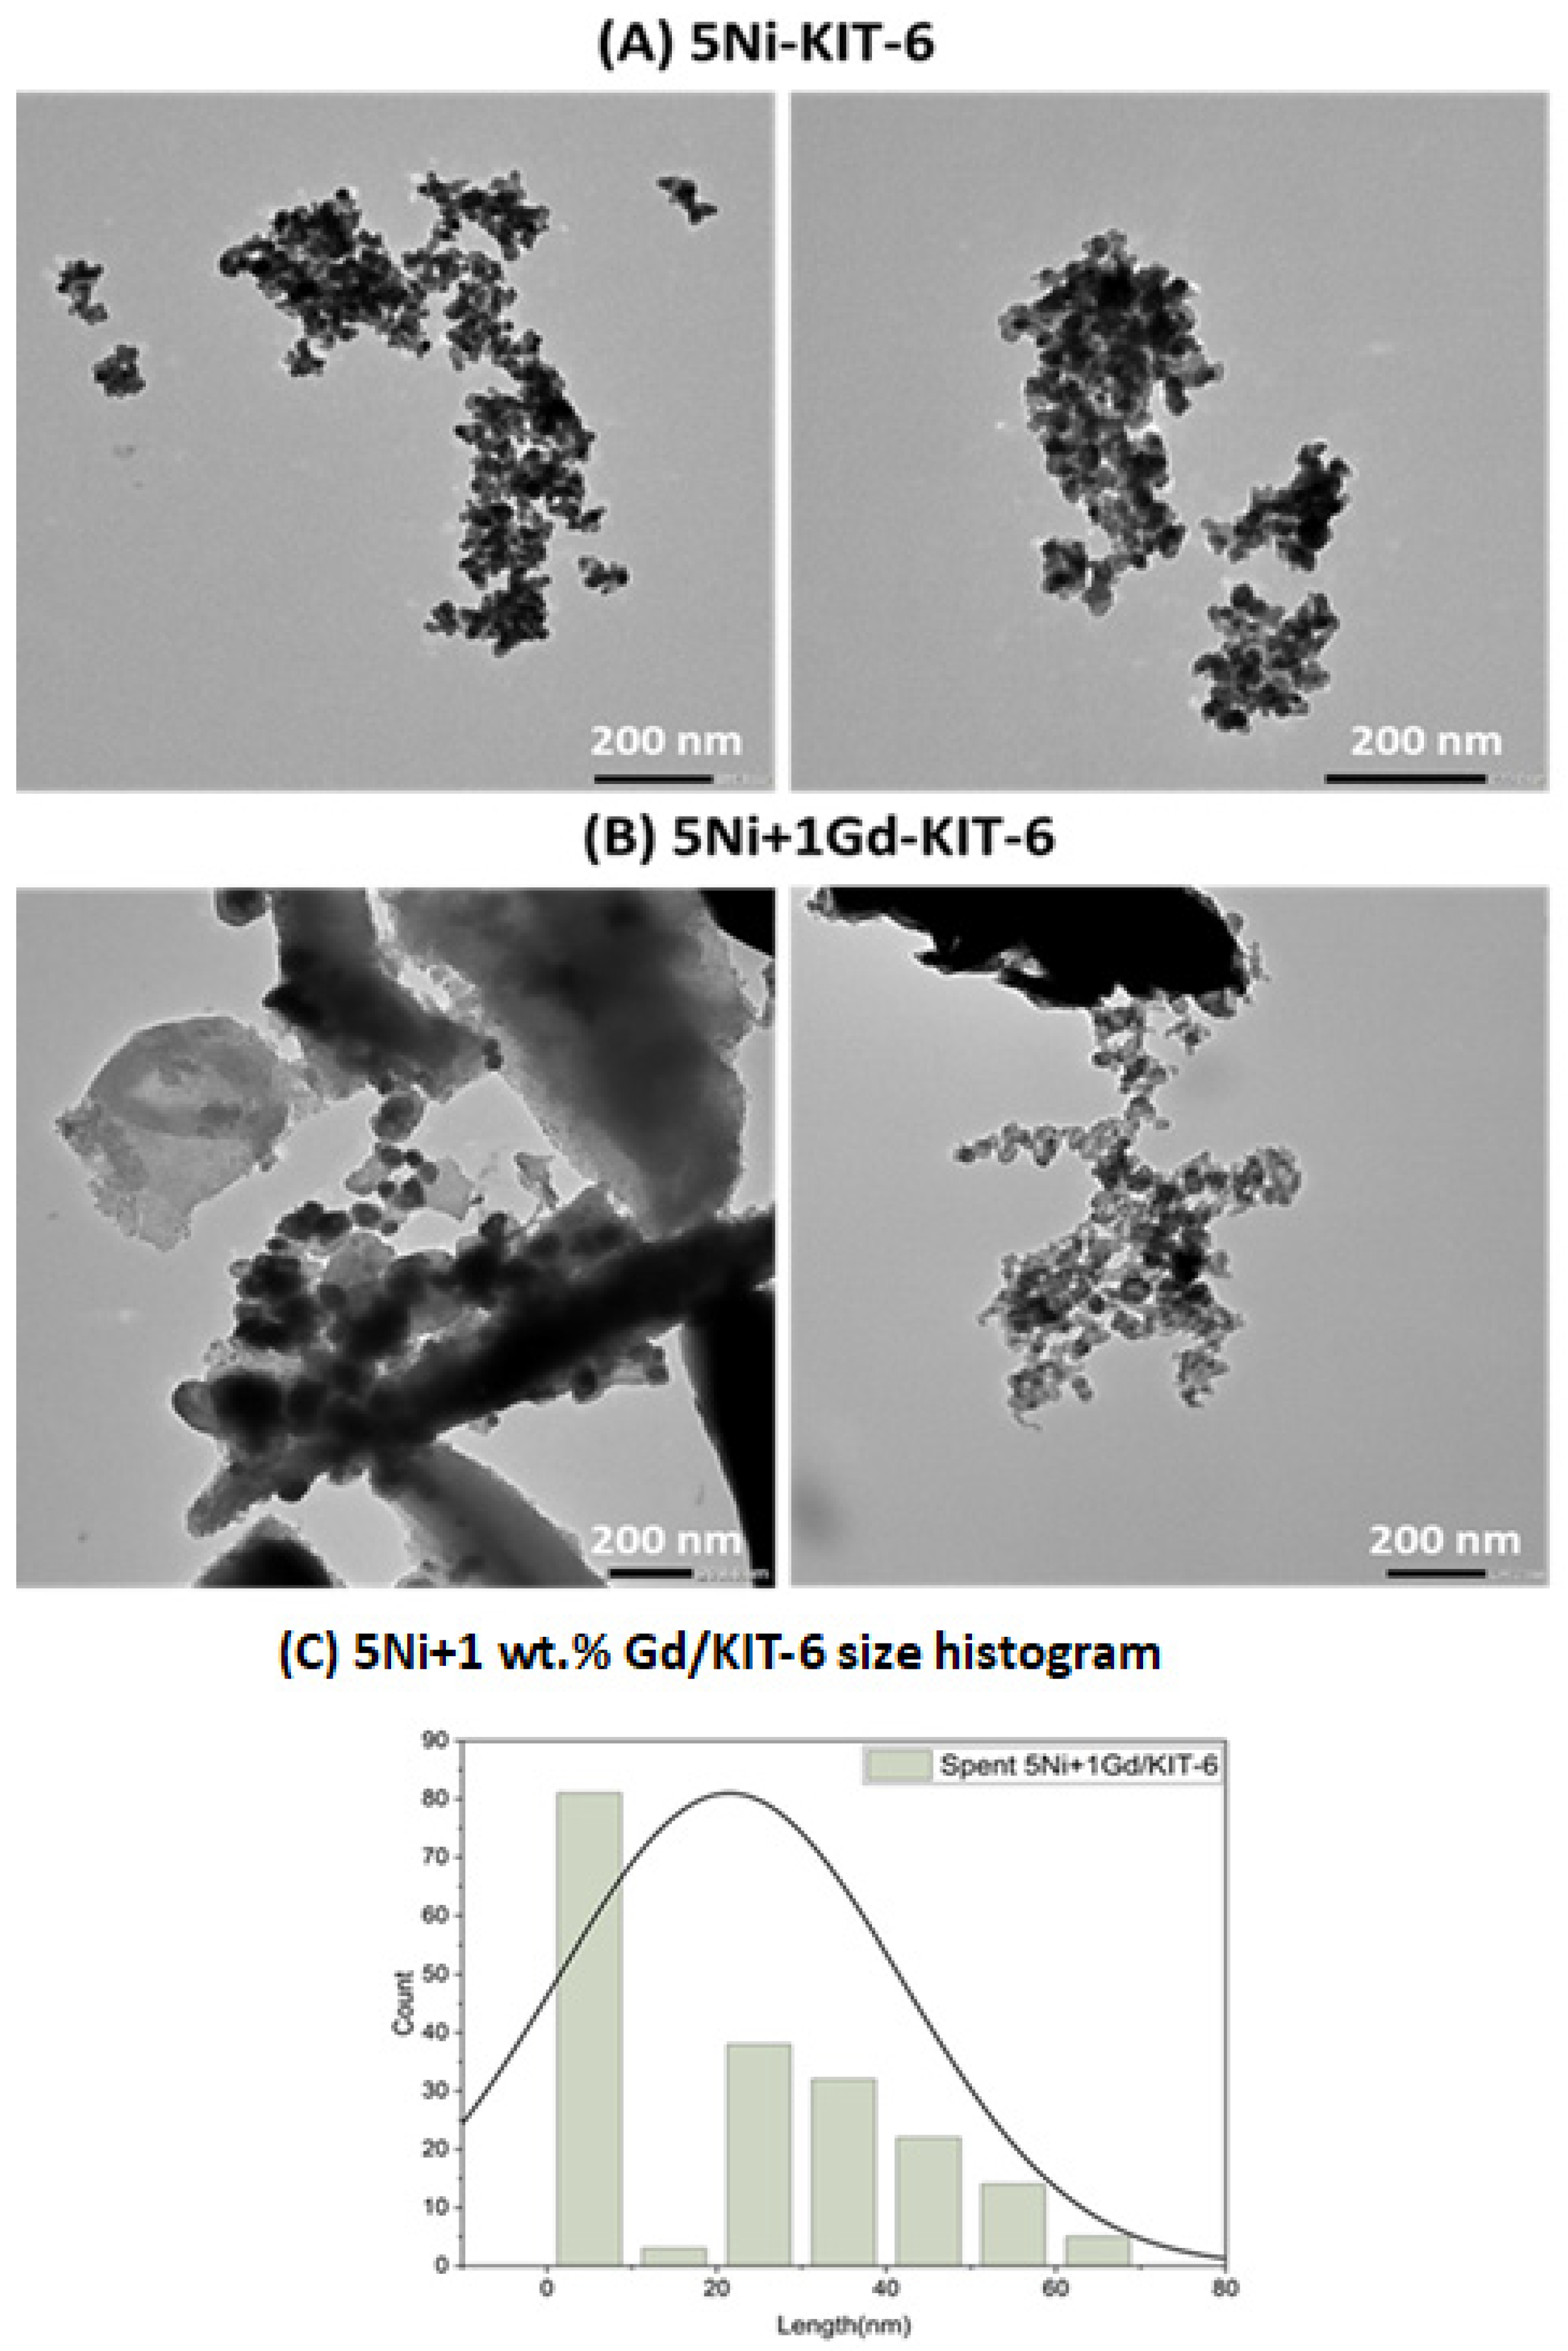
TEM of the spent catalysts in Figure 7 shows pronounced aggregation and sintering for 5Ni/KIT-6, with agglomerate sizes on the order of ~150–300 nm in the micrographs of panel A. In contrast, the 1 wt.% Gd sample (panel B) displays smaller, more finely dispersed particles and reduced coalescence. The corresponding particle-size distribution (panel C) yields a mean size of ~21.5 ± 20.3 nm, indicating that the majority of particles remain below 30 nm after reaction. These morphological features are consistent with suppressed sintering and the improved stability/activity observed for the Gd-promoted catalyst.

2.8. Raman Analysis

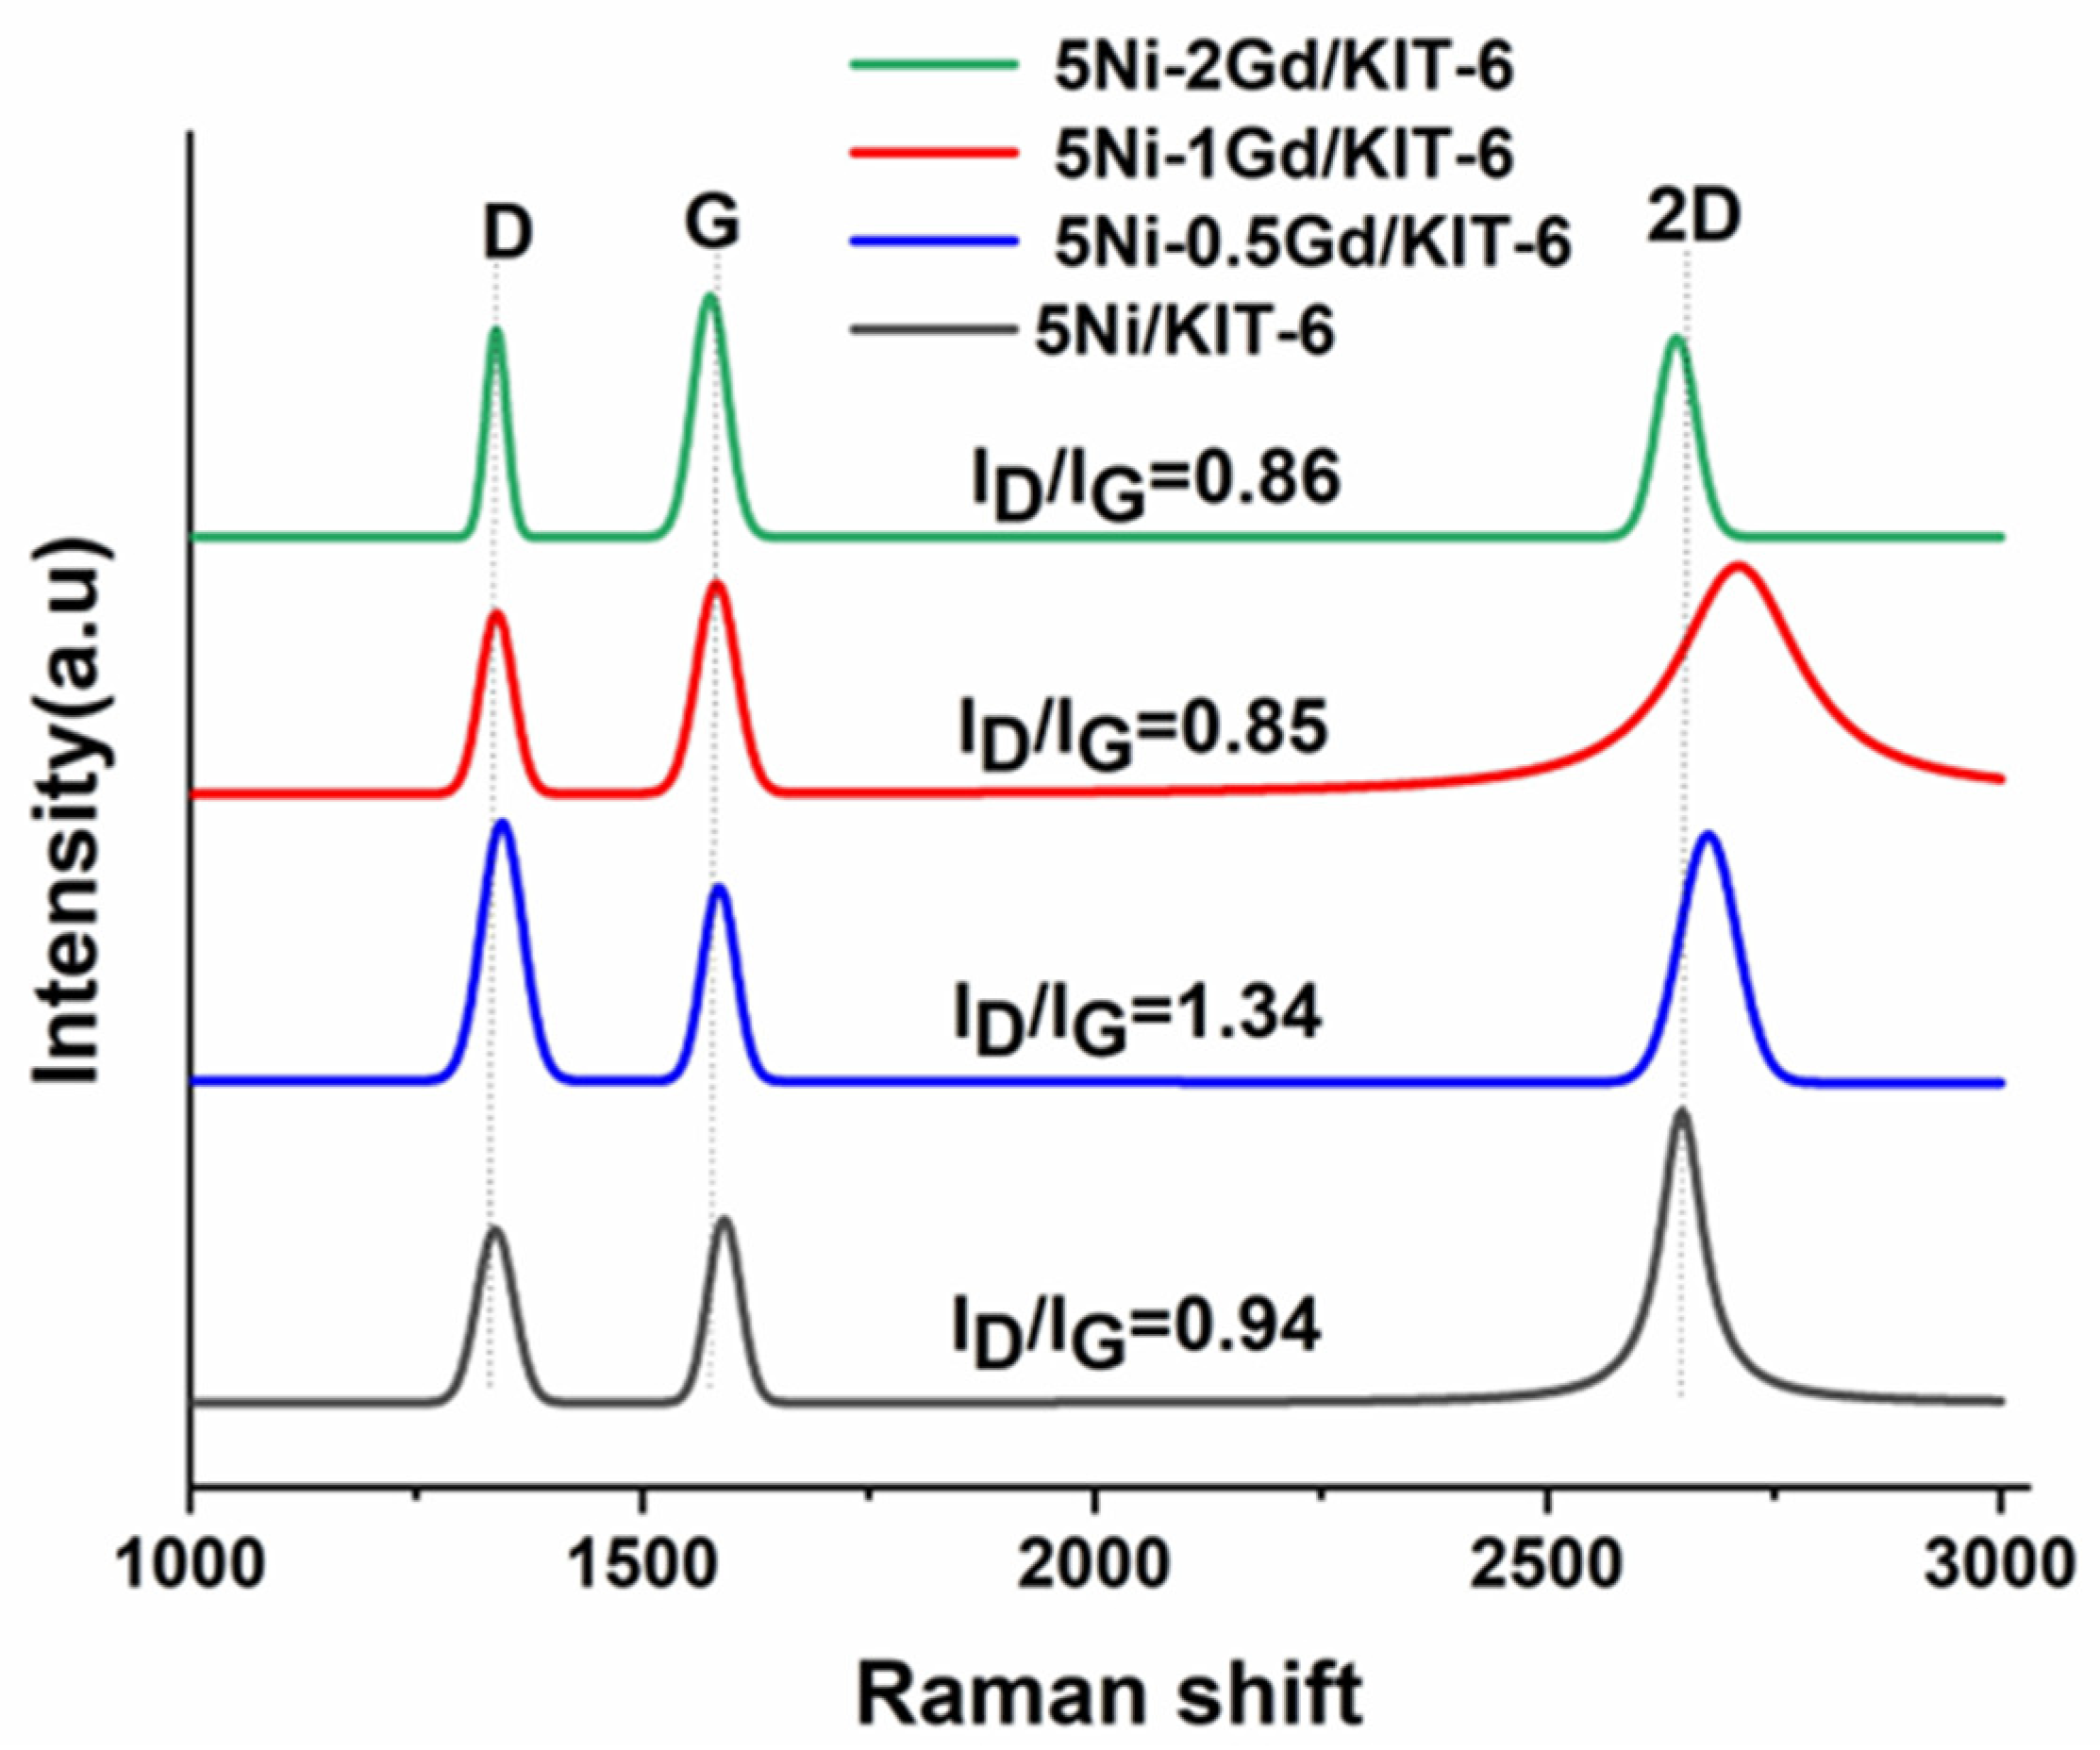
Figure 8 displays the Raman spectra of the spent catalyst, where spectra (D ≈ 1350 cm−1, G ≈ 1580–1590 cm−1, weak 2D ≈ 2700 cm−1) were collected on spent samples under the base condition (650 °C, CH4: O2: N2 = 2:1:1, 3 h). After baseline correction and Lorentzian fitting (n ≥ 3 spots per sample), the ID/IG ratios were: 0.94 ± 0.03 (5Ni/KIT-6), 1.34 ± 0.05 (5Ni + 0.5 Gd/KIT-6), 0.85 ± 0.02 (5Ni + 1 Gd/KIT-6), and 0.86 ± 0.03 (5Ni + 2 Gd/KIT-6). Lower ID/IG indicates more ordered (less defective) carbon; thus, 1 wt.% Gd shows the least disordered coke, while 0.5 wt.% shows the most. The weak 2D band across the series points to mainly turbostratic/poorly stacked carbon rather than well-graphitized layers. The lower ID/IG at 1 wt.% Gd aligns with its steadier H2/CO and higher conversion under the same conditions

2.9. RSM Analysis

The RSM analysis is provided in the Support Information as: RSM Analysis of Partial Oxidation of Methane S1.

2.10. Prediction and Process Optimization

2.10.1. Model Accuracy and Predictive Performance

The statistical evaluation of the model predicting hydrogen yield (YH2) reveals a high degree of accuracy and reliability. As shown in Table S1, the closeness between the actual and predicted values demonstrates the robustness of the fitted model. The mean absolute percentage error (MAPE) was found to be 1.62%, indicating that, on average, the model’s predictions deviate by only 1.62% from the experimental values. This low error percentage supports the model’s suitability for predictive analysis and process optimization.
Furthermore, the ANOVA results indicate an R2 value of 0.9917, meaning that approximately 99.17% of the variance in hydrogen yield is explained by the model. The strong predictive capability is further supported by the adjusted R2, which accounts for the number of terms in the model and remains high, ensuring that overfitting is minimal. The predicted R2 also remains above 0.99 (as visualized in Figure 9), reinforcing that the model maintains high accuracy when used to predict new data points.

2.10.2. Factor Significance and Interaction Analysis (ANOVA)

Analysis of Variance (ANOVA), shown in Table S2, was used to assess the statistical significance of the developed quadratic models and the individual factors influencing each response. Results were considered statistically significant if the p-value was less than 0.05. As can be seen from Table S1, the model for methane conversion was highly significant, with an F-value of 164.44 and a p-value of < 0.0001. There is only a 0.01% chance that such a large F-value could occur due to noise. The main effects of temperature (A), SV (B), and CH4/O2 ratio (C), the two-way interactions between temperature and SV (AB) and temperature and ratio (AC), and the quadratic effect of temperature (A2) were all found to be significant model terms (p < 0.05). On the other hand, the interaction between SV and ratio (BC), and the quadratic terms for SV (B2) and ratio (C2) were not significant. The largest F-value of 1041.53 for temperature indicates that this factor is the most influential one affecting methane conversion. The model for the H2/CO ratio was also statistically significant, with an F-value of 254.02 and a p-value < 0.0001. All model terms were found to be significant except for the main and quadratic effects of SV (B and B2). The significant terms are A, C, AB, AC, BC, A2, and C2. Again, the temperature was the most dominant factor with an F-value of 1380.43, followed by the quadratic effect of temperature (A2) and the interaction between temperature and the CH4/O2 ratio (AC). For hydrogen yield, the model was determined to be significant, with an F-value of 186.60 and a p-value < 0.0001. Similarly to methane conversion, the significant model terms were the main effects A, B, and C, the interactions AB and AC, and the quadratic term A2. The BC interaction and the quadratic terms B2 and C2 were insignificant. Also, the temperature had the most profound impact on hydrogen yield, evidenced by its F-value of 1188.81. The model for CO yield was significant with an F-value of 102.25 and a p-value < 0.0001. The significant model terms were temperature (A), SV (B), the interaction between them (AB), and the quadratic term for temperature (A2). The main effect of the CH4/O2 ratio (C) and its interaction with temperature (AC) were marginally significant (slightly higher than the p < 0.05 threshold), with p-values of 0.0654 and 0.0725, respectively. The remaining terms (BC, B2, C2) were not significant. The temperature was again the most dominant factor with an F-value of 814.14. The adequacy and accuracy of the models were validated by comparing the predicted values with the experimental (actual) values. As shown in Figure S1, the data points for all four responses are tightly clustered around the 45-degree line, indicating a strong correlation between the experimental results and the values predicted by the models.
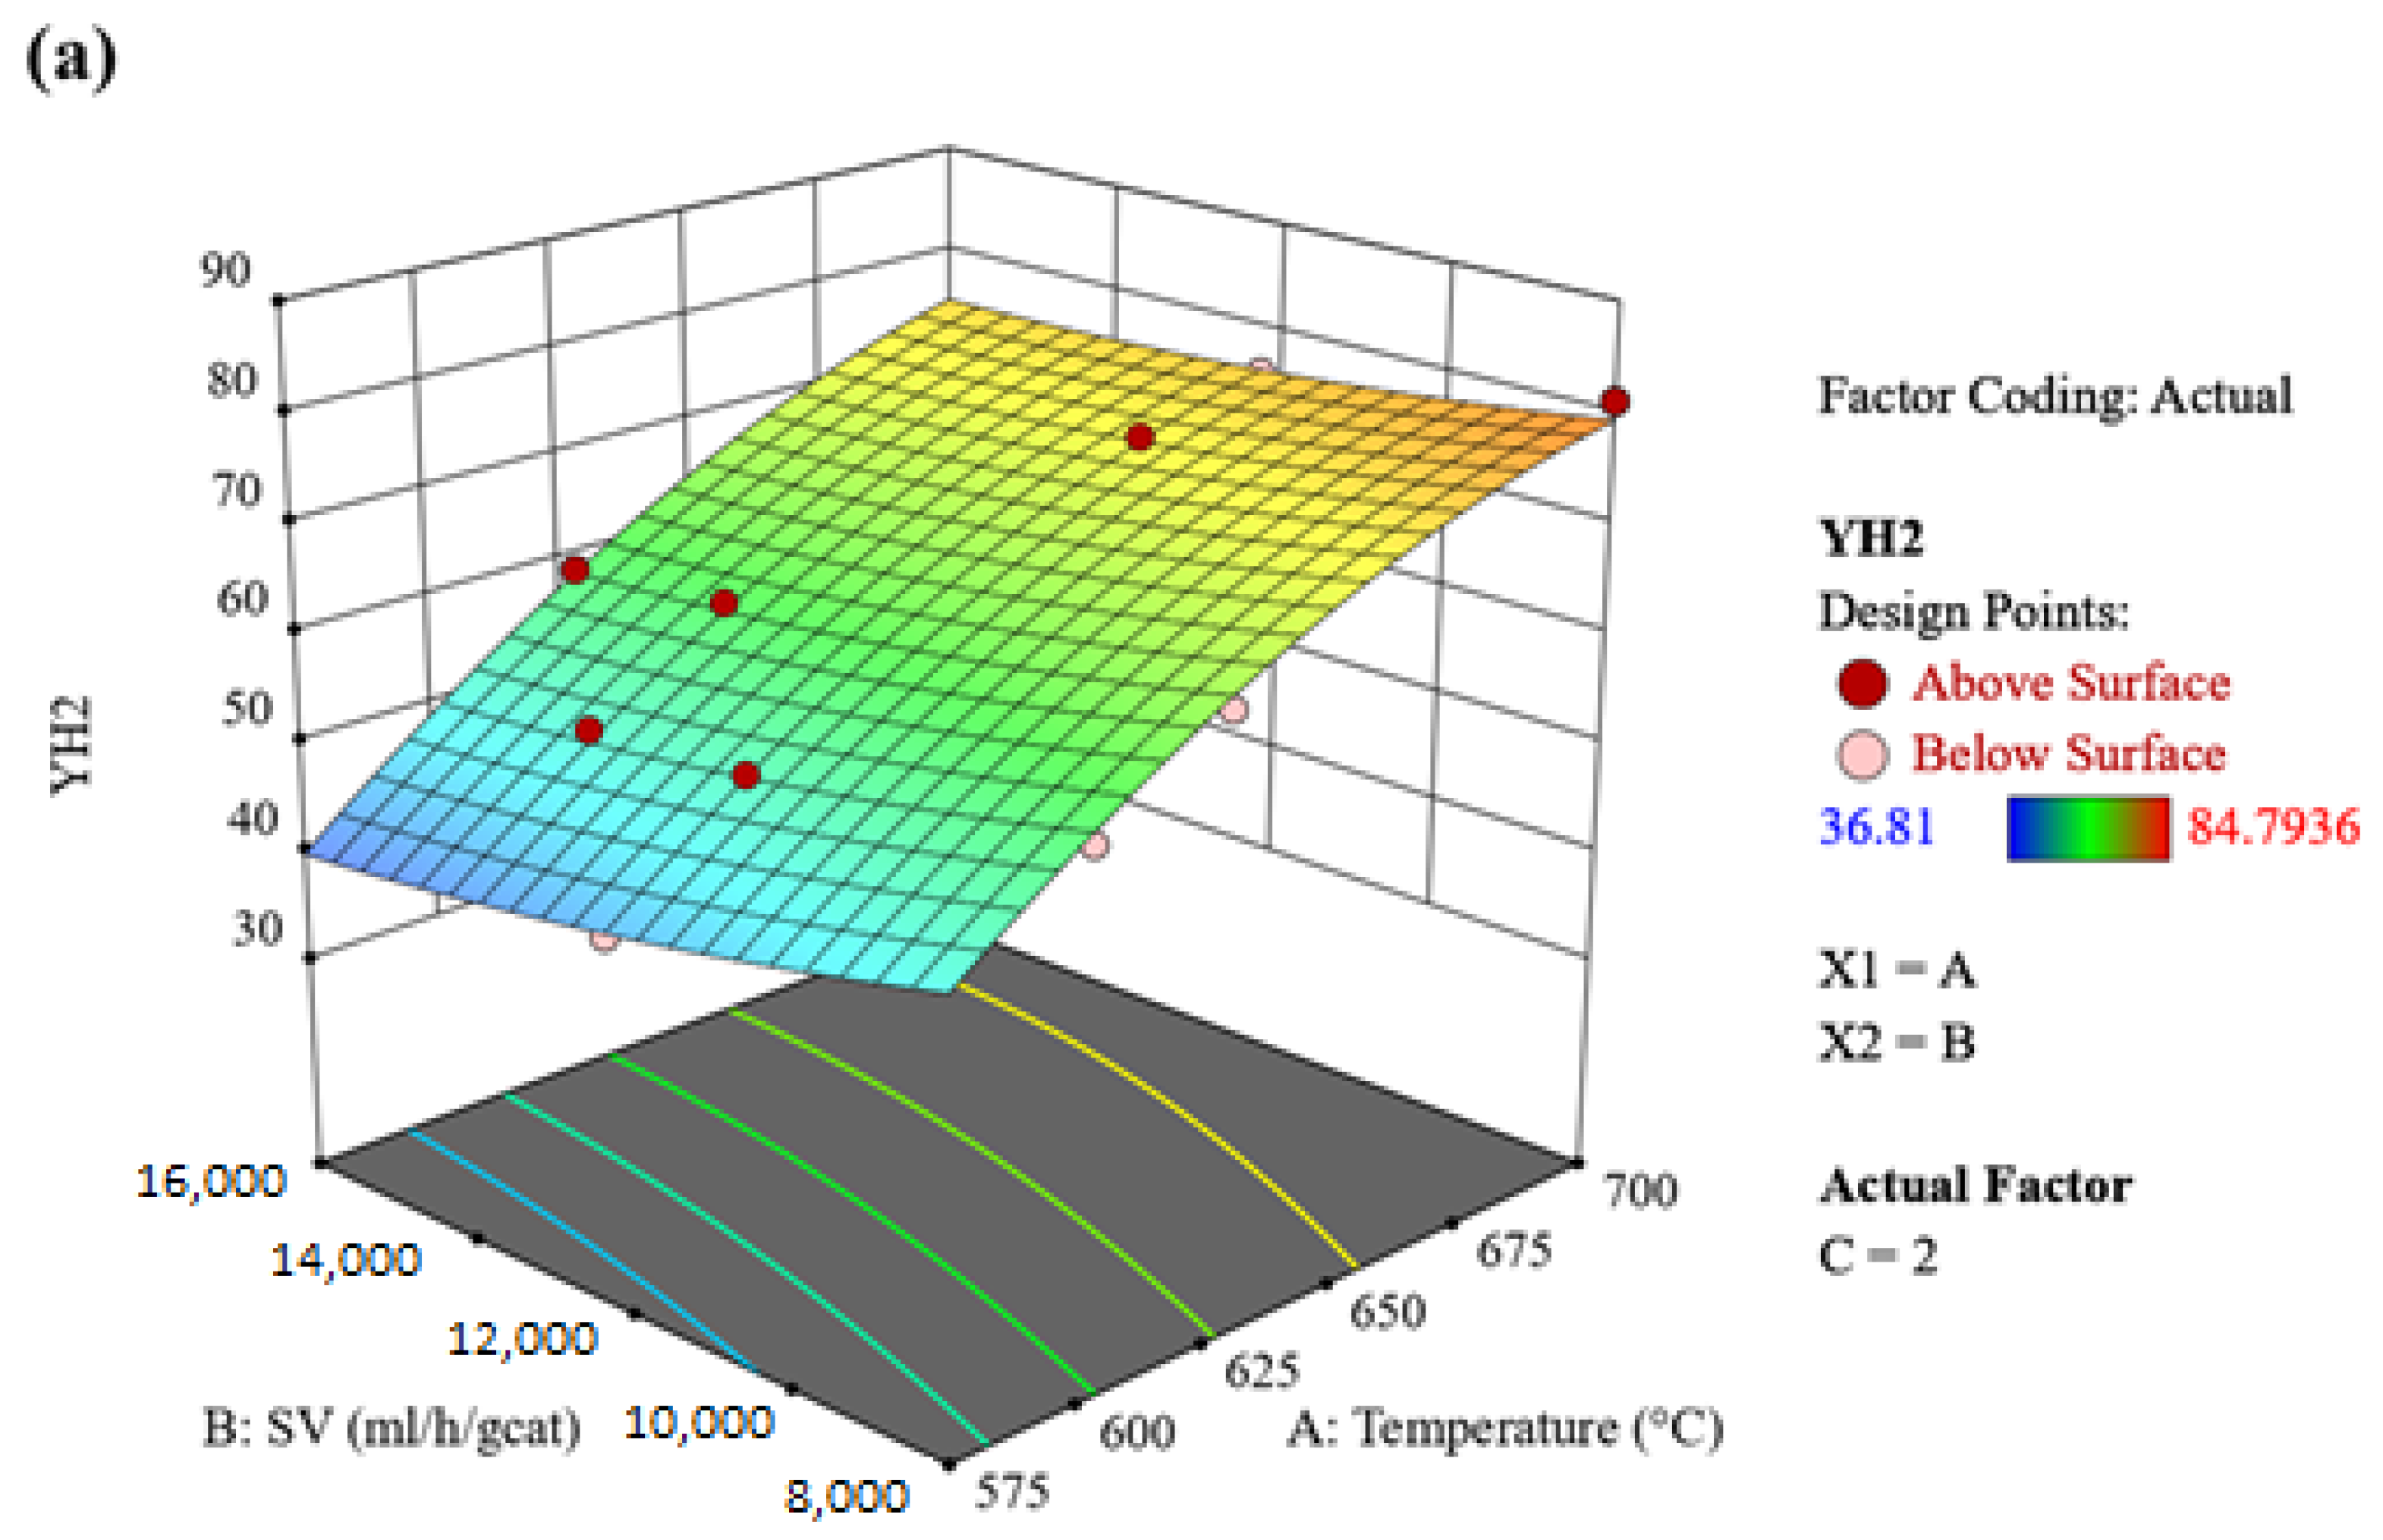
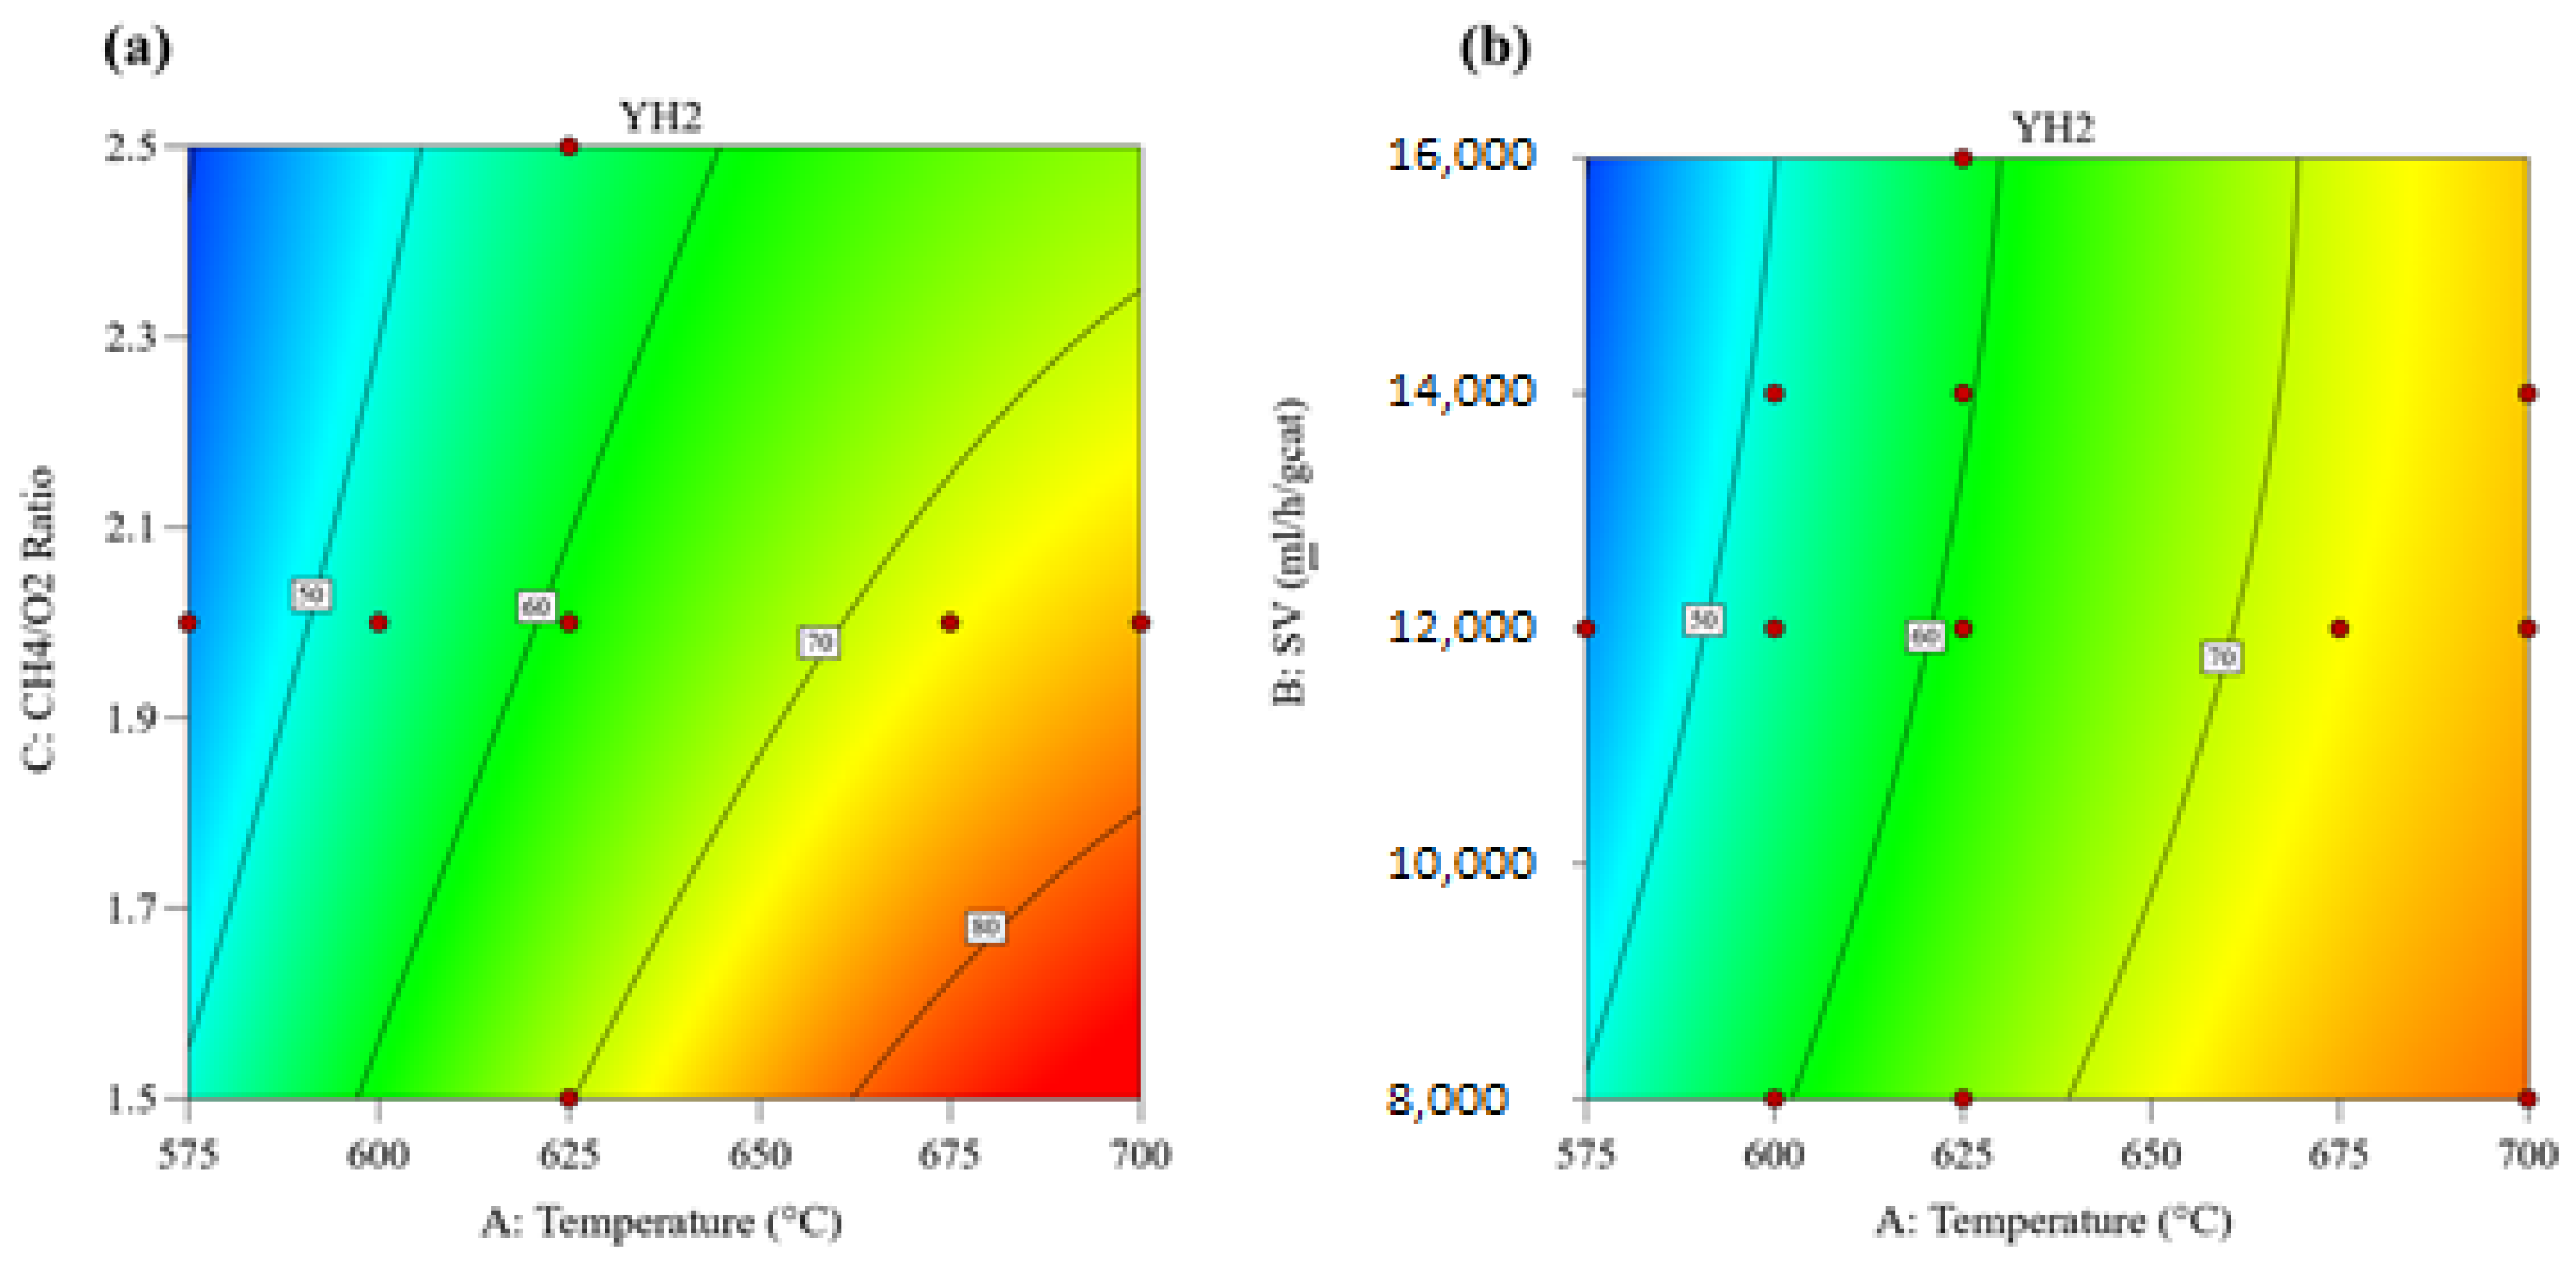
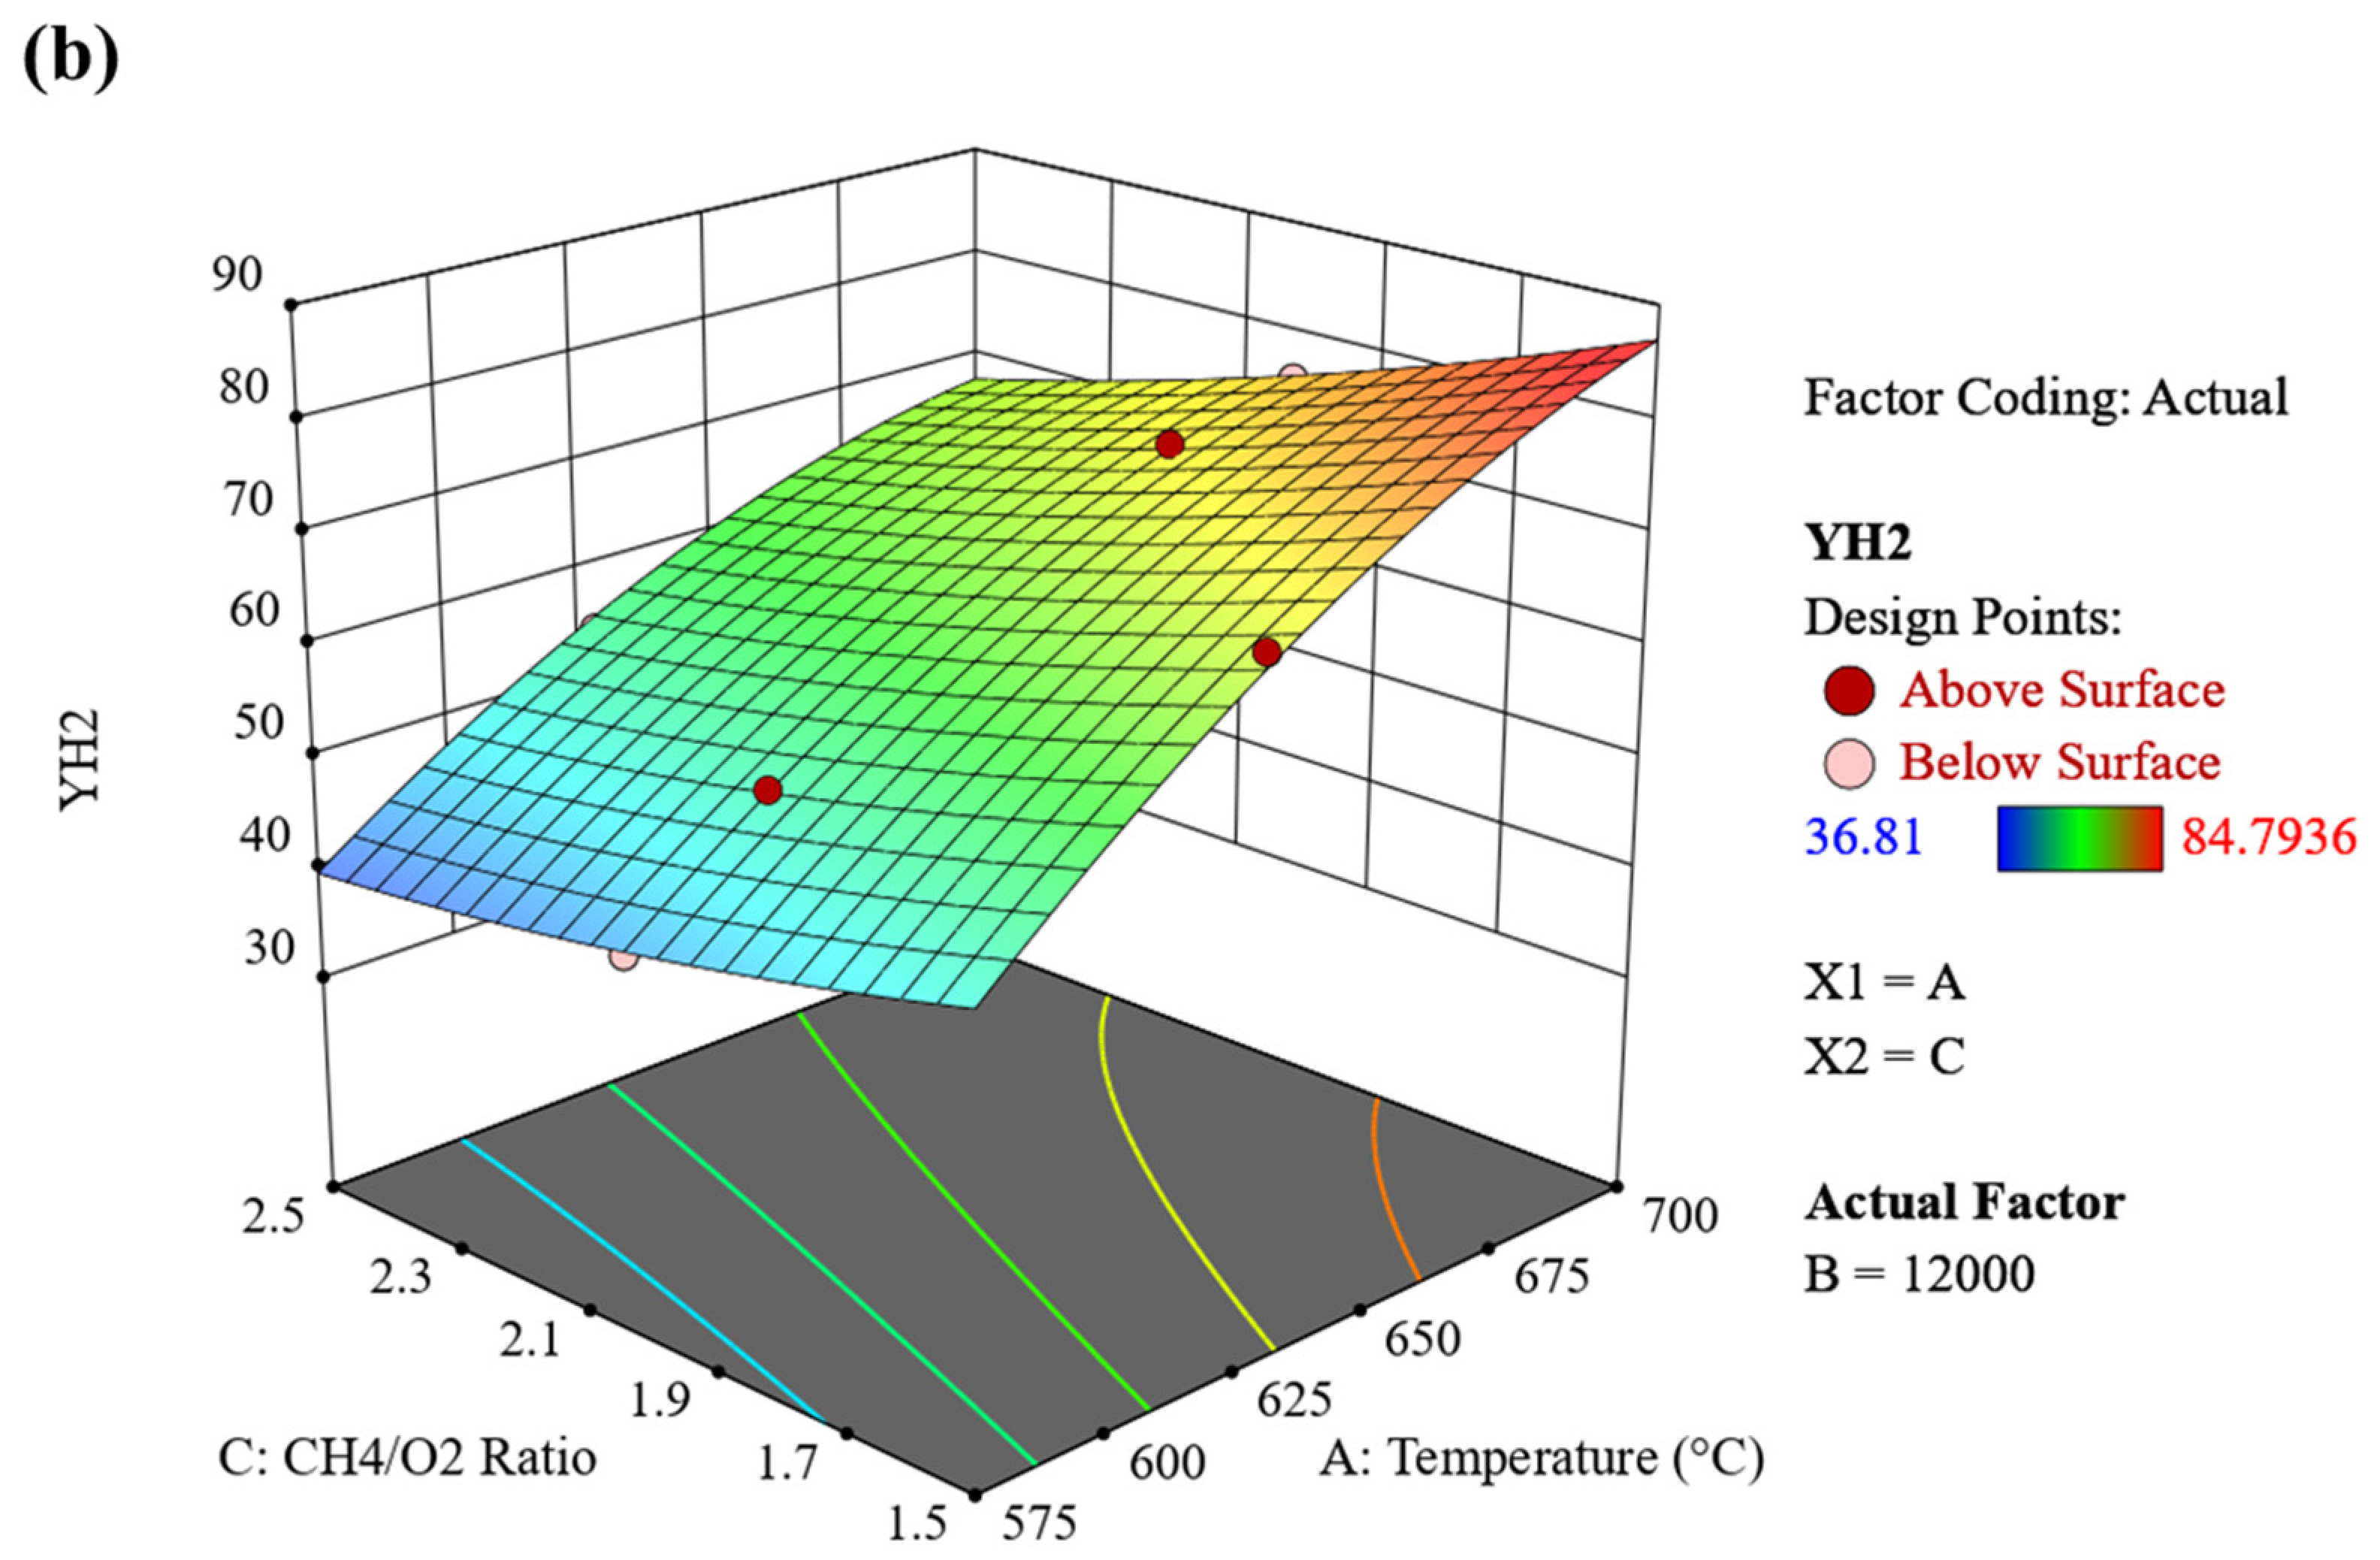
The high predictive capability of the models is further confirmed by the low average error percentages between the actual and predicted values, shown in Table S1 of the Supporting Information. The average error percentages for XCH4, H/CO ratio, YH2, and YCO are 1.67, 0.89, 1.62, and 3.49, respectively. These low error margins underscore the robustness and reliability of the developed regression models for predicting the system’s behaviour within the studied range. The 3D surface and contour plots are instrumental in visualizing the interactive effects of the independent variables on the responses. The contour plots and 3D surface plots for hydrogen yield (YH2) are presented in Figure 9 and Figure 10, respectively. The interaction between temperature (A) and the CH4/O2 ratio (C), Figure 9a, demonstrates that the highest hydrogen yields are achieved at high temperatures and low CH4/O2 ratios. As the ratio decreases from 2.5 to 1.5, YH2 increases substantially, particularly at temperatures above 650 °C. This highlights a strong synergistic effect between these two factors, which was also confirmed by the significance of the AC interaction term in the ANOVA. Similarly, for interaction between temperature (A) and SV (B), Figure 9b, the highest hydrogen yields are also found to be achieved at high temperatures and low SV values. Furthermore, the 3D surface plot, Figure 10, shows that YH2 increases significantly as the reaction temperature is raised from 575 °C to 700 °C. Conversely, an increase in space velocity from 8000 to 16,000 mL/h/gcat leads to a decrease in YH2. This suggests that lower space velocity provides longer residence time for more hydrogen production.
Furthermore, the 3D surface plot, Figure 10, shows that YH2 increases significantly as the reaction temperature is raised from 575 °C to 700 °C. Conversely, an increase in space velocity from 8000 to 16,000 mL/h/gcat leads to a decrease in YH2. This suggests that lower space velocity provides longer residence time for more hydrogen production.
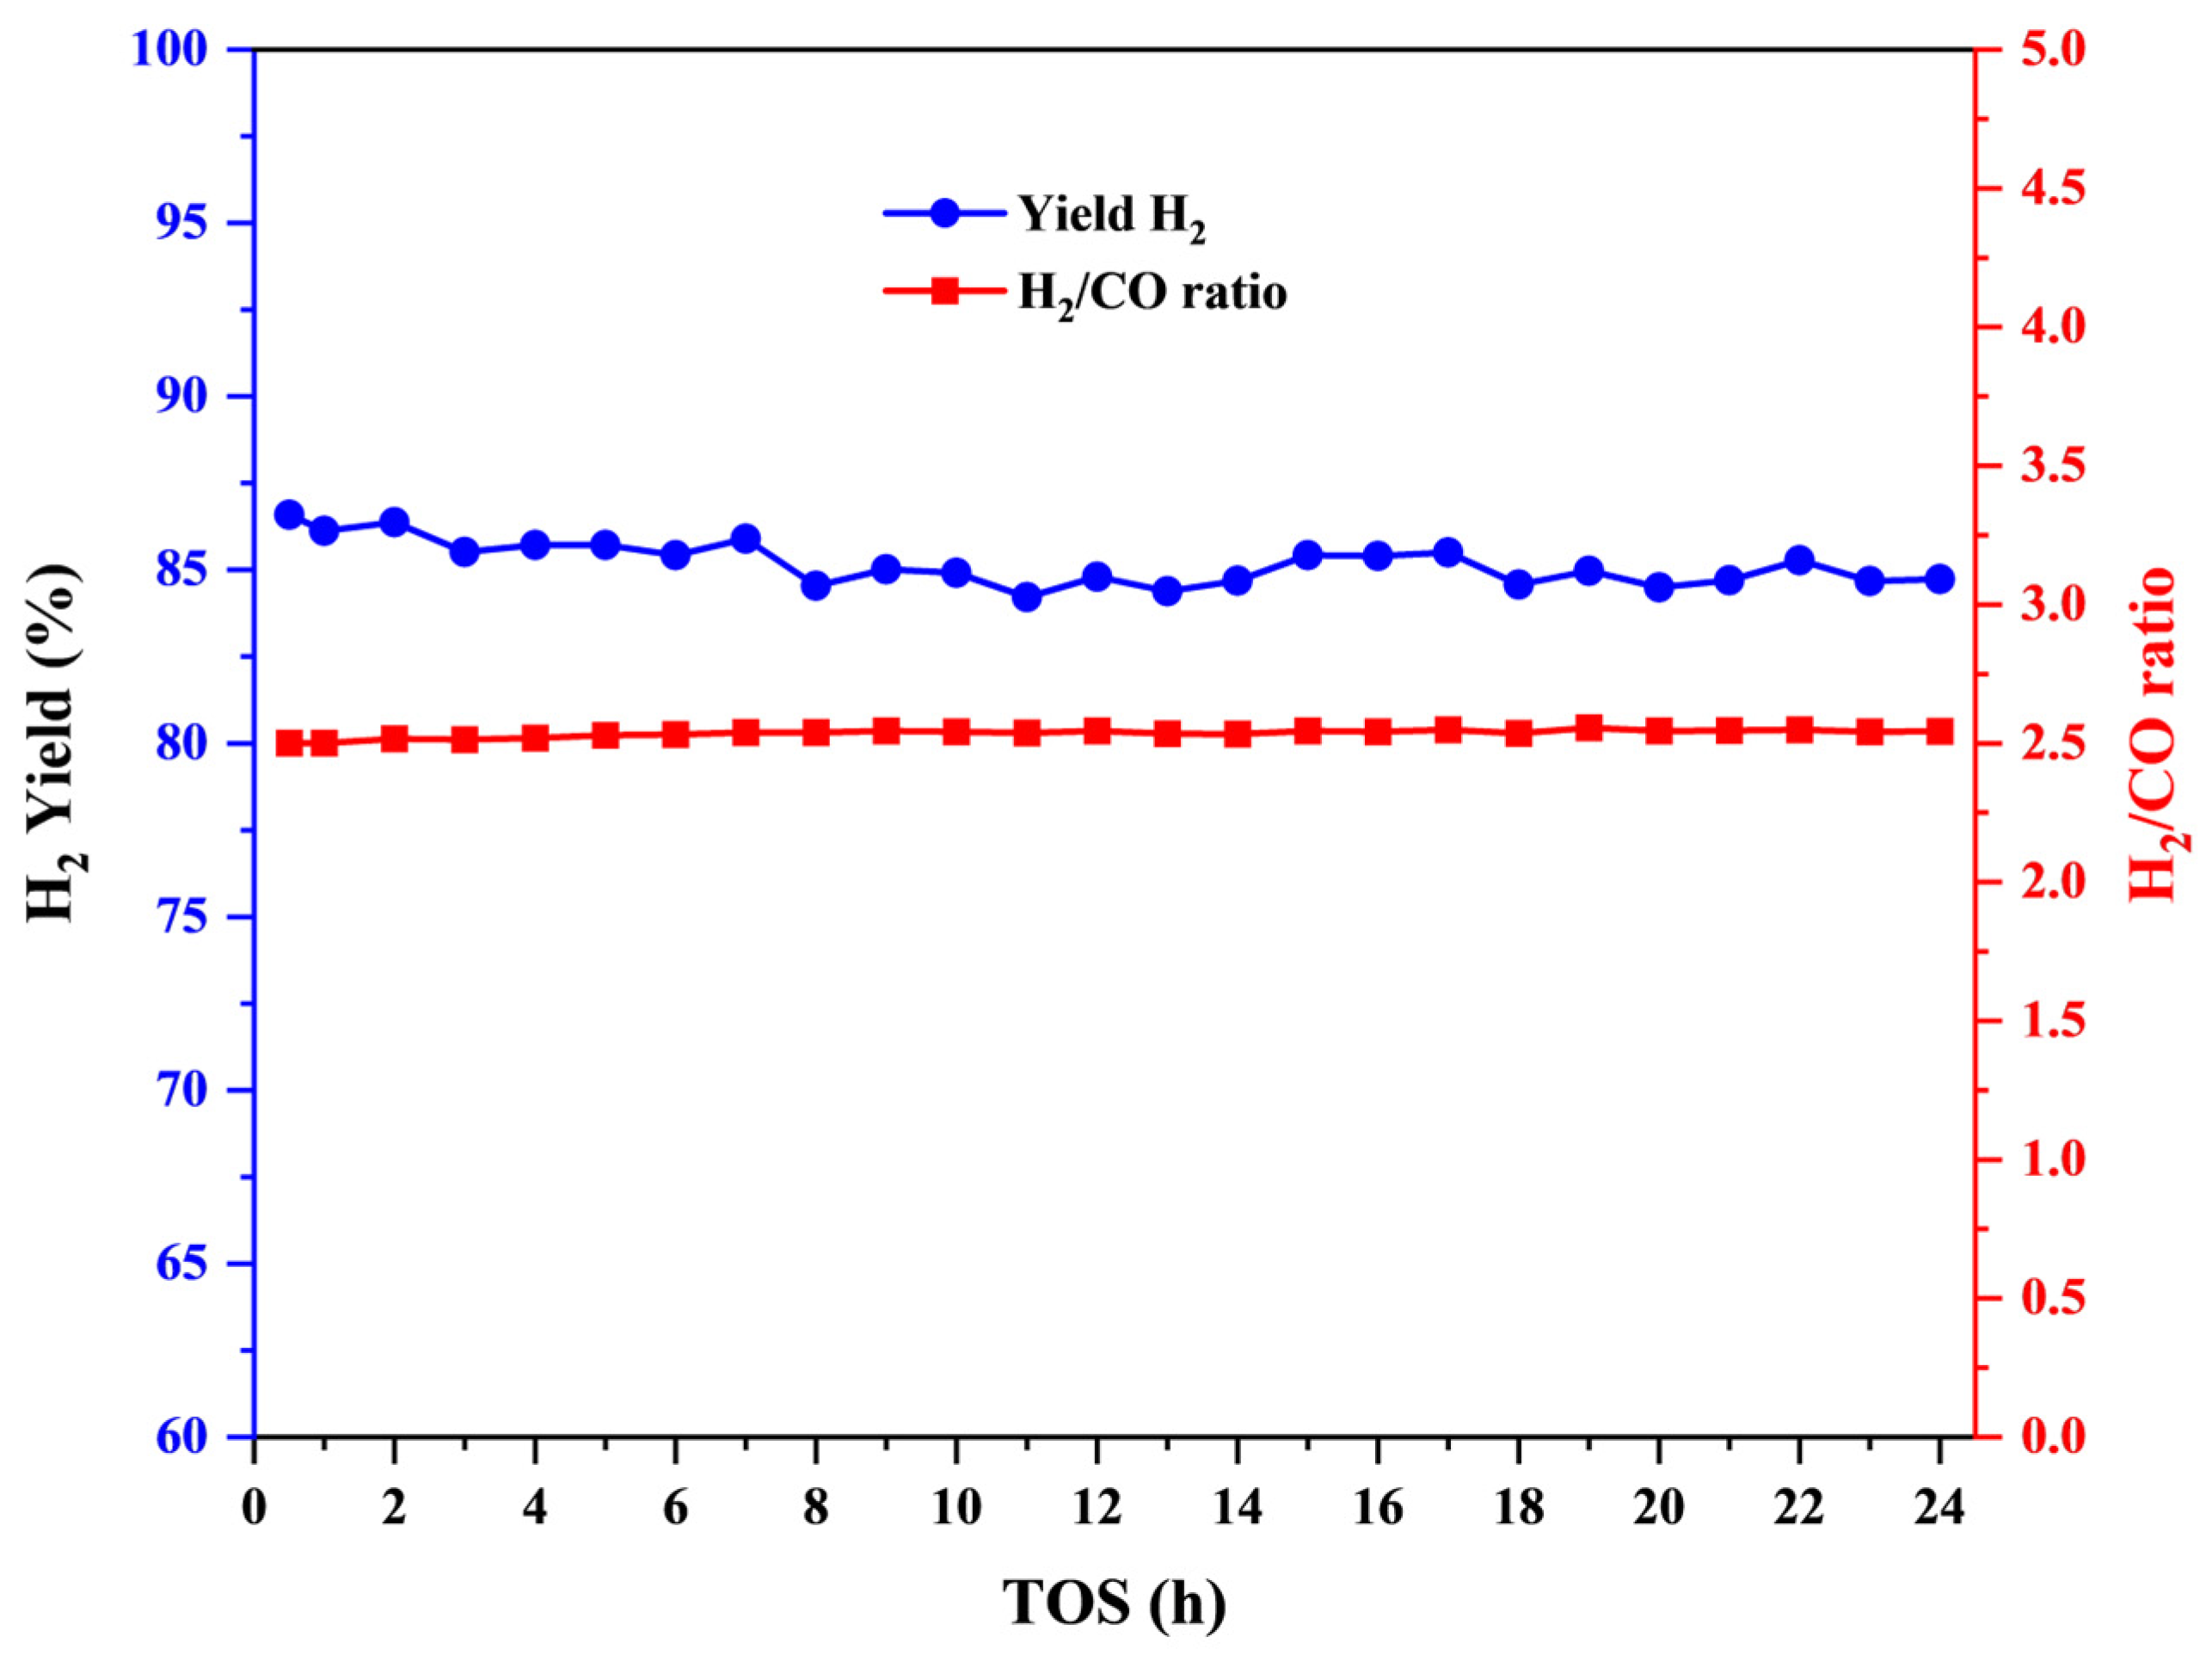
Numerical optimization was performed to find the specific set of operating conditions that would maximize methane conversion and hydrogen yield, while maintaining a desired H2/CO ratio. The analysis yielded a solution with a desirability of 1.000, indicating an ideal outcome based on the set goals. The optimal conditions were identified as T ≈ 682 °C, GHSV ≈ 8154.5 mL h-1g-cat-1 and CH4/O2 ≈ 1.52. Under these conditions, the models predict response values of 89.0% for CH4 conversion, 2.45 for H2/CO ratio, and 87.4% for H2 yield. The 24 h stability test, shown in Figure 11, conducted at these optimized conditions, demonstrates that the 5Ni + 1Gd/KIT-6 catalyst possesses excellent durability, maintaining a steady H2 yield ranging between 85 and 87% with only negligible fluctuations throughout the run. Furthermore, the H2/CO ratio remained constant at approximately 2.4–2.5, which is slightly above the stoichiometric ratio of 2.0 for partial oxidation reaction, suggesting the beneficial occurrence of concurrent side reactions (steam reforming and water–gas shift reactions). This sustained performance confirms that the 1 wt.% Gd promotion effectively enhances metal–support interactions and oxygen mobility, successfully mitigating active site deactivation from sintering or carbon deposition over extended operation.

3. Materials and Methods

3.1. Materials

Ni(NO3)2·6H2O (purity 98%, Alfa Aesar, Waltham, MA, USA), Gd (NO3)3·6H2O (purity 99.9%, Thermo Scientific, Waltham, MA, USA), KIT-6 mesoporous silica (ACS Material, SKU: MSKI6020). As per the specification of KIT-6 (from ACS Material), it possesses a 3D discontinuous cubic Ia3d structure with a BET surface area exceeding 600 m2/g and well-ordered mesopores. Methane, oxygen, and nitrogen (purity ≥ 99.99%, certified gas supplier) were used as feed gases. Distilled water was used as the solvent for catalyst preparation.

3.2. Catalyst Preparation

The catalysts were prepared via the conventional wet-chemical method. A fixed nickel loading of 5 wt.% was achieved using nickel (II) nitrate hexahydrate (0.371 g), while gadolinium (III) nitrate hexahydrate was introduced as a promoter at three levels: 0.5 wt.% (0.0215 g), 1 wt.% (0.0430 g), and 2 wt.% (0.0861 g). Nickel (II) nitrate hexahydrate and gadolinium (III) nitrate hexahydrate were dissolved in 20 mL of deionized water. Commercial KIT-6 was added, and the suspension was stirred at 80 °C while the solvent was evaporated to dryness; the solids became free-flowing. The resulting solid was dried at 110 °C for 24 h and calcined in air at 600 °C for 3 h (ramp 5 °C min−1). The catalysts were denoted as 5Ni/KIT-6 (unpromoted) and, for the promoted samples, as 5Ni + xGd/KIT-6, where x = 0.5, 1.0, and 2.0 wt.%, corresponding to the respective Gd loading levels.

3.3. Catalyst Characterization

Nitrogen physisorption. Nitrogen adsorption/desorption measurements were carried out at 77 K on a Micromeritics TriStar II 3020 (Micromeritics Instrument Corporation, Norcross, GA, USA). All samples were degassed identically (150 °C, 12 h, high vacuum) to remove physiosorbed water without risking mesostructured softening or collapse of silica at higher temperatures. Degas conditions and analysis settings were kept constant across the series. Specific surface area was calculated by the BET method, and pore volume and pore-size distribution were obtained using the BJH model. X-ray diffraction. Powder XRD patterns were recorded on a Rigaku MiniFlex 600 (Rigaku Corporation, Tokyo, Japan) using Cu Kα radiation (λ = 0.15406 nm) over 2θ = 10–80°. H2-TPR. Temperature-programmed reduction was performed on a Micromeritics AutoChem II 2920. Approximately 70 mg of the sample was pre-treated in helium at 200 °C, cooled, and then heated to 900 °C in 10% H2/Ar to assess reducible species. In H2-TPR, the sample was heated in an automated furnace (10 °C/min up to 1000 °C) at atmospheric pressure in a gas flow rate (40 mL/min) of H2/Ar mixture. Transmission electron microscopy. Morphology and metal dispersion were examined on a JEOL JEM-2100 (JEOL Ltd., Tokyo, Japan). Powders were ultrasonically dispersed in ethanol and drop-cast onto carbon-coated copper grids. Raman spectroscopy. Spent catalysts were analyzed on a JASCO Raman instrument (JASCO, Tokyo, Japan) with a 532 nm laser to characterize carbon deposits. For the RSM optimization study described in Section 2.9, the Space Velocity (SV) was varied between 8000 and 16,000 mL g−1 h−1 by adjusting the total inlet flow rate while maintaining the feed ratio constant.

3.4. Catalyst Activity Test

Tests were carried out for POM in a fixed-bed tubular reactor (PID Eng. & Tech., Madrid, Spain, i.d. 9.1 mm, length 300 mm). A K-type thermocouple monitored the bed centre temperature. For each run, 0.10 g catalyst was reduced in situ in 10% H2/N2 (30 mL min−1) at 700 °C for 1 h, purged with N2, then held at 650 °C. Feed: CH4 12 mL min−1, O2 6 mL min−1, N2 6 mL min−1 (CH4O2N2 = 2:1:1). Flows were controlled by calibrated MFCs. Effluent gases (CH4H2, CO, CO2, N2 was analyzed online by GC-TCD (Shimadzu GC-2014, Shimadzu, Kyoto, Japan).
Conversion and yields of H2, CO, and CO2 were calculated by the standard relations given in the equations section [32,33]:
X C H 4 ( % ) = mol   C H 4 , i n     mol   C H 4 , o u t   mol   C H 4 , i n   × 100
Y H 2   ( % ) = mol   H 2 , o u t   2 × mol   C H 4 , i n × 100
Y C O   ( % ) = mol   C O o u t   mol   C H 4 , i n × 100
Y C O 2   ( % ) = mol   C O 2 , o u t   mol   C H 4 , i n × 100
Across all runs, carbon balances closed within 97–103% at the base condition and within the optimized window, taking C-in from CH4 feed and C-out from GC-measured CO, CO2, and CH4 slip; the small residual is attributed to deposited carbon measured post-run.

4. Conclusions

This study shows that the performance of Ni/KIT-6 catalysts in the partial oxidation of methane is mostly determined by how the catalyst precursors change shape as they become active. The first characterization of the precursors set a baseline for a high-surface-area, but the high-temperature activation (700 °C) and reaction (682 °C) conditions caused the metallic phase to sinter and recrystallize 1 wt.% Gd-promoted catalyst turned out to be the best formulation. Instead of stopping sintering completely, adding 1 wt.% Gd optimized the distribution of Ni particle sizes during the operational phase, keeping active crystallites at a stable mean size of about 21.5 nm. The promoter’s ability to change the surface environment of the active metallic sites is what makes the catalyst more stable and gives it a higher hydrogen yield (85–87%). This is because it greatly reduced the formation of disordered carbon, as shown by the lower ID/IG ratios in the spent catalyst Raman analysis. In the end, this work shows that the structural integrity of the active catalyst under operational stress, not the initial precursor state, is what makes syngas production efficient and long-lasting.

Supplementary Materials

The following supporting information is quoted: https://www.mdpi.com/article/10.3390/catal16020201/s1, RSM Analysis of Partial Oxidation of Methane S1; Figure S1. Experimental and model-predicted data for (a) CH4 conversion, (b) H2/CO ratio, (c) H2 yield, and (d) CO yield; Table S1. Analysis of Variance for the Various Components of the Quadratic Model; Table S2. The average error percentages for XCH4, H2/CO ratio, YH2 and YCO; Table S3. Catalytic performance comparison at 600 °C; Table S4. Justification of Final Conclusions.

Author Contributions

Y.A., G.A. and A.Y.E.: methodology, data curation, conceptualization, writing—original draft; A.A.M.A., K.M.B., and F.A.A.A.: original draft preparation, formal analysis, resources, investigation; O.H.O.: software, formal analysis; F.R., A.A.I., and A.S.A.-F.: formal analysis, software, validation. writing—review and editing. All authors have read and agreed to the published version of the manuscript.

Funding

Ongoing Research Funding program (ORF-2026-368), King Saud University, Riyadh, Saudi Arabia. Researchers Supporting Project number (PNURSP2026R743), Princess Nourah bint Abdulrahman University, Riyadh, Saudi Arabia.

Data Availability Statement

The data used in this study are available in this paper.

Acknowledgments

The authors would like to extend their sincere appreciation to the Ongoing Research Funding program (ORF-2026-368), King Saud University, Riyadh, Saudi Arabia. Also, the authors would like to extend their sincere appreciation to the Princess Nourah bint Abdulrahman University Researchers Supporting Project number (PNURSP2026R743), Princess Nourah bint Abdulrahman University, Riyadh, Saudi Arabia.

Conflicts of Interest

The authors declare no conflicts of interest.

References

  1. Elbadawi, A.H.; Ge, L.; Li, Z.; Liu, S.; Wang, S.; Zhu, Z. Catalytic partial oxidation of methane to syngas: Review of perovskite catalysts and membrane reactors. Catal. Rev. Sci. Eng. 2021, 63, 1–67. [Google Scholar] [CrossRef]
  2. Sengodan, S.; Lan, R.; Humphreys, J.; Du, D.; Xu, W.; Wang, H.; Tao, S. Advances in reforming and partial oxidation of hydrocarbons for hydrogen production and fuel cell applications. Renew. Sustain. Energy Rev. 2018, 82, 761–780. [Google Scholar] [CrossRef]
  3. Koh, A.C.W.; Chen, L.; Leong, W.K.; Johnson, B.F.G.; Khimyak, T.; Lin, J. Hydrogen or synthesis gas production via the partial oxidation of methane over supported nickel-cobalt catalysts. Int. J. Hydrogen Energy 2007, 32, 725–730. [Google Scholar] [CrossRef]
  4. Bian, Z.; Zhong, W.; Yu, Y.; Wang, Z.; Jiang, B.; Kawi, S. Dry reforming of methane on Ni/mesoporous-Al2O3 catalysts: Effect of calcination temperature. Int. J. Hydrogen Energy 2021, 46, 31041–31053. [Google Scholar] [CrossRef]
  5. Guan, Y.; Song, G.; Li, C.; Lim, K.H.; Wang, B.; Xia, L.; Song, H.; Liu, Y.; Wu, C.; Kawi, S. Ni-based core-shell structured catalysts for efficient conversion of CH4 to H2: A review. Carbon Capture Sci. Technol. 2024, 11, 100200. [Google Scholar] [CrossRef]
  6. Li, L.; Shrotri, A.; Kato, K.; Fukuoka, A.; Kobayashi, H. Mordenite-stabilised rhenium catalyst for partial oxidation of methane to syngas. Catal. Sci. Technol. 2023, 13, 5190–5196. [Google Scholar] [CrossRef]
  7. Wang, C.; Liao, M.; Liang, B.; Jiang, Z.; Zhong, W.; Chen, Y.; Luo, X.; Shu, R.; Tian, Z.; Lei, L. Enhancement effect of catalyst support on indirect hydrogen production from propane partial oxidation towards commercial solid oxide fuel cell (SOFC) applications. Appl. Energy 2021, 288, 116362. [Google Scholar] [CrossRef]
  8. Figen, H.E.; Baykara, S.Z. Hydrogen production by partial oxidation of methane over Co based, Ni and Ru monolithic catalysts. Int. J. Hydrogen Energy 2015, 40, 7439–7451. [Google Scholar] [CrossRef]
  9. Han, K.; Yu, W.; Xu, L.; Deng, Z.; Yu, H.; Wang, F. Reducing carbon deposition and enhancing reaction stability by ceria for methane dry reforming over Ni@SiO2@CeO2 catalyst. Fuel 2021, 291, 120182. [Google Scholar] [CrossRef]
  10. Corbo, P.; Migliardini, F. Hydrogen production by catalytic partial oxidation of methane and propane on Ni and Pt catalysts. Int. J. Hydrogen Energy 2007, 32, 55–66. [Google Scholar] [CrossRef]
  11. Fakeeha, A.H.; Al-Fatesh, A.S.; Srivastava, V.K.; Ibrahim, A.A.; Abahussain, A.A.M.; Abu-Dahrieh, J.K.; Alotibi, M.F.; Kumar, R. Hydrogen Production from Gadolinium-Promoted Yttrium-Zirconium-Supported Ni Catalysts through Dry Methane Reforming. ACS Omega 2023, 8, 22108–22120. [Google Scholar] [CrossRef] [PubMed]
  12. Abdullah, B.; Ghani, N.A.A.; Vo, D.V.N. Recent advances in dry reforming of methane over Ni-based catalysts. J. Clean. Prod. 2017, 162, 170–185. [Google Scholar] [CrossRef]
  13. Al-Fatesh, A.S.; Patel, N.; Fakeeha, A.H.; Alotibi, M.F.; Alreshaidan, S.B.; Kumar, R. Reforming of methane: Effects of active metals, supports, and promoters. Catal. Rev. Sci. Eng. 2024, 66, 2209–2307. [Google Scholar] [CrossRef]
  14. Khani, Y.; Bahadoran, F.; Shariatinia, Z.; Varmazyari, M.; Safari, N. Synthesis of highly efficient and stable Ni/CexZr1-xGdxO4 and Ni/X-Al2O3 (X = Ce, Zr, Gd, Ce-Zr-Gd) nanocatalysts applied in methane reforming reactions: Ni/CexZr1-xGdxO4 and Ni/X-Al2O3 nanocatalysts for methane reforming reactions. Ceram. Int. 2020, 46, 25122–25135. [Google Scholar] [CrossRef]
  15. Al-Fatesh, A.S. Promotional effect of Gd over Ni/Y2O3 catalyst used in dry reforming of CH4 for H2 production. Int. J. Hydrogen Energy 2017, 42, 18805–18816. [Google Scholar] [CrossRef]
  16. Siles-Quesada, S.; Parlett, C.M.A.; Lamb, A.C.; Manayil, J.C.; Liu, Y.; Mensah, J.; Arandiyan, H.; Wilson, K.; Lee, A.F. Synthesis and catalytic advantage of a hierarchical ordered macroporous KIT-6 silica. Mater. Today Chem. 2023, 30, 101574. [Google Scholar] [CrossRef]
  17. Ding, Y.; Wang, J.; Liao, M.; Li, J.; Zhang, L.; Guo, J.; Wu, H. Deep oxidative desulfurization of dibenzothiophene by novel POM-based IL immobilized on well-ordered KIT-6. Chem. Eng. J. 2021, 418, 129470. [Google Scholar] [CrossRef]
  18. Huang, X.; Yang, W.; Li, Z.; Lou, Q.; Tian, Y.; Li, J. Nickel Oxide Nanoparticles on KIT-6: An Efficient Catalyst in Methane Combustion. Processes 2023, 11, 1004. [Google Scholar] [CrossRef]
  19. Tojira, O.; Lomonaco, J.G.; Sesuk, T.; Charojrochkul, S.; Tepamatr, P. Enhancement of hydrogen production using Ni catalysts supported by Gd-doped ceria. Heliyon 2021, 7, e08202. [Google Scholar] [CrossRef]
  20. Zeng, D.; Kang, F.; Qiu, Y.; Cui, D.; Li, M.; Ma, L.; Zhang, S.; Xiao, R. Iron oxides with gadolinium-doped cerium oxides as active supports for chemical looping hydrogen production. Chem. Eng. J. 2020, 396, 125153. [Google Scholar] [CrossRef]
  21. Da Costa, K.Ś.; Summa, P.; Gopakumar, J.; van Valen, Y.; Da Costa, P.; Rønning, M. Excess-Methane CO2 Reforming over Reduced KIT-6-Ni-Y Mesoporous Silicas Monitored by In Situ XAS-XRD. Energy Fuels 2023, 37, 18952–18967. [Google Scholar] [CrossRef] [PubMed]
  22. Mora-Briseño, P.; Jiménez-García, G.; Castillo-Araiza, C.O.; González-Rodríguez, H.; Huirache-Acuña, R.; Maya-Yescas, R. Mars van Krevelen Mechanism for the Selective Partial Oxidation of Ethane. Int. J. Chem. React. Eng. 2019, 17, 20180085. [Google Scholar] [CrossRef]
  23. Pruksawan, S.; Kitiyanan, B.; Ziff, R.M. Partial oxidation of methane on a nickel catalyst: Kinetic Monte-Carlo simulation study. Chem. Eng. Sci. 2016, 147, 128–136. [Google Scholar] [CrossRef]
  24. Mosayebi, A. Kinetic modeling of catalytic partial oxidation of methane over Ni-Rh/γ-Al2O3 catalyst for syngas formation. J. Taiwan Inst. Chem. Eng. 2020, 114, 36–46. [Google Scholar] [CrossRef]
  25. Enger, B.C.; Lødeng, R.; Holmen, A. A review of catalytic partial oxidation of methane to synthesis gas with emphasis on reaction mechanisms over transition metal catalysts. Appl. Catal. A Gen. 2008, 346, 1–27. [Google Scholar] [CrossRef]
  26. Pirovano, C.; Schönborn, E.; Wohlrab, S.; Kalevaru, V.N.; Martin, A. On the performance of porous silica supported VO x catalysts in the partial oxidation of methane. Catal. Today 2012, 192, 20–27. [Google Scholar] [CrossRef]
  27. Feng, Z.; Bai, X. Enhanced activity of bimetallic Pd-Ni nanoparticles on KIT-6 for production of hydrogen from dodecahydro-N-ethylcarbazole. Fuel 2022, 329, 125473. [Google Scholar] [CrossRef]
  28. Kishor, R.; Ghoshal, A.K. Understanding the hydrothermal, thermal, mechanical and hydrolytic stability of mesoporous KIT-6: A comprehensive study. Microporous Mesoporous Mater. 2017, 242, 127–135. [Google Scholar] [CrossRef]
  29. Fernandes, F.R.D.; Pinto, F.G.H.S.; Lima, E.L.F.; Souza, L.D.; Caldeira, V.P.S.; Santos, A.G.D. Influence of synthesis parameters in obtaining KIT-6 mesoporous material. Appl. Sci. 2018, 8, 725. [Google Scholar] [CrossRef]
  30. Song, D.H.; Jung, U.H.; Kim, Y.E.; Im, H.B.; Lee, T.H.; Lee, K.B.; Koo, K.Y. Influence of Supports on the Catalytic Activity and Coke Resistance of Ni Catalyst in Dry Reforming of Methane. Catalysts 2022, 12, 216. [Google Scholar] [CrossRef]
  31. Sápi, A.; Thangavel, R.; Ábel, M.; Efremova, A.; Grósz, A.; Gyuris, A.; Ábrahámné, K.B.; Szenti, I.; Kiss, J.; Varga, T.; et al. Noble-metal-free and Pt nanoparticles-loaded, mesoporous oxides as efficient catalysts for CO2 hydrogenation and dry reforming with methane. J. CO2 Util. 2019, 32, 106–118. [Google Scholar] [CrossRef]
  32. Al-Fatesh, A.S.; Alrashed, M.M.; El-Salamony, R.A.; Roushdy, M.H.; Alwan, S.M.; Osman, A.I.; Bayazed, M.; Fakeeha, A.H.; Ibrahim, A.A.; Kumar, R. Tailoring strontium-promoted alumina-zirconia supported Ni-catalysts for enhanced CO2 utilization via dry reforming of methane: Sr loading effects and process optimization. J. CO2 Util. 2023, 75, 102578. [Google Scholar] [CrossRef]
  33. Torabi, T.; Bairami, A.; Ghasemzadeh, K.; Shojaei, M.J.; Iulianelli, A. Optimization of sustainable biogas valorization to hydrogen via tri-reforming process in packed bed membrane reactor: An integrated CFD-ML digital twin approach. Renew. Energy 2025, 249, 123139. [Google Scholar] [CrossRef]
Figure 1. N2 physisorption of Ni/Gd–KIT-6 catalysts. (A) Adsorption isotherms at 77 K in the capillary condensation region (p/p0 = 0.5–0.8), showing type-IV behaviour with H1 hysteresis for all samples. (B) Pore-size distribution from the desorption branch. (C) Pore-size distribution from the adsorption branch.
Catalysts 16 00201 g001
Figure 2. XRD patterns of as-prepared KIt-6 and calcined KIT-6, Ni/KIT-6 and Gd-promoted Ni/KIT-6 catalysts.
Catalysts 16 00201 g002
Figure 3. TEM images (A) for 5Ni/KIT-6, (B) for 5Ni + 1Gd/KIT-6 catalyst, and (C) the average particle size for 5Ni + 1Gd/KIT-6 catalyst.
Catalysts 16 00201 g003
Figure 4. (A) Raman spectra of fresh catalysts. (B) UV–Vis diffuse reflectance spectra of fresh catalysts.
Catalysts 16 00201 g004
Figure 5. H2-TPR profiles of Ni + xGd/KIT-6 (x = 0.0, 0.5, 1, 2) catalysts.
Catalysts 16 00201 g005
Figure 6. Catalytic performance at 650 °C of Ni/KIT-6 catalysts with varying Gd loadings (0.0, 0.5, 1, and 2 wt.%) for the partial oxidation of methane (POM). The evaluation was conducted at 650 °C over a time on stream (TOS) of 240 min. (A) CH4 conv., (B) H2/CO ratio, (C) yield of H2, (D) yield of CO, and (E) yield of CO2.
Catalysts 16 00201 g006
Figure 7. TEM of spent catalysts: (A) 5Ni/KIT-6; (B) 5Ni + 1 wt.% Gd/KIT-6; (C) 5Ni + 1 wt.% Gd/KIT-6 size histogram.
Catalysts 16 00201 g007
Figure 8. Raman spectra for spent catalysts.
Catalysts 16 00201 g008
Figure 9. Contour plots for (a) relationship between the temperature, ratio, and H2 yield at SV = 12,000 and (b) relationship between the temperature, SV, and H2 yield at a ratio = 2.00.
Catalysts 16 00201 g009
Figure 10. (a) Relationship between the temperature, SV, and H2 yield at a ratio = 2.00. (b) Relationship between the temperature, ratio, and H2 yield at SV = 12,000.
Catalysts 16 00201 g010aCatalysts 16 00201 g010b
Figure 11. Time on stream (TOS) of the 5Ni + 1Gd/KIT-6 catalyst for long time test in hours under optimized conditions: T = 682 °C, GHSV = 8155 mL h-1g-cat-1, and CH4/O2 = 1.52.
Catalysts 16 00201 g011
Table 1. Textural properties of catalyst samples and the support obtained from N2 physisorption.
CatalystBET
Surface Area (m2·g−1)
Pore
Volume (cm3·g−1)
Pore
Width (Å)
NiO Crystalline Size (nm)
KIT-6-uncalcined5850.7362.7-
KIT-6 calcined 5250.5549.7-
5Ni/KIT-65150.6661.016.1
5Ni + 0.5Gd/KIT-65290.6660.118.1
5Ni + 1Gd/KIT-65170.6560.520.1
5Ni + 2Gd/KIT-65090.6460.317.3
Table 2. Measurement of hydrogen consumption and H2/Ni molar ratio.
CatalystTmax (°C)H2 Consumption (cm3/g)H2/Ni Molar Ratios
5Ni/KIT-639222.131.16
5Ni + 0.5Gd/KIT-641518.890.99
5Ni + 1Gd/KIT-643819.101.00
5Ni + 2Gd/KIT-644218.920.99
Disclaimer/Publisher’s Note: The statements, opinions and data contained in all publications are solely those of the individual author(s) and contributor(s) and not of MDPI and/or the editor(s). MDPI and/or the editor(s) disclaim responsibility for any injury to people or property resulting from any ideas, methods, instructions or products referred to in the content.