Article

Synthesis Gas Production from Co-Pyrolysis of Straw Biomass and Polyethylene Agricultural Film and Kinetic Analysis

1
College of Architecture, Nanjing Tech University, Nanjing 211816, China
2
School of Environmental Science and Engineering, Nanjing Tech University, Nanjing 211816, China
*
Author to whom correspondence should be addressed.
Catalysts 2025, 15(6), 517; https://doi.org/10.3390/catal15060517
Submission received: 31 March 2025 / Revised: 11 May 2025 / Accepted: 12 May 2025 / Published: 23 May 2025
(This article belongs to the Collection Catalytic Conversion of Biomass to Bioenergy)

Abstract

:
The co-pyrolysis of straw biomass and polyethylene film at different mass ratios was carried out in a small fixed-bed reactor with CaO as catalyst. The resulting synthesis gas production, liquid and solid products, and pyrolysis kinetics were studied by gas chromatography and thermogravimetric analysis. The results showed that with increasing proportion of plastic in the feedstock, co-pyrolysis had a synergistic effect on the CH4 yield, reaching as high as 3.124 mol CH4/kg feedstock, while the H2 and CO yields continuously decreased. Comparing the experimental and theoretical yields of synthesis gas, the trends for CO and CH4 were consistent, but those of H2 and CO2 differed widely. Examining the influence of element mass ratios in the feedstock on the synthesis gas composition, it was found that the biomass and plastics affected the formation of oxygen- and hydrogen-containing gases, respectively. The activation energy and pre-exponential factor showed increasing and decreasing trends, respectively, when the feedstock proportions and heating rate changed. Fitted linear correlation coefficients for all pyrolysis stages exceeded 0.99.

1. Introduction

Biomass is considered the best alternative to traditional energy sources owing to its low emissions and renewable and carbon-neutral features, which can ease the energy crisis that originates from increasing consumption of fossil fuels [1,2,3,4,5]. Hydrogen is considered the most promising carbon-free energy carrier of the future. Hydrogen has characteristics of high energy density, high calorific value, and zero emission of pollutants, and has been applied in various fields, such as chemical synthesis, heating, power generation, and biofuel production [6,7]. At present, synthesis gas (syngas) production from biomass energy is mainly carried out by thermochemical (pyrolysis, gasification, supercritical) and microbial (biophotolysis, biofermentation) conversion. Of those methods, biomass pyrolysis and gasification are topics of intense research interest [8,9,10,11].
Biomass is deficient in hydrogen and rich in oxygen, with values of H/Ceff (effective H/C ratio) varying between 0 and 0.3 [12]; so, the theoretical hydrocarbon yields are low and the volume proportion and yield of combustible gas in the syngas produced by pyrolysis are not ideal. Attention has therefore been paid to the co-pyrolysis of biomass with other raw materials with a high hydrogen content. Numerous studies have shown that plastics are mainly composed of polyolefin, which has a H/Ceff value of 2. Catalytic co-pyrolysis of biomass and plastics at a certain ratio induces a positive synergistic effect, which can increase the hydrocarbon content and decrease oxygen-containing compounds, and therefore improve fuel performance.
China stands as the world’s largest producer and consumer of agricultural films. In 2020, the total output of agricultural films exceeded 2 million tons, rising to approximately 2.2 million tons in 2021 and further climbing to around 2.4 million tons in 2022. Traditional PE (polyethylene) films dominate the market, accounting for over 95% of the total. In 2021, the national usage of agricultural films amounted to roughly 1.45 million tons, covering an area exceeding 23 million hectares. Although the agricultural film industry significantly bolsters high-yield agriculture in China, it concurrently incurs substantial environmental costs.
Xu et al. [13] conducted catalytic co-pyrolysis of rice husk and polyethylene (PE) in a small fixed-bed reactor using Ni/char as a catalyst. These researchers found that low PE proportions (<50 mass%) undermined catalytic activity because more oxygenated compounds tended to be adsorbed by the catalyst to form amorphous coke, which encapsulated Ni active sites and negatively influenced the H2 yield; at higher PE proportions (75 mass%), more hydrocarbon gas from plastic pyrolysis condensed on the catalyst and promoted the growth of carbon nanotubes via dehydrogenation and polymerization, simultaneously generating H2. Chattopadhyay et al. [14] conducted catalytic co-pyrolysis of paper with high-density polyethylene (HDPE), polypropylene (PP), and polyethylene terephthalate (PET), and investigated the effects of pyrolysis temperature and material proportions on the compositions of the liquid and gas products. Hydrogen gas production peaked at 47 vol.% when the feed blend had a biomass/plastic mass ratio of 5:1. Gu et al. [15] studied the thermogravimetric characteristics and product distribution of the co-pyrolysis of corncob-derived xylan and HDPE. The results showed that the addition of HDPE promoted the release of hydrocarbons (CH4, C2H2, C2H6, C3H6, C3H8) and aldehyde derivatives (CH3CHO, CHO+), but hindered the production of H2 and H2O. When the proportion of HDPE was 75 mass%, the formation of CO2 was inhibited and the yields of alkanes and olefins were maximized. Lopez et al. [16] carried out co-pyrolysis of pine waste and HDPE in a conical spouted-bed reactor and found that the gas composition was significantly affected when the mass ratio of HDPE exceeded 50%. The tar, char, and gas yields were proportional to the amount of HDPE in the feed; the methane concentration was considerably reduced by co-feeding of plastics, but that of CO and CO2 were only slightly modified. Based on the above, there are few studies on the co-pyrolysis of biomass and plastics to produce syngas, and a lack of comparison between the theoretical and experimental yields achieved.
In this study, the co-pyrolysis and thermogravimetric analysis of straw biomass (SB) and polyethylene agricultural film (PAF) were carried out using different material ratios. The composition and syngas yield were analyzed by gas chromatography. Simulation of the co-pyrolysis was carried out using HSC Chemistry 9 to compare the theoretical and experimental gas production characteristics. The mass loss of the mixed materials was measured by thermogravimetric analysis (TGA). The effect of heating rate on pyrolysis behavior was studied, and the activation energy (E) and pre-exponential factor (A) were calculated for each pyrolysis stage. The objective of this study is to provide theoretical guidance and direction for the co-pyrolysis of biomass and agricultural plastic film.

2. Results and Discussions

2.1. Product Distribution

Figure 1 shows the yields of the three phases of products of the pyrolysis of SB and PAF and their mixtures at a constant temperature of 700 °C and a reaction time of 40 min. The proportion of solid-phase products gradually decreased as the proportion of PAF in the mixture increased and the proportion of the liquid-phase products correspondingly increased. For 100% PAF, the liquid yield reached 17.9 mass%. The gas products remained in the range of 5.2 mass%–6.4 mass%. The presence of PAF therefore provided additional hydrocarbons in the co-pyrolysis of SB and PAF, resulting in an increase in liquid production [17].

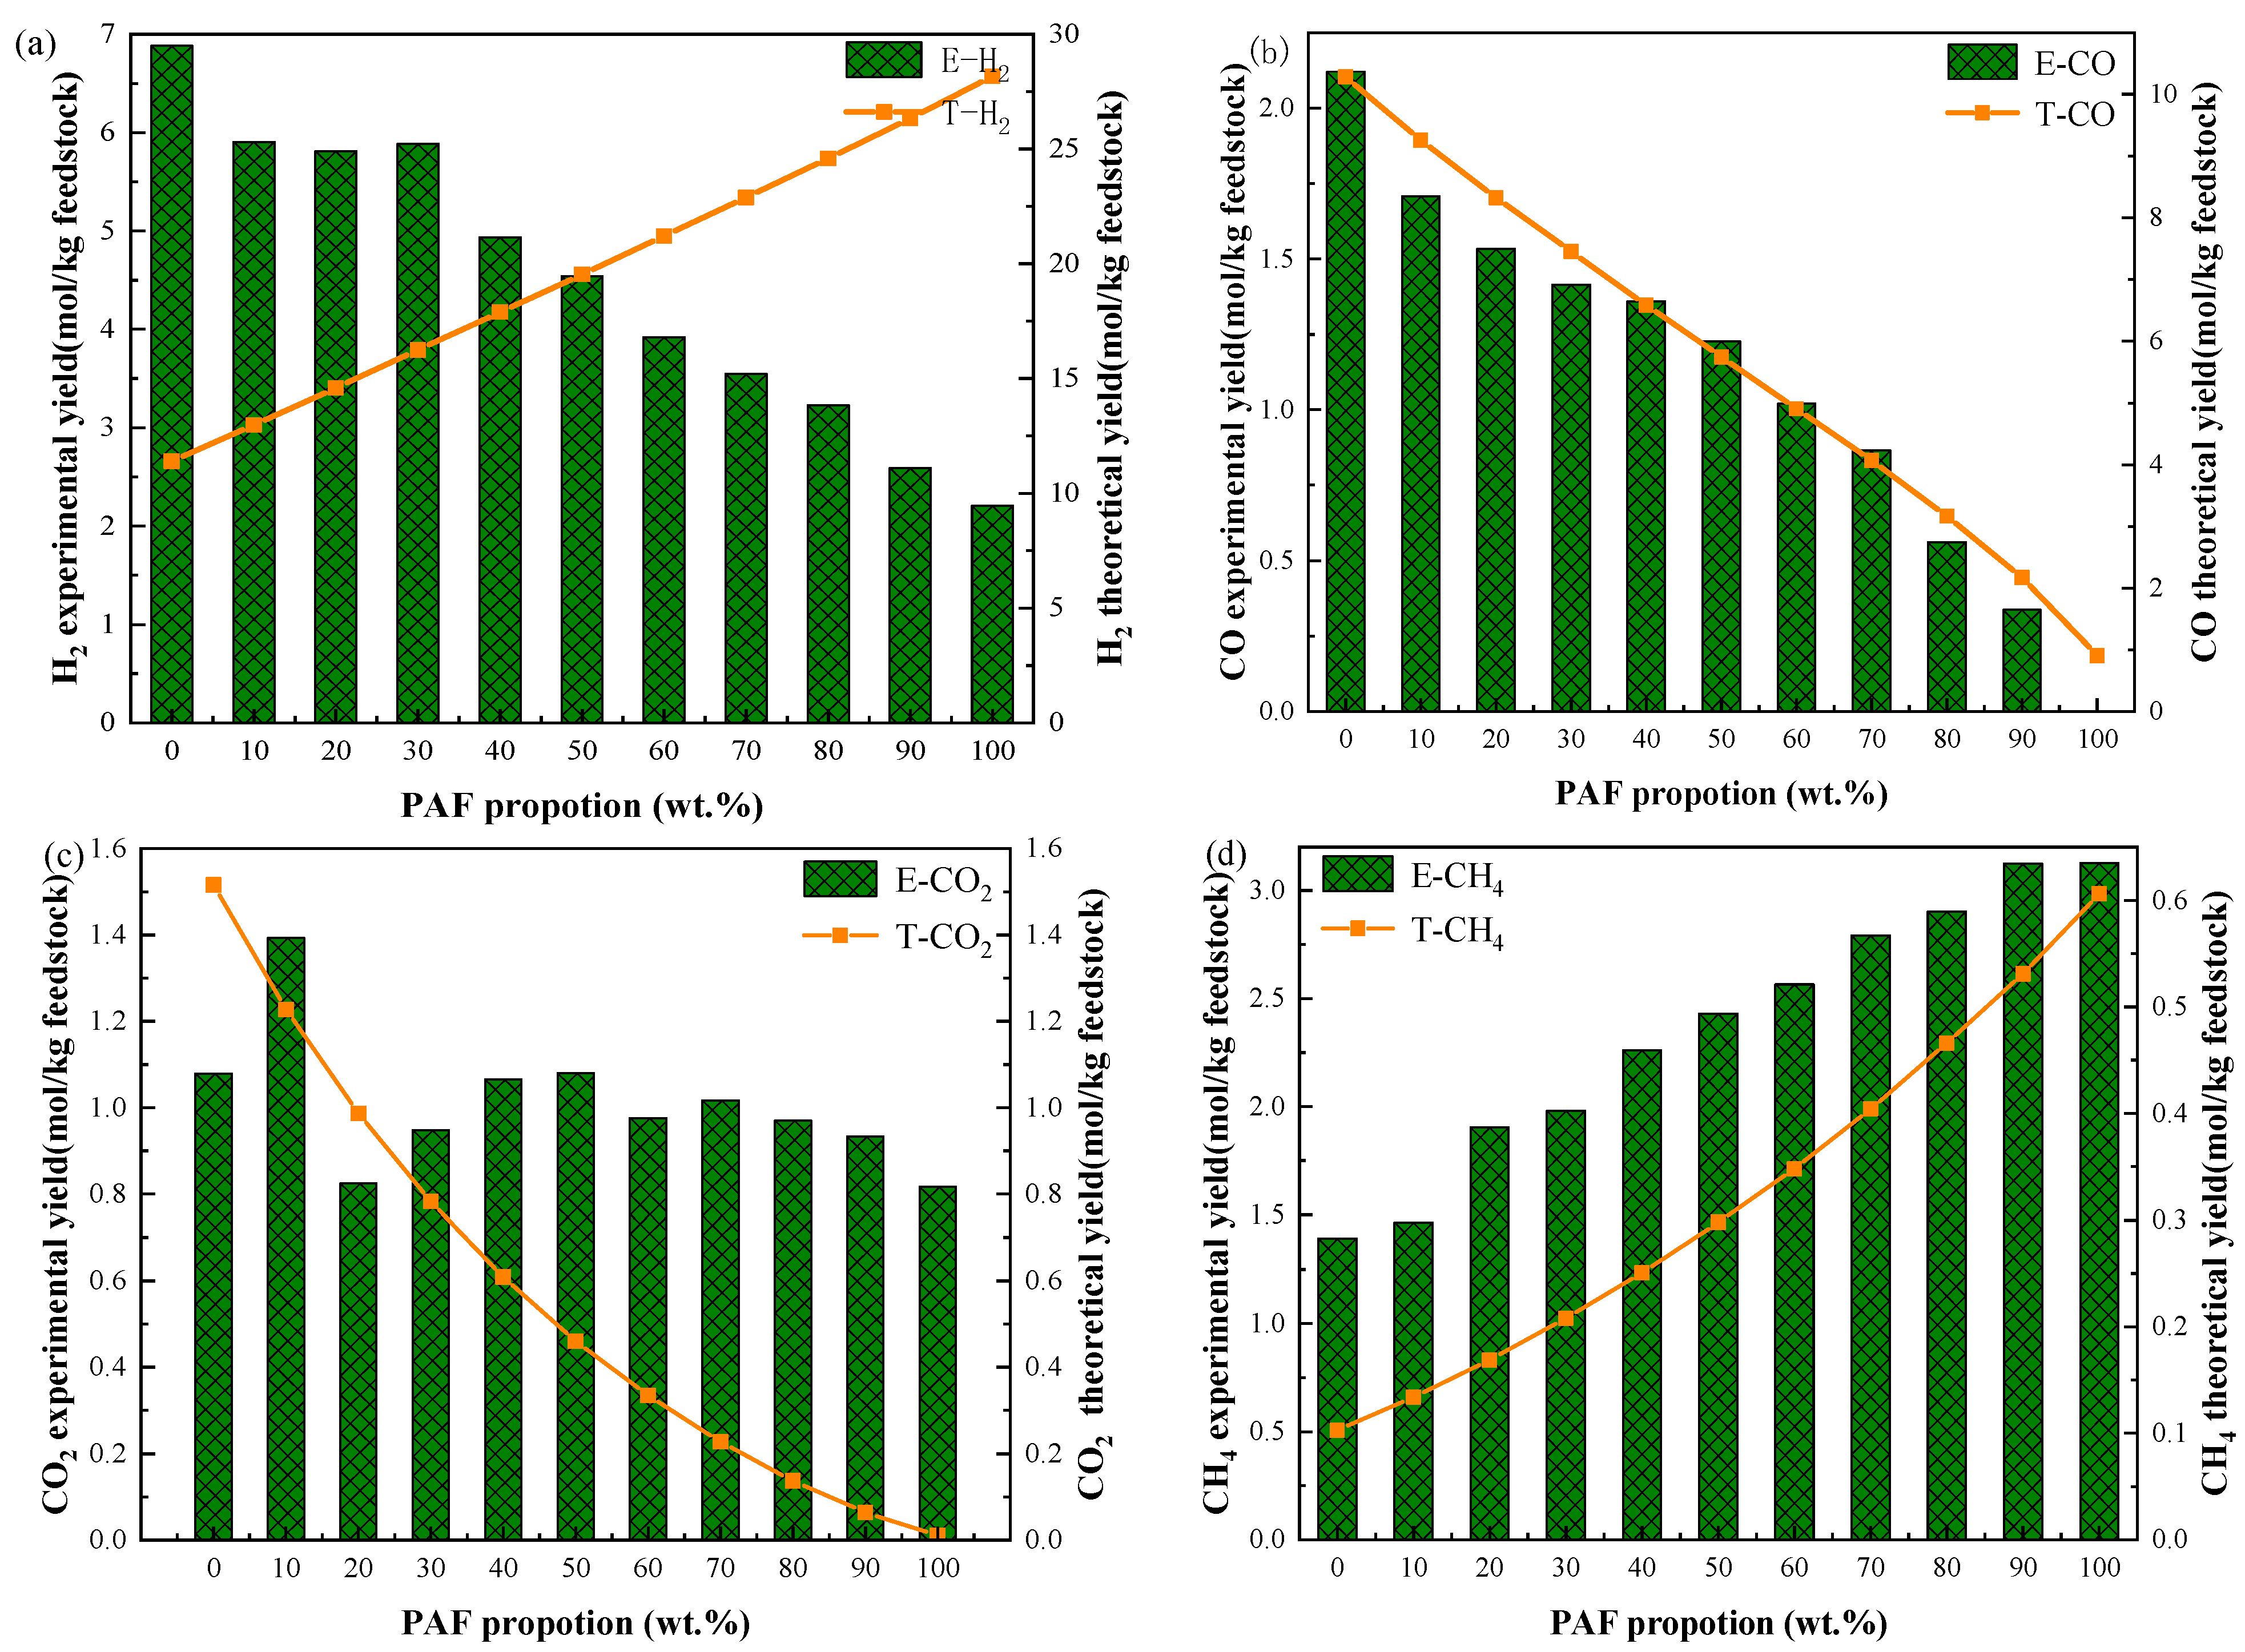
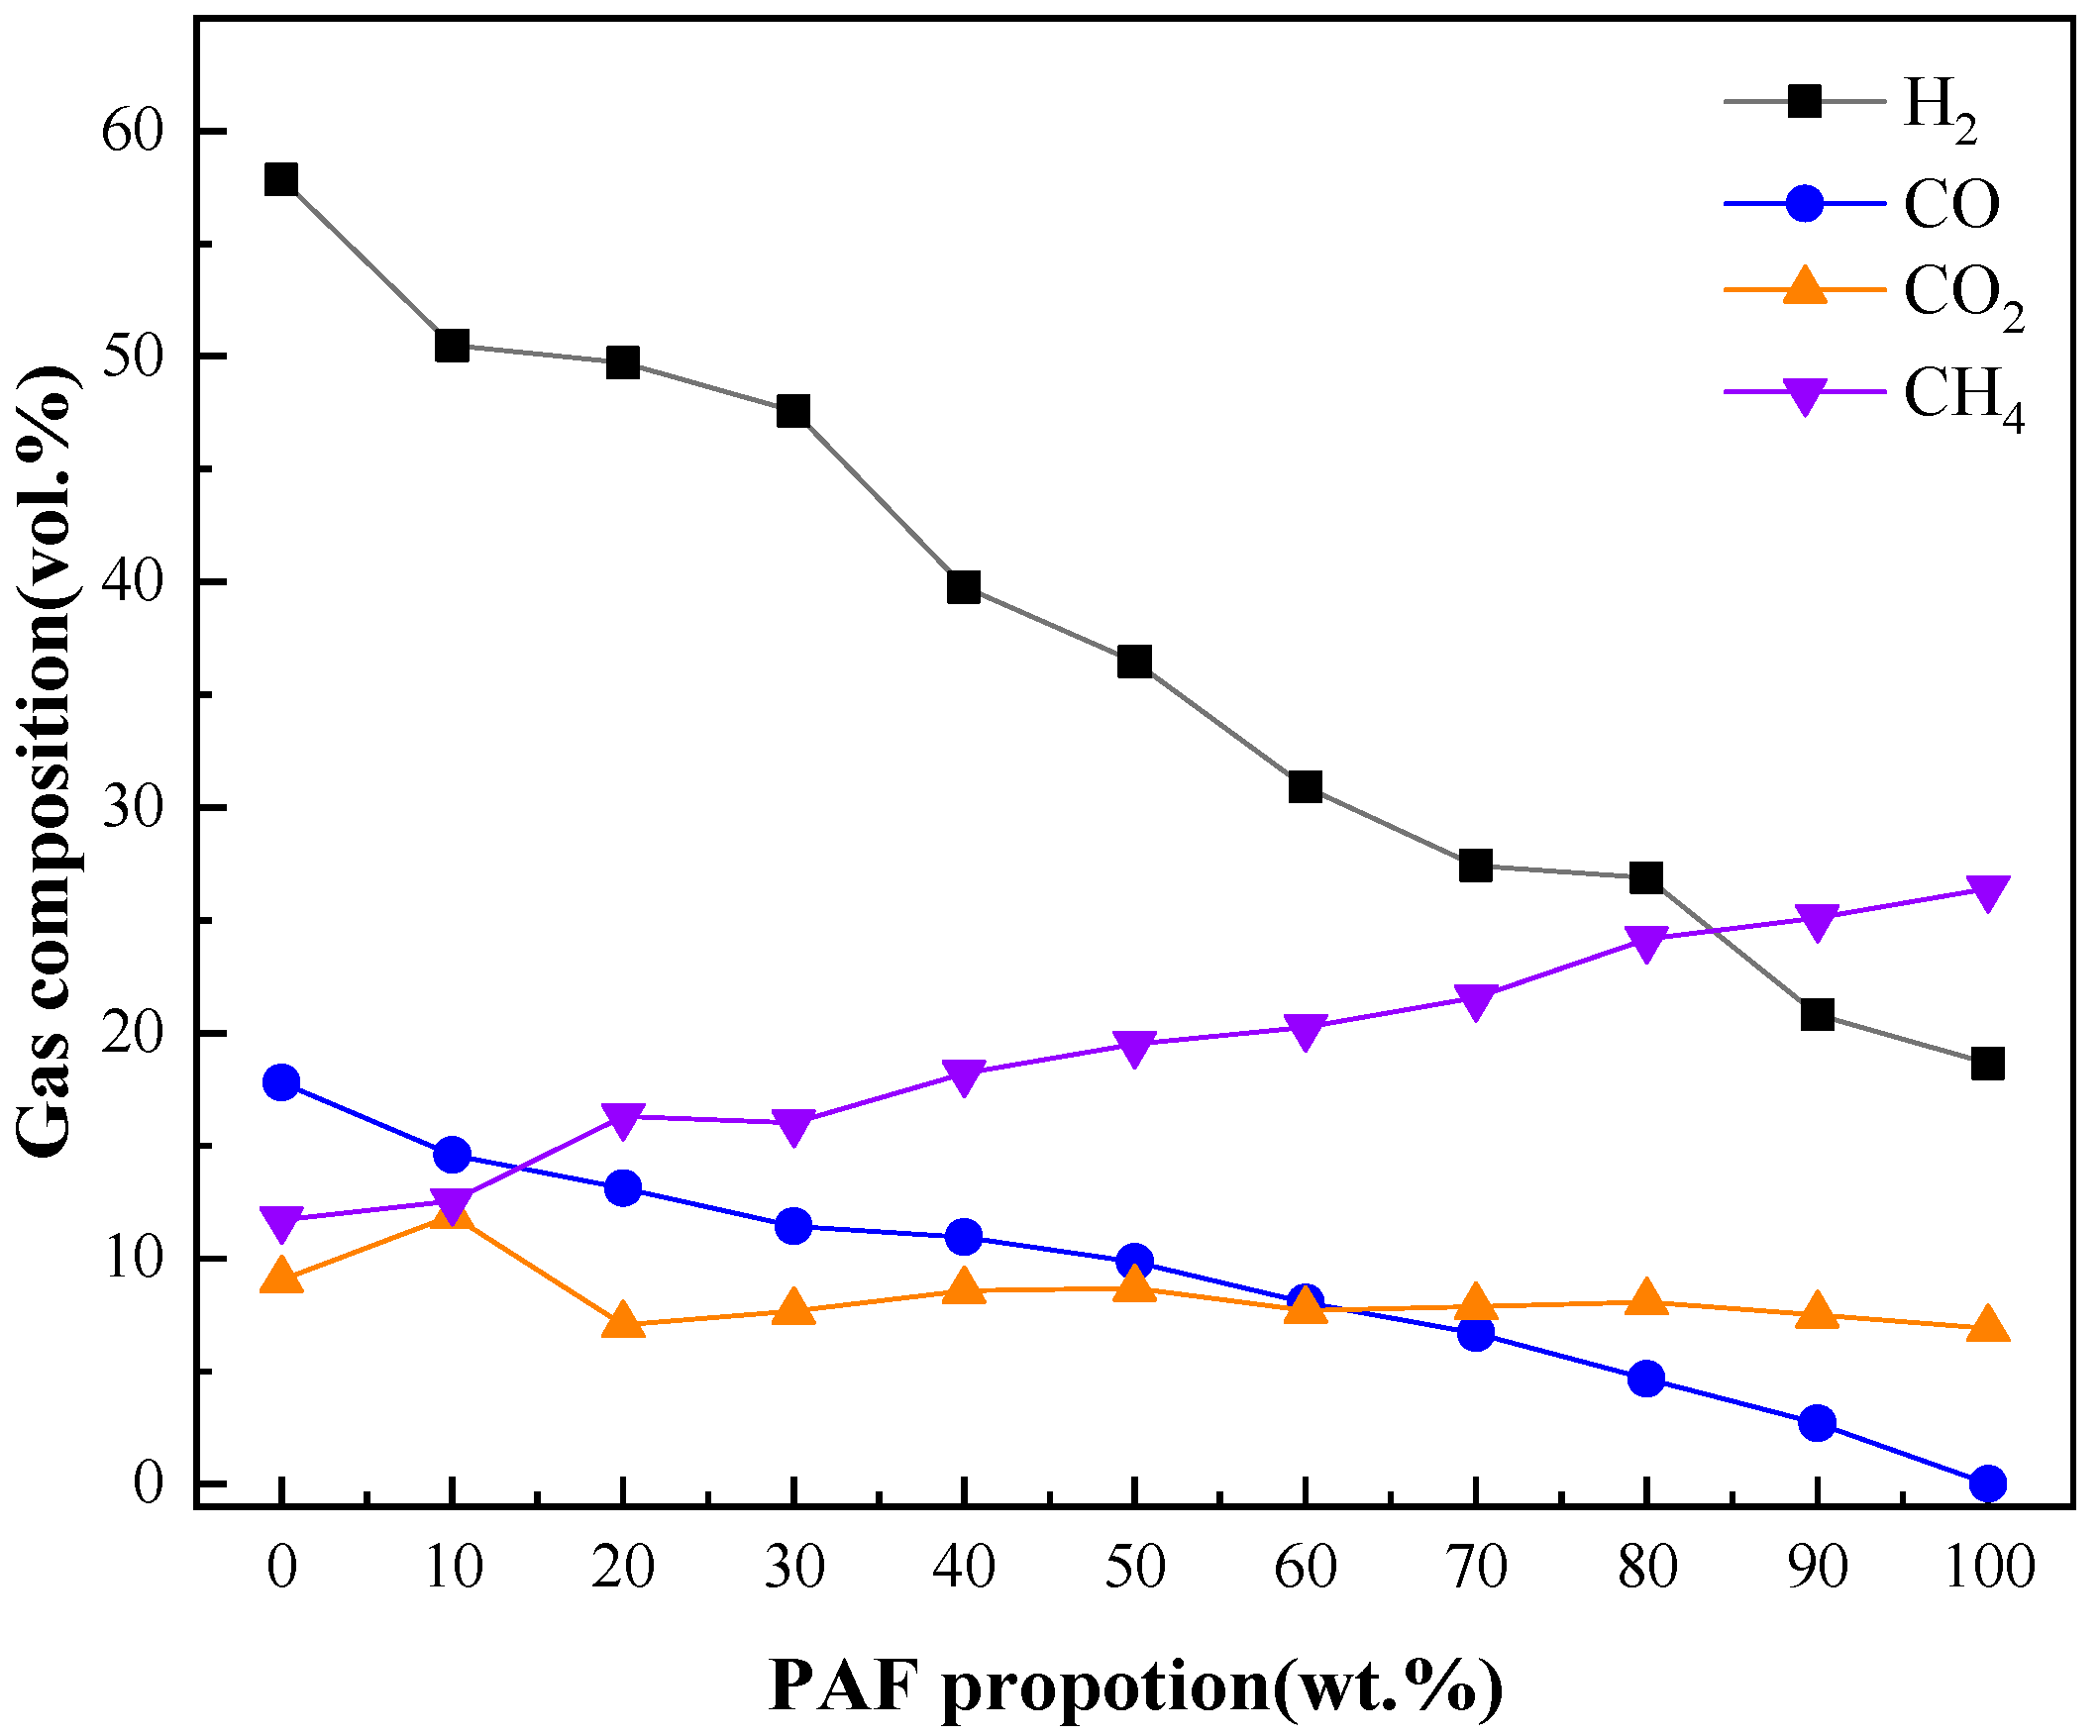
2.2. Syngas Production and Composition

2.2.1. Effect of Mixture Ratio on Syngas Production and Composition

Figure 2 describes the experimental and theoretical yields of syngas for different ratios of SB and PAF. The theoretical yields were obtained by simulating thermostatic pyrolysis using HSC [18] software. As shown in Figure 2a, with an increase in PAF content, the H2 experimental yield gradually decreased: at 100% PAF, there was only 2.205 mol H2/kg feedstock; however, the theoretical yield increased linearly. Increasing the amount of PAF in the feedstock had a negative synergistic effect on H2 production in these experiments. When the proportion of PE agricultural film reached 100%, the hydrogen in the raw materials underwent more complete conversion into hydrocarbons, such as CH4, C2H2, C2H4, and C2H6. Among these products, methane and ethylene exhibited the most significant formation, with yields reaching 2.793 mol/kg and 4.182 mol/kg, respectively. Polyethylene, as a long-chain vinyl monomer polymer [19], experiences a depolymerization–decomposition process during pyrolysis. This process predominantly generates substantial amounts of paraffin and olefins. Subsequently, the olefins are further decomposed into light alkanes and olefinic gases, including CH4 and C2H4 [20]. Consequently, with the increasing proportion of PE agricultural film in the feedstock, the production yields of methane and ethylene not only increased but also became significantly higher. This phenomenon is primarily attributed to the occurrence of the methanation reaction. The methanation reaction facilitates the transfer of a greater amount of hydrogen from the raw materials into hydrocarbon products, driving the enhanced production of these gases.
In addition, the yields of CO and CO2 decreased with the increase in PAF because of the low oxygen content in the feedstock. As shown in Figure 2b,c, this declining trend of CO yield was essentially the same for the experimental and theoretical values. When the feed contained 100% PAF, the experimental CO yield was almost zero. The linear behavior of the CO2 yield at different mixture ratios indicated that CO2 production during co-pyrolysis was insignificantly affected by the feed composition. For the co-pyrolysis of biomass and plastic, CO and CO2 are mainly generated from pyrolysis and the reforming process of thermally unstable carbonyl (C=O), carboxyl (–COOH), and ether (–C–O–C) groups [21]. During the co-pyrolysis of SB and PAF, the synergistic effect may produce more hydroxyl radicals, which can attack polymer chains in the plastic or aromatic rings in the biomass, and then react with aliphatic species to produce CO and CO2 [22].
The data in Figure 2 show that the intensity of the synergistic effect generated by SB was higher than that of PAF during the pyrolysis process. The experimental and theoretical yields of CH4 showed an upward trend, with the experimental yield being much higher, reaching 3.12 mol CH4/kg feedstock.
Figure 3 describes the volume concentration of syngas at different SB–PAF ratios during co-pyrolysis. H2 and CO showed a downward trend, while CO2 remained almost unchanged at 6.9–11.9 vol.%. The increase in PAF proportion showed a linear relationship with the CH4 concentration and the results were consistent with those of Figure 2. When the PAF content of the feedstock was 0–80%, the volume proportion of H2 was higher than that of the other three gases; when the PAF content was 90% or 100%, the concentration of CH4 was higher than that of H2, reaching 25.1–26.4 vol.%.
While H2 constitutes the majority of the gaseous product, efficient separation is indeed critical to enhance process viability and economic value. Integrating membrane separation or pressure swing adsorption (PSA) technologies might be good options, and these are well established for selective H2 purification from mixed gas streams. Membrane systems, tailored for high H2 selectivity and permeability, could effectively isolate H2 from CO, CH4, and light hydrocarbons, while PSA could further refine purity levels. We will prioritize optimizing separation protocols in future work to maximize H2 recovery and process sustainability.

2.2.2. Effect of Element Mass Ratio on Syngas Yield

Figure 4 shows the influence of carbon, hydrogen, and oxygen in the feedstock on the syngas yield during the constant-temperature pyrolysis of the SB–PAF mixtures. Y(B/P) = XEYT was used to calculate the syngas yield (biomass/plastic) to study the independent contributions of SB and PAF to H2, CO, CO2, and CH4 generation:
Y(B/P) represents syngas yield(biomass/plastic) in mol/kg feedstock; XE represents the mass proportion of C, H, or O in the mixed feed (Table 1) in mass%; YT is the experimental syngas yield shown in Figure 2. Comparing Figure 4a,b,f,g, the contribution of SB to CO and CO2 generation was significantly higher than that of PAF. Although CO2 produced by PAF clearly increased with increasing the proportion of C, oxygen in SB plays a decisive role in CO2 production. The increase in CH4 yield is mainly attributed to the increase in the proportion of PAF, i.e., the proportions of C and H in the mixture. As shown in Figure 4d, H2 from biomass showed a rapid downward trend with the decrease in SB in the mixture, while H2 produced by PAF was more stable. The relative volumes of H2 produced by 10% SB and 10% PAF were 0.112 and 1.219 moL/kg feedstock, respectively. This analysis shows that PAF has a more important contribution to H2 output.

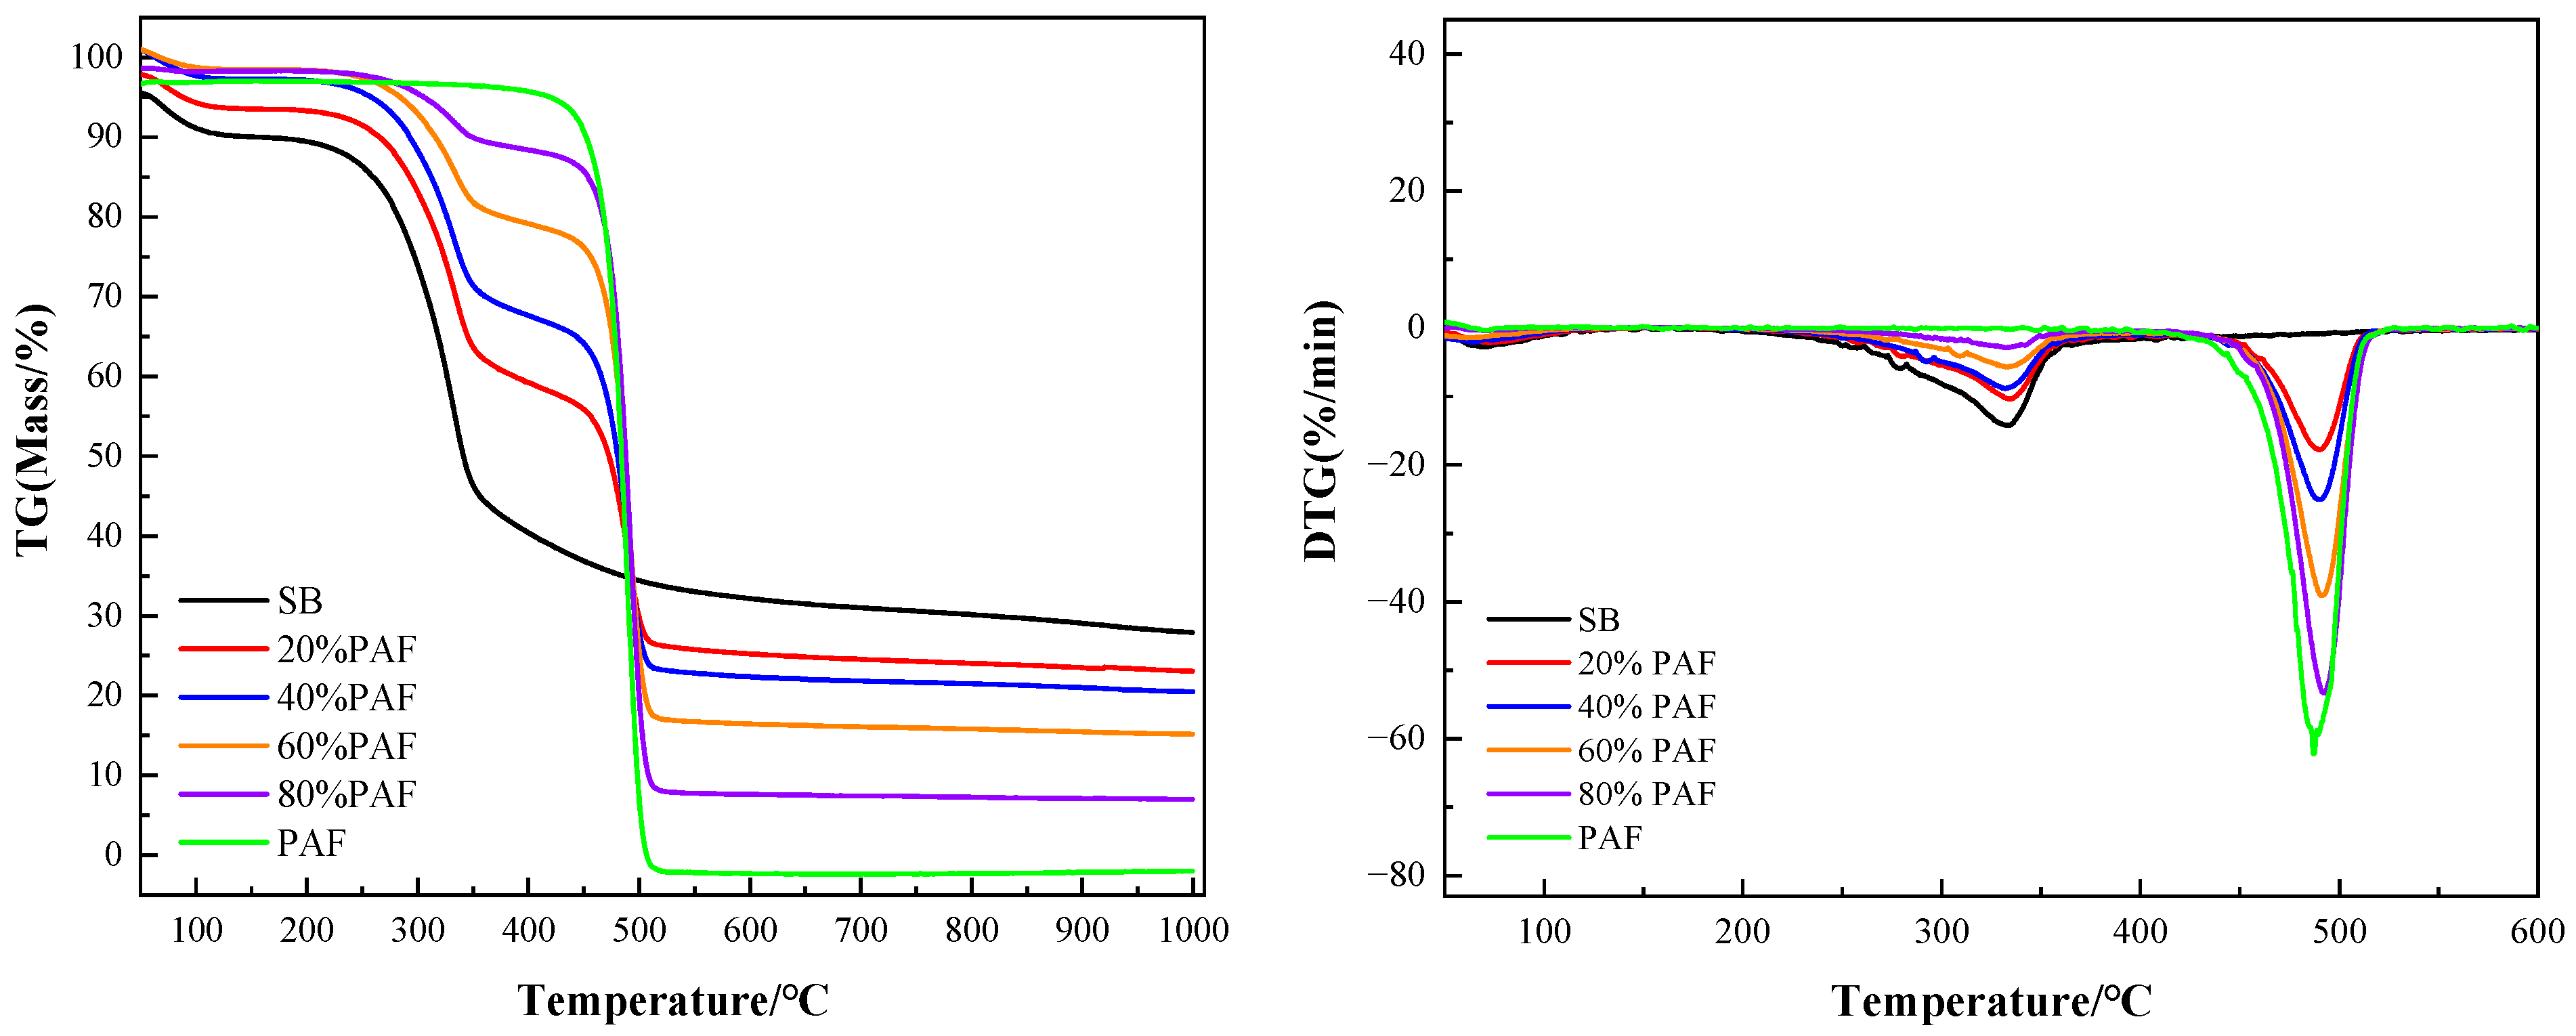
2.3. Pyrolysis Characteristics of Straw Biomass and Polyethylene Agricultural Film

2.3.1. Pyrolysis Characteristics of Straw Biomass and Polyethylene Agricultural Film with Different Mixing Ratios

Figure 5 shows images of mixed feedstock samples of different compositions.
Pyrolysis reaction kinetics were investigated in a TGA unit. The TG and DTG curves of the SB and PAF pyrolysis at different mixing ratios with nitrogen as the carrying gas are presented in Figure 6. Using a heating rate of 20 °C/min, the main pyrolysis range of SB was 232–410 °C with the peak temperature at 328 °C, and the pyrolysis intensity was 15.4%/min. The mass loss during this stage was mainly due to volatilization. Pyrolysis of biomass continued to 900–1000 °C, and decomposition continued until completion of carbonization. The main pyrolysis temperature range of PAF was 425–512 °C, the peak temperature was 483 °C, and the pyrolysis intensity was 80.4%/min. The mass loss in this range was mainly due to depolymerization and decomposition of polyethylene. The pyrolysis temperature range and the maximum rate of mass loss were significantly higher for PAF than for SB.
When SB and PAF were mixed, the pyrolysis process showed two stages of decomposition, unlike the single stage observed for pyrolysis of the individual materials. The pyrolysis temperature range and rate of maximum mass loss were dependent on the relative proportions of the two components in the mixture. The first decomposition stage, which took place below 373 °C, is mainly attributed to decomposition of SB and was less affected by PAF. As described by Han et al. [23], plastics will soften, but not decompose, in this temperature range. In the second decomposition stage, SB and PAF in the mixtures were co-pyrolyzed and the decomposition intensity was much higher than that of the first stage. A large amount of PAF decomposed as the temperature changed from 433 to 518 °C; therefore, the peak temperature and maximum rate of mass loss during this stage are attributed to the co-decomposition of SB and PAF, resulting in an increase in the observed synergistic effect. Table 1 summarizes the specific pyrolysis temperature ranges, peak temperatures, and maximum rate of mass loss for different relative proportions of the feedstock components.

2.3.2. Effect of Heating Rate on Pyrolysis Characteristics of Mixture Containing 40% Polyethylene Agricultural Film

Figure 7 shows the TG and DTG curves measured at heating rates of 10, 20, and 30 °C/min for feedstock samples containing 40% PAF. Pyrolysis of this mixture occurred in two stages. Table 2 summarizes the pyrolysis characteristics. Owing to the influence of thermal conductivity, the decomposition temperature range widened with the increase in the heating rate, and the peak temperature and maximum rate of mass loss increased. This phenomenon is attributed to the limitation of heat transfer, because the increase in heating rate leads to an increase in thermal conductivity [24,25]. The temperature difference between the inside and outside of the sample is large; so, the reaction time is longer and the temperature is higher for a given decomposition reaction.

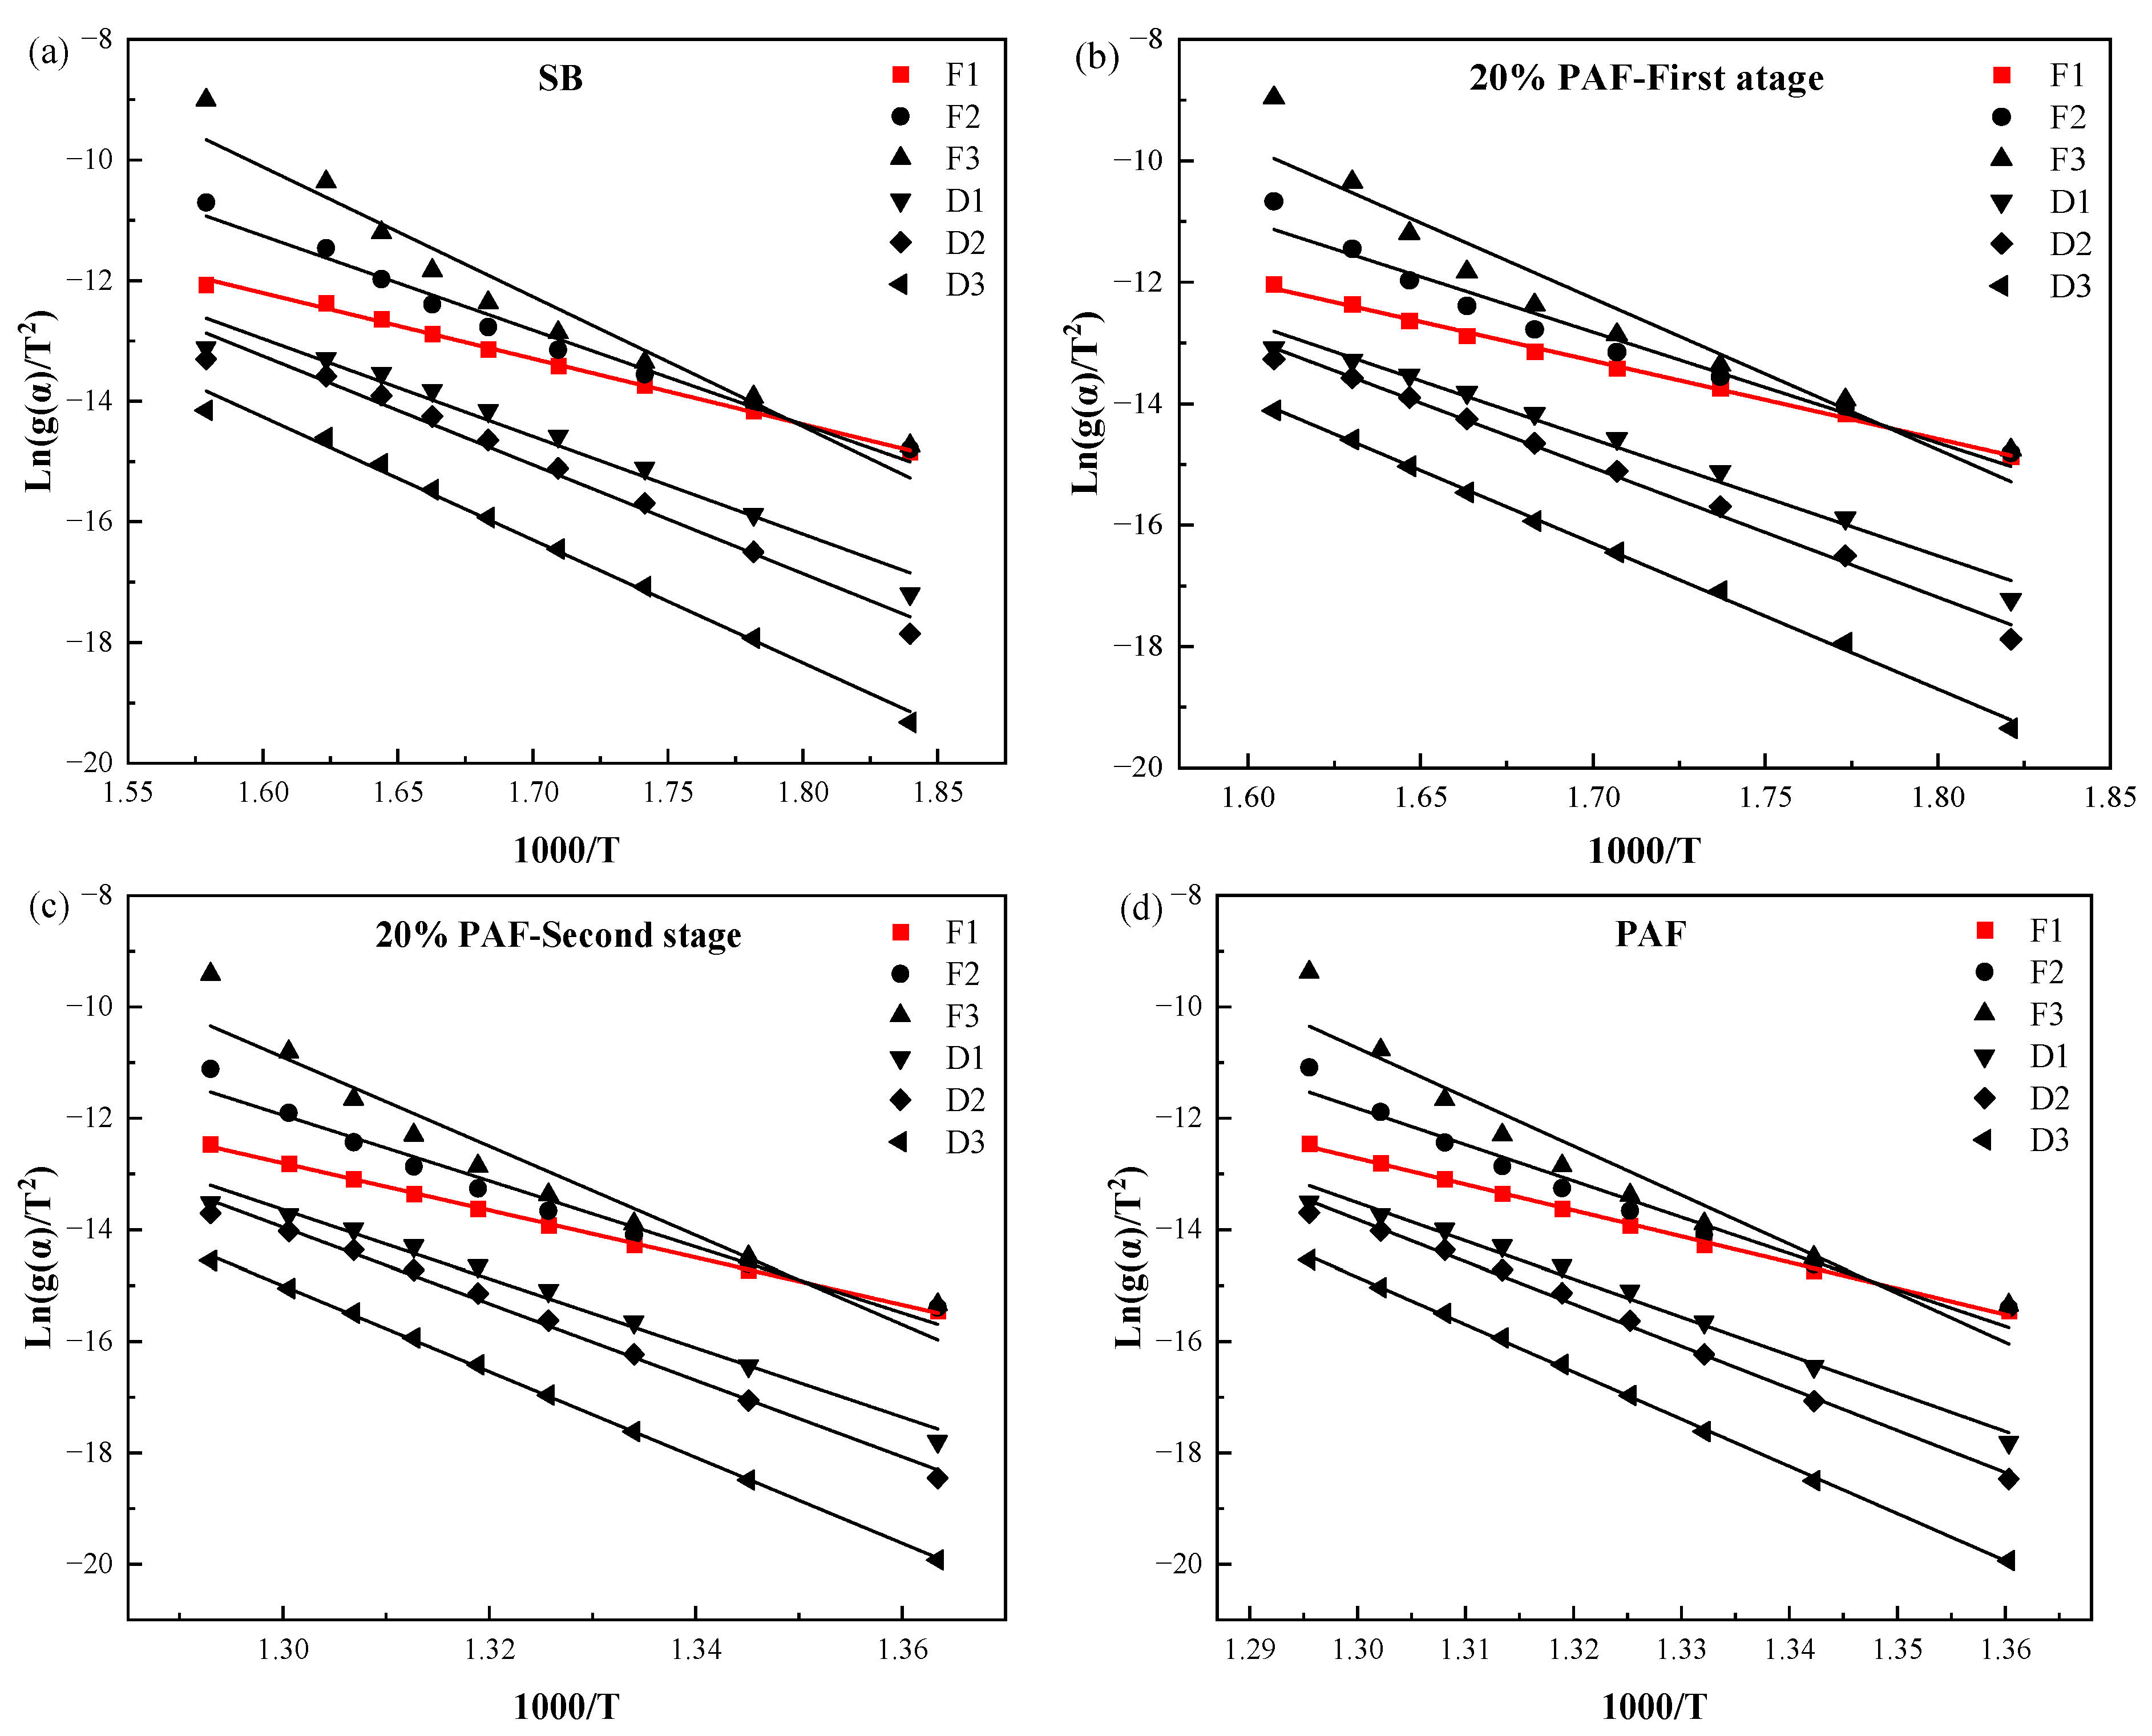
2.3.3. Pyrolysis Kinetics

In determining the mechanism of the reaction, first (F1)-, second (F2)-, and third (F3)-order reactions and one (D1)-, two (D2)-, and three (D3)-dimensional diffusion reactions were investigated. Values of α of 0.1, 0.2, 0.3, …, 0.9 were substituted into the kinetic equations for each reaction mechanism. The fitted curves of these kinetic equations are shown in Figure 8 for feedstock containing 20% PAF. The values of E and A were calculated for each decomposition stage from the slope and intercept of the best-fitted equation. Table 3 summarizes these values for the different reaction stages for different proportions of PAF. The correlation coefficients of the best-fitting lines exceeded 0.99 for all reaction stages, indicating that the first-order reaction model selected is in good agreement with the experimental data. Pyrolysis of SB and PAF alone can be described as first-order reactions, and pyrolysis of their mixtures can be described as two consecutive first-order reactions.
The data in Table 3 show that the proportion of plastics in the mixture had a strong influence on the kinetic parameters. With the increase in PAF proportion in the mixture, E and A in the both the first and second stages tended to increase. The kinetic parameters of the second stage are much higher than those of the first stage, and the rate of increase is also slightly higher. This is attributed to the co-pyrolysis of SB and PAF in the second stage, which requires higher energy for decomposition. Table 4 shows the kinetic parameters for pyrolysis of feedstocks containing 40% PAF at different heating rates. E and A tended to decrease with an increase in heating rate; so, the energy required gradually decreased.

3. Materials and Methods

3.1. Materials

The SB was obtained from the Surui straw processing plant in Lianyungang City, Jiangsu Province, China. The PAF was supplied by Huai’an Agricultural Plastic Film Factory, Jiangsu Province, China. These materials were ground and screened to a particle size of 0.28–0.45 mm, then dried in an oven at 105 °C for 12 h to remove moisture. These components were then homogeneously mixed to give PAF mass ratios of 0, 10%, 20%, 30%, 40%, 50%, 60%, 70%, 80%, 90%, and 100%. Approximate analyses of the SB and PAF by TGA (STA 449 F5, Netzsch, Selb, Germany) and the ultimate analysis (elemental analyzer, Vario MACRO Cube, Elementar, Ronkonkoma, NY, USA) are summarized in Table 5.

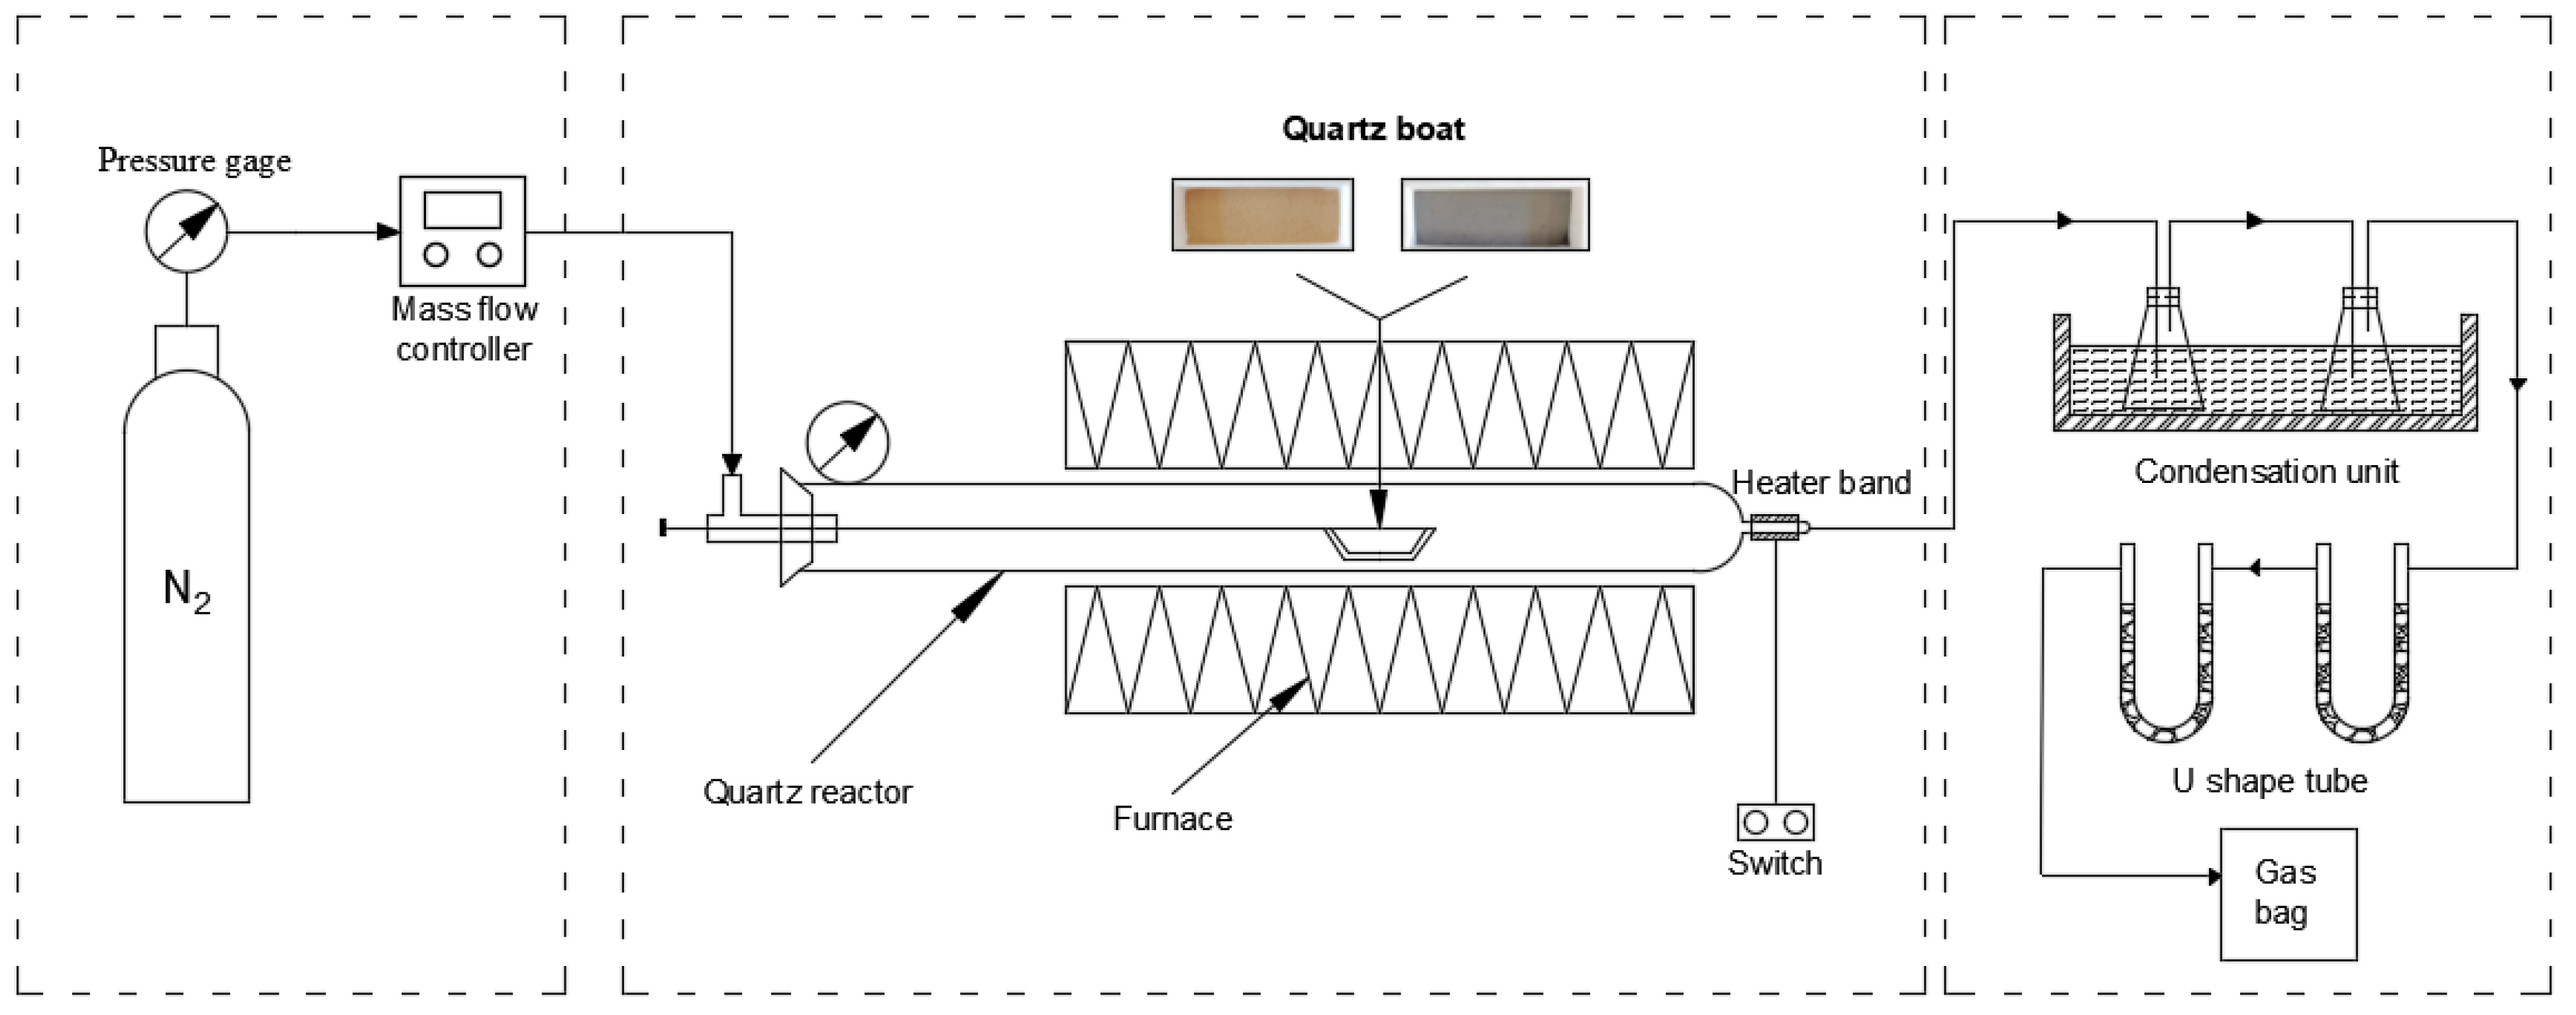
3.2. Experimental Procedure

The pyrolysis of SB, PAF, and their mixtures was carried out at atmospheric pressure in a horizontal quartz reactor with a length of 1500 mm and inner diameter of 52 mm, as shown in Figure 9. The experimental device included three parts: air intake, thermostatic pyrolysis, and gas cooling, drying, and collection. To obtain an inert atmosphere, the reaction was carried out in a nitrogen flow of 150 mL/min; the system was purged for 30 min before each experiment. Prior to each experiment, 3 g samples with different proportions of SB and PAF were evenly mixed with CaO powder at a mass ratio of Ca/C = 1.0 and placed in an alumina crucible on the left side of the reactor. The CaO could act as a catalyst to promote reforming in the pyrolysis process and promote the cracking of tar. The duration of each heat treatment was 40 min and the reaction temperature was 700 °C. The discharge end of the quartz tube was bound with an adhesive belt to prevent condensation of pyrolytic tar that could block the outlet. The gas produced by thermostatic pyrolysis was continuously cooled from the outlet in two ice-bath porous washing bottles, then passed into U-shaped tubes filled with activated carbon and color-changing silica gel for drying. Finally, the gas was collected in an air-collecting bag. The collected gas was passed through a gas chromatograph (GC 9790Plus, Fuli, Wenling, China) to measure the total gas production and syngas volume fractions. Gas samples were analyzed using a gas chromatograph (GC 9790Plus, Fuli, Wenling, China) equipped with a flame ionization detector (FID) and a thermal conductivity detector (TCD). The FID was ignited once its temperature exceeded 150 °C, while the TCD current was activated, initiating gas measurements when the detector temperature surpassed 125 °C. Separation was achieved using a dedicated capillary column (HP-PLOT ·Al2O3 S 30 m × 0.53 mm × 15 μm; Agilent, Santa Clara, CA, USA). Argon served as the carrier gas (pressure regulator: 0.3–0.4 MPa), with nitrogen (99.999% purity), synthetic air, and hydrogen (40 mL/min flow rate) as auxiliary gases. Each sample analysis required 20 min under optimized chromatographic conditions. Five synthetic gas samples were analyzed per operational condition, with subsequent determination of standard deviations to assess measurement reproducibility. The solid residue from each experiment was collected and weighed.

3.3. Thermogravimetric Analysis and Kinetics Methods

3.3.1. Thermogravimetric Analysis

Thermogravimetry was used to examine the pyrolysis characteristics of SB, PAF, and their blends, as described in Section 2.1. Samples of 4–6 mg were placed in an Al2O3 crucible and heated from room temperature to 1000 °C at a heating rate of 20 °C/min. To study the influence of heating rate on the loss characteristics of a SB–PAF blend, 40% PAF samples were also heated from room temperature to 1000 °C at heating rates of 10 °C/min and 30 °C/min under a nitrogen flow rate of 50 mL/min. TGA and differential thermogravimetric (DTG) curves were obtained. Kinetic analysis of these curves was used to calculate activation energies and pre-exponential factors for the pyrolysis of the different material ratios.

3.3.2. Kinetics Methods

The kinetic model, activation energy (E), and pre-exponential factor (A) of the combustion reactions were determined by analyzing the TGA data. In general, the kinetic equation can be described as follows:
d α d t = k f ( α )
where α is the extent of conversion of the combustible material, defined as follows:
α = m i   m t m i m f
where mi, mt, and mf are the sample masses at the beginning and end of pyrolysis and at temperature T, respectively. The reaction rate constant k is expressed by the Arrhenius equation:
k = A e x p E R T
where R is the universal gas constant. For thermal decomposition reactions, it is usually assumed that the reaction rate is proportional to the concentrations of the reactants:
f ( α ) =   1 α n
Substituting Equation (4) into Equation (1) yields:
d α d t = A e x p E R T 1 α n
Considering the constant heating rate β = dT/dt, Equation (5) can be re-arranged to:
d α d t = 1 β e x p E R T 1 α n
The integral method in the Coats–Redfern equation was used to obtain Equation (6) and logarithms of both sides were taken:
when   n     1 ,   ln 1 1 α 1 n T 2 1 n = ln A R β E 1 2 R T E E R T
when   n = 1 ,   ln ln 1 α T 2 = ln A R β E 1 2 R T E E R T
For the general range of reaction temperatures and most E values, 1 2 R T E 1; so, the first term at the right sides of Equations (7) and (8) is almost constant: when n = 1, a graph of 1 T against ln ln 1 α T 2 is plotted for appropriate values of n (in this case α = 0.1, 0.2, …, 0.9); when n ≠ 1, 1 T is similarly plotted against ln 1 1 α 1 n T 2 1 n . These plots yield a straight line with a slope of E R and intercept of approximately ln A R β E when the model is appropriate for the observed behavior, from which E and A can be determined.

4. Conclusions

A fixed-bed reactor and TGA were used to study pyrolysis of straw biomass and PE agricultural film. Different proportions of the feedstock components were evaluated with respect to the production of synthesis gas, liquid- and solid-phase, and the synergistic influence on pyrolysis kinetics. The relative ratios of major elements present in the feed were assessed in the process of constant-temperature pyrolysis with respect to their individual contributions to syngas yield and the effect of heating rate on the kinetic parameters. The experimental and theoretical yields of syngas were compared. The main conclusions are as follows:
(1) In the co-pyrolysis of biomass and plastic, the H2 and CO yields decreased with an increase in PAF proportion in the feedstock, the CO2 yield remained unchanged, and the CH4 yield increased to 3.124 mol/kg feedstock. Biomass contributed more to the production of CO and CO2, while the plastic component mainly affected the production of H2 and CH4. In comparing the experimental and theoretical syngas yields, the trends of CO and CH4 were relatively consistent, but there were large differences in the yields of H2 and CO2.
(2) When studying the effects of PAF proportion and heating rate on pyrolysis characteristics, the results show that the individual feedstock components exhibited a single pyrolysis step, but their mixture had two stages. The correlation coefficients of best linear fits to selected kinetic equations exceeded 0.99 for all reaction stages, and the kinetic parameters of activation energy (E) and pre-exponential factor (A) increased with the increase in plastics proportion. When the PAF proportion was 80%, E and A reached maximum values of 425 kJ/mol and 3.52 × 1032 min−1. For a given mixture ratio in the feed, E and A decreased as the heating rate increased, showing that the reaction required less energy.

Author Contributions

Conceptualization and writing—original draft preparation, Z.Z.; review, editing and funding acquisition, L.W. All authors have read and agreed to the published version of the manuscript.

Funding

The Agricultural Science and Technology Innovation Fund of Jiangsu Province (CX (20)3075). Jiangsu Six Summit Talent Project (JNHB-039).

Data Availability Statement

No new data were created.

Conflicts of Interest

The authors declare no conflicts of interest.

References

  1. Wang, S.; Dai, G.; Yang, H.; Luo, Z. Lignocellulosic biomass pyrolysis mechanism: A state-of-the-art review. Prog. Energy Combust. Sci. 2017, 62, 33–86. [Google Scholar] [CrossRef]
  2. Hosseini, S.E.; Abdul Wahid, M.; Jamil, M.M.; Azli, A.A.M.; Misbah, M.F. A review on biomass-based hydrogen production for renewable energy supply. Int. J. Energy Res. 2015, 39, 1597–1615. [Google Scholar] [CrossRef]
  3. Vooradi, R.; Bertran, M.-O.; Frauzem, R.; Anne, S.B.; Gani, R. Sustainable chemical processing and energy-carbon dioxide management: Review of challenges and opportunities. Chem. Eng. Res. Des. 2018, 131, 440–464. [Google Scholar] [CrossRef]
  4. Hassan, E.B.; Elsayed, I.; Eseyin, A. Production high yields of aromatic hydrocarbons through catalytic fast pyrolysis of torrefied wood and polystyrene. Fuel 2016, 174, 317–324. [Google Scholar] [CrossRef]
  5. Wang, Z.; Lei, T.; Chang, X.; Shi, X.; Xiao, J.; Li, Z.; He, X.; Zhu, J.; Yang, S. Optimization of a biomass briquette fuel system based on grey relational analysis and analytic hierarchy process: A study using cornstalks in China. Appl. Energy 2015, 157, 523–532. [Google Scholar] [CrossRef]
  6. Guo, F.; Jia, X.; Liang, S.; Zhou, N.; Chen, P.; Ruan, R. Development of biochar-based nanocatalysts for tar cracking/reforming during biomass pyrolysis and gasification. Bioresour. Technol. 2020, 298, 122263. [Google Scholar] [CrossRef]
  7. Guo, S.; Nie, R.; Yu, Z. Syngas production from biomass gasification in China: A clean strategy for sustainable development. Energy Sources Part A Recovery Util. Environ. Eff. 2019, 41, 911–917. [Google Scholar] [CrossRef]
  8. Thomson, R.; Kwong, P.; Ahmad, E.; Nigam, K.D.P. Clean syngas from small commercial biomass gasifiers; a review of gasifier development, recent advances and performance evaluation. Int. J. Hydrogen Energy 2020, 45, 21087–21111. [Google Scholar] [CrossRef]
  9. Ansari, K.B.; Gaikar, V.G. Investigating production of hydrocarbon rich bio-oil from grassy biomass using vacuum pyrolysis coupled with online deoxygenation of volatile products over metallic iron. Renew. Energy 2019, 130, 305–318. [Google Scholar] [CrossRef]
  10. Jadhao, P.R.; Ahmad, E.; Pant, K.K.; Nigam, K.D.P. Environmentally friendly approach for the recovery of metallic fraction from waste printed circuit boards using pyrolysis and ultrasonication. Waste Manag. 2020, 118, 150–160. [Google Scholar] [CrossRef]
  11. Bridgwater, A.V. Review of fast pyrolysis of biomass and product upgrading. Biomass Bioenergy 2012, 38, 68–94. [Google Scholar] [CrossRef]
  12. Zhang, H.; Carlson, T.R.; Xiao, R.; Huber, G.W. Catalytic fast pyrolysis of wood and alcohol mixtures in a fluidized bed reactor. Green Chem. 2012, 14, 98–110. [Google Scholar] [CrossRef]
  13. Xu, D.; Xiong, Y.; Zhang, S.; Su, Y. The synergistic mechanism between coke depositions and gas for H2 production from co-pyrolysis of biomass and plastic wastes via char supported catalyst. Waste Manag. 2021, 121, 23–32. [Google Scholar] [CrossRef]
  14. Chattopadhyay, J.; Pathak, T.S.; Srivastava, R.; Singh, A.C. Catalytic co-pyrolysis of paper biomass and plastic mixtures (HDPE (high density polyethylene), PP (polypropylene) and PET (polyethylene terephthalate)) and product analysis. Energy 2016, 103, 513–521. [Google Scholar] [CrossRef]
  15. Gu, J.; Fan, H.; Wang, Y.; Zhang, Y.; Yuan, H.; Chen, Y. Co-pyrolysis of xylan and high-density polyethylene: Product distribution and synergistic effects. Fuel 2020, 267, 116896. [Google Scholar] [CrossRef]
  16. Lopez, G.; Erkiaga, A.; Amutio, M.; Bilbao, J.; Olazar, M. Effect of polyethylene co-feeding in the steam gasification of biomass in a conical spouted bed reactor. Fuel 2015, 153, 393–401. [Google Scholar] [CrossRef]
  17. Abnisa, F.; Wan Daud, W.M.A.; Ramalingam, S.; Azemi, M.N.B.M.; Sahu, J.N. Co-pyrolysis of palm shell and polystyrene waste mixtures to synthesis liquid fuel. Fuel 2013, 108, 311–318. [Google Scholar] [CrossRef]
  18. Li, X.T.; Grace, J.R.; Lim, C.J.; Watkinson, A.P.; Chen, H.P.; Kim, J.R. Biomass gasification in a circulating fluidized bed. Biomass Bioenergy 2004, 26, 171–193. [Google Scholar] [CrossRef]
  19. Anuar Sharuddin, S.D.; Abnisa, F.; Wan Daud, W.M.A.; Aroua, M.K. A review on pyrolysis of plastic wastes. Energy Convers. Manag. 2016, 115, 308–326. [Google Scholar] [CrossRef]
  20. Cao, C.; Bian, C.; Wang, G.; Bai, B.; Xie, Y.; Jin, H. Co-gasification of plastic wastes and soda lignin in supercritical water. Chem. Eng. J. 2020, 388, 124277. [Google Scholar] [CrossRef]
  21. Hu, S.; Jiang, L.; Wang, Y.; Su, S.; Sun, L.; Xu, B.; He, L.; Xiang, J. Effects of inherent alkali and alkaline earth metallic species on biomass pyrolysis at different temperatures. Bioresour. Technol. 2015, 192, 23–30. [Google Scholar] [CrossRef] [PubMed]
  22. Jin, Q.; Wang, X.; Li, S.; Mikulčić, H.; Bešenić, T.; Deng, S.; Vujanović, M.; Tan, H.; Kumfer, B.M. Synergistic effects during co-pyrolysis of biomass and plastic: Gas, tar, soot, char products and thermogravimetric study. J. Energy Inst. 2019, 92, 108–117. [Google Scholar] [CrossRef]
  23. Han, B.; Chen, Y.; Wu, Y.; Hua, D.; Chen, Z.; Feng, W.; Yang, M.; Xie, Q. Co-pyrolysis behaviors and kinetics of plastics–biomass blends through thermogravimetric analysis. J. Therm. Anal. Calorim. 2014, 115, 227–235. [Google Scholar] [CrossRef]
  24. Ma, P.; Yang, J.; Xing, X.; Weihrich, S.; Fan, F.; Zhang, X. Isoconversional kinetics and characteristics of combustion on hydrothermally treated biomass. Renew. Energy 2017, 114, 1069–1076. [Google Scholar] [CrossRef]
  25. Maiti, S.; Purakayastha, S.; Ghosh, B. Thermal characterization of mustard straw and stalk in nitrogen at different heating rates. Fuel 2007, 86, 1513–1518. [Google Scholar] [CrossRef]
Figure 1. Three phases of products of thermostatic pyrolysis of straw biomass (SB) and polyethylene agricultural film (PAF) and their mixtures.
Catalysts 15 00517 g001
Figure 2. Experimental (E) and theoretical (T) syngas yields for different ratios of straw biomass (SB) and polyethylene agricultural film (PAF) in the feedstock. (a) H2; (b) CO; (c) CO2; (d) CH4.
Catalysts 15 00517 g002
Figure 3. Volumetric composition of product gas at different blending ratios during co-pyrolysis of straw biomass (SB) and polyethylene agricultural film (PAF).
Catalysts 15 00517 g003
Figure 4. Effect of C, H, and O mass ratios in straw biomass (SB)–polyethylene agricultural film (PAF) mixtures on yields of individual gases in syngas. Effect of C on (a) CO (b) CO2 (c) CH4; Effect of H on (d) H2 (e) CH4; Effect of O on (f) CO (g) CO2.
Catalysts 15 00517 g004
Figure 5. Images of mixtures of straw biomass (SB) and polyethylene agricultural film (PAF).
Catalysts 15 00517 g005
Figure 6. Thermogravimetric (TG) and differential thermogravimetry (DTG) analysis of pyrolysis for different straw biomass (BS) and polyethylene agricultural film (PAF) mixing ratios.
Catalysts 15 00517 g006
Figure 7. Thermogravimetric (TG) and differential thermogravimetric (DTG) analysis of feedstock containing 40% PAF at heating rates of 10, 20, and 30 °C/min.
Catalysts 15 00517 g007
Figure 8. Fitted curves of kinetic equations for pyrolysis at 20 °C/min of (a) straw biomass (SB), (b) SB with 20% polyethylene agricultural film (PAF)—first stage, (c) SB with 20% PAF—second stage, and (d) PAF.
Catalysts 15 00517 g008
Figure 9. Schematic of pyrolysis system.
Catalysts 15 00517 g009
Table 1. Pyrolysis characteristics of straw biomass (SB)–polyethylene agricultural film (PAF) mixtures at 20 °C/min.
SamplesZone1Zone2
Ti1Tp1Tf1−Rp1Ti2Tp2Tf2−Rp2
SB232.1328.8410.515.4----
20%PAF–80%SB247.8335.7373.711.5434.7490.5511.518.7
40%PAF–60%SB254.8332.9372.59.7433.0491.9512.826.2
60%PAF–40%SB262.0333.4360.58.5433.1489.9514.941.1
80%PAF–20%SB282.0344.5353.24.6435.2492.0518.356.6
PAF----425.9483.9512.080.4
Ti: initial decomposition temperature, °C; Tp: peak temperature of each zone, °C; Tf: final decomposition temperature, °C; −Rp: maximum rate of mass loss of each zone, mass%/min; subscripts 1 and 2 refer to the first and second zones, respectively.
Table 2. Pyrolysis characteristics of feedstock containing 40% PAF at heating rates of 10, 20, and 30 °C/min.
SamplesZone1Zone2
Ti1Tp1Tf1−Rp1Ti2Tp2Tf2−Rp2
40%PAF-60%SB-10 °C2553203504.243047550011.7
40%PAF-60%SB-20 °C2553333739.743349251326.2
40%PAF-60%SB-30 °C23534041011.8415491.949535.8
Table 3. Kinetic parameters for pyrolysis of feedstock mixtures at a heating rate of 20 °C/min.
SamplesZone1Zone2
E1
KJ/mol
A1
min−1
R12E2
KJ/mol
A2
min−1
R22
SB91.451.08 × 1080.9982---
20%PAF-80%SB107.074.85 × 1090.9967351.556.28 × 10260.9991
40%PAF-60%SB113.892.48 × 10100.9979360.804.0 × 10270.9994
60%PAF-40%SB123.552.46 × 10110.9978400.034.29 × 10300.9996
80%PAF-20%SB162.192.11 × 10150.9948424.73.52 × 10320.9998
PAF---387.936.19 × 10290.9979
Table 4. Kinetic parameters for pyrolysis of feedstock containing 40% PAF at heating rates of 10, 20 and 30 °C/min.
SamplesZone1Zone2
E1
KJ/mol
A1
min−1
R12E2
KJ/mol
A2
min−1
R22
40%PAF-60%SB-10 °C121.81.48 × 10110.9983373.617.23 × 10250.9998
40%PAF-60%SB-20 °C113.892.48 × 10100.9979360.804.0 × 10270.9994
40%PAF-60%SB-30 °C91.971.42 × 1080.9983335.492.91 × 10240.9969
Table 5. Proximate and ultimate analyses of straw biomass (SB) and polyethylene agricultural film (PAF).
SBPAF
Ultimate analysis (mass%, dry ash free)
Carbon37.9783.66
Hydrogen5.4412.71
Oxygen39.862.59
Nitrogen1.30-
Sulfur0.26-
Proximate analysis (mass%, dry basis)
Water content6.95-
Ash63.05-
Volatile12.55-
Fixed carbon17.45-
Disclaimer/Publisher’s Note: The statements, opinions and data contained in all publications are solely those of the individual author(s) and contributor(s) and not of MDPI and/or the editor(s). MDPI and/or the editor(s) disclaim responsibility for any injury to people or property resulting from any ideas, methods, instructions or products referred to in the content.

