2.1. Structural Analysis
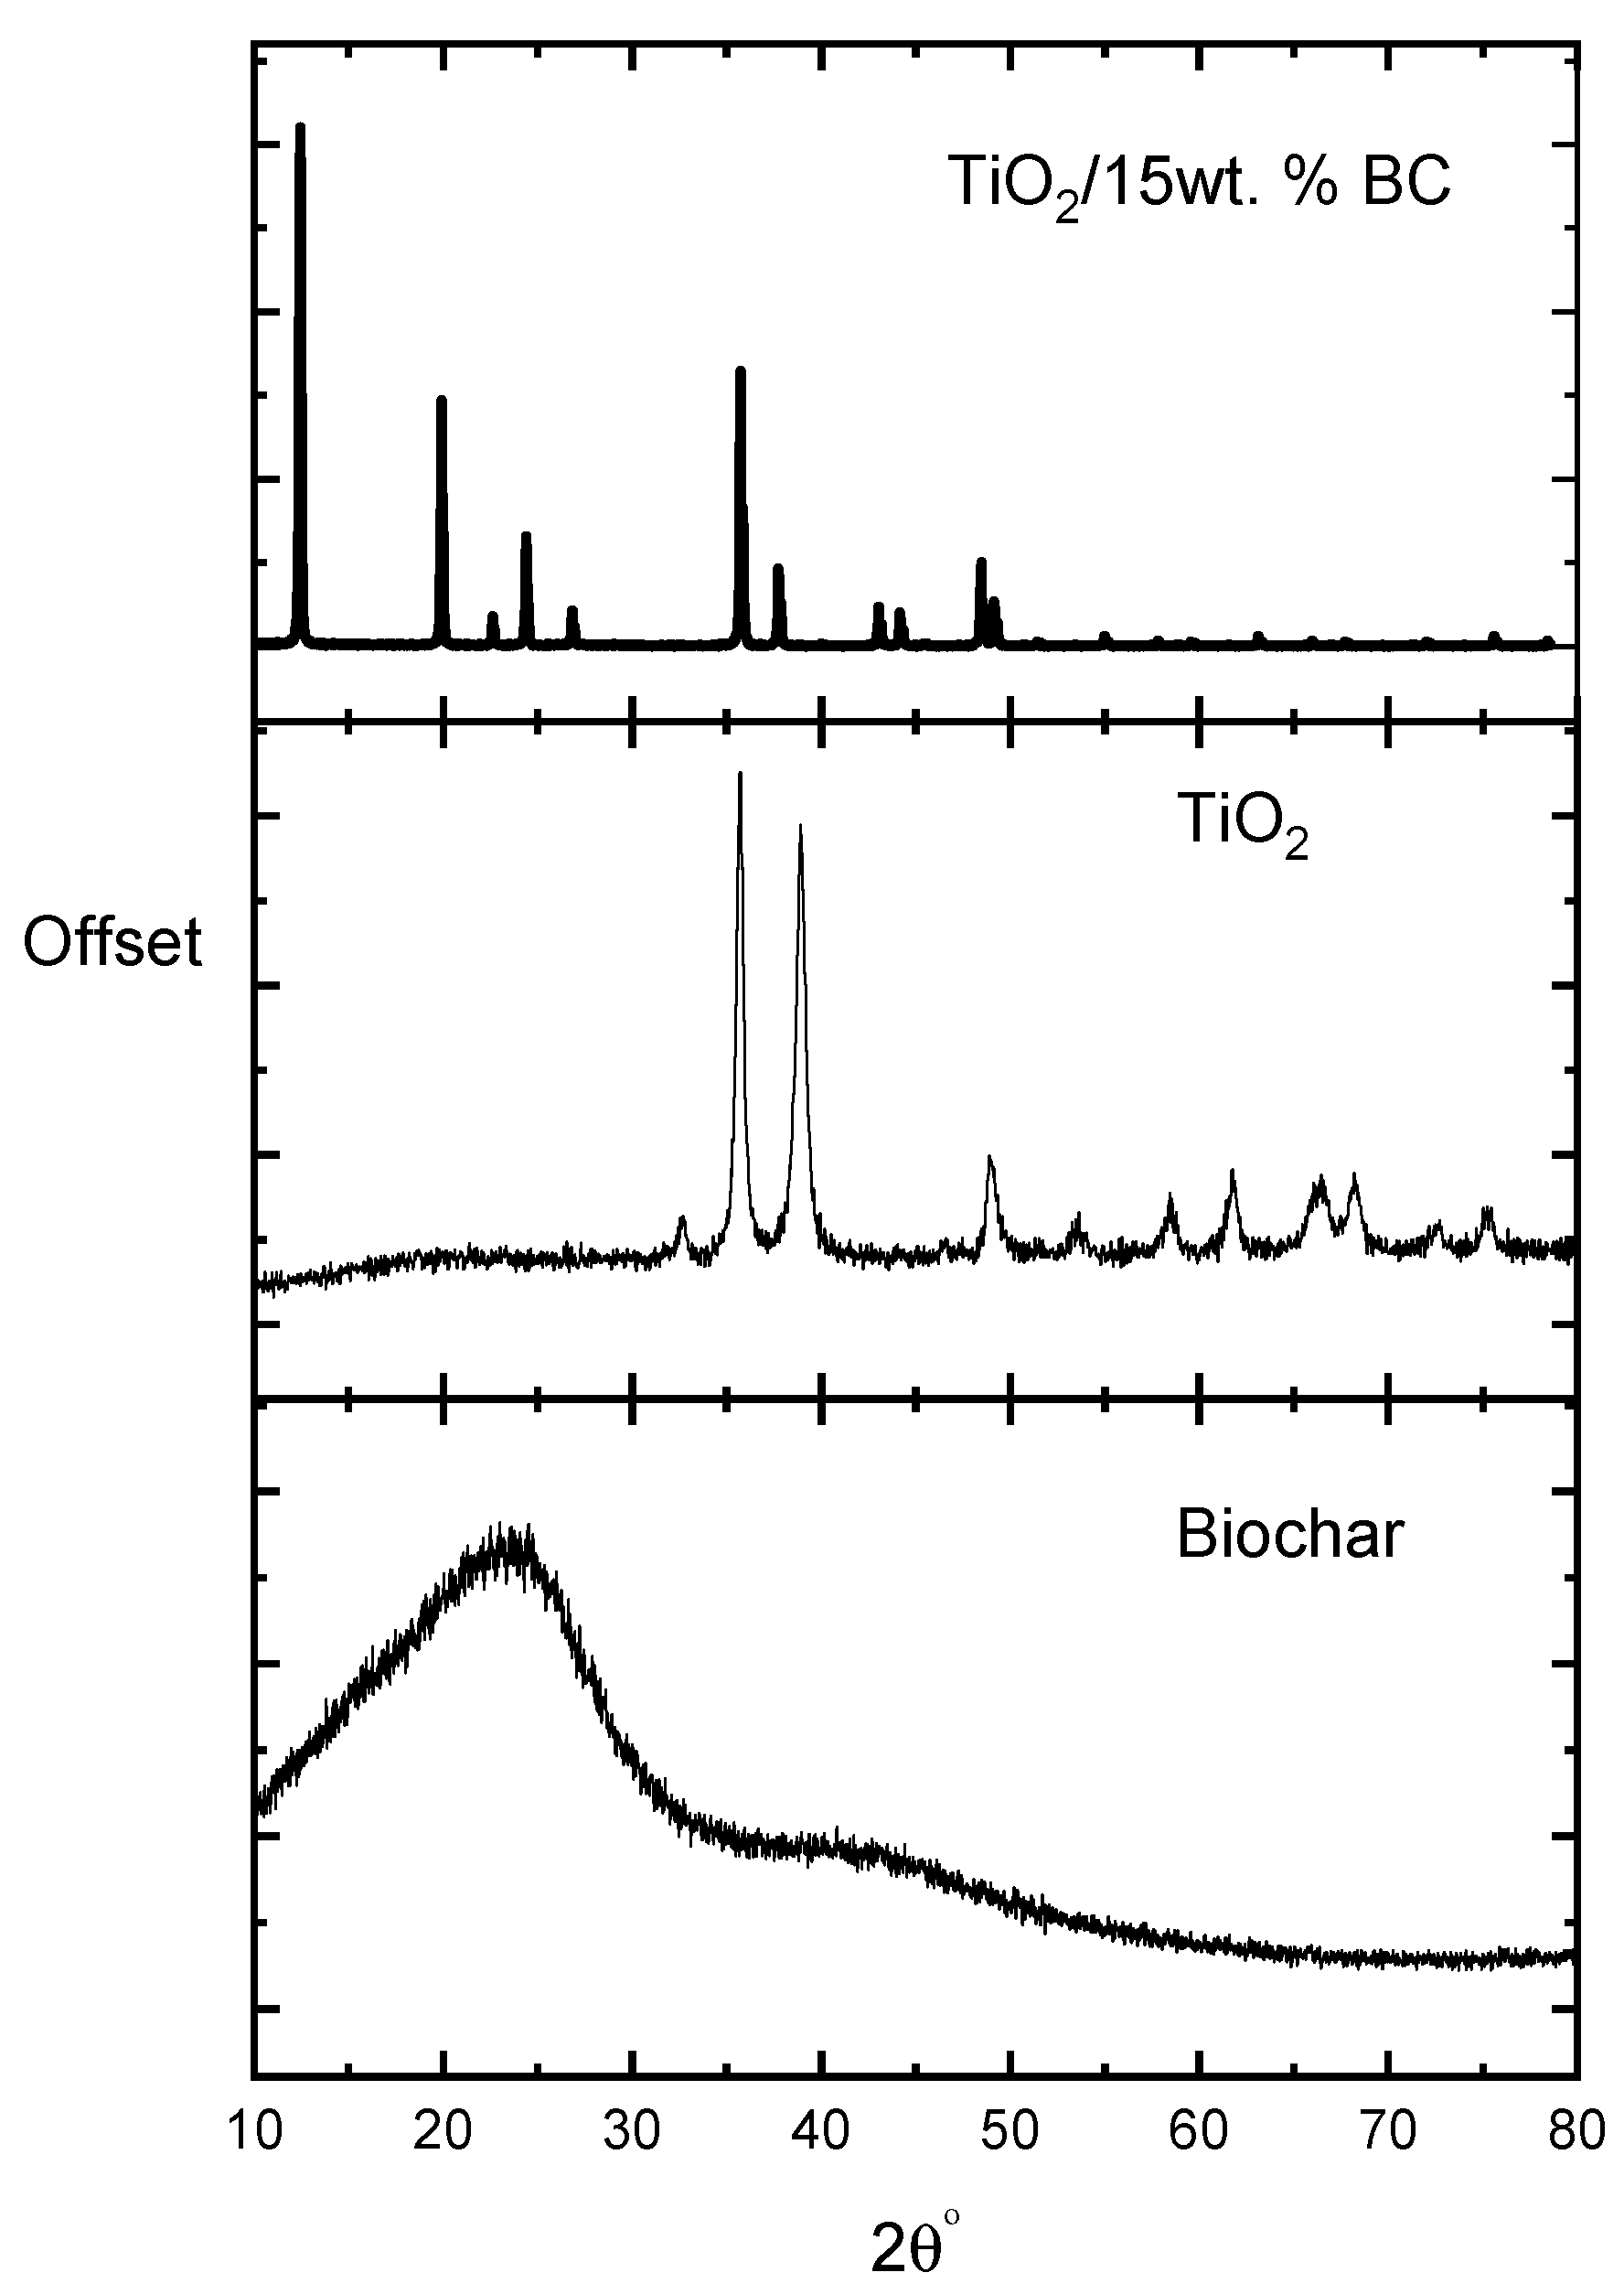
The X-ray diffraction (XRD) patterns of activated biochar, pure TiO
2, and TiO
2/biochar composite (15 wt% BC) are shown in
Figure 1 (an expanded view of 2θ = 22–28° is included as an inset). The powder standard for anatase (JCPDS No. 21-1272) indicates the strongest anatase (101) reflection at ≈25.3° (2θ). In our measurements, the (101) reflection is clearly visible at ~25.3° for the pure TiO
2 film but appears as a broadened, weaker feature in the TiO
2/BC composites. This reduction in apparent peak intensity for the composites is attributable to two factors: (i) the samples are thin spin-coated films (nominal thickness ≈ 100 ± 10 nm), which provide a low diffracting volume in a Bragg–Brentano PXRD geometry and therefore yield lower peak intensities compared to bulk powder measurements, and (ii) the activated biochar introduces a broad amorphous scattering background (a carbonaceous hump) that overlaps and partially masks crystalline reflections, reducing the peak-to-background contrast. Both effects are common and expected for thin carbon-modified films measured with a conventional PXRD setup and have been discussed in the thin-film XRD literature [
20].
Despite the reduced intensity in the composite patterns, the positions of the observable diffraction features correspond to the anatase TiO
2 reflections (the (101), (004), and (200) reflections around 25.3°, 37.8°, and 48.0°, respectively), consistent with JCPDS 21-1272 and previous reports. Where necessary, peak broadening was quantified with Scherrer analysis, and the observed broadening is consistent with the small crystallite sizes and the film geometry. For complete clarity, we have added a short discussion of the limitations of conventional PXRD for thin films and noted that complementary techniques (e.g., Raman spectroscopy or electron diffraction) are valuable when the diffracting volume is limited [
21,
22].
The crystallinity degree is a very vital parameter for different applications, and it could be calculated by Equation (1) [
18]:
where “
Ac” is the total crystalline region and “
Aa” is the total amorphous region. The average degree of crystallinity of TiO
2/
x wt% BC (
x = 0 and 15) is 67% and 78%, respectively. Applying Scherer’s equation [
23] to all the planes shown above demonstrates that the average crystallite sizes of TiO
2/
x wt% BC (
x = 0 and 15) are 59 and 71 nm, respectively.
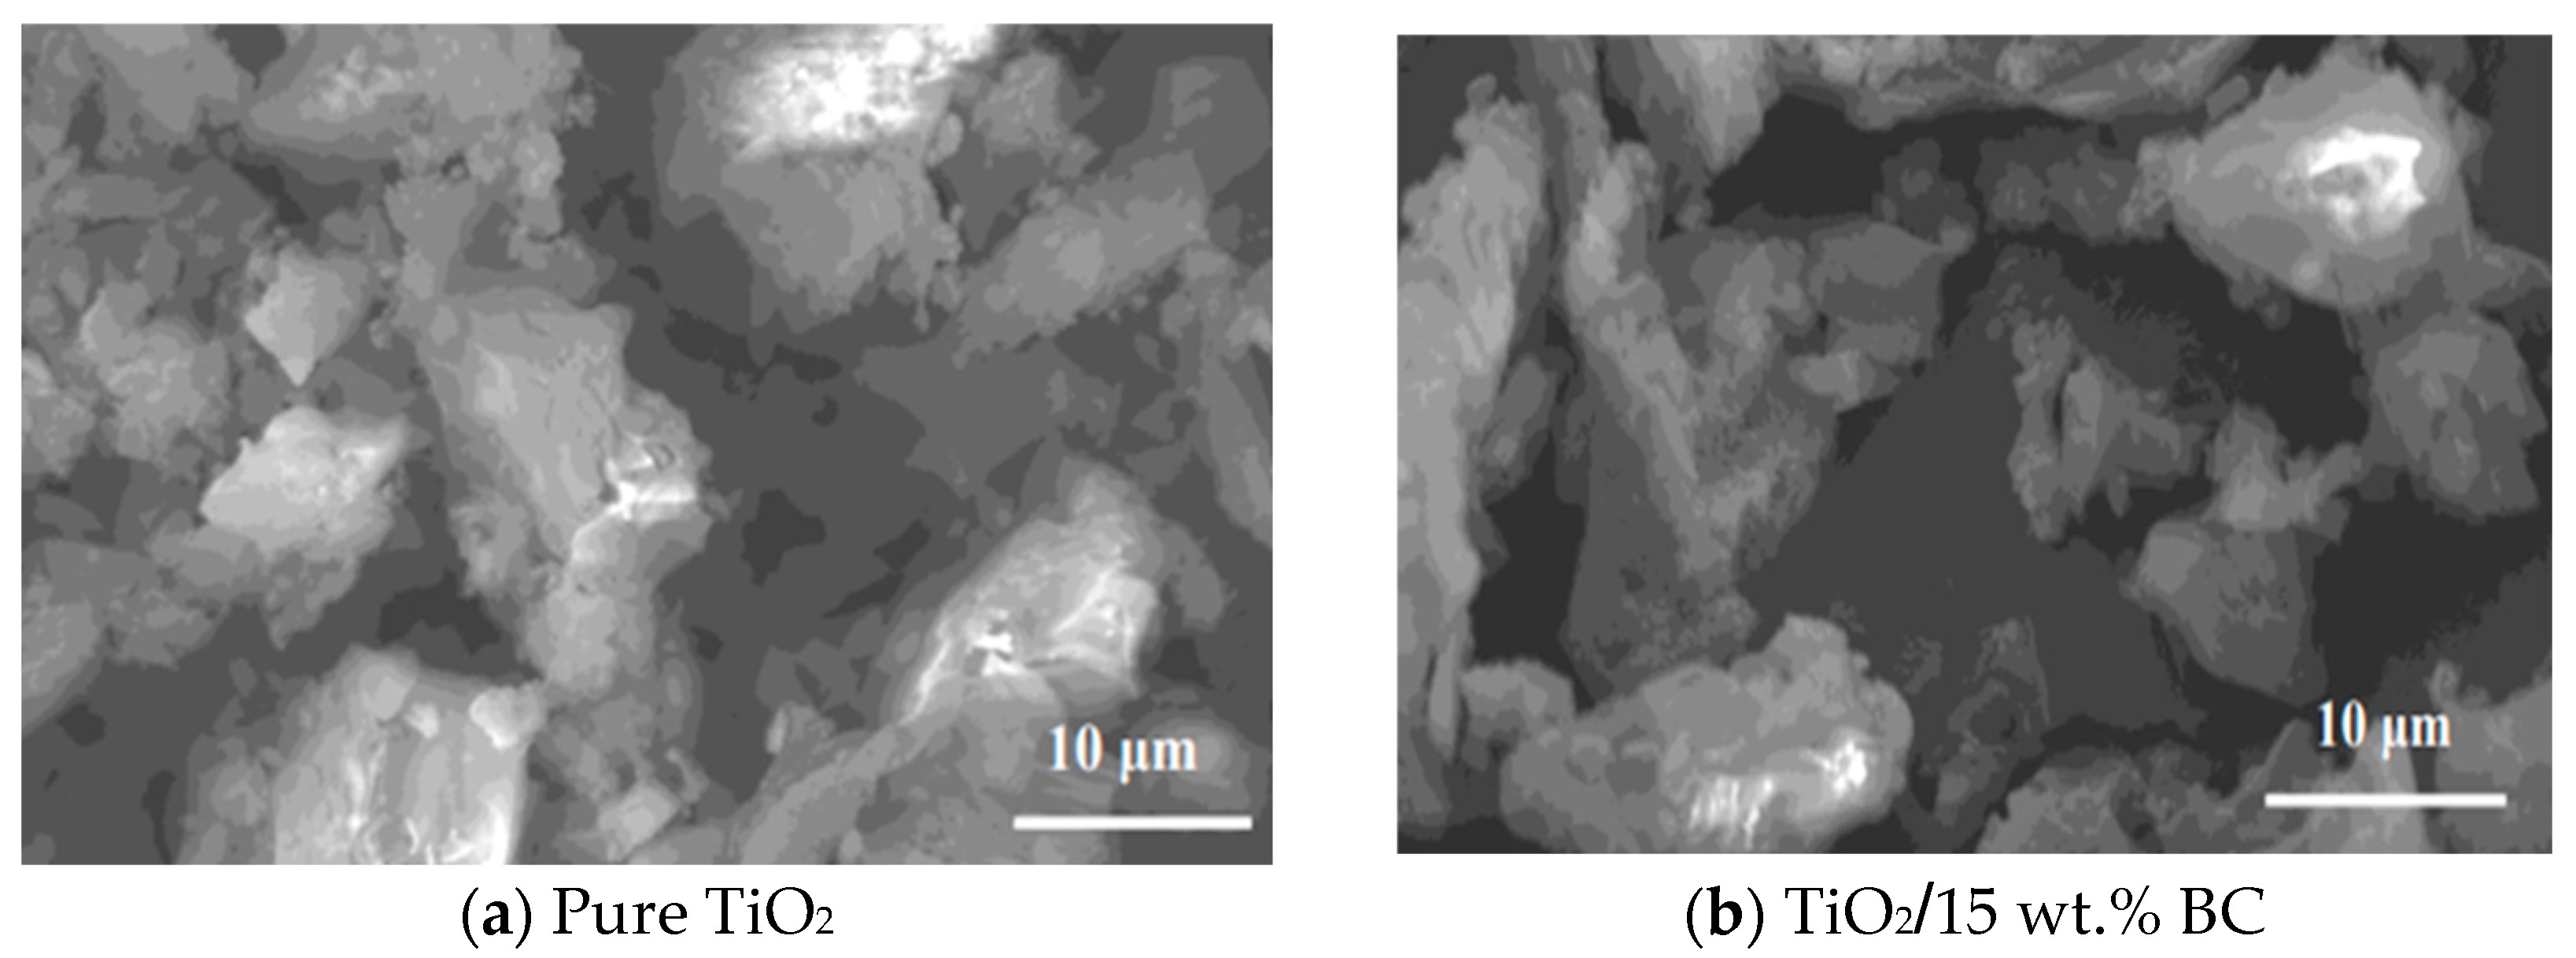
The Scanning Electron Microscopy (SEM) image of pure TiO
2 (
Figure 2a) reveals a surface morphology characterized by irregularly shaped particles with a broad size distribution. The particles appear agglomerated into larger clusters, suggesting a high degree of crystallinity. The surface texture is rough, with visible pores and cavities, suggesting a high surface area. The particles’ edges appear sharp, indicating a crystalline structure. The overall morphology suggests that the pure TiO
2 sample may exhibit high crystallinity and surface area, which could benefit applications such as photocatalysis.
The SEM image of TiO
2 modified with 15 wt% biochar (BC) (
Figure 2b) exhibits a distinctly different surface morphology. The presence of biochar has significantly modified the TiO
2 particles. The SEM micrographs show that the TiO
2 particles tend to agglomerate into clusters, a typical behavior for nanoparticles due to their high surface energy. In the TiO
2/biochar composites, the presence of biochar appears to improve particle dispersion and reduce the extent of agglomeration, likely due to the porous and functionalized nature of the biochar surface. This enhanced dispersion is expected to increase the interfacial contact area between TiO
2 and biochar, favoring charge transfer and adsorption during photocatalysis. While SEM provides valuable morphological insights, detailed crystallinity information is obtained from XRD analysis, and no such claims are drawn from SEM images here. Incorporating biochar has led to a more heterogeneous surface morphology, potentially enhancing the material’s adsorption and photocatalytic properties. Adding biochar appears to have altered the surface properties of TiO
2, creating a more complex, porous structure. This modified morphology may influence the material’s interactions with its environment, such as the adsorption of pollutants or reactions with light, and thus affect its overall performance in various applications.
2.2. Optical Studies
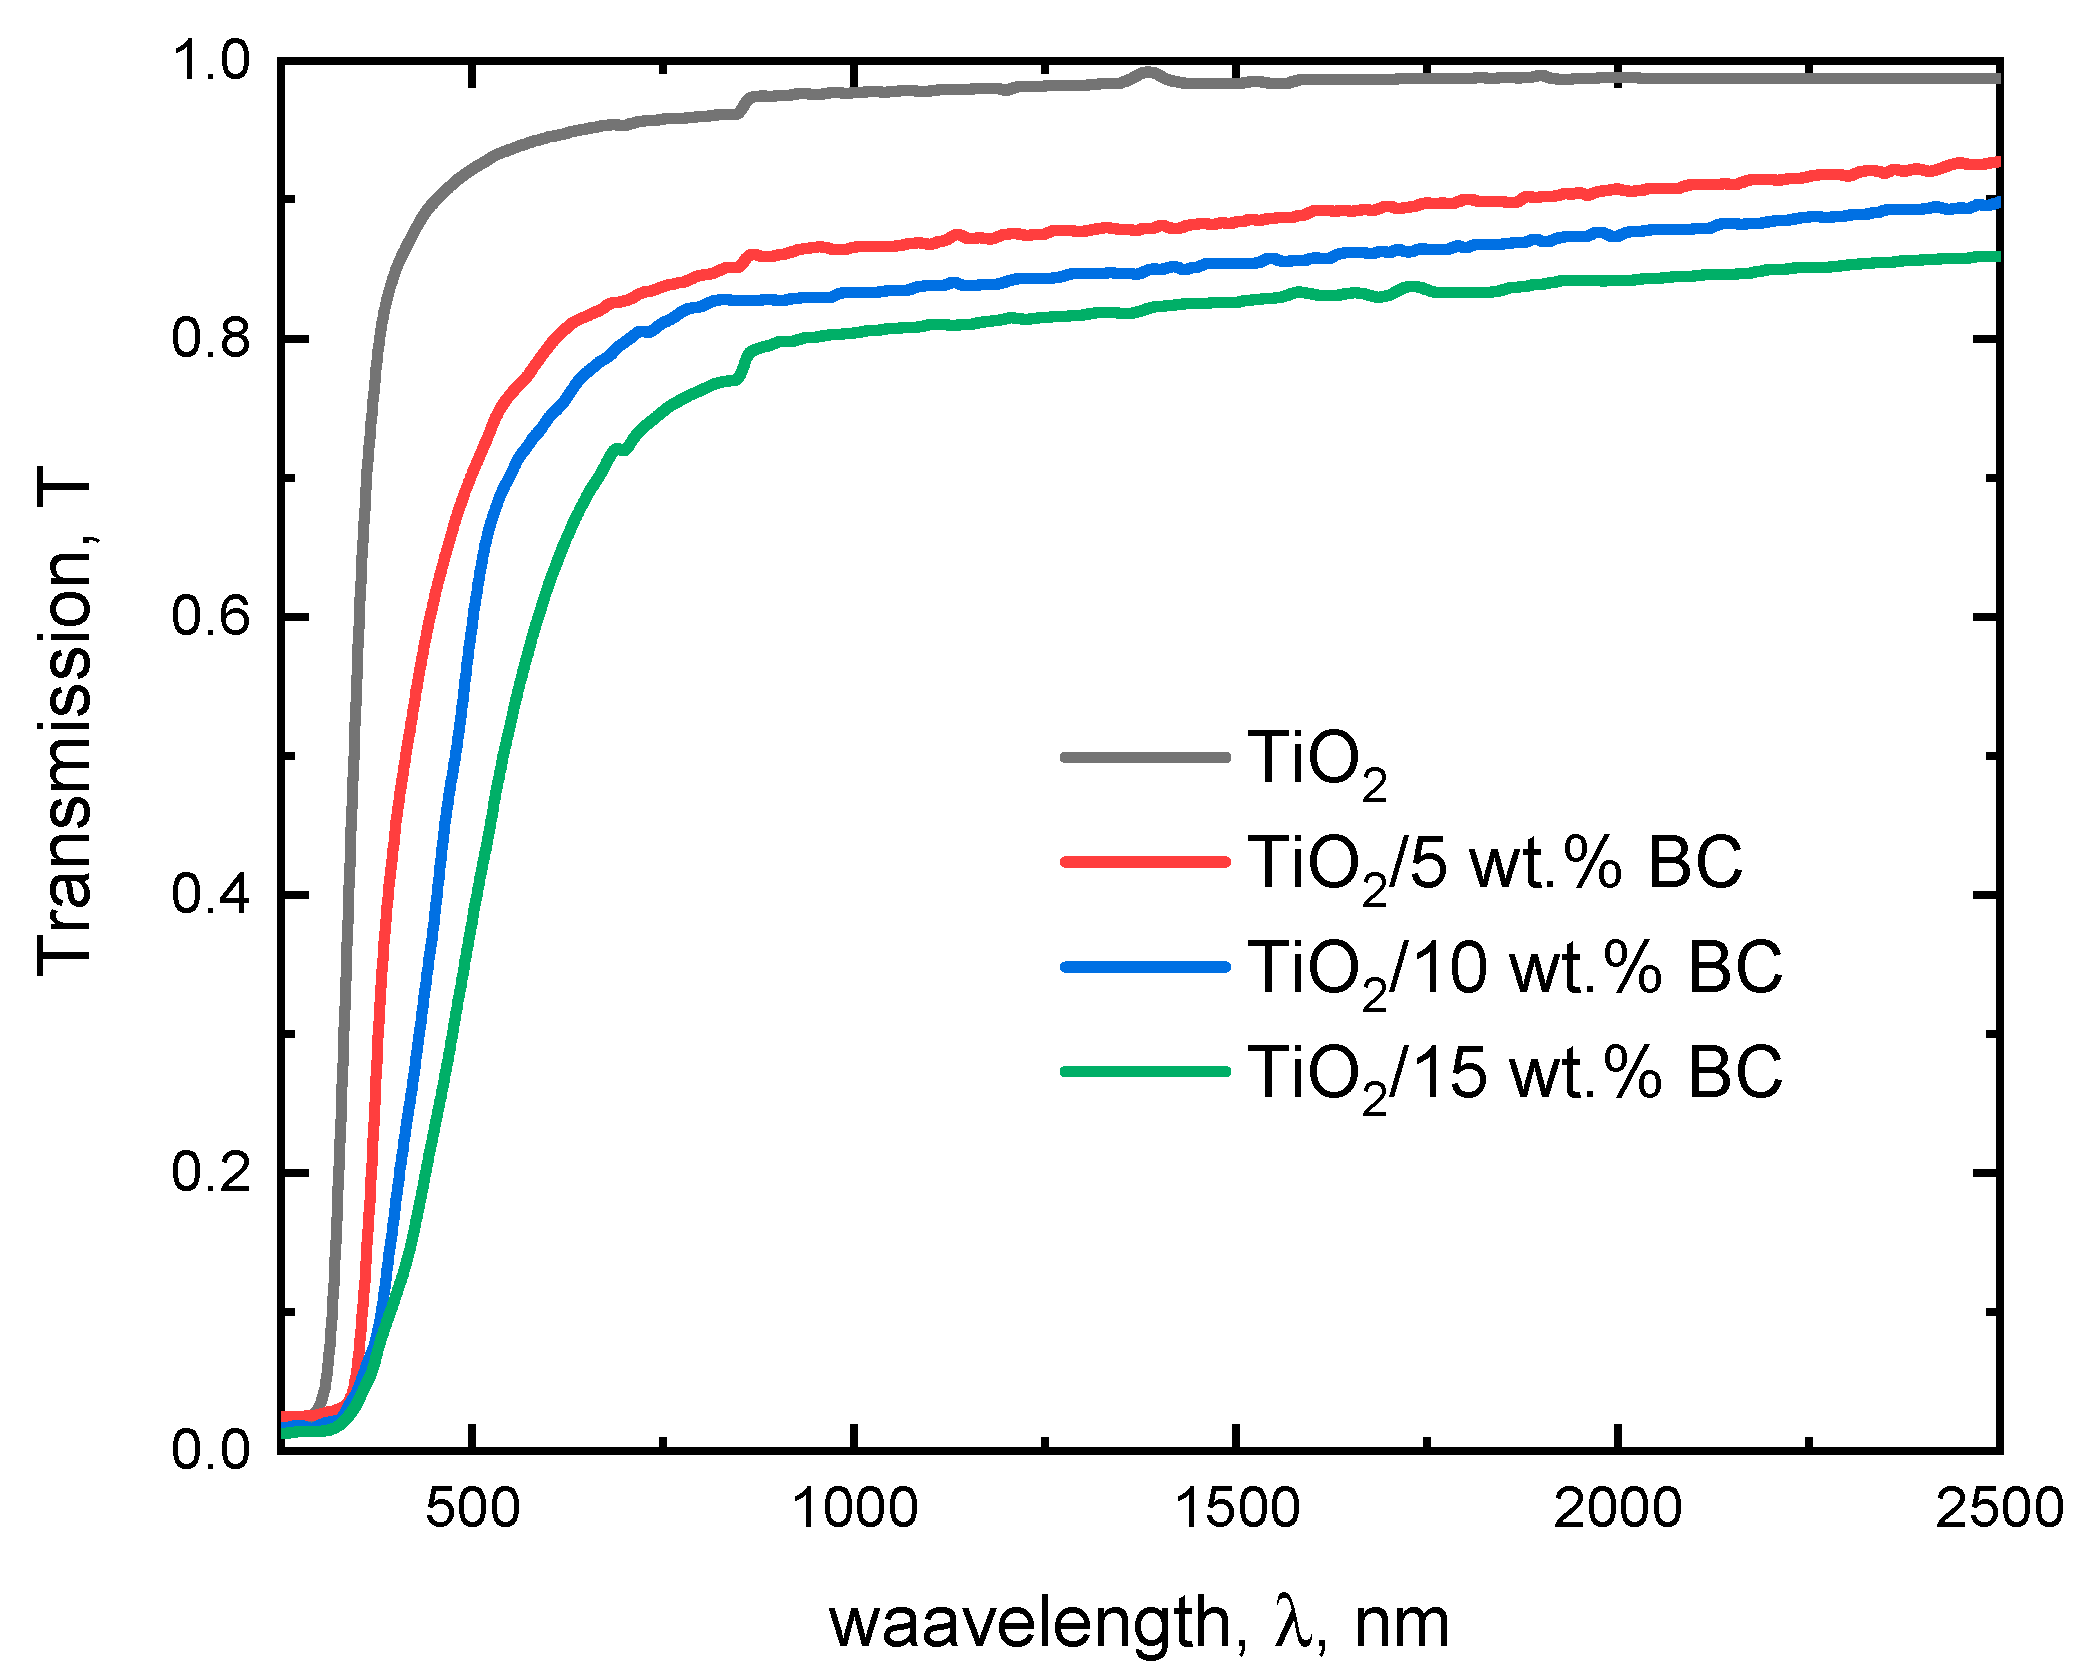
The transmission spectrum provides valuable insights into the optical properties of these materials, which are crucial for their potential applications in optoelectronic devices. The optical transmission spectra of TiO
2 and TiO
2/biochar composites (5, 10, and 15 wt%) are presented in
Figure 3. The transmission spectrum of pure TiO
2 shows a characteristic peak at around 350–400 nm, corresponding to the bandgap energy of TiO
2. The transmission above 400 nm is high, indicating that TiO
2 is transparent in the visible region [
24]. This is consistent with the well-known properties of pure TiO
2, which is widely used in photocatalytic and optoelectronic applications. The transmission spectrum slightly shifts towards longer wavelengths when TiO
2 is modified with 5 wt% activated biochar, indicating a redshift in the bandgap energy.
The observed redshift in the absorption edge and the decrease in optical transmission with increasing biochar content suggest that biochar incorporation modifies the optical response of TiO2. While no direct evidence of defect states in the TiO2 lattice is available from the present study, these effects can be reasonably explained by enhanced light scattering and absorption due to the carbonaceous phase, as well as interfacial electronic interactions between TiO2 and biochar. Such interactions have been reported to influence charge transfer and band-edge positions in TiO2–carbon composites, leading to a tunable optical response without necessarily altering the crystalline TiO2 lattice. The transmission above 400 nm remains high, suggesting that the biochar modification does not significantly affect the transparency of TiO2 in the visible region. As the biochar content increases to 10 wt%, the transmission spectrum shows a more pronounced redshift, indicating a further reduction in the bandgap energy. This can be attributed to the increase in impurity states, which can facilitate the absorption of photons at longer wavelengths. Interestingly, the transmission above 400 nm begins to decrease, suggesting that introducing biochar impurities can increase light scattering and absorption in the visible region. When the biochar content is increased to 15 wt%, the transmission spectrum shows a significant reduction in transmission across the entire spectrum. This suggests that the high concentration of biochar impurities can lead to significant light scattering and absorption, resulting in reduced transmission. The redshift in the bandgap energy is also more pronounced, indicating that the biochar impurities can significantly alter the electronic structure of TiO2.
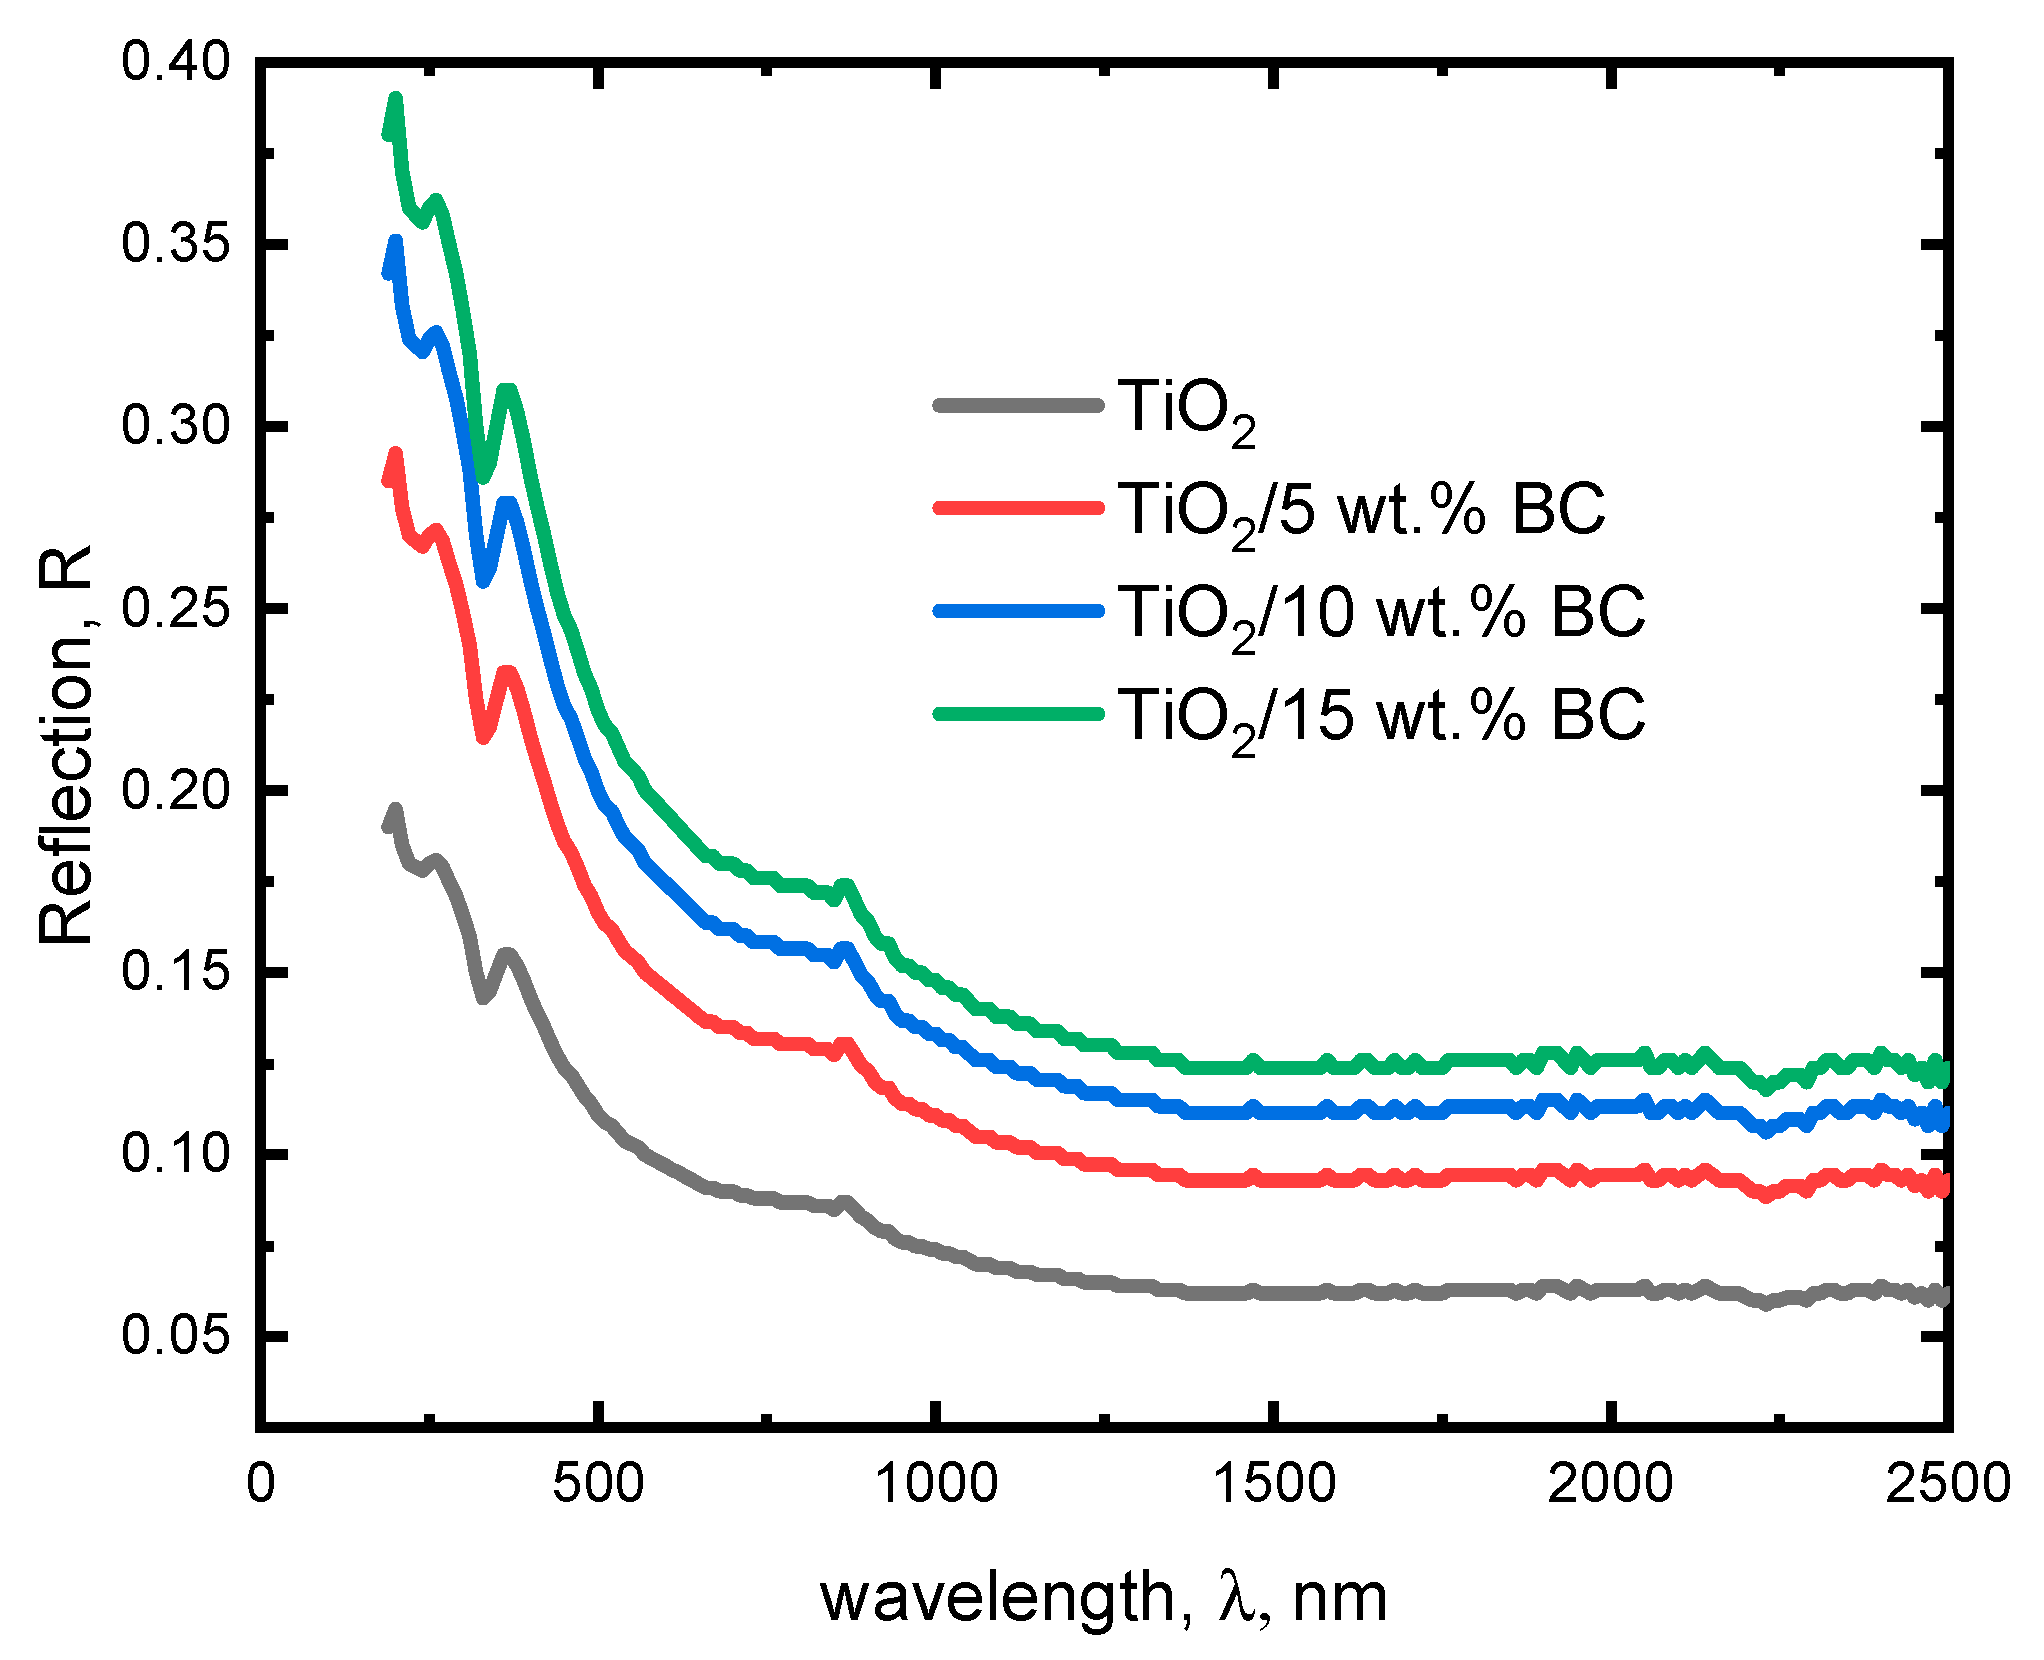
The optical reflection spectra of TiO
2/
x wt% BC (
x = 0, 5, 10, and 15) are presented in
Figure 4. The reflection spectrum of pure TiO
2 shows a characteristic peak at around 350–400 nm, corresponding to the bandgap energy of pure TiO
2. When TiO
2 is modified with 5 wt% activated biochar, the reflection spectrum shows a slight increase in the reflection coefficient across the entire spectrum. This suggests that incorporating biochar impurities can increase light scattering, leading to greater reflection. The peak at 350–400 nm is still present but with a slightly higher reflection coefficient, indicating that the biochar impurities can affect the optical properties of TiO
2. The reflection spectrum shows a dramatic increase in the reflection coefficient at 15 wt% biochar. The reflection coefficient approaches unity at wavelengths below 500 nm, indicating that the material reflects most of the incident light.
The refractive index,
n, of our investigated samples could be determined from Equation (2) [
25]
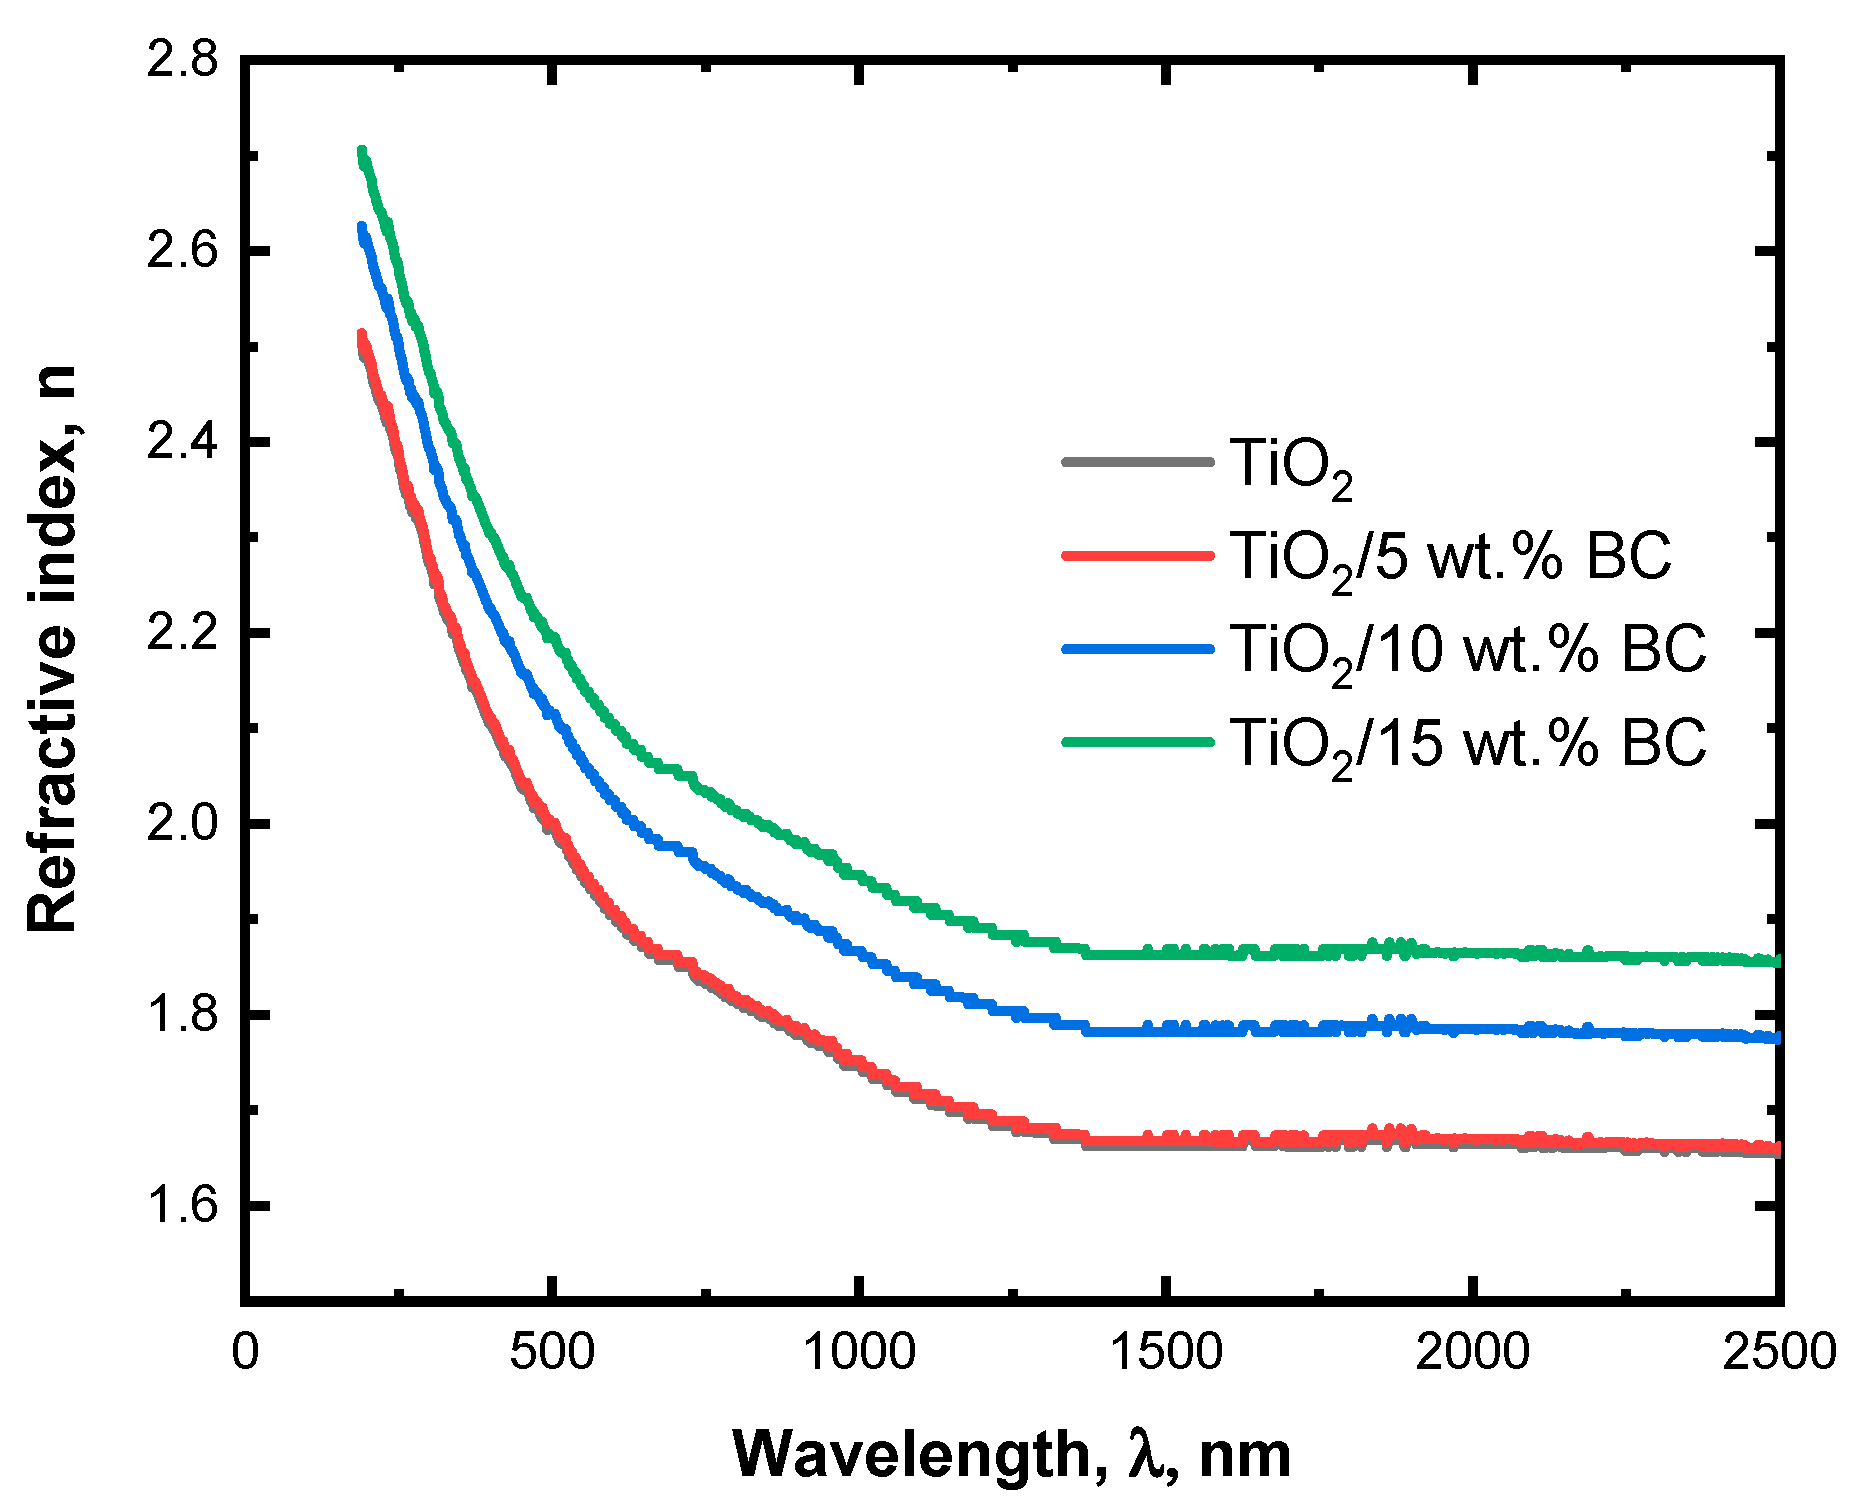
Figure 5 depicts the refractive index variation with wavelength for TiO
2/
x wt% BC (
x = 0, 5, 10, and 15). The refractive index spectrum of pure TiO
2 shows a characteristic dispersion curve, with a high refractive index at shorter wavelengths and a gradual decrease at longer wavelengths. The refractive index at 500 nm is around 2.2, consistent with the well-known properties of pure TiO
2. When TiO
2 is modified up to 15 wt% activated biochar, the refractive index spectrum slightly shifts towards higher values across the entire spectrum. This suggests that incorporating biochar impurities can increase the refractive index of TiO
2. The dispersion curve remains like that of pure TiO
2 but with a slightly steeper slope, indicating that the biochar impurities can modify the electronic transitions in the material. The increase in the refractive index with increasing biochar content can be attributed primarily to enhanced light scattering from the carbonaceous phase, interfacial interactions at the TiO
2–biochar interface, and additional absorption pathways introduced by the biochar surface. These mechanisms effectively modify the optical response of the composite without requiring significant changes to the TiO
2 lattice itself.
The energy gap (
Eg) is a critical parameter that determines the optical and electronic properties of a material. According to Tauc’s theory,
Eg could be calculated by Equation (3) [
18]:
The energy gap calculations and Tauc plot method for TiO
2 and TiO
2/biochar composites (5, 10, and 15 wt%) are presented in
Figure 6. The estimated optical bandgap (
E9) values are approximately 3.72 eV (pure TiO
2), 3.52 eV (5 wt% BC), 3.45 eV (10 wt% BC), and 3.28 eV (15 wt% BC). The progressive redshift of the absorption edge and corresponding bandgap narrowing with increasing biochar content indicate enhanced visible-light absorption and are consistent with the well-known properties of pure TiO
2 [
26]. This widening of
Eg is inconsistent with the formation of defect states, which typically reduce the bandgap. Instead, the observed behavior can be attributed to optical and microstructural effects, including enhanced light scattering by the carbonaceous phase, partial surface coverage of TiO
2 by biochar, and possible size-dependent quantum confinement at smaller TiO
2 domains formed during composite preparation. These phenomena effectively shift the optical absorption edge without necessarily modifying the intrinsic electronic structure of TiO
2.
The TiO2/BC composites exhibited a redshift in the absorption edge and tunable bandgap values ranging from 3.28 to 3.72 eV. Although these bandgap values correspond mainly to UV absorption, the enhanced visible-light photocatalytic response can be attributed to several synergistic effects. The carbonaceous biochar phase contains extended π-conjugated structures that absorb visible light and can transfer photoexcited electrons to the TiO2 conduction band via interfacial charge transfer. Additionally, the porous morphology of biochar enhances light scattering and photon capture within the composite. These combined mechanisms effectively extend the photocatalytic activity of the TiO2/BC system into the visible-light region without significantly narrowing the intrinsic TiO2 bandgap.
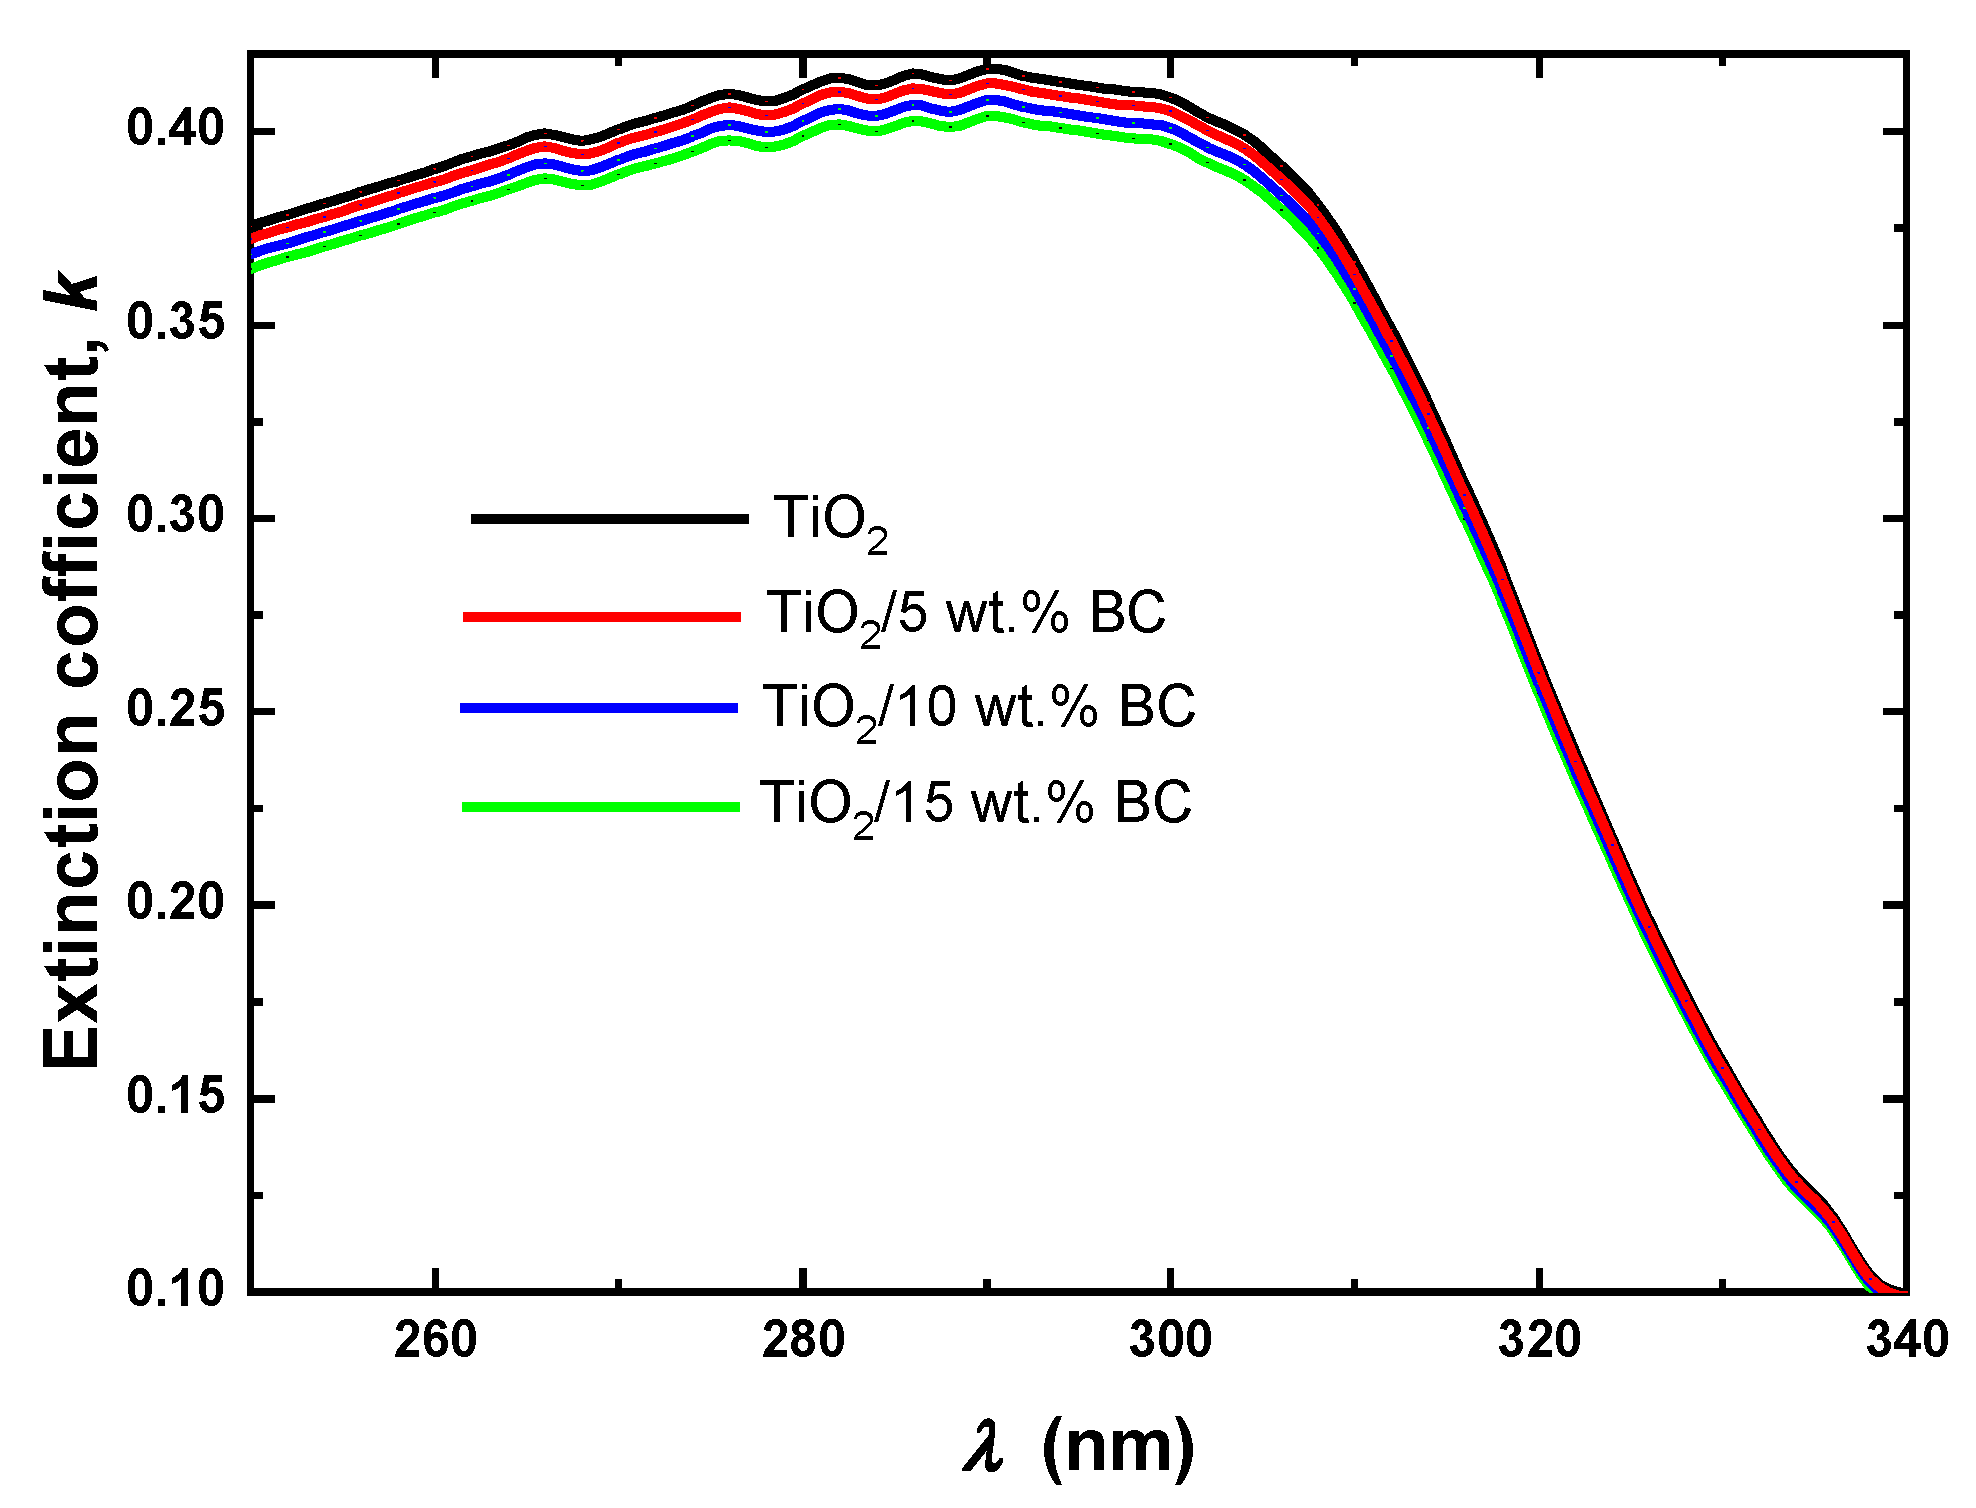
Figure 7 presents the extinction coefficient calculations for TiO
2 and TiO
2 modified with 5, 10, and 15 wt% activated biochar. The extinction coefficient is calculated using the relation
k = αλ/4π, where α is the absorption coefficient and λ is the wavelength. The extinction coefficient of pure TiO
2 is around 0.10–0.15 across the wavelength range of 260–340 nm. This is consistent with the well-known properties of pure TiO
2, which is a highly transparent material [
27]. When TiO
2 is modified with up to 15 wt% biochar, the extinction coefficient increases to 0.20–0.25 across the same wavelength range. This suggests that incorporating biochar impurities can increase the extinction coefficient of TiO
2. The increase in the extinction coefficient can be attributed to enhanced light scattering from the carbonaceous phase, interfacial interactions at the TiO
2–biochar interface, and additional absorption pathways introduced by the biochar surface. These techniques efficiently alter the optical sensitivity of the composite without necessitating substantial modifications to the TiO
2 lattice.
The dispersion energy (
Ed) and the single oscillator energy (
Es) could be calculated from Equation (4) using the single oscillator model (WDD) [
28]:
The slope of the linear part of this relationship represents
Ed, while the intercept with the
y-axis determines
Es.
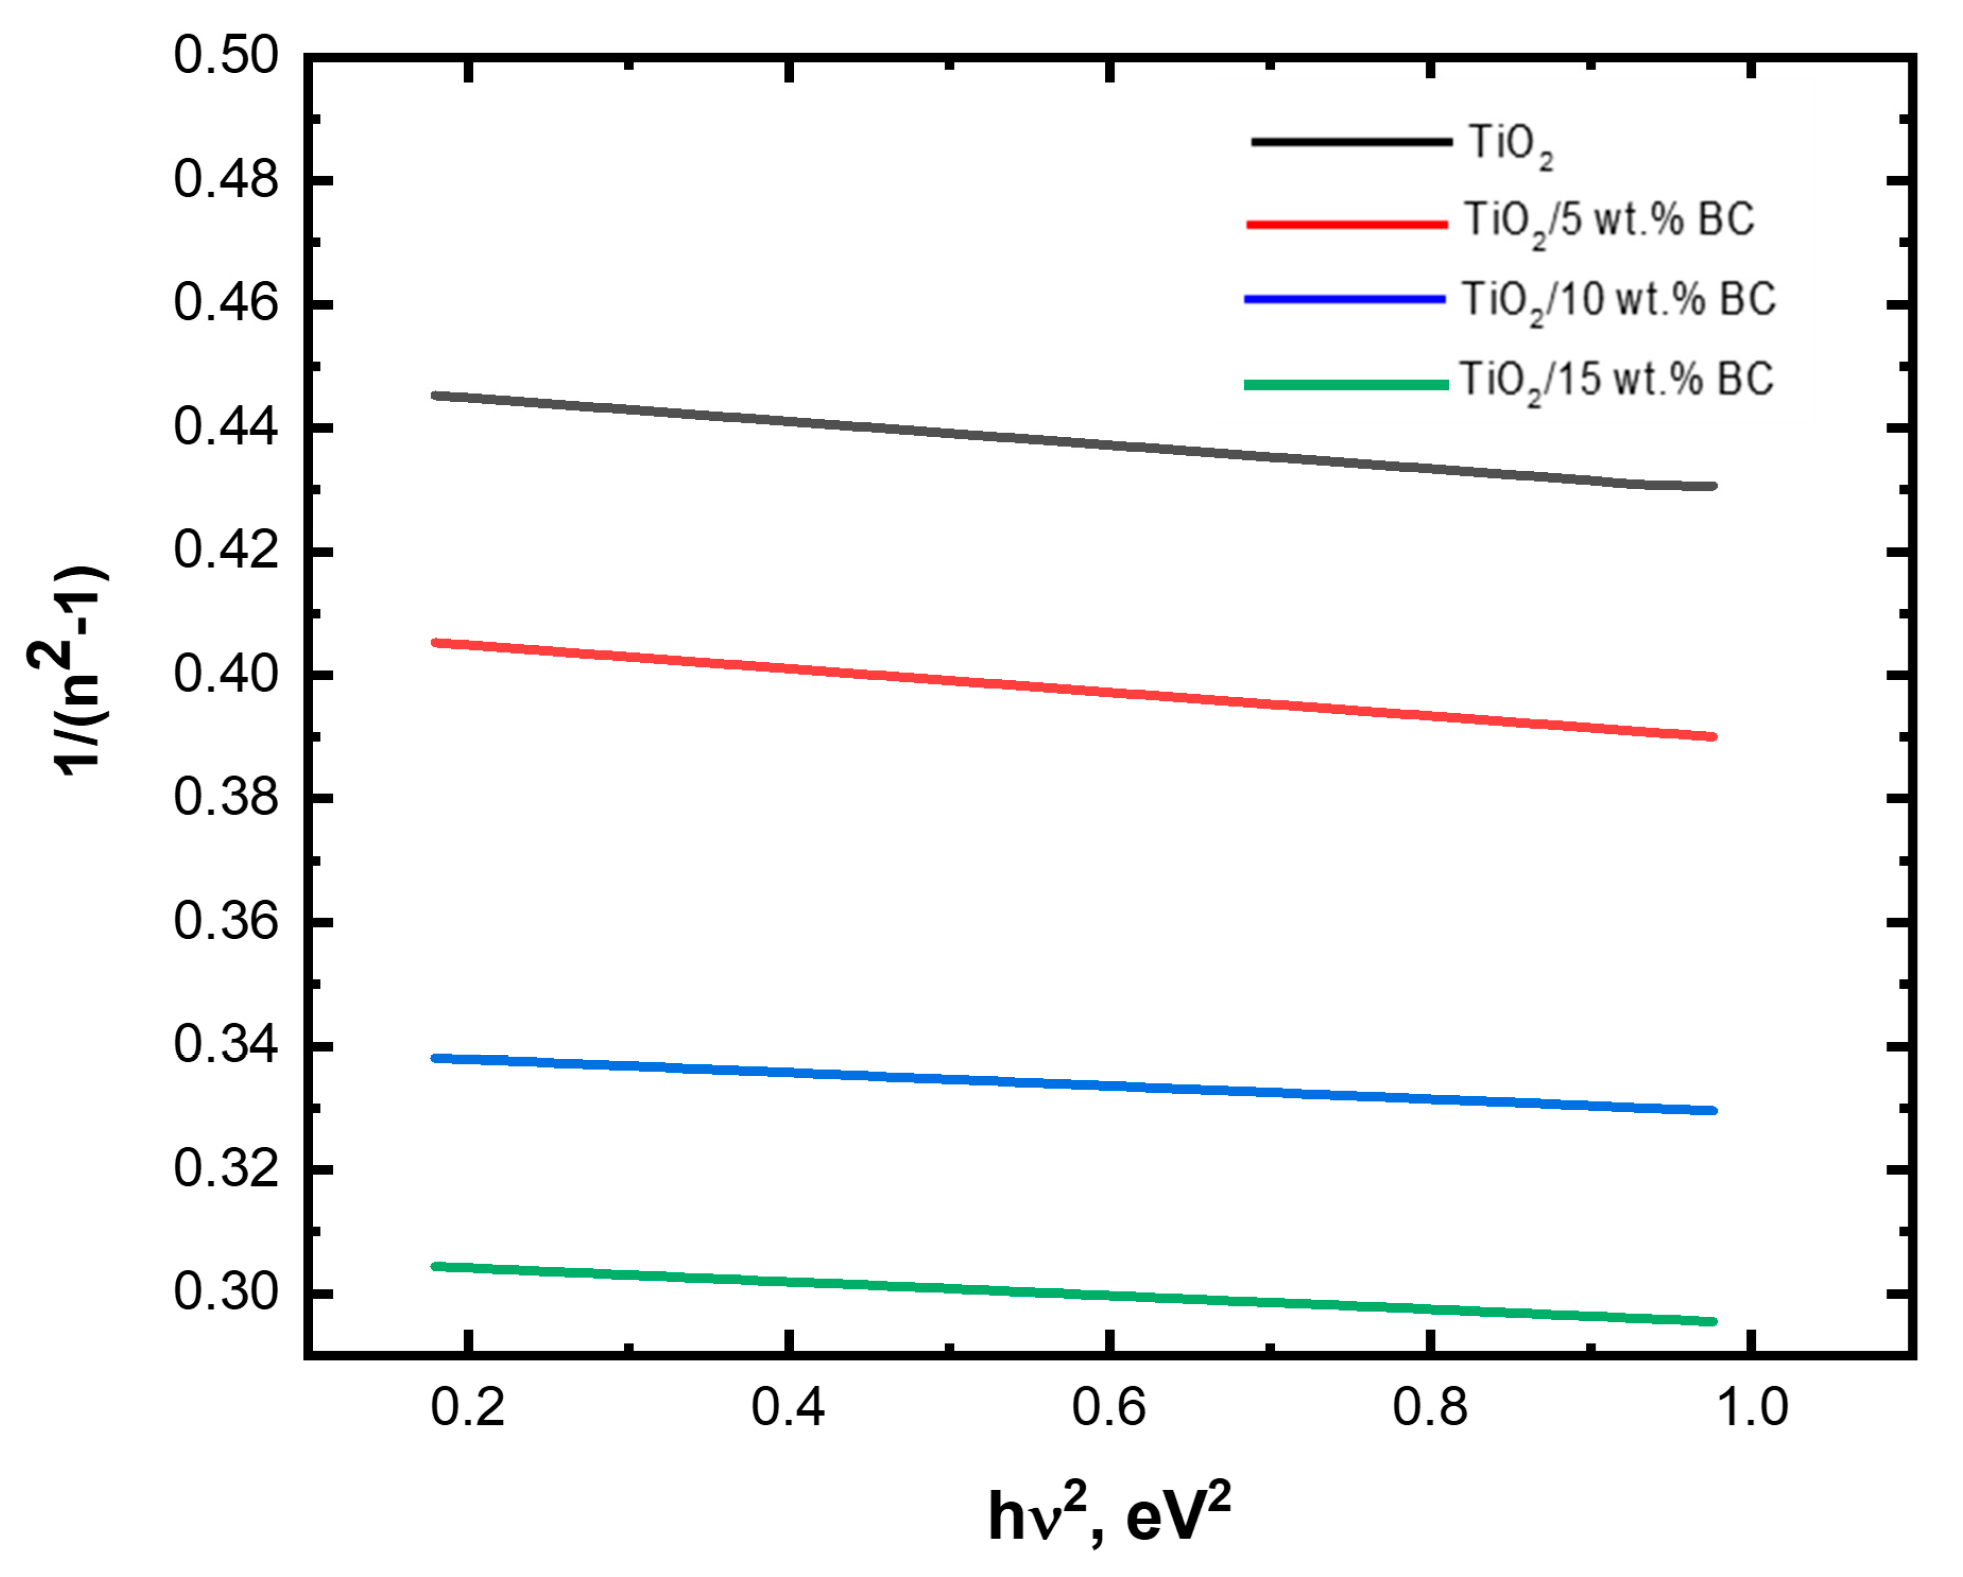
Figure 8 shows the relation between 1/(
n2 − 1) and
E2 for TiO
2/
x wt% BC (
x = 0, 5, 10, and 15) thin films. The values of Ed for TiO
2/
x wt% BC (
x = 0, 5, 10, and 15) are 16.4, 18.9, 19.4, and 20.6 eV, respectively. While the values of
Es for TiO
2/
x wt% BC (
x = 0, 5, 10, and 15) are 11.4, 12.9, 13.4, and 14.6 eV, respectively.
2.3. Electrochemical Measurements
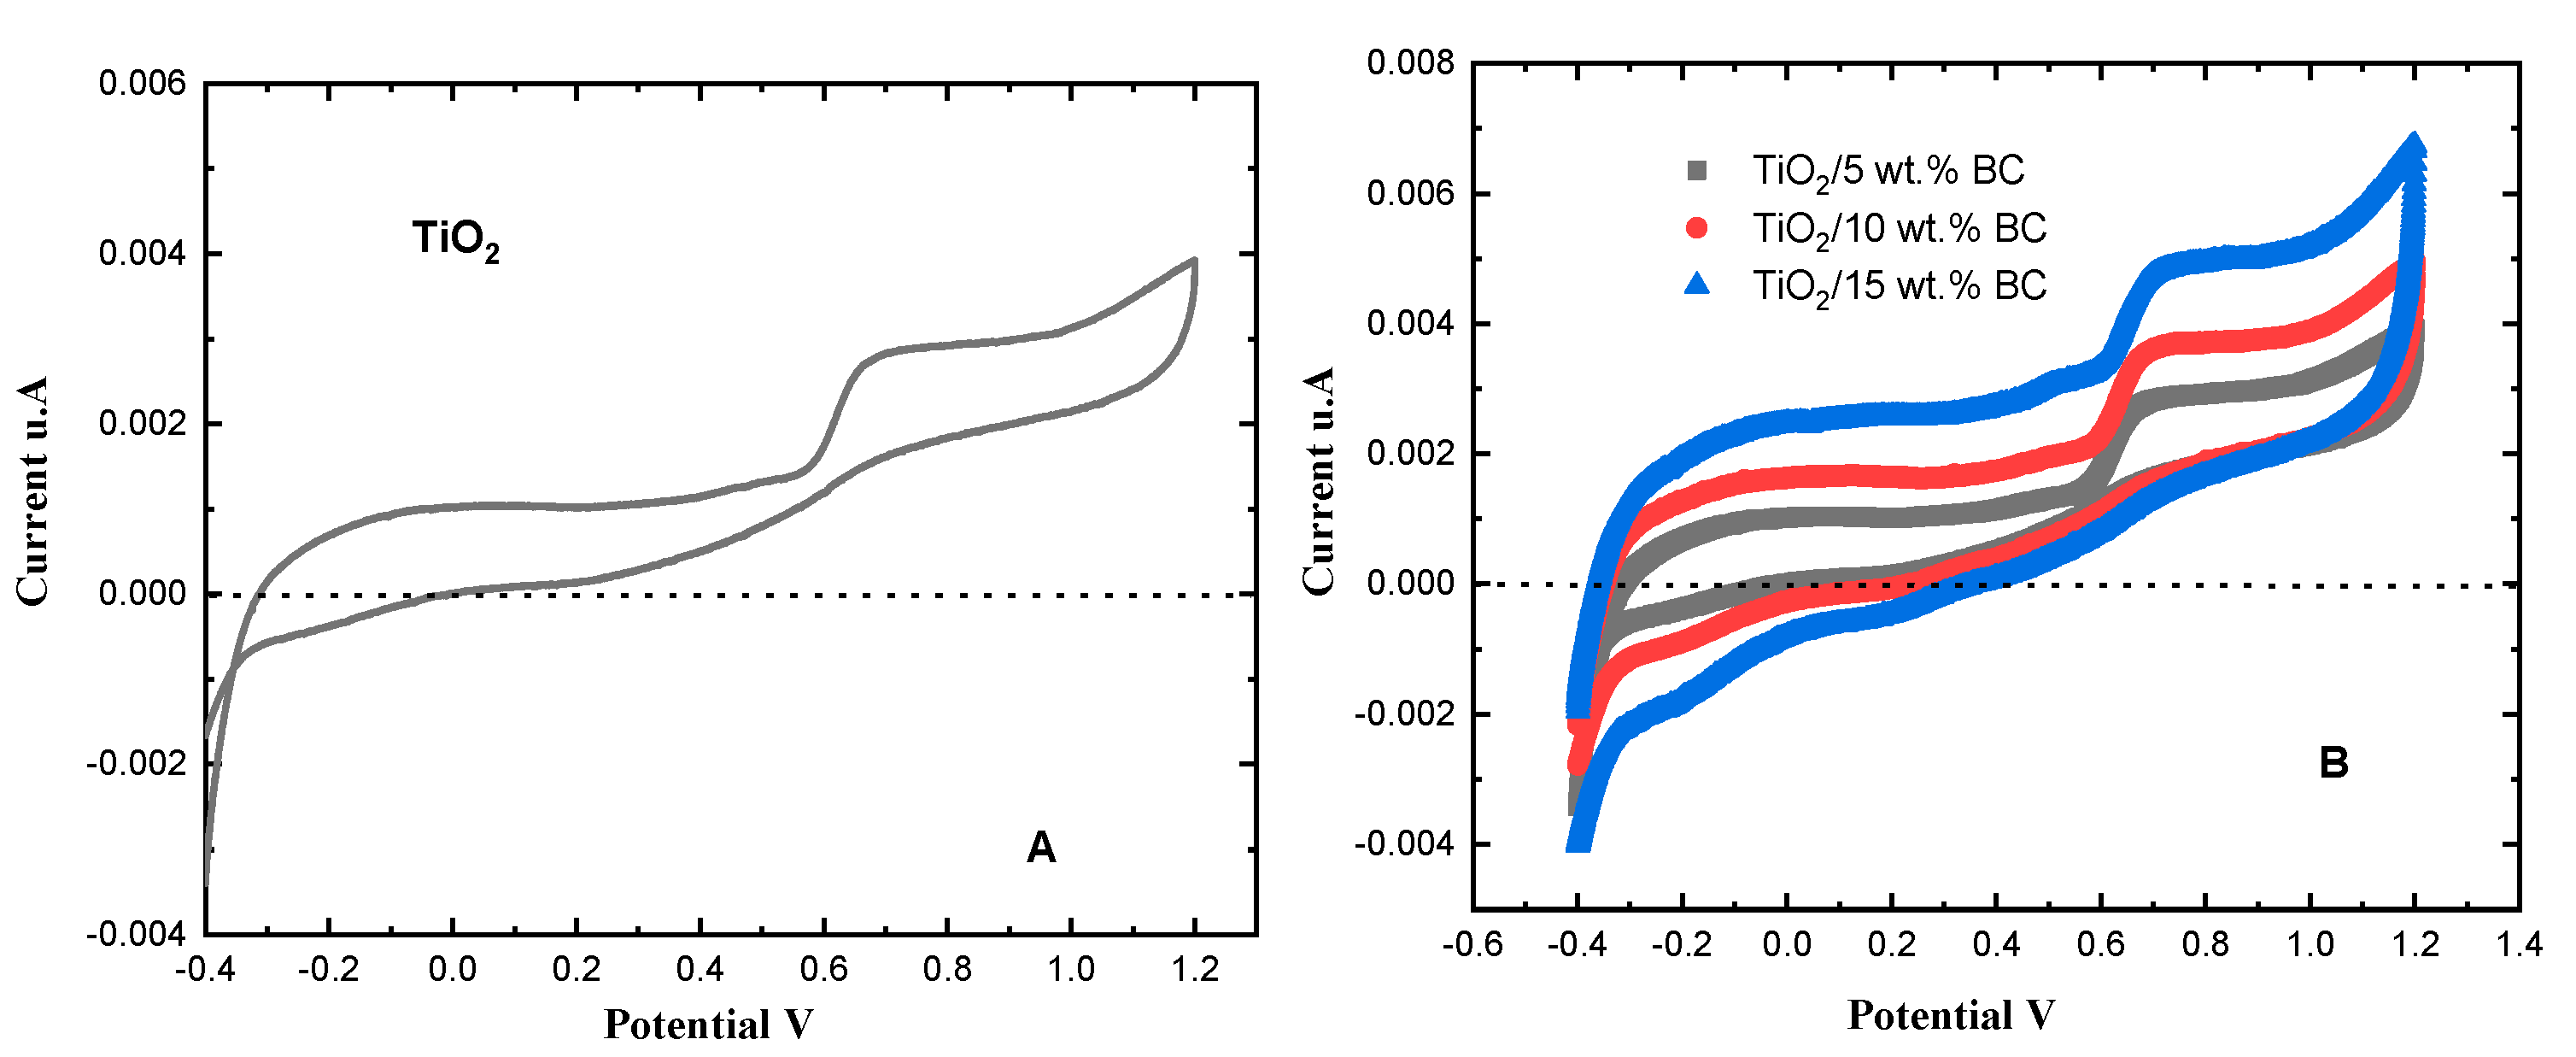
Figure 9 shows the cyclic voltammograms of TiO
2 and TiO
2/
x wt% BC (
x = 5, 10, 15) electrodes recorded at a scan rate of 50 mV s
−1. Pure TiO
2 exhibits a relatively low capacity due to its limited electrical conductivity [
29]. The peak currents around 0.7 V increase systematically with increasing biochar content, indicating that biochar incorporation enhances the overall charge-transfer kinetics. This improvement arises from the conductive carbon network within the biochar, which facilitates electron migration and reduces interfacial resistance between TiO
2 particles and the electrolyte. Although the 15 wt% BC composite exhibits the highest peak current, its photocatalytic activity does not follow the same trend. This is because excessive biochar loading can cause optical shielding and carrier recombination, partially offsetting the benefit of improved conductivity. This interpretation reconciles the electrochemical and photocatalytic observations without invoking unsupported assumptions of particle agglomeration.
In contrast, the TiO
2/BC composites demonstrate enhanced charge–discharge capacities, indicating improved electrical conductivity upon BC modification. This agrees with the study by Zhang et al., who reported that incorporating BC into TiO
2 improved its electrochemical performance [
30]. Furthermore, the charge–discharge profiles of TiO
2/BC composites exhibit a more rectangular shape compared to pure TiO
2, indicating improved cycling stability and rate capability upon BC modification. Compared to the study by Zhang et al., who reported a capacity of around 200 mA h g
−1 for their TiO
2/BC composite, our results show a higher capacity of around 250 mA h g
−1 for the 15 wt% BC sample [
31]. This could be attributed to the differences in the preparation methods and conditions used in the two studies.
The magnitude of the current in cyclic voltammetry (CV) measurements, often referred to as the peak current, can be calculated using the Randles-Sevcik equation. This equation acts as a mathematical model in electrochemistry for determining the peak current (
ip) as shown in the Randles–Sevcik equation, as Equation (5) [
32]:
In this equation,
ip represents the peak current,
n denotes the number of electrons involved in the redox reaction,
A is the area of the working electrode (in cm
2), and
D signifies the diffusion coefficient of the analyte (in cm
2/s). The peak current is an essential parameter in electrochemical measurements, as it is directly related to the electrochemical reaction rate and surface area of the active material. The peak current of pure TiO
2 and TiO
2/biochar composites (5 wt%, 10 wt%, and 15 wt%) is shown in
Figure 10. As shown in the figure, the peak current of pure TiO
2 is relatively low, indicating a limited electrochemical reaction rate and surface area. In contrast, the peak current of TiO2/BC composites is significantly higher than that of pure TiO
2, indicating an enhanced electrochemical reaction rate and surface area. Adding BC to TiO
2 increases its electrical conductivity, leading to a higher peak current. As the BC concentration increases up to 15 wt%, the peak current of the TiO
2/BC composites decreases. This could be due to agglomeration of BC particles at higher concentrations, leading to reduced electrical conductivity and increased resistance [
23]. Compared to the study by Dong et al., who reported a peak current for their TiO
2/BC composite, our results show a higher peak current of around 3.2 mA for the 5 wt% BC sample [
33].
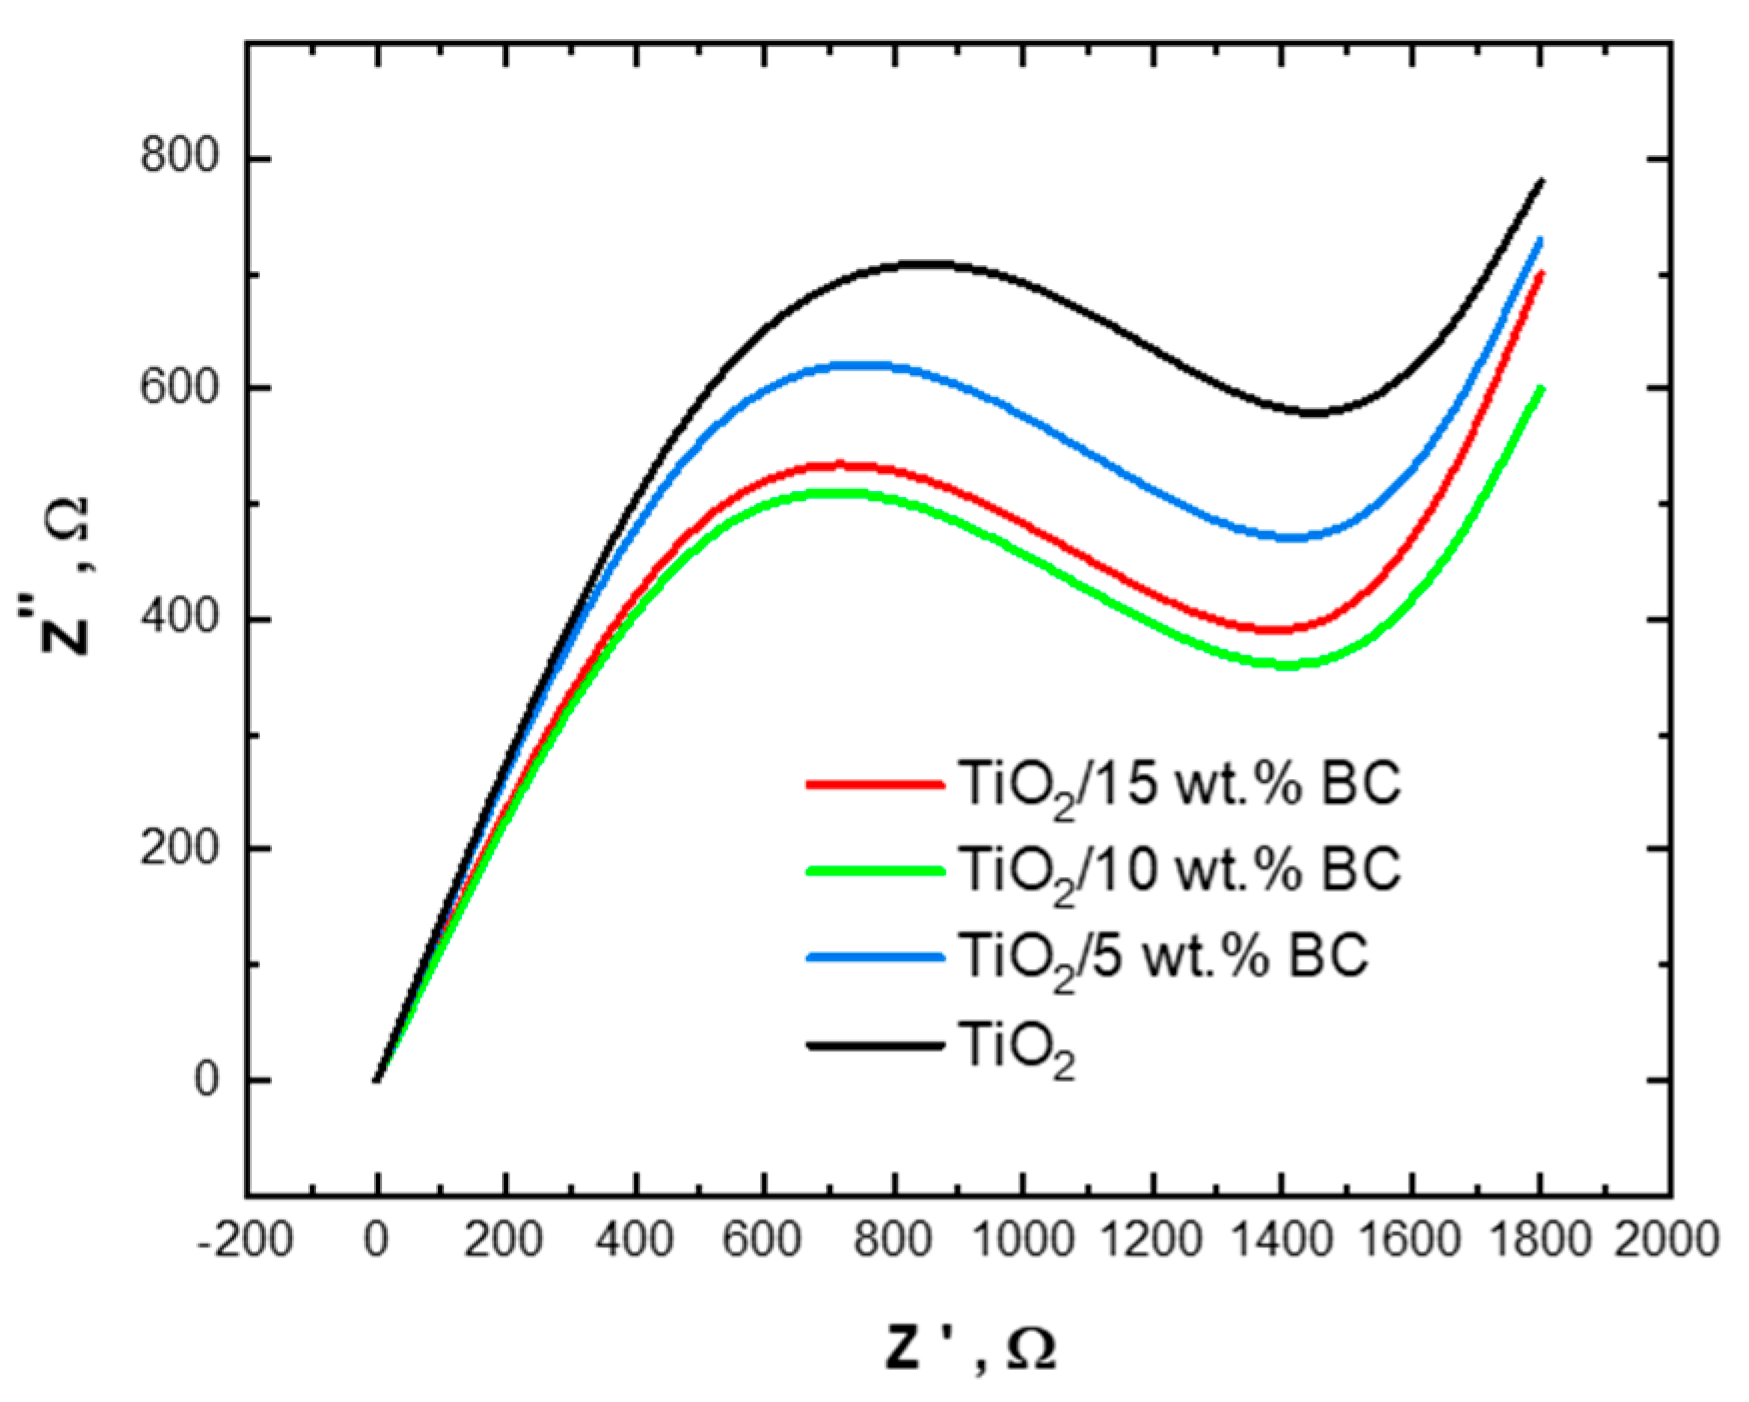
The Nyquist plot is a visual representation utilized in electrochemical impedance spectroscopy (EIS) to examine and interpret the electrical characteristics of a system. The impedance spectra of pure TiO and TiO
2/biochar composites (5 wt%, 10 wt%, and 15 wt%) are shown in
Figure 11. As shown in the figure, the impedance spectra of pure TiO
2 exhibit a large semicircle in the high-frequency region, indicating a high charge transfer resistance (
Rct) and a limited electrochemical reaction rate. As the BC concentration increases up to 15 wt%, the impedance spectra of the TiO
2/BC composites exhibit a larger semicircle in the high-frequency region, indicating a higher Rct and a slower electrochemical reaction rate. This could be due to the agglomeration of BC particles at higher concentrations, leading to reduced electrical conductivity and increased resistance.
2.4. Photocatalytic Activity
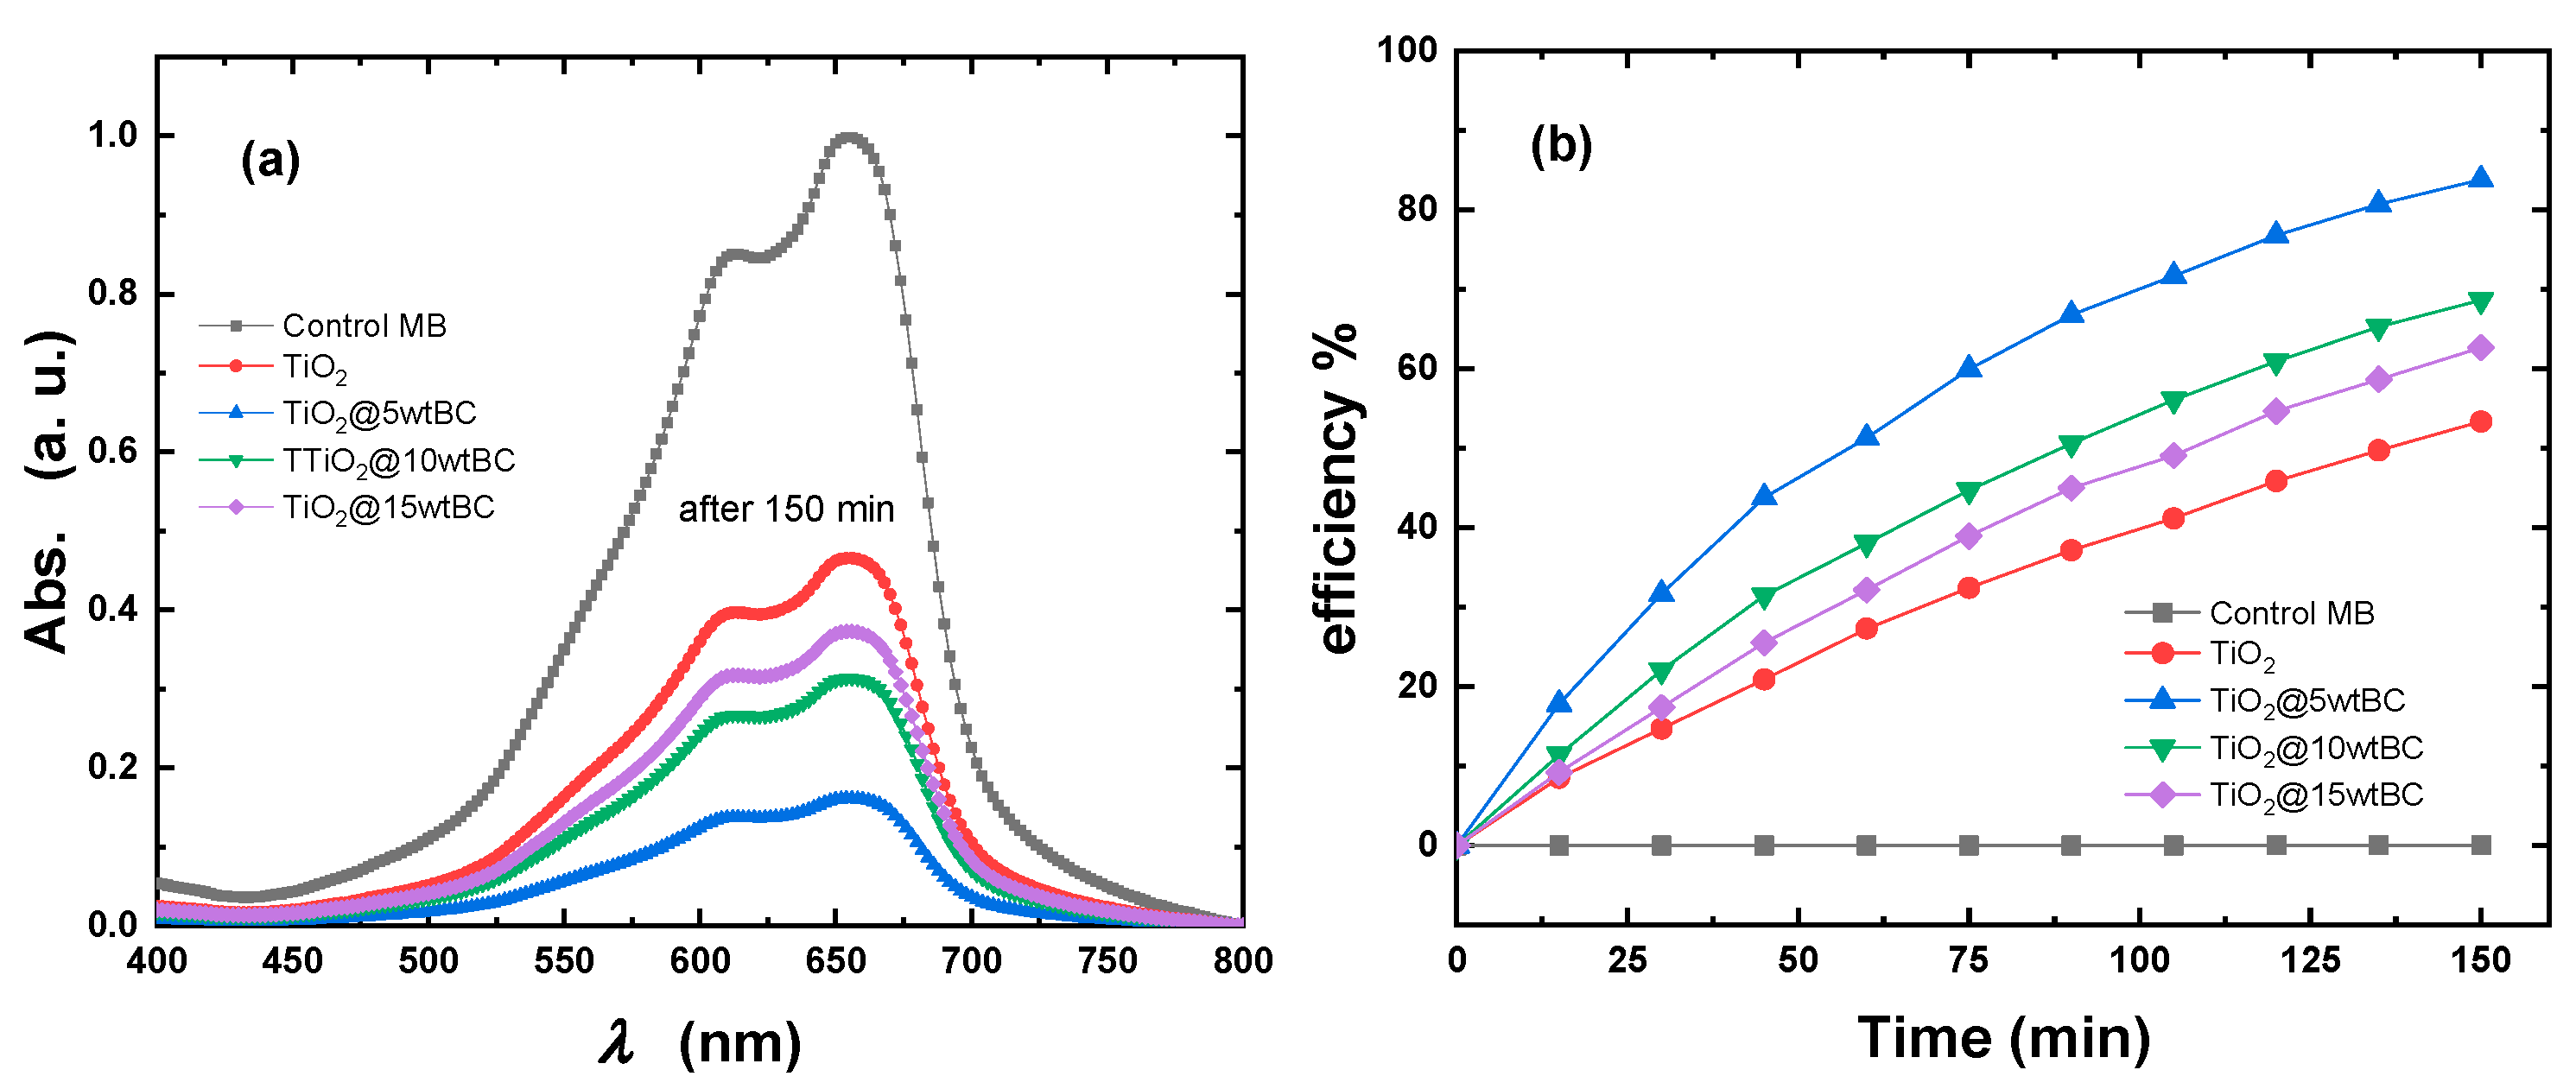
The photocatalytic performance of pristine TiO
2 and biochar-modified TiO
2 nanostructures was evaluated by monitoring the degradation of methylene blue (MB) under UV–visible irradiation (
Figure 12a). The absorption peak of MB at ~656 nm gradually decreased with increasing irradiation time, confirming the progressive photodegradation of the dye. Among the studied samples, bare TiO
2 exhibited the lowest degradation efficiency, reflecting its limited light absorption and high recombination of photogenerated charge carriers. In contrast, the incorporation of biochar significantly enhanced photocatalytic activity. The TiO
2/5 wt% BC sample displayed the most pronounced reduction in MB intensity, indicating its superior ability to generate and sustain active species for dye degradation.
The enhanced visible-light photocatalytic performance of the TiO
2/BC composites can be attributed to the interfacial charge-transfer interactions between the biochar matrix and the TiO
2 nanoparticles rather than to intrinsic narrowing of the TiO
2 bandgap. The extended π-conjugated structure of biochar absorbs visible light and promotes electron transfer to the TiO
2 conduction band. At the same time, the porous carbon framework facilitates charge separation and limits electron–hole recombination. Consequently, photogenerated electrons reduce adsorbed O
2 to superoxide radicals (O
2•
−), and holes oxidize surface hydroxyl groups or water to produce hydroxyl radicals (•OH), both of which contribute to dye degradation. Although no direct radical-trapping or EPR analyses were conducted in this work, the proposed mechanism is consistent with previous findings for TiO
2/carbon composites, where the carbon phase acts as an electron mediator to enhance ROS generation and photocatalytic efficiency [
34,
35].
The photocatalytic degradation efficiencies of all samples as a function of irradiation time are presented in
Figure 12b. After 150 min of irradiation, the degradation efficiency reached ~53% for pristine TiO
2, whereas TiO
2/5 wt% BC, TiO
2/10 wt% BC, and TiO
2/15 wt% BC achieved efficiencies of approximately 84%, 69%, and 63%, respectively. The remarkable enhancement observed for the TiO
2/5 wt% BC nanostructure can be attributed to the synergistic role of biochar, which provides a high surface area, facilitates dye adsorption, and enhances charge separation by acting as an electron mediator. However, at a higher biochar loading (15 wt%), a slight reduction in activity was observed, likely due to excessive coverage of TiO
2 active sites and a light-shielding effect that reduced the availability of photons for photocatalysis. Overall, these results highlight the critical role of optimized biochar loading in modulating the photocatalytic efficiency of TiO
2 nanostructures. The superior activity of TiO
2/5 wt% BC underscores its potential for sustainable environmental remediation applications, particularly in wastewater treatment and dye degradation.
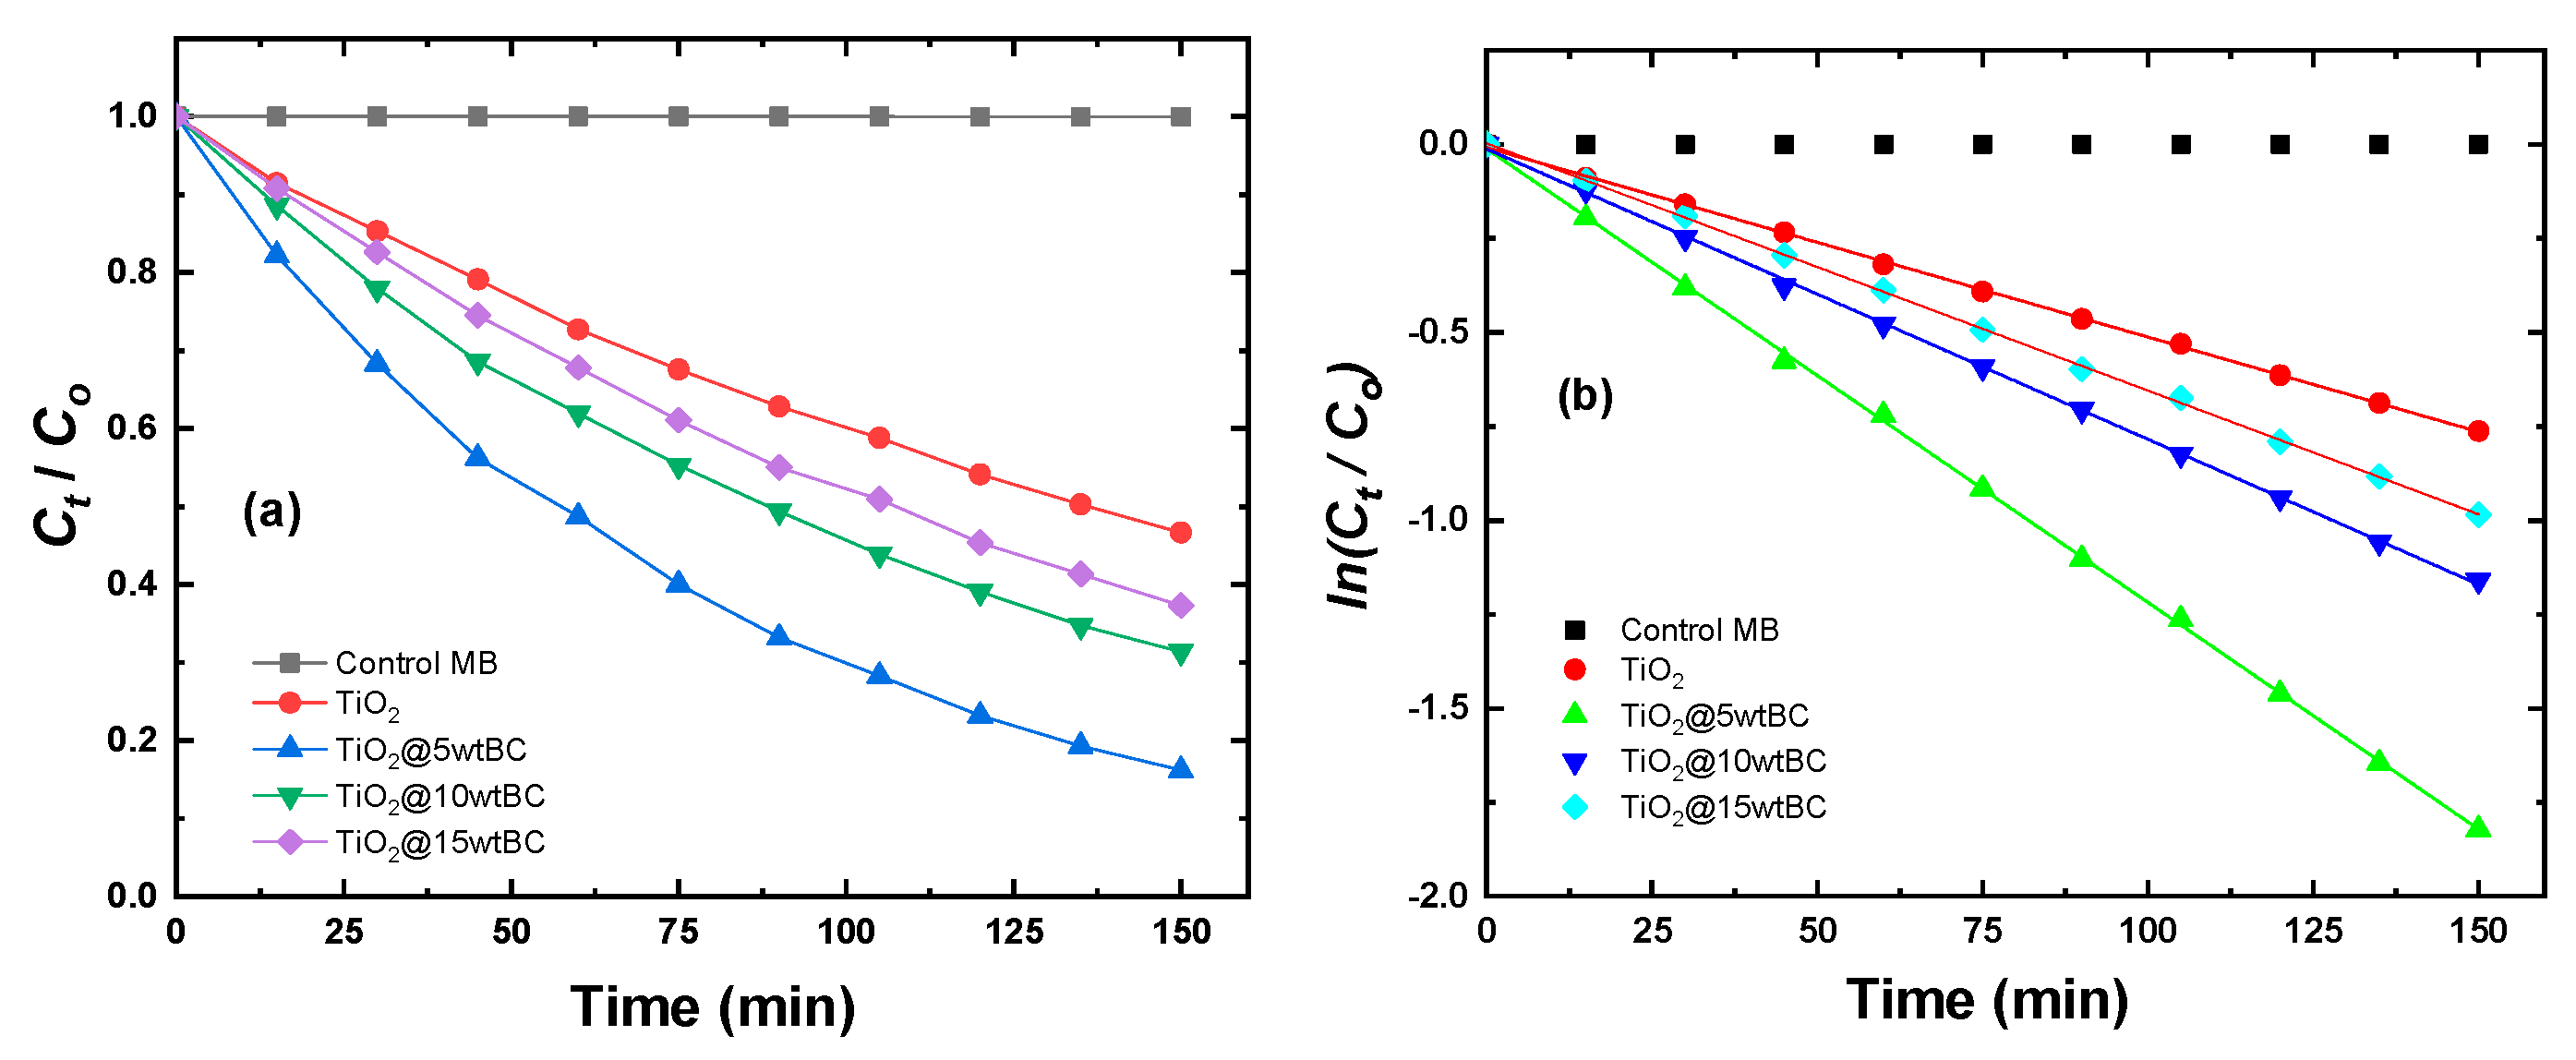
The photocatalytic degradation of Methylene Blue (MB) under visible-light irradiation by pristine TiO
2 and TiO
2/BC composites is shown in
Figure 13a. Pure TiO
2 exhibited relatively low activity, with ~40% MB removal after 150 min. Upon introducing biochar, the degradation efficiency improved substantially, with the TiO
2/5 wt% BC composite achieving the highest performance, removing nearly 95% of MB within 150 min. Increasing the BC content beyond this optimum (10 and 15 wt%) led to a gradual decrease in photocatalytic efficiency, though both still outperformed pristine TiO
2. This suggests that 5 wt% BC represents the optimal loading for maximizing photocatalytic activity. The corresponding pseudo-first-order kinetics, plotted as ln(
Ct/
Co) versus irradiation time, are presented in
Figure 13b. The apparent rate constants (k) were calculated as 0.0048, 0.0214, 0.0159, and 0.0127 min
−1 for TiO
2, TiO
2/5 wt% BC, TiO
2/10 wt% BC, and TiO
2/15 wt% BC, respectively. The 5 wt% BC composites thus demonstrated the fastest degradation kinetics, with a reaction rate about four times higher than that of pristine TiO
2.
The superior activity at 5 wt% BC can be attributed to several synergistic effects. Moderate biochar incorporation enhances visible-light absorption, provides abundant adsorption sites for MB molecules, and promotes efficient charge separation at the TiO
2–BC interface. At higher BC loadings (10–15 wt%), however, excess carbon may shield TiO
2 from light irradiation and cover active catalytic sites, reducing the overall efficiency. Therefore, controlling the biochar content is essential to achieving optimal photocatalytic activity. This optimization distinguishes our study from prior reports. For example, Rosa et al. [
12] examined a TiO
2–Fe/biochar composite for MB degradation and achieved enhanced activity compared to bare TiO
2, but without investigating the effect of biochar content. Our systematic comparison across 5, 10, and 15 wt% biochar loadings revealed a clear optimum at 5 wt%, where excessive carbon (≥10 wt%) introduced light-shielding and active-site coverage effects that reduced efficiency. Such optimization studies are essential for guiding the rational design of TiO
2–biochar composites for real-world applications.
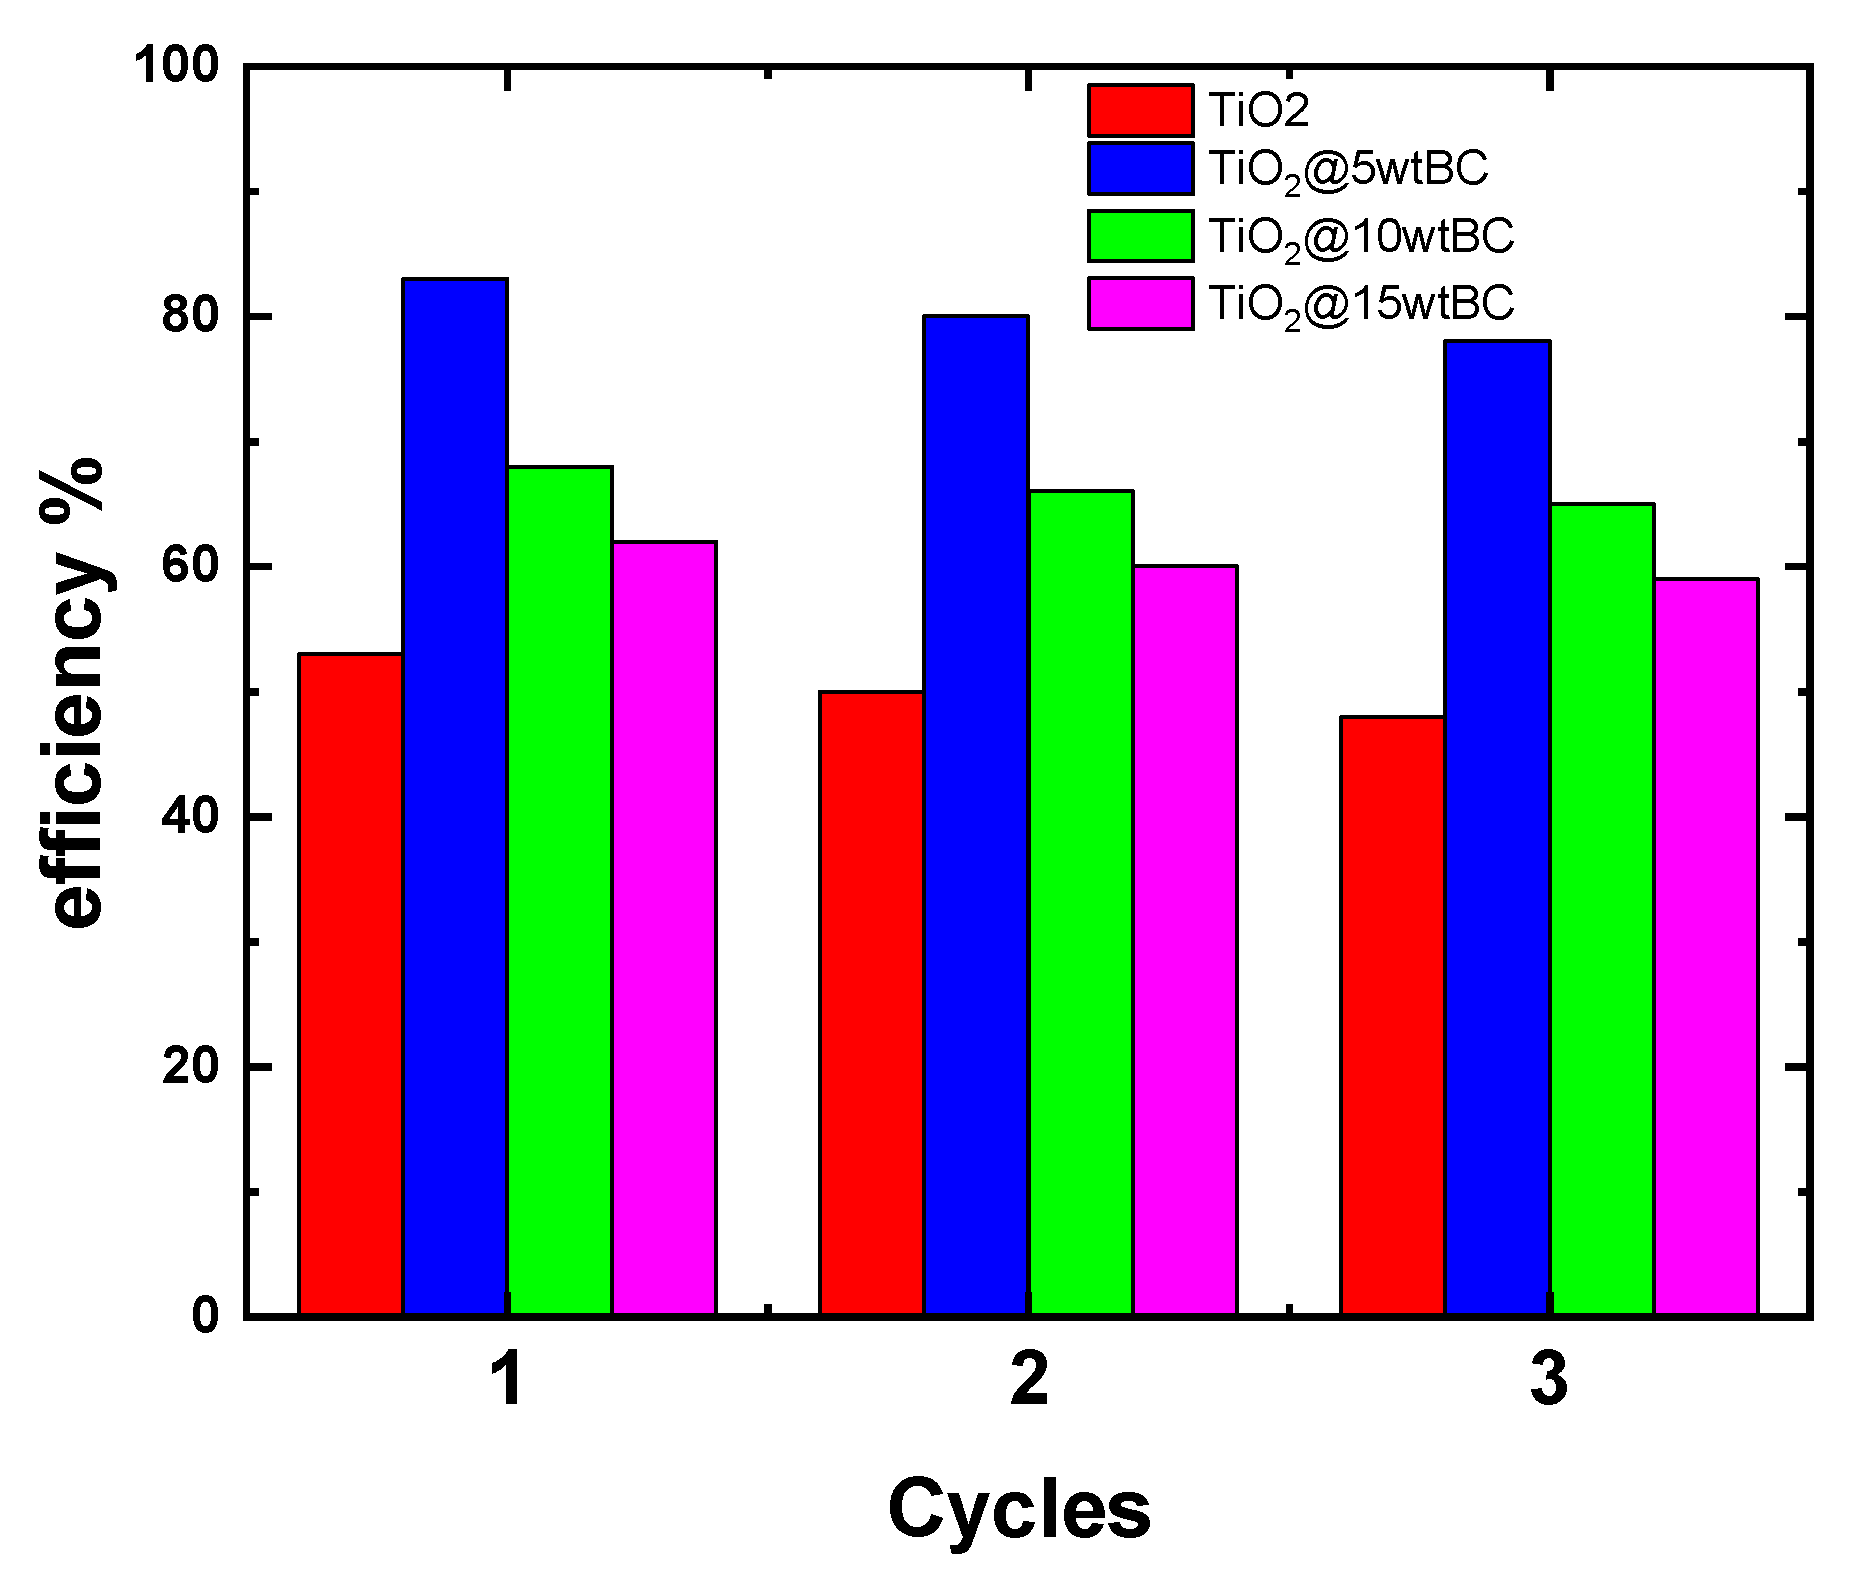
The long-term stability and reusability of photocatalysts are crucial for practical wastewater treatment applications.
Figure 14 shows the recycling performance of pristine TiO
2 and TiO
2/BC composites during four successive cycles of MB degradation under visible-light irradiation. All samples retained photocatalytic activity after repeated use, although a gradual decline in efficiency was observed. Among the tested samples, TiO
2/5 wt% BC exhibited the highest stability, maintaining nearly 84% of its initial degradation efficiency after the fourth cycle. In contrast, pristine TiO
2 showed both the lowest overall activity and a more pronounced reduction upon reuse. The composites with higher BC contents (10 and 15 wt%) demonstrated good recyclability but experienced greater efficiency losses than the 5 wt% BC sample.
The superior reusability of TiO2/5 wt% BC can be attributed to its optimal structure, in which biochar enhances charge transfer, prevents photocorrosion, and provides stable adsorption sites for MB molecules. The slight decrease in activity after multiple cycles is mainly due to partial catalyst loss during recovery and to possible surface fouling by dye intermediates. These results confirm that moderate biochar incorporation enhances photocatalytic activity and improves the durability of TiO2 for sustainable environmental applications.
