Article

Rendered-Protein Hydrolysates as a Low-Cost Nitrogen Source for the Fungal Biotransformation of 5-Hydroxymethylfurfural

1
Chemistry Department, University of Lleida, Alcalde Rovira Roure 191, 25198 Lleida, Spain
2
Process and Systems Engineering Center (PROSYS), Department of Chemical and Biochemical Engineering, Technical University of Denmark, Building 228 A, 2800 Lyngby, Denmark
3
Department of Food Science, University of Copenhagen, 1958 Frederiksberg C, Denmark
*
Author to whom correspondence should be addressed.
Catalysts 2022, 12(8), 839; https://doi.org/10.3390/catal12080839
Submission received: 9 June 2022 / Revised: 19 July 2022 / Accepted: 21 July 2022 / Published: 30 July 2022
(This article belongs to the Special Issue Enzyme Catalysis, Biotransformation and Bioeconomy)

Abstract

:
5-hydroxymethylfurfural (HMF) is a platform chemical that can be converted into a wide range of high-value derivatives. Industrially, HMF-based derivatives are synthesized via chemical catalysis. However, biocatalytic transformation has emerged as an attractive alternative. Significant advances have been made in the last years using isolated enzymes and whole-cell biocatalysts in HMF biotransformation. Nonetheless, one of the major bottlenecks is the cost of the process, mainly due to the microorganism growth substrate. In this work, biotransformation studies to transform HMF into 2,5-di(hydroxymethyl)furan (DHMF) were carried out with the fungus Fusarium striatum using low-cost protein hydrolysates. The protein hydrolysates were obtained from fines, an unexploited material produced during the rendering process of meat industry waste residues. Given the high content in the protein of fines, of around 46%, protein hydrolysis was optimized using two commercially available proteases, Alcalase 2.4 L and Neutrase 0.8 L. The maximum degree of hydrolysis (DH) achieved with Alcalase 2.4 L was 21.4% under optimal conditions of 5% E/S ratio, pH 8, 55 °C, and 24 h. On the other hand, Neutrase 0.8 L exhibited lower efficiency, and therefore, lower protein recovery. After optimization of the Neutrase 0.8 L process using the response surface methodology (RSM), the maximum DH achieved was 7.2% with the variables set at 15% E/S ratio, initial pH 8, 40 °C, and 10.5 h. Using these hydrolysates as a nitrogen source allowed higher sporulation of the fungus and, therefore, the use of a lower volume of inoculum (three-fold), obtaining a DHMF yield > 90%, 50% higher than the yield obtained when using commercial peptones. The presented process allows the transformation of animal co- and by-products into low-cost nitrogen sources, which greatly impacts the industrial feasibility of HMF biotransformation.

1. Introduction

Chemicals such as 2-methylfuran (MF), 2,5-di(hydroxymethyl)furan (DHMF), 2,5-diformylfuran (DFF), 5-hydroxymethyl-2-furancarboxylic acid (HMFCA), 5-formyl-2-furancarboxylic acid (FFCA), and 2,5-furandicarboxylic acid (FDCA) are examples of valuable compounds that can be obtained from 5-hydroxymethylfurfural (HMF) [1,2]. Among them, DHMF is highly attractive due to its peculiar symmetrical structure and has great potential as an intermediate for the manufacturing of various interesting compounds, such as fuels, resins, fibers, foams, drugs, crown ethers, ethers, ketones, and polymers [1,3].
Currently, industrial HMF-based derivatives are synthesized via catalytic approaches, such as hydrogenation or oxidation [1]. However, despite being, in general, economically advantageous, these traditional chemical methods are not very specific processes, and a high number of steps, high-cost chemicals, and extreme conditions are required to enhance selectivity and purity, which hampers economic feasibility [2,4]. In addition to this, these processes may be regarded as environmental pollutants. As Lalanne et al. [2] pointed out, it does not seem coherent to replace petrochemical compounds with bio-based molecules when accepting pollution during production. Therefore, biocatalysis might be a promising alternative thanks to milder conditions, higher selectivity, and more environmentally friendly reaction conditions [5]. In the last years, significant advances have been made in HMF biotransformation using isolated enzymes and whole-cell biocatalysts [6,7,8,9,10,11,12]. The biocatalytic reduction of HMF has been previously described using yeast [11,13,14,15], bacteria [6,8,16], and fungi [4,7,16,17,18]. However, one of the major bottlenecks for microbial enzyme production is the high cost, mainly due to the cost of growth media components, which represents around 30–40% of the production costs [19]. As in the fermentation processes, the whole cells employed in biocatalytic biotransformation of HMF require specific nutritional requirements to obtain energy, for the biosynthesis of cellular matter and products in the cell operation, maintenance, and reproduction [20]. Among the growth media ingredients used to grow whole-cell biocatalysts with the capability to metabolize HMF, organic nitrogen sources, such as protein hydrolysates, yeast extract, or beef extract [7,9,16,21,22,23,24] tend to be the most expensive components. In addition, in some cases elevated cell dosages (200 mg/mL) were necessary to alleviate the inhibition of the substrate and increase HMF conversion [7], thus significatively increasing the process cost. Therefore, addressing the lower-priced nitrogen sources will have a great impact on future industrial feasibility.
In this context, we hypothesized that a rich protein material called fines, a priori valueless meat by-product generated during the processing of animal by-products (ABPs), contains valuable resources with a strong economic potential if treated in the correct manner. Currently, these by-products are discarded as waste or under-utilized, and in some cases, incur considerable cost to processors. The use of low-cost hydrolyzed rendered proteins present in fines might represent a good alternative to current expensive nitrogen sources used in biocatalytic conversion of HMF, such as yeast extract or peptones, helping to lower fermentation cost and making the process economically and industrially viable. In the present work, we investigated the effect of two low-cost animal-derived protein hydrolysates (HA and HN) in the biotransformation capability of several Fusarium strains.

2. Results and Discussion

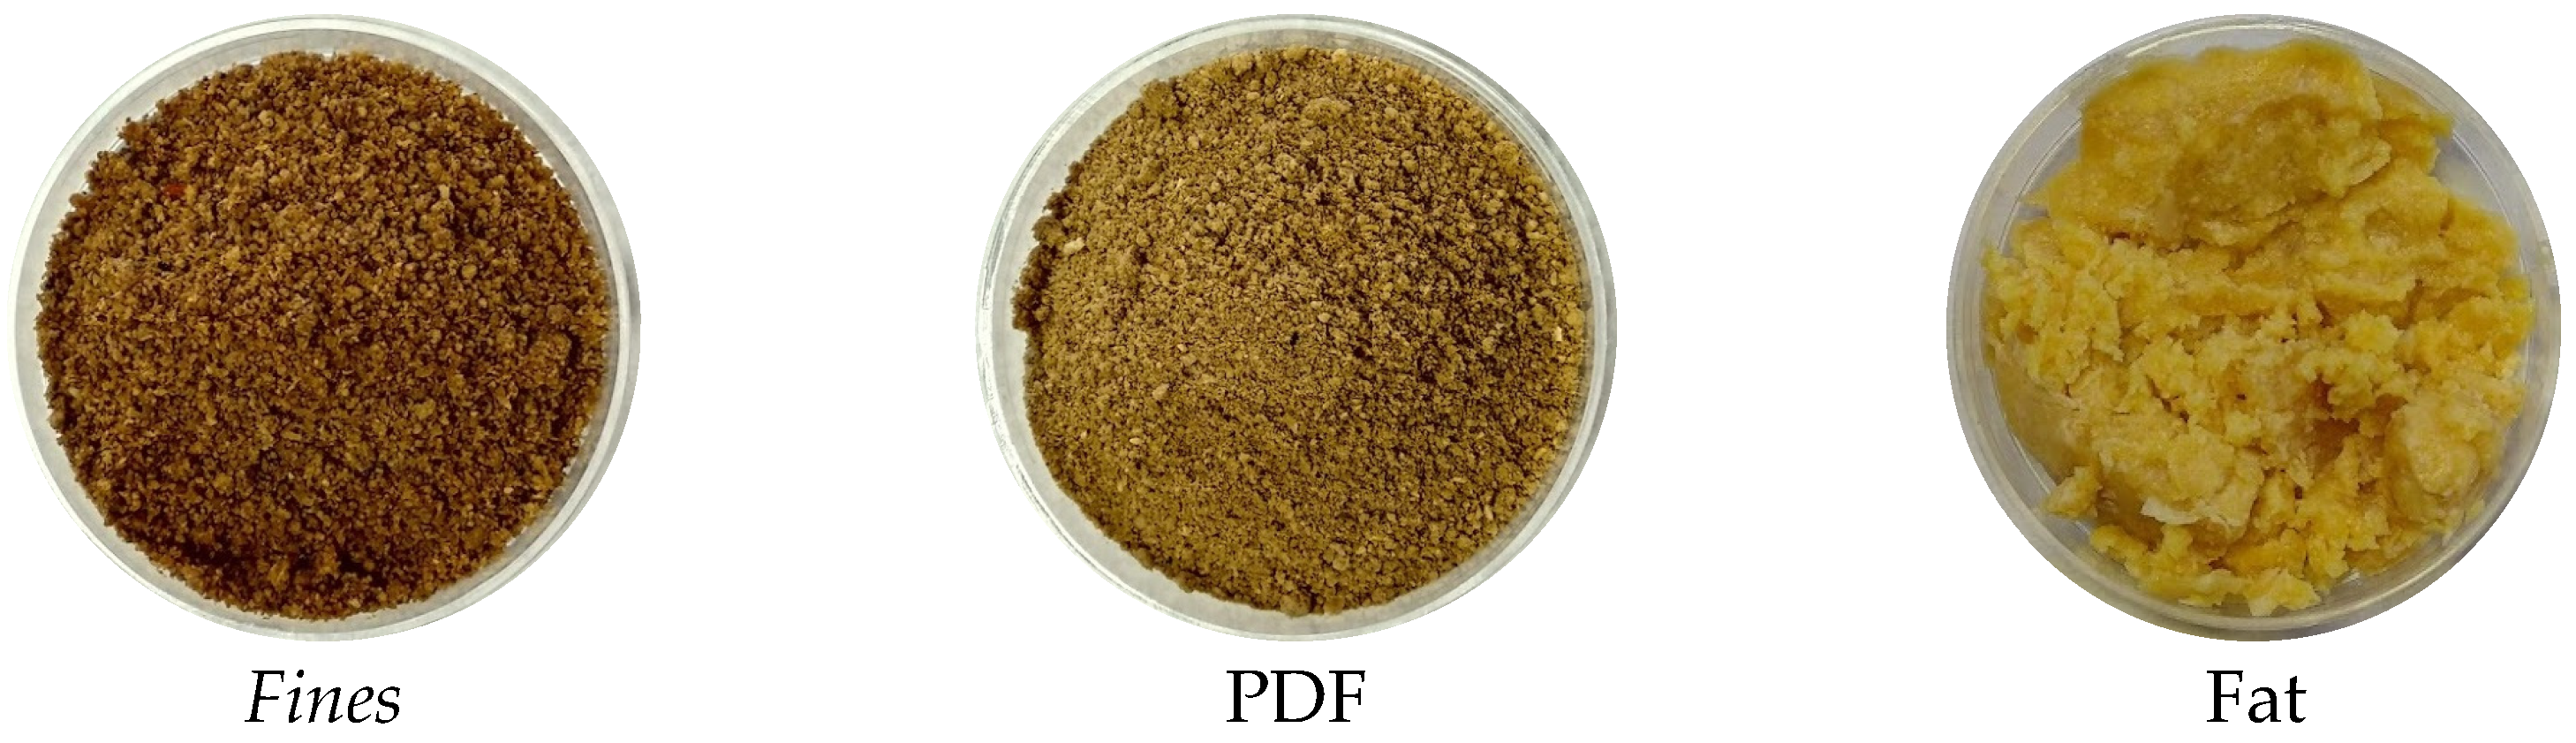
2.1. Pre-Treatment and Partially Defatted Fines (PDF) Characterization

Homogenized fines were treated with hot water. This pretreatment of the material allows the partial removal of fat from the fines (which can be used for other purposes) using the greenest and less costly methodology. In consequence, the proteinaceous solids containing non-soluble protein, now on called partially defatted fines (PDF), were obtained from fines, separating them from fat that can interfere in the enzymatic process. Figure 1 shows the raw material and different fractions recovered after the thermal treatment and centrifugation. The chemical analysis of physically defatted material, following the methods described in the Supplementary Data, indicates the loss of over half of the total fat in the original material. The protein content experienced an increase from 45.8 ± 0.5% to 57.7 ± 1.7% based on dry matter (DM). The ash content and C/N ratio of the defatted dry material were 16.9 ± 1.0%, and 5.1 ± 0.1%, respectively.
As previous investigations pointed out [25,26], the amount of lipids in the material has a significant impact on the hydrolysis process. Partial removal of fat results in a sharp reduction of viscosity, which allows a higher degree of hydrolysis (DH) [25]. Šližyte et al. [26,27] pointed out that the highest amount of lipids in the raw material gave the lowest percentage of solubilized proteins. Furthermore, hydrolysates with low lipid content are desired to enhance the product stability [28].

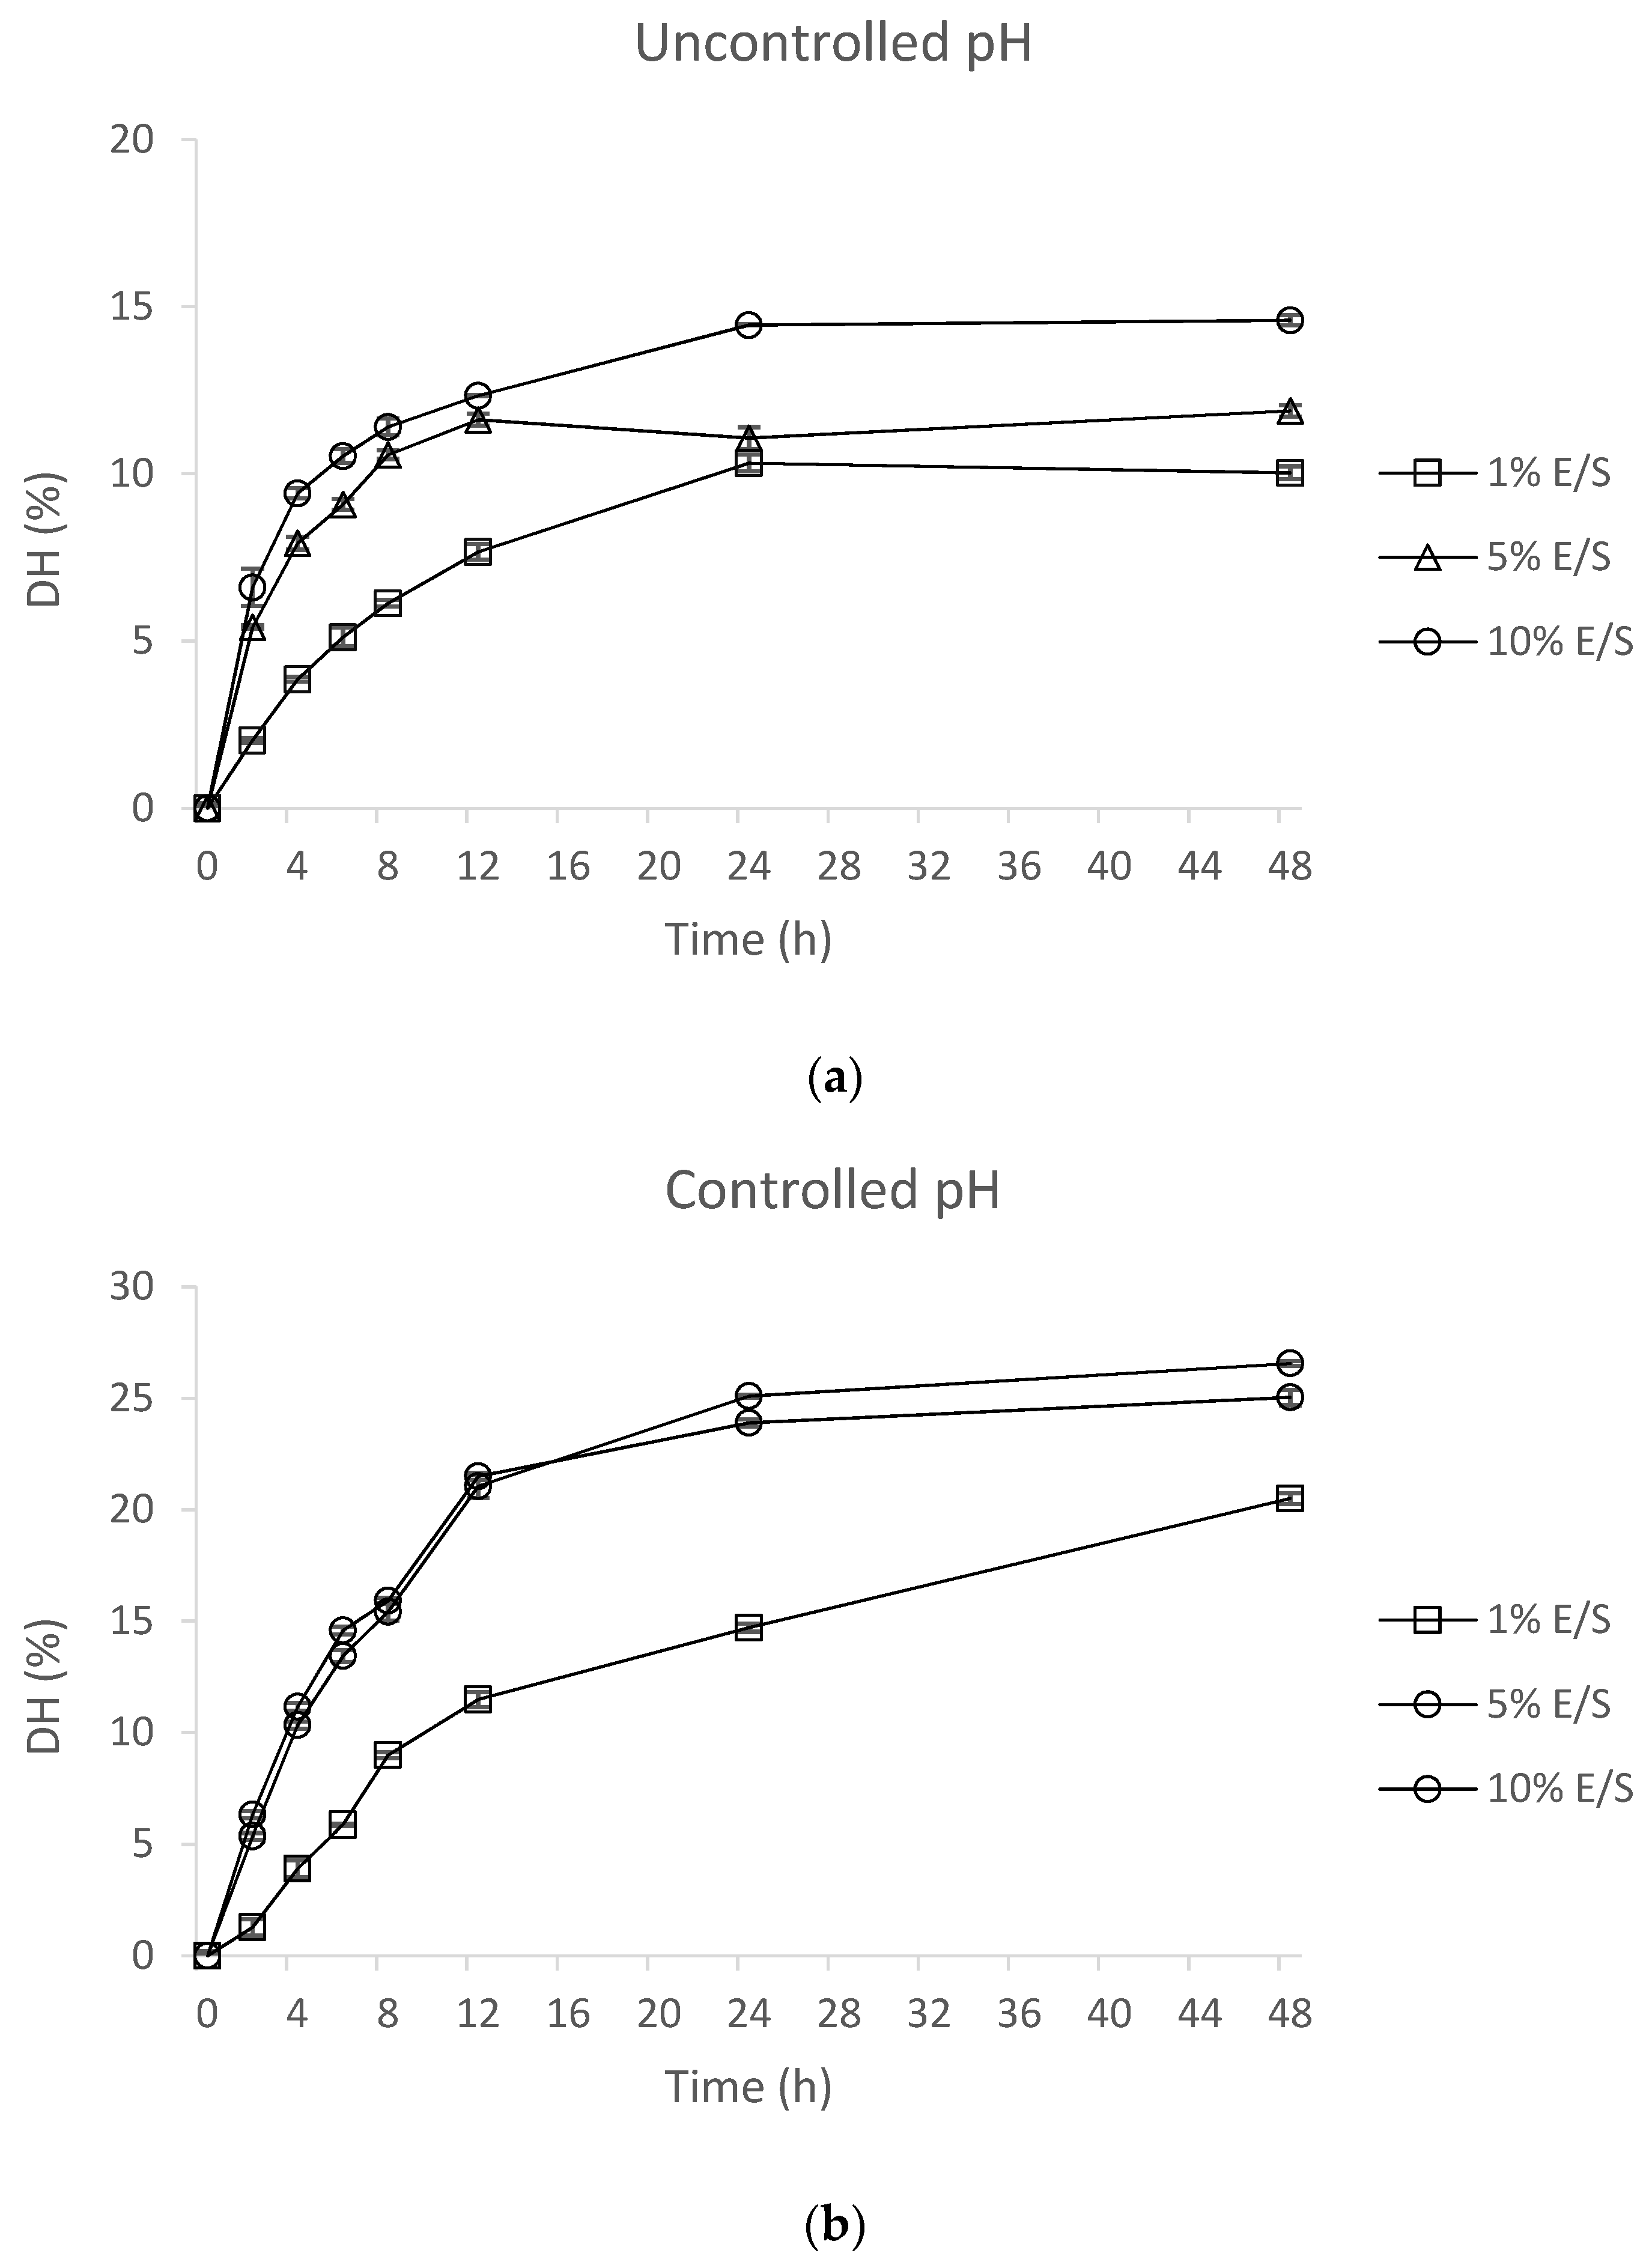
2.2. Optimization of Hydrolysis with Alcalase 2.4 L

Hydrolysis reactions were performed by mixing the proteinaceous material with water and enzyme. Water addition was necessary to allow more surface area for the action of the enzyme and enhance enzyme homogeneity, promote tissue swelling, and reduce the localized concentration of hydrolysis products [29]. The enzymatic reactions were followed by measuring the DH. In this study, the effects of pH, time, and E/S ratio were evaluated.
The effect of the pH on DH is shown in Figure 2, regardless of the E/S ratio. The DH increased with the incubation time and the higher DH was obtained when the pH was kept at the optimal pH (pH 8) and a higher amount of enzyme was added. Meanwhile, during the hydrolysis without pH control, under both E/S ratios, the pH dropped from 8.0–8.5 to 6.5–6.7 until the end of the process; therefore, the reaction changed the pH of the reaction medium. As there is a clear relation between pH and DH [29,30], it is not surprising that the pH stabilization is correlated to the DH stationary phase. The activity of Alcalase 2.4 L is sensitive to pH and although Carvalho et al. [31] mentioned an optimal pH range of 6.5–8.5, the pH instability of the medium might affect enzyme stability by causing irreversible denaturation, resulting in a continuous loss of enzyme activity. Hence, this could be one of the reasons for the lower DH obtained. This decrease in pH is due to the release of H+ owing to the cleavage of peptide bonds. When the pH of the system is close to 7, the α-carboxyl groups (pKa 3.1) from peptides are fully deprotonated, while α-amino groups (pKa 7.3) are partially protonated, resulting in a buffering effect and maintaining pH constant for a while [31,32].
Regarding the E/S ratio, an E/S ratio of 5 and 10% resulted in higher DH than a 1% E/S ratio. Both 5 and 10% E/S ratios provided a similar rate of hydrolysis and prolonging the reaction beyond 24 h did not produce a remarkable improvement in the DH. A slightly higher final DH value (26%) was obtained with an E/S ratio of 5% and a reaction time of 48 h. Nevertheless, the differences between 24 and 48 h and 5% and 10% were not very remarkable. Therefore, increasing enzyme concentration over 5% does not affect DH. Three main hypotheses have been proposed to explain the downward tendency of the hydrolysis curve: (i) a decrease in the concentration of available peptide bonds, (ii) enzyme inhibition by proteolysis products, and (iii) enzyme inactivation [33,34,35]. A similar dose/response effect was described by Lapeña et al. [36] in different substrates with Alcalase. Noman et al. [37] also observed a slight decrease in DH with an E/S ratio beyond 3% with pepsin, attributing this decline to enzyme aggregation, which leads to an increase in substrate diffusion inhibition, causing the saturation of the reaction rate. Hence, an E/S ratio of 5% and a hydrolysis time of 24 h were selected as optimum for further experiments.
The values of DH are in accordance with reported values for Alcalase from Novo Nordisk, 15–25% [38]. Piazza and Garcia [39] reported the recovery of 49.7% of the protein from MBM, while other studies with Alcalase showed protein recoveries up to 70% from fish [31,39,40] and up to 90% from chicken meat [41].
No reports were found in the literature using the same enzyme and fines as a substrate to enable the DH comparison, although it is not surprising that the enzymatic hydrolysis of PDF takes about 24 h to achieve a DH of 25% compared with other raw meat by-products. For instance, Kurozawa et al. [41] reported the hydrolysis of chicken meat up to a DH of 31% in less than 6 h under similar conditions. Whereas, Webster et al. [40] found that heated lung samples were less solubilized and more challenging to defatted than their raw counterparts. The treatment at elevated temperatures promotes the formation of protein–fat interactions, thus hindering their separation and therefore, protein hydrolysis.

2.3. Optimization of Hydrolysis with Neutrase 0.8 L

Attempts to optimize hydrolysis with Neutrase 0.8 L following the same experiments as carried out with Alcalase 2.4 L did not give satisfactory results (results not shown). Consequently, optimization using the response surface methodology (RSM) in conjunction with central composite design (CCD) was chosen. RSM is a statistical technique that has been successfully used in the optimization of several processes [42,43,44,45,46,47,48]. The application of statistical experimental design techniques reduces the resources needed [20,49], therefore RSM was selected for further experiments with Neutrase 0.8 L.

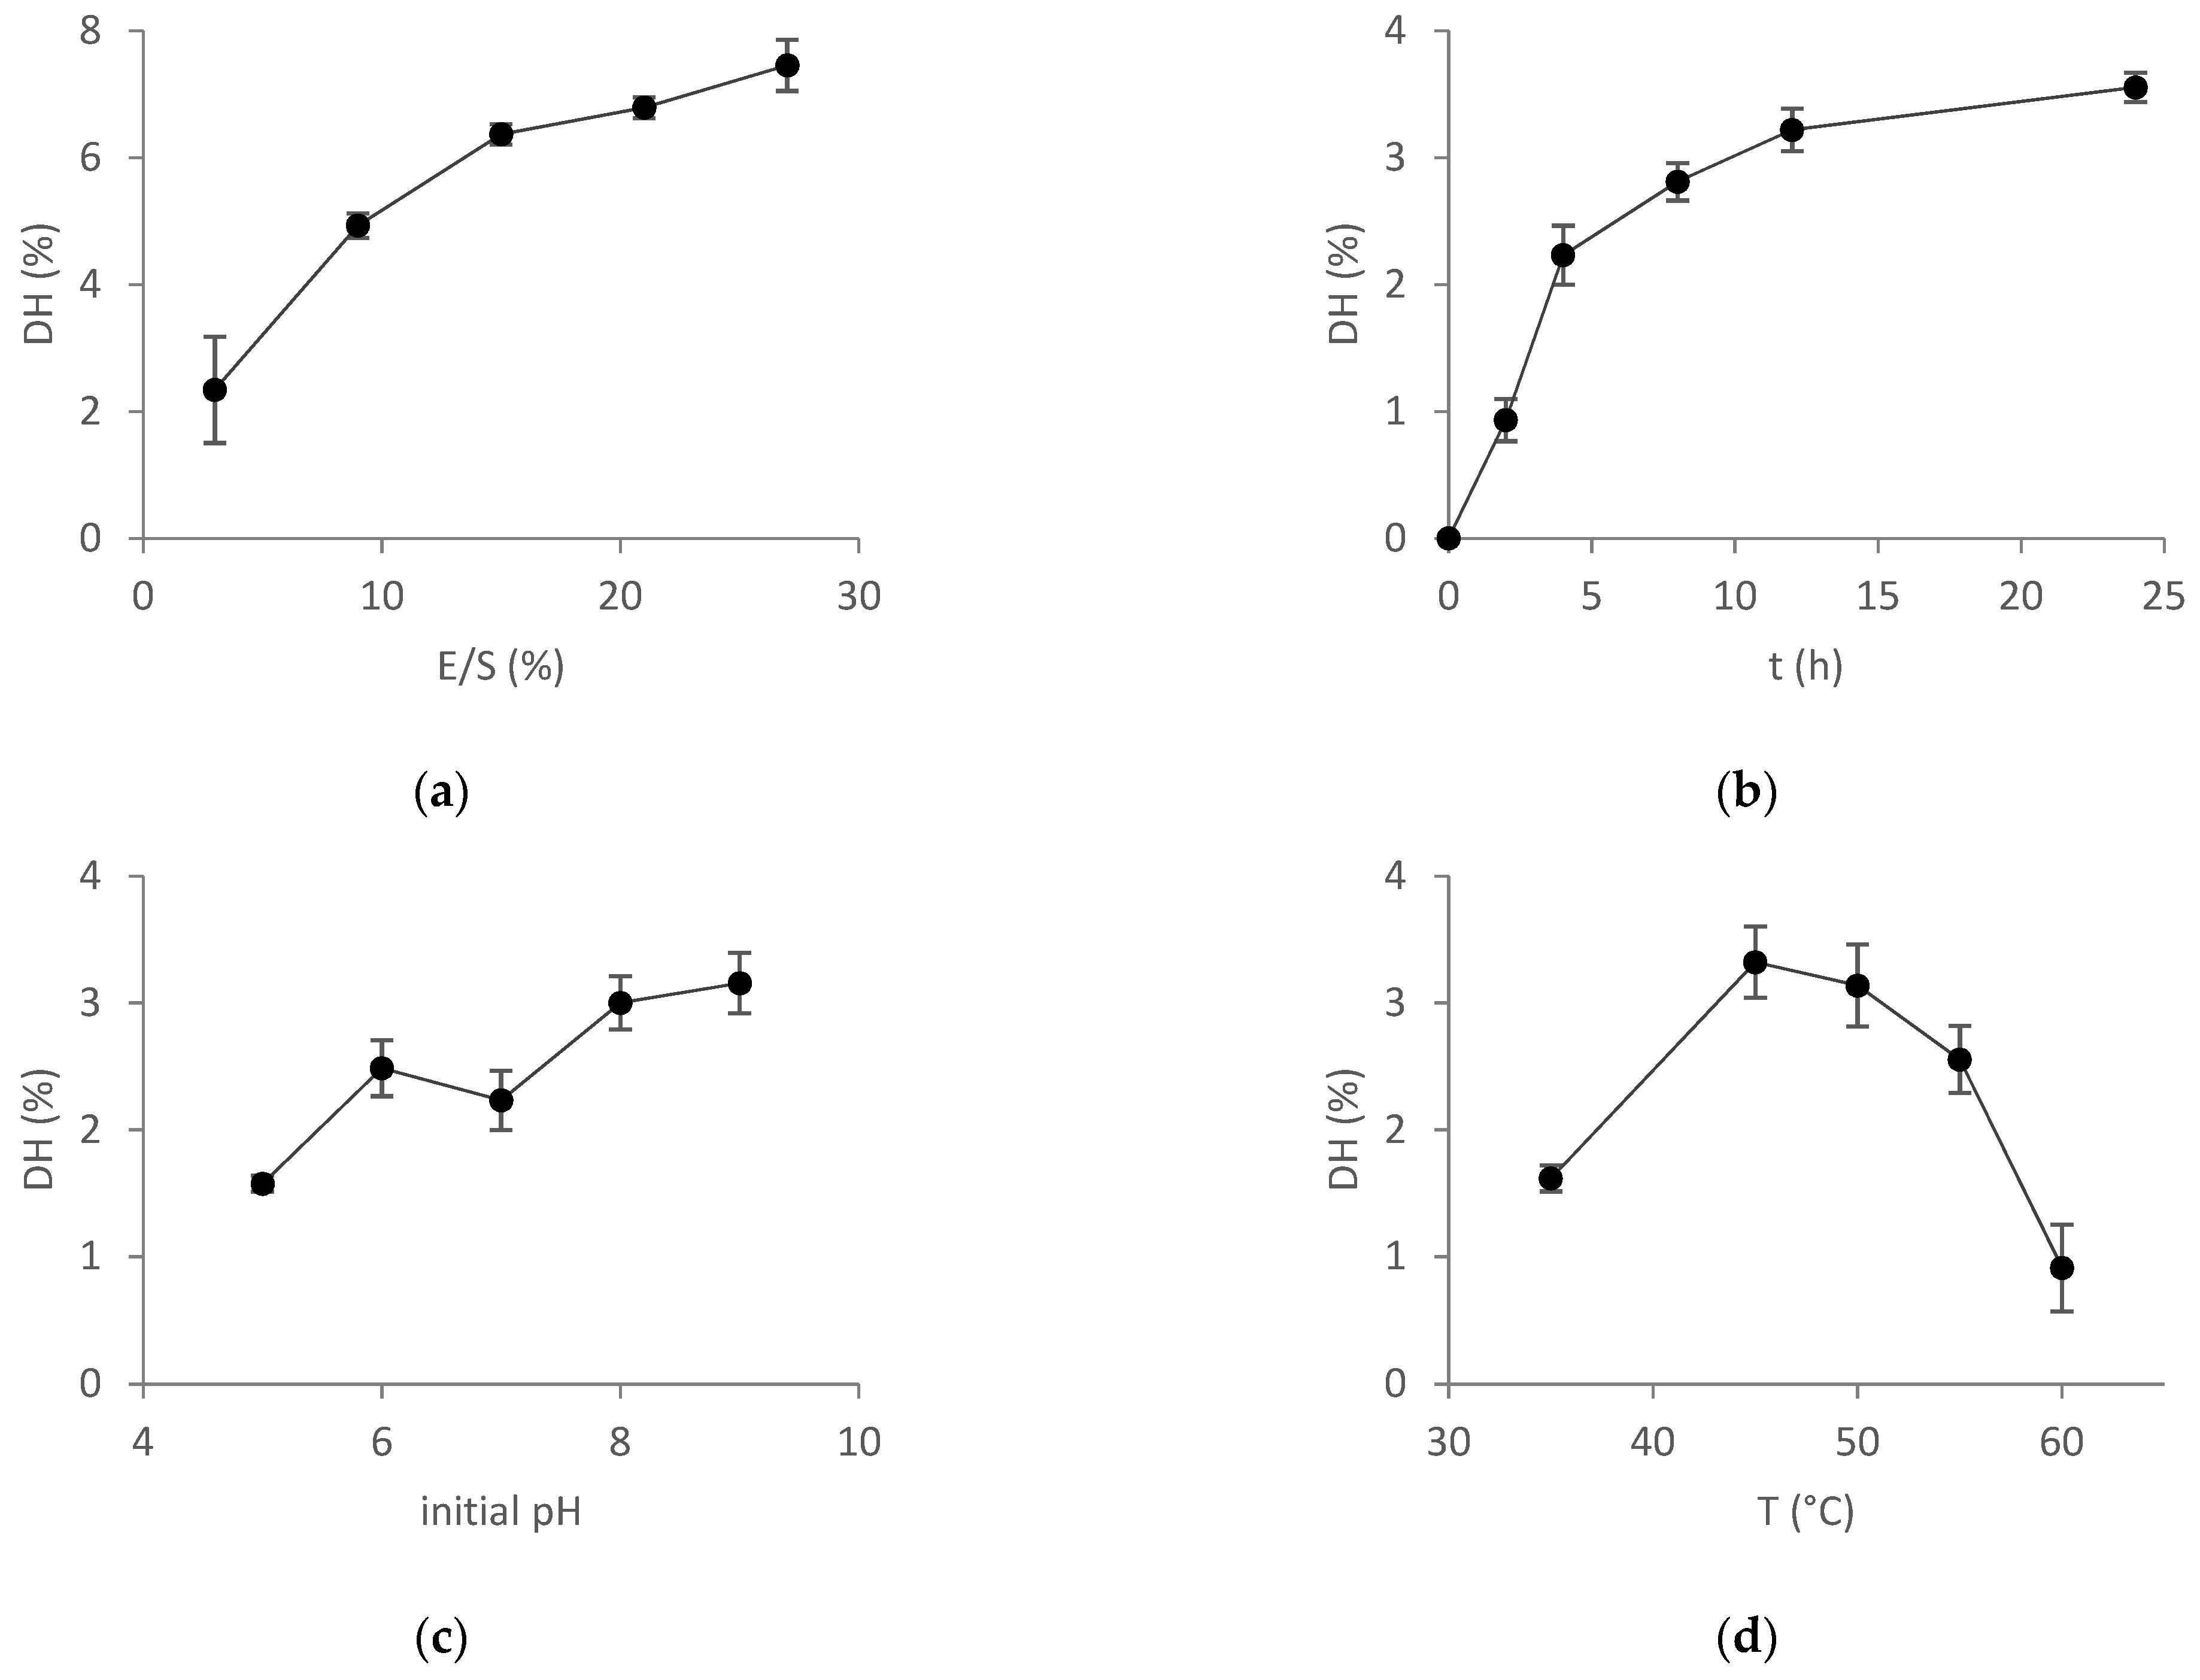
2.3.1. OFAT Experiments

In this study, RSM has been used to optimize the enzymatic hydrolysis of PDF with Neutrase 0.8 L. First, OFAT experiments were performed to select the working range for the CCD experimental design. Data obtained in the OFAT experiments is shown in Figure 3.
As observed, at a low E/S ratio (3%) the DH was 2%. When increasing the E/S ratio, DH was gradually increased up to 8%. An E/S ratio of 10% was selected as the center point. As expected, the DH increased with the progress in the reaction time. However, incubation times longer than 12 h did not improve DH substantially. Thus, 6.5 h was selected as the center point. Higher DH values were obtained at pH values of 8 and 9. However, the differences were rather small and an initial pH value of 7 was selected as the center point. The reaction temperature had an important impact on the DH. Reaction temperature between 40 and 50 °C resulted in a higher DH, and 45 °C was selected as the center point.

2.3.2. RSM Optimization of Hydrolysis Parameters

The influence of E/S ratio (X1), incubation time (X2), initial pH value (X3), and temperature (X4) on the hydrolysis by the neutral protease was determined using a CCD experimental design. The experimental and predicted values for DH at different combinations of the four independent variables are displayed in Table S1 (Supplementary Materials).
The shapes of the 3D response surface plots representing the DH are illustrated in Figure S1 (Supplementary Materials), depicting the influence of two independent variables on the DH while the other two were fixed at their central levels. It is evident that with increasing E/S ratio (X1) and increasing incubation time (X2) the DH gradually increased (Figure S1a, Supplementary Materials). However, regardless of E/S ratio (X1), incubation time (X2), and pH (X3) values, when the temperature (X4) increased, the DH decreased (Figure S1b–d, Supplementary Materials). Hence, under the conditions studied, the enzymatic reaction with Neutrase 0.8 L requires a temperature in the coded range between −1.48 and −0.5, corresponding to 37.6 and 42.5 °C, respectively. This might be due to the denaturation of the enzyme at higher temperatures. On the other hand, DH increased with an increase in the initial pH value (X3) (Figure S1e,f, Supplementary Materials).
ANOVA is presented in Table S2 (Supplementary Materials). As previously mentioned, the statistical significance has a threshold of 0.05. A p-value < 0.05 indicates that the variable or model term is considered significant. The p-value for the model is smaller than 0.05 (p-value < 0.001) and the F value is several times higher than F tabulated ( F 0.05 14.14 = 2.484 ) for α = 0.05, indicating that the variation accounted by the model is significantly greater than the unexplained variation [45] and the model is statistically significant. Moreover, the lack of fit is used to test the fitness of the model [48] and this value should be insignificant [50]. As expected, the p-value for this parameter is higher than 0.05 (p-value = 0.1122); therefore, the model fitted the experimental data and suggests that the model is sufficiently accurate to predict the DH for any combination of experimental independent variables. The coefficient of determination (R2adjusted) of the model is 0.9630. It is satisfactory because it disclosed that about 96% of the variation in behavior within the range of values studied could be explained by the independent variables. Less than 4% of the variation is unexplained or due to experimental error. The second-order polynomial model was fitted to the experimental data obtained as a function of the studied independent variables and their interactions to describe the behavior of the system. The equation was derived using the constant, linear, and quadratic regression coefficients and it is as follows (1):
y = 4.56 + 1.52 X 1 + 1.62 X 2 + 0.31 X 3 0.36 X 4 + 0.20 X 1 X 2 + 0.18 X 1 X 3 0.03 X 1 X 4 0.51 X 2 X 4 0.19 X 3 X 4 0.23 X 1 2 0.65 X 2 2 + 0.10 X 3 2 0.47 X 4 2
The magnitude of the coefficients is directly proportional to the importance of the variables and their effects [51]. It is in agreement with Table S3 (Supplementary Materials), where the F value of each parameter and their interactions are described. The higher coefficient and the higher F value are observed for X2, while the smaller values are observed for the interaction between X2 and X3. Negative signs of regression coefficients of quadratic terms (X1, X2, and X4) emphasized the existence of a local maximum of DH, as pointed out by Elmalimadi et al. [52].

2.3.3. Effect of Parameters

The significance of each factor on the dependent parameter is shown in Table S3 (Supplementary Materials). The same criterion was followed, where a p-value < 0.05 indicates that the variable or the interactions are significant. As observed, all the linear factors, the quadratic effects of X2 and X4 variables, and the interactions XX4 and XX4 were significant. All the other interactions were not significant. The most influential factors were the X1 (E/S ratio) and X2 (time), with the F value being an indicator of this. Compared to OFAT experiments, in this model, we can observe the significance of the interactions and the quadratic effects.

2.3.4. Optimum Conditions

The optimum conditions were extracted by employing the desirability profile with a maximum desirability level of 0.89 (a value of 1 indicates the highest desirability), as shown in Figure S2 (Supplementary Materials). Optimum DH or the highest DH possible, about 8.1 ± 0.7%, can be obtained with an E/S ratio (X1) of 1, a hydrolysis time (X2) of 1, initial pH (X3) of 1, and a temperature (X4) of −1. The real values were E/S ratio (X1) of 15%, a hydrolysis time (X2) of 10.5 h, initial pH (X3) of the substrate equal to 8, and a temperature (X4) of 40 °C. The DH, as well as desirability level, were reduced significantly at an E/S ratio below 15% and a hydrolysis time of 10.5 h.
A higher E/S ratio could have a positive effect on the DH, but due to enzyme cost, 15% was selected to ensure economic feasibility if the process might be transferred to the industry. Meanwhile, DH was less affected by the variable’s initial pH and temperature, and it is in agreement with the F value displayed in Table S3 (Supplementary Materials). The DH ranged between 7 and 8% in the experimental pH levels, while temperatures higher than 45 °C decreased the response.

2.3.5. Validation of the Predictive Model

Upon statistical optimization, the JMP Pro 14 software predicted the highest DH using an E/S ratio of 15%, an incubation time of 10.5 h, an initial pH value of 8, and the temperature of incubation equal to 40 °C. The validity of the theoretical model was confirmed under the predicted optimal conditions. A DH value of 7.2 was observed from the experiments under the specified conditions. The DH value was a good fit for the value forecasted (8.1%) by the regression model. This finding proved the validity of the prediction model and that the hydrolysis conditions achieved by RSM were reliable and practical.

2.4. Characterization of the Protein Hydrolysates

2.4.1. Macrocomponents and Elementary Analysis

The approximate and mineral element composition based on the dry weight of the substrate, the protein hydrolysates, and their corresponding solid precipitates is detailed in Table S4 (Supplementary Materials). As expected, a considerable increase in protein content was observed as a result of protein solubilization and the removal of insoluble non-protein substances in the freeze-dried hydrolysates when compared to fines, from 46% to 70%, regardless of the enzyme used. These hydrolysates could be used as a good source of protein. Protein recoveries were 70 and 40% for Alcalase 2.4 L and Neutrase 0.8 L, respectively. This undoubtedly indicates the higher efficiency of Alcalase 2.4 L in hydrolyzing proteins. Lipid content was reduced compared to the substrate, showing that the centrifugation step was efficient in purifying the protein hydrolysate [40]. Moreover, reducing fat content is beneficial for the hydrolysates, as it might significantly increase the stability of the material towards lipid oxidation while contributing to enhance product stability [41,47]. A greater reduction of fat content was observed in the hydrolysis with Neutrase 0.8 L, although the lipid content in HA can be considered satisfactory. The higher amount of fat in HA can be attributed to fat globules present in the supernatant after removing non-hydrolyzed material [53]. As Neutrase 0.8 L is less efficient in hydrolyzing the substrate, lipids might have been excluded with the insoluble protein fraction by centrifugation [28]. Although a high ash content was expected in the hydrolysates, most likely due to the addition of alkali during pH control [54,55,56], lower ash content was observed in the hydrolysates. In an analogy to what was observed by Garcia et al. [57] in the case of the ash content, the hydrolysates contained less than 10% ash. A very high ash content was observed in the sludge, indicating that a substantial fraction of these precipitates is composed of insoluble bone particles. Ash content is slightly higher in HA than HN. This might be due to the higher amount of NaOH solution added to control the pH, although it is not considered inconvenient for most applications.
As we can observe in Table S4 (Supplementary Materials), the substrate is especially rich in phosphorus and calcium. The high content of phosphorus and calcium observed in the precipitates confirm the presence of bone particles in this fraction, with these being the two major constituents [58]. The number of mineral elements in the obtained freeze-dried protein hydrolysates was reduced, except for Na. The presence of these mineral elements in the protein hydrolysates is not a negative aspect. Some of them, such as Zn, Cu, and Mg, act as cofactors, S is a component of some amino acids, p is involved in energy transfer, Ca is a component of membranes, K participates in protein biosynthesis, while Na is the major intracellular cation [20,59]. Hence, these minerals are required for microbial growth and support the use of these hydrolysates in the microbiological growth media [60,61].
Moreover, the high N content of the peptones obtained indicates that it can be a good source of high nutritional quality products for use in microbiological growth media as a nitrogen source or in the fermentation media [20,62].

2.4.2. Amino Acid Composition

Amino acid composition of fines, PDF, protein hydrolysates, and precipitates were determined [63,64,65] and are presented in Table S5 (Supplementary Materials). The methodology employed was not optimal to determine tryptophan and glutamic acid/glutamine and aspartic acid/asparagine separately. During the hydrolysis with HCl, tryptophan is completely degraded while glutamine and asparagine are completely hydrolyzed to glutamic acid and aspartic acid, respectively [66]. Therefore, Glx includes glutamic acid and glutamine, and Asx includes aspartic acid and asparagine. Among the amino acids quantified herein, the content of Glx, Leu, Gly, and Asx tended to predominate in all the samples. After the thermal treatment, as a consequence of fat and warm water-soluble collagen removal, the recovered fraction (PDF) used for hydrolysis showed a significantly higher concentration of some amino acids, specifically Ala, Asx, Cys, Glx, Ile, Leu, Phe, Ser, Tyr, and Val. In contrast, the enzymatic hydrolysis showed that on the whole, there were no significant differences between the substrate and the hydrolysates, with the exception of Cys and Val for HA and Ala, Arg, Asx, Cys, Hyp, Ile, and Pro for HN. In addition to this, the hydrolysis gave similar relative percentages of all amino acid residues. These findings were in agreement with previous results [37,42,67], that reported only slight changes in the proportion of all amino acid residues when comparing the initial substrate and the hydrolysates obtained from protein-rich industrial by-products and animal co-products.
The amino acid compositions of HA and HN were relatively comparable, except for the content of Ala, Hyp, and Pro, observing significantly higher concentrations in HN. It is interesting to note that Pro and Hyp are amino acids abundant in collagen [67,68,69,70,71]. Although Alcalase is able to degrade collagen [72,73], this fact suggests that Neutrase 0.8 L was more effective in hydrolyzing the collagen structure than Alcalase 2.4 L. These results are in agreement with observations by Webster et al. [41], who reported that Neutrase was the most effective enzyme hydrolyzing collagenous tissue and Alcalase was by far the least effective compared to pepsin, papain, and Neutrase. This can be explained by the specificity of each enzyme. Neutral proteases prefer substrates containing aromatic amino acids, Leu, Ile, Val, and Arg-Gly linkage [43,74,75], which appear quite frequently in collagen. Conversely, Alcalase has a broad specificity [73] for sites containing mainly hydrophobic residues in either P’2 or P’3 positions, Ala and Ser at P’1, Glu in the P1 position, Gly, Pro, Ala, Val, and Ser at various P4–P’4, and Leu-Tyr bond [69,75,76], although not necessarily for those amino acids bonds predominantly in the collagen or gelatin structures [41]. Thus, the broader specificity of Alcalase yielded hydrolysates with higher DH.

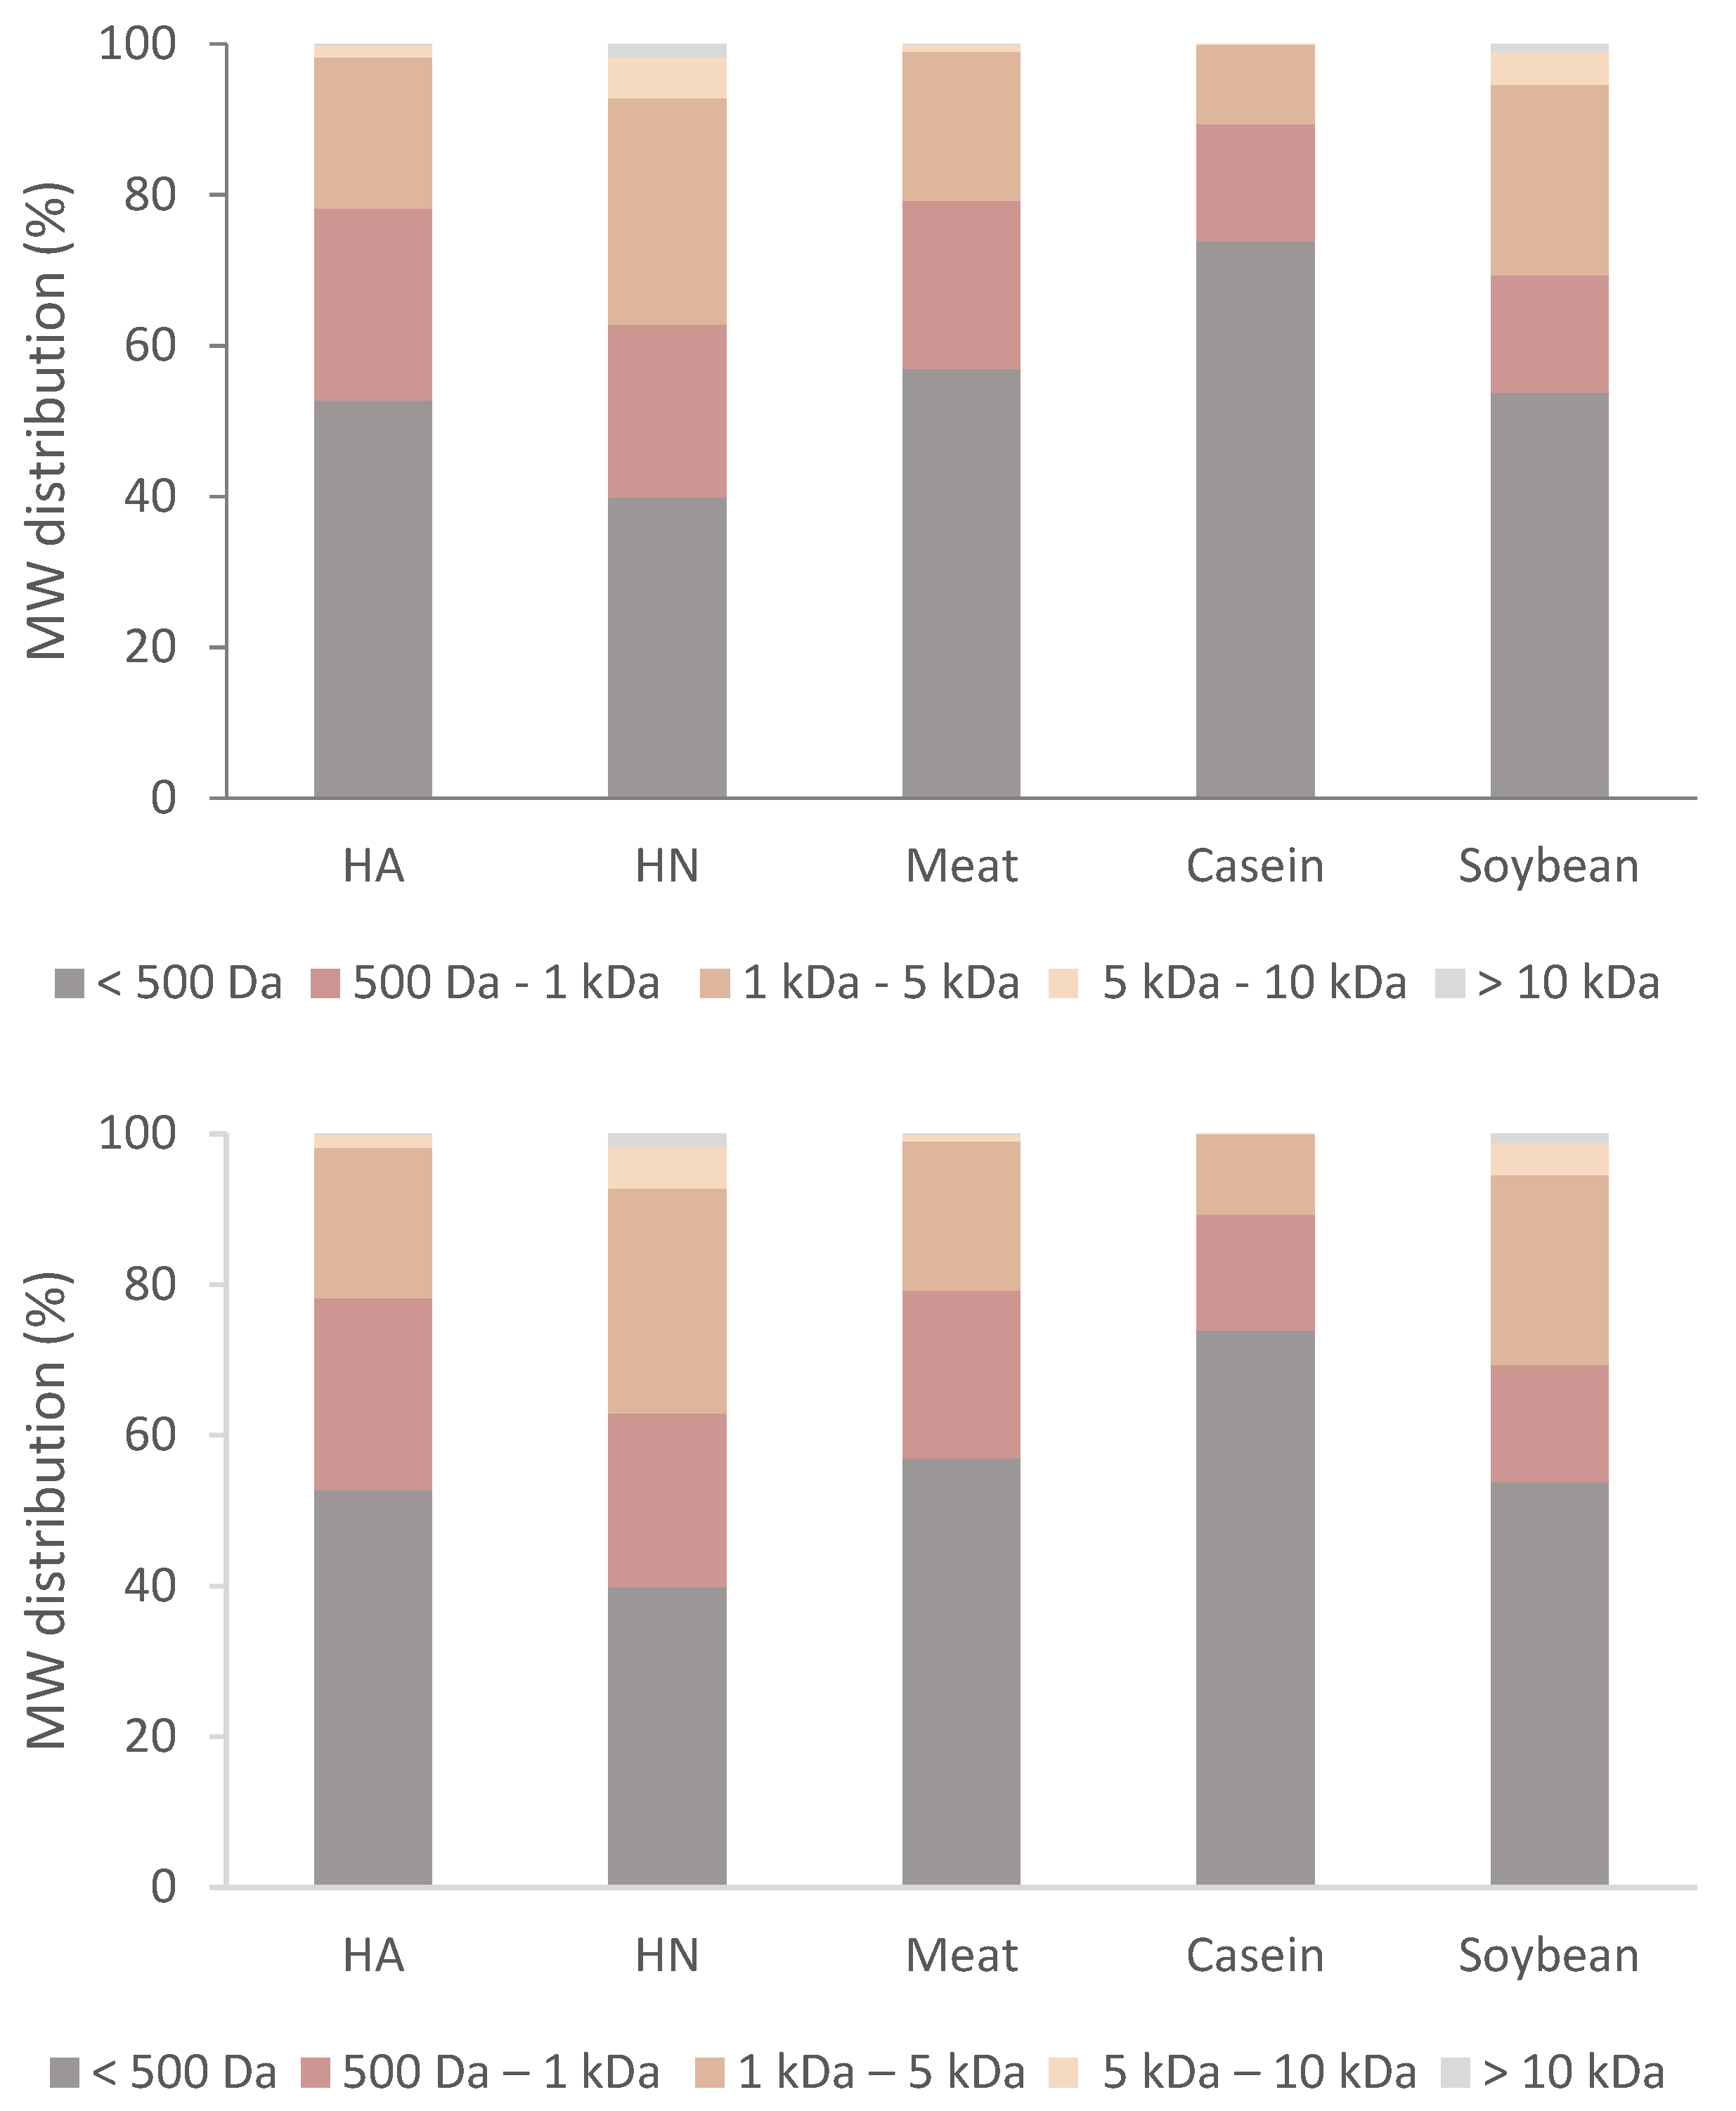
2.5. Size Exclusion Chromatography (SEC)

For the purpose of a more complete characterization and to detect peptides in a molecular weight range not detected by SDS-PAGE, SEC analysis was carried out to determine the molecular weight distribution of the two prepared hydrolysates and commercial peptones for comparison, as displayed in five MW distribution ranges including <0.5 kDa, 0.5–1 kDa, 1–5 kDa, 5–10 kDa, and >10 kDa. All the hydrolysates were characterized by a very high relative percentage of peptides with small and medium molecular weights (<5 kDa), which accounted for more than 92% of all the peptides (Figure 4). This fact indicates that Alcalase 2.4 L and Neutrase 0.8 L considerably degraded PDF and hydrolyzed proteins into small and medium size peptides or free amino acids. However, significant differences were observed among the samples. The relative percentage of peptides with a medium molecular weight (>1 kDa) was higher in HN than HA, thus corroborating well with the lower DH obtained with Neutrase 0.8 L. Furthermore, several authors correlated the release of small peptides with increasing DHs [38,56,77,78]. Approximately 80% of all the peptides in HA correspond to small molecular weight peptides (<1 kDa), and it is interesting to note that the molecular weight distribution of this was almost identical to meat peptone. Tryptone and soybean peptones showed greater differences compared to HA and HN. Commercial peptones were analyzed because we had a special interest in using the hydrolysates in microbiological growth media.

2.6. Biotransformations with F. striatum

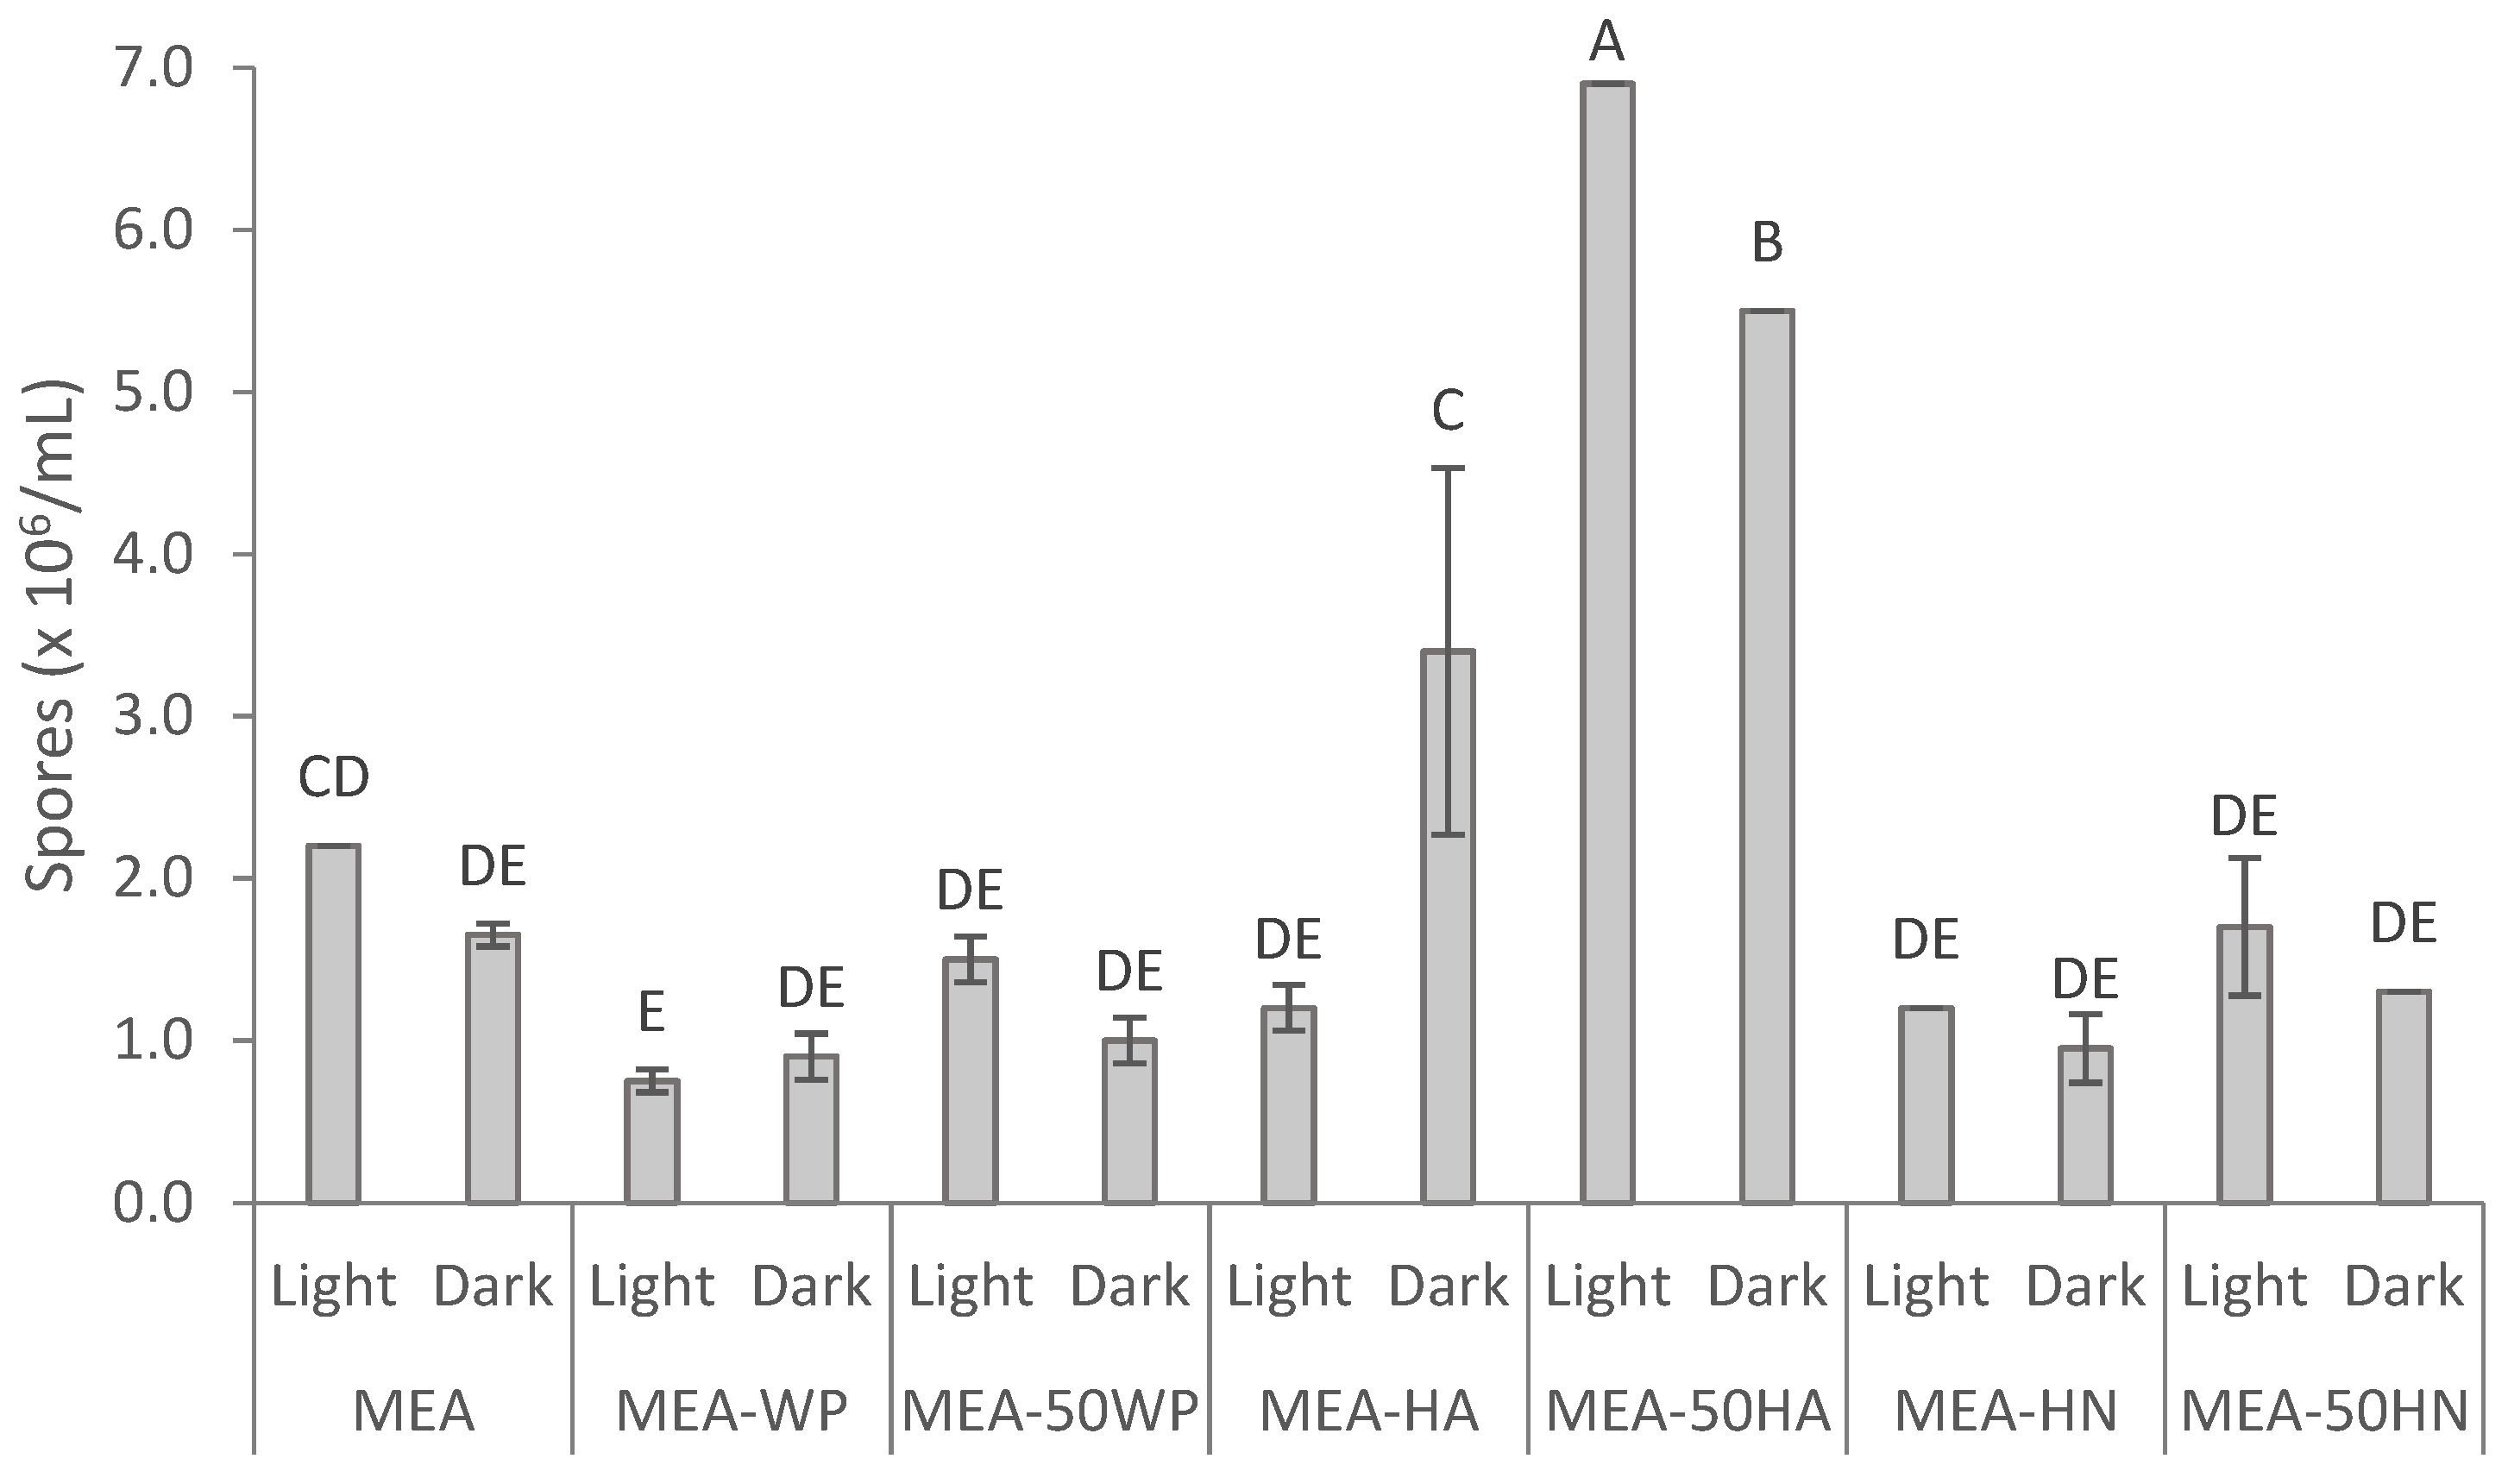
2.6.1. Effect of Nitrogen Source on F. striatum Sporulation

In the present study, the animal-derived protein hydrolysates were evaluated as nitrogen source in F. striatum growth and sporulation. Colony diameter and sporulation were evaluated under different nutrient and light regimes, as starvation or nutrient depletion and exposure to light have been reported to successfully induce sporulation in some fungal species [79].
As shown in Figure S3 (Supplementary Materials) all the media supported the growth sufficiently, reflecting that all the media provided favorable growth conditions. Similar colony diameters were observed in all the culture media after 6 days. As shown in Figure 5, the composition of the culture medium and the interaction of both variables tested had a significant effect on sporulation. MEA, the standard medium used in our laboratory for F. striatum growth, resulted in the production of 2.2 × 10⁶ spores/mL in the presence of light with no significant differences when it was grown in the dark. Surprisingly, the removal of nutrients from the culture media (MEA-WP and MEA-50WP) did not stimulate fungal sporulation, regardless of the light regime. Nevertheless, it should be noted that, particularly in the case of filamentous fungi, findings cannot be readily extrapolated [74]. The addition of protein hydrolysate HN did not significantly affect sporulation compared to MEA. Conversely, culture media amended with HA at a high concentration, replacing commercial peptones and half of the malt extract, were effective in inducing sporulation of F. striatum, observing a three-fold increase compared to MEA. In addition, light presence induced sporulation in MEA-50HA significantly, showing an increase from 5.5 × 10⁶ spores/mL in the dark to 6.9 × 10⁶ spores/mL in the presence of visible light. It should be noted that the culture media MEA-HA incubated in the darkness induced sporulation. Similar results were reported by Lazarotto et al. [75] in the sporulation of an F. chlamydosporium species complex, showing that the light regime only affected sporulation in some culture media and continuous light-induced greater sporulation than other photoperiod regimes. Based on these results the light effect remains unclear. Furthermore, the available knowledge about the sporulation process of Fusarium species is very limited [76].
Microscopic examination revealed that spore morphology was influenced by nutrient and light presence (Figure S4, Supplementary Materials). In the absence of visible light, only microconidia were produced, regardless of the nutritional conditions. However, depending on the culture media, light presence induced the production of two types of conidia, micro- and macroconidia (Figure S4, Supplementary Materials). Three out of the seven tested media showed both types of conidia in the presence of light, MEA-50HN, MEA-HA, and MEA-50HA. MEA-50HN and MEA-HA showed small, oval-shaped, and single or two-celled microconidia, and no septate and slightly curved macroconidia were observed. Meanwhile, in MEA-50HA oval microconidia and 3-5-septated and gently dorsiventrally curved macroconidia were observed [77,78]. Li et al. [76] suggested that a reduction in the cell wall integrity increased the size of conidia by altering turgor pressure. Although both types of conidia were observed in some culture media, microconidia were more abundant than macroconidia. The production of both micro and macroconidia is a usual phenomenon in Fusarium [76].
Our experiments showed that nutrient limitation was not effective in inducing sporulation of F. striatum. However, protein hydrolysate HA added at high concentrations has demonstrated its effectiveness in inducing sporulation.

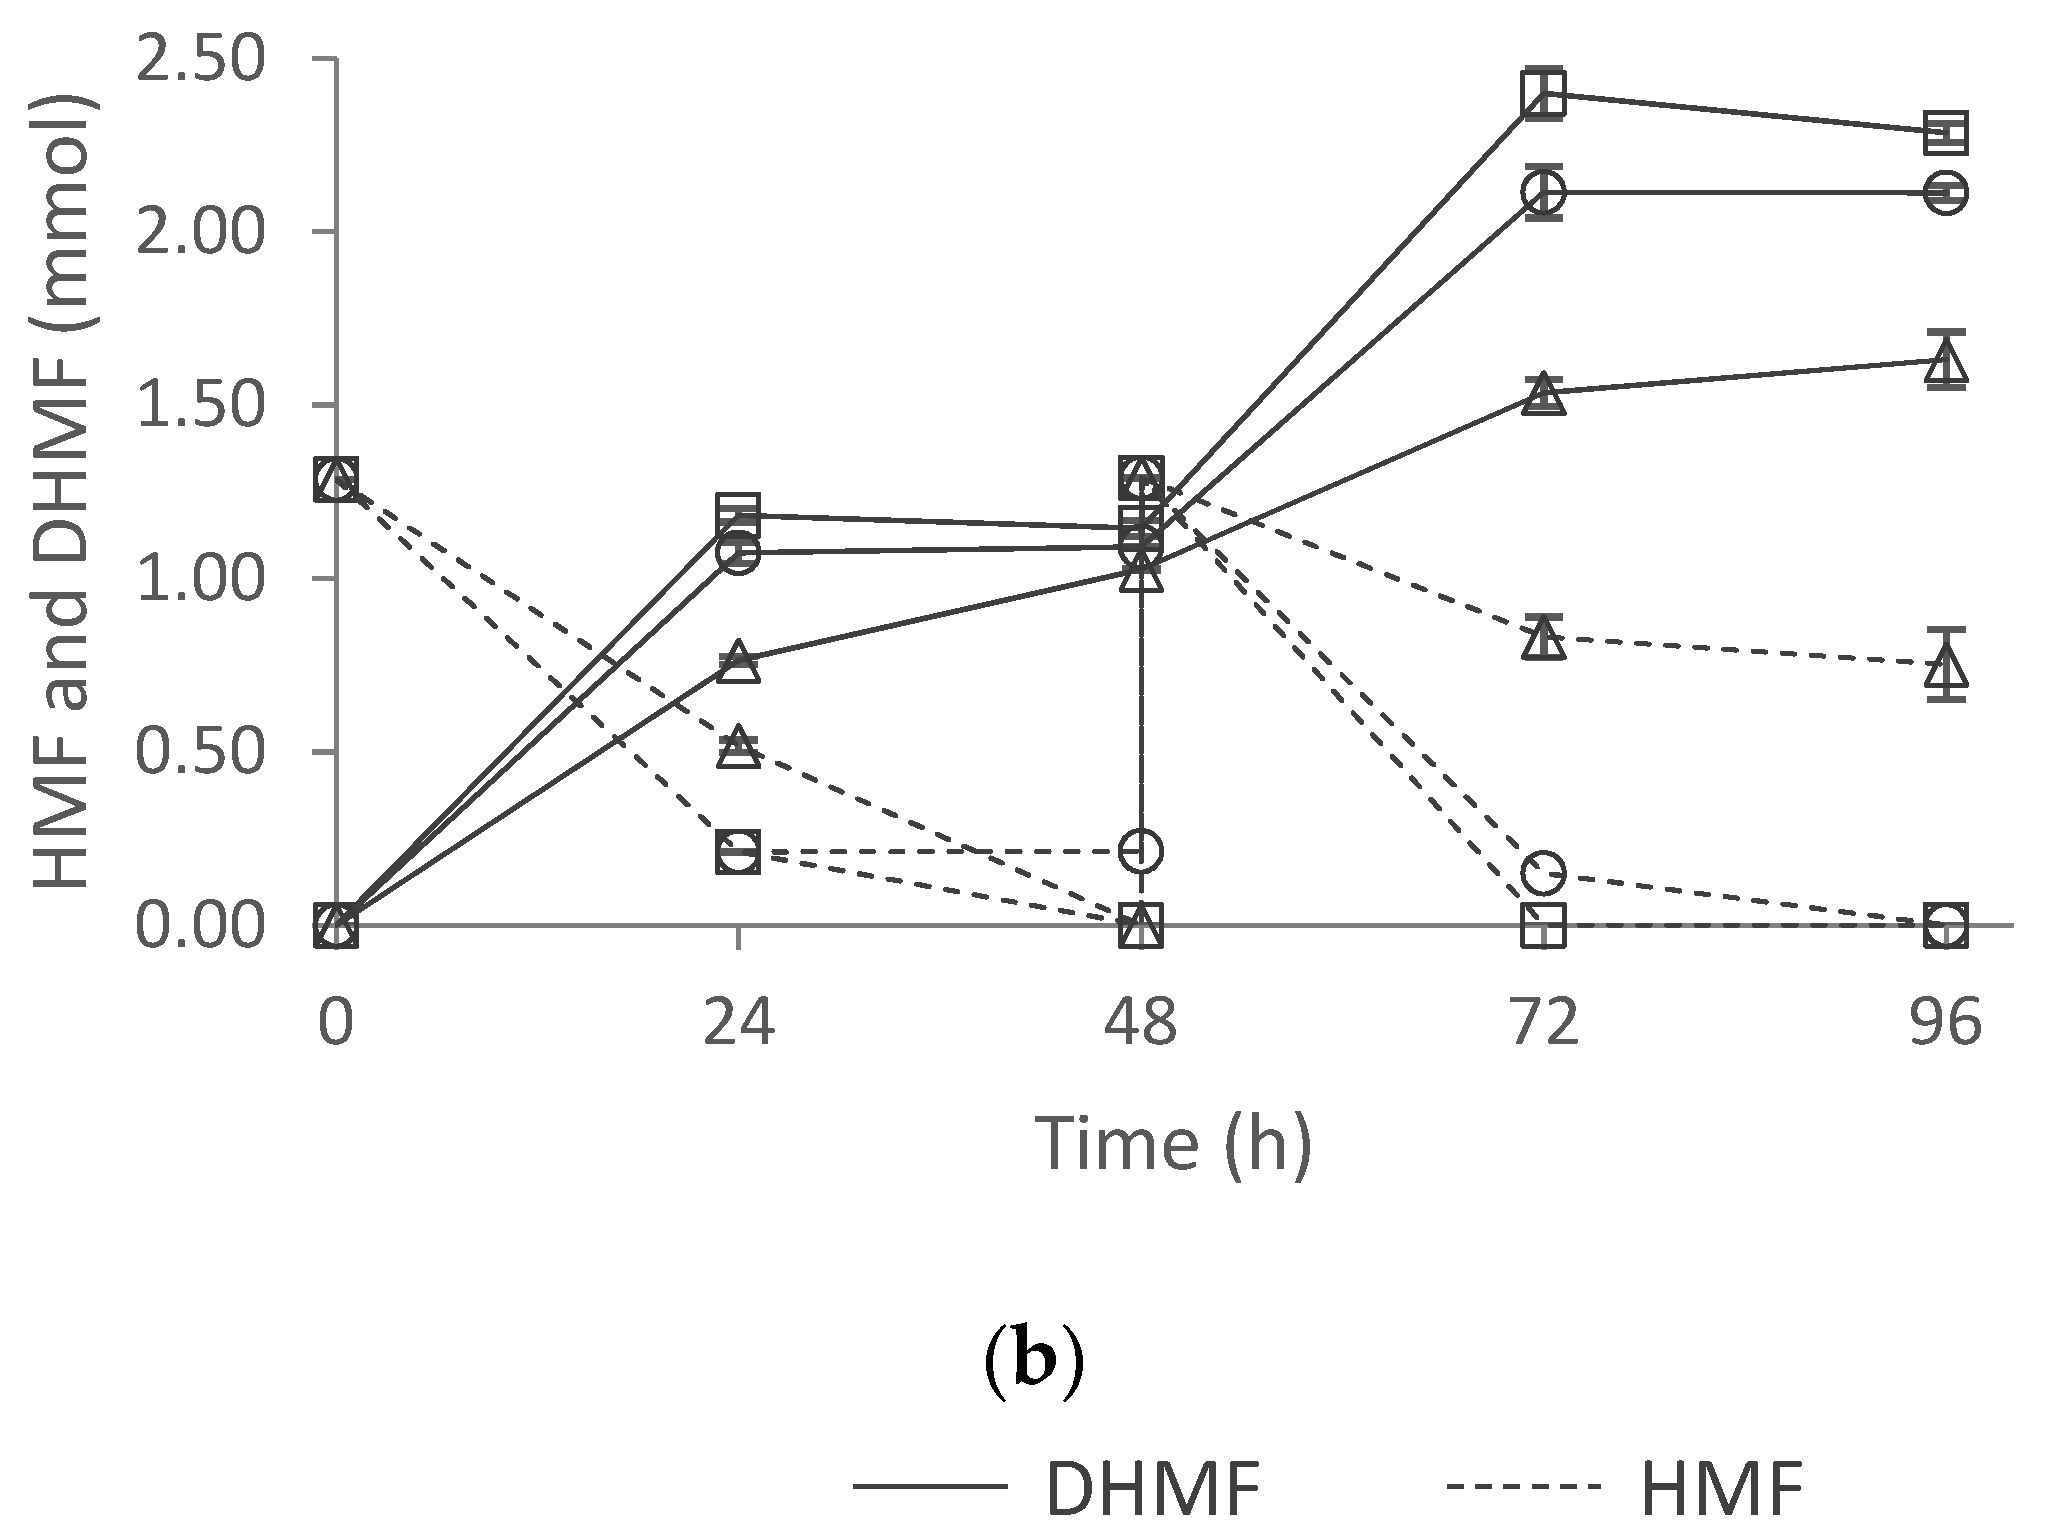
2.6.2. Effect of Inoculum Type in HMF Biotransformation

The effects of the inoculum type and the culture composition were evaluated in HMF biotransformation with F. striatum measuring the reduction in HMF to DHMF. Millán et al. [4] reported higher toxicity toward this filamentous fungus when an HMF concentration over 75 mM was added to the ME culture medium. Therefore, assessment of inoculum type and culture composition was carried out using a substrate feeding approach, which allowed to: (i) overcome the toxicity effect; and, (ii) increase final HMF derivatives concentration. The HMF and DHMF concentrations were monitored and HMF was added again 48 h after the first addition. The results of the biotransformation of 2.6 mmol of HMF under the different conditions are shown in Figure 6.
The effect of the two variables, inoculum type, and culture medium was determined with two-way ANOVA at 24 and 72 h of reaction time. The inoculum type did not show a significant effect on HMF reduction to DHMF. Nevertheless, the culture medium and the interaction of both variables had a significant effect. Although the same number of spores (2.0 × 10⁶ spores) and discs (three discs) were inoculated in the culture media tested, F. striatum cells grown in ME-50HA and ME-50HN media performed significantly better than in ME. It should be highlighted that the volume of the spore suspension required to inoculate the same number of spores was remarkably lower in the ME-50HA medium, resulting in a three-fold volume reduction (0.32 mL vs. 1 mL). This was due to the higher sporulation observed for F. striatum grown in MEA-50HA (Figure 6). In addition, the inoculation with spores led to significantly higher DHMF yields (>90%) compared to discs (75%) in the ME-50HA medium after both additions (yields at 72 h). In addition to this, it posed a 50% higher yield than using commercial peptones. The HMF metabolization rate by F. striatum grown in ME-50HA medium with an addition of 2.0 × 10⁶ spores is comparable to the one reported by Millán et al. [4] in ME with an addition of 4.0 × 10⁶ spores to biotransform 2.6 mmol of HMF. These observations indicate that culture medium supplementation with a low-cost protein hydrolysate, such as HA, sustains better fungal growth, requiring a smaller inoculum size. This will form a great opportunity to reduce costs. These results indicate that the culture media highly influenced HMF metabolization, which might be due to cell growth, and the inoculum type effect was dependent on the culture medium. Given the promising results obtained with the inoculation of spores in the ME-50HA medium, this inoculum type was selected for further experiments.

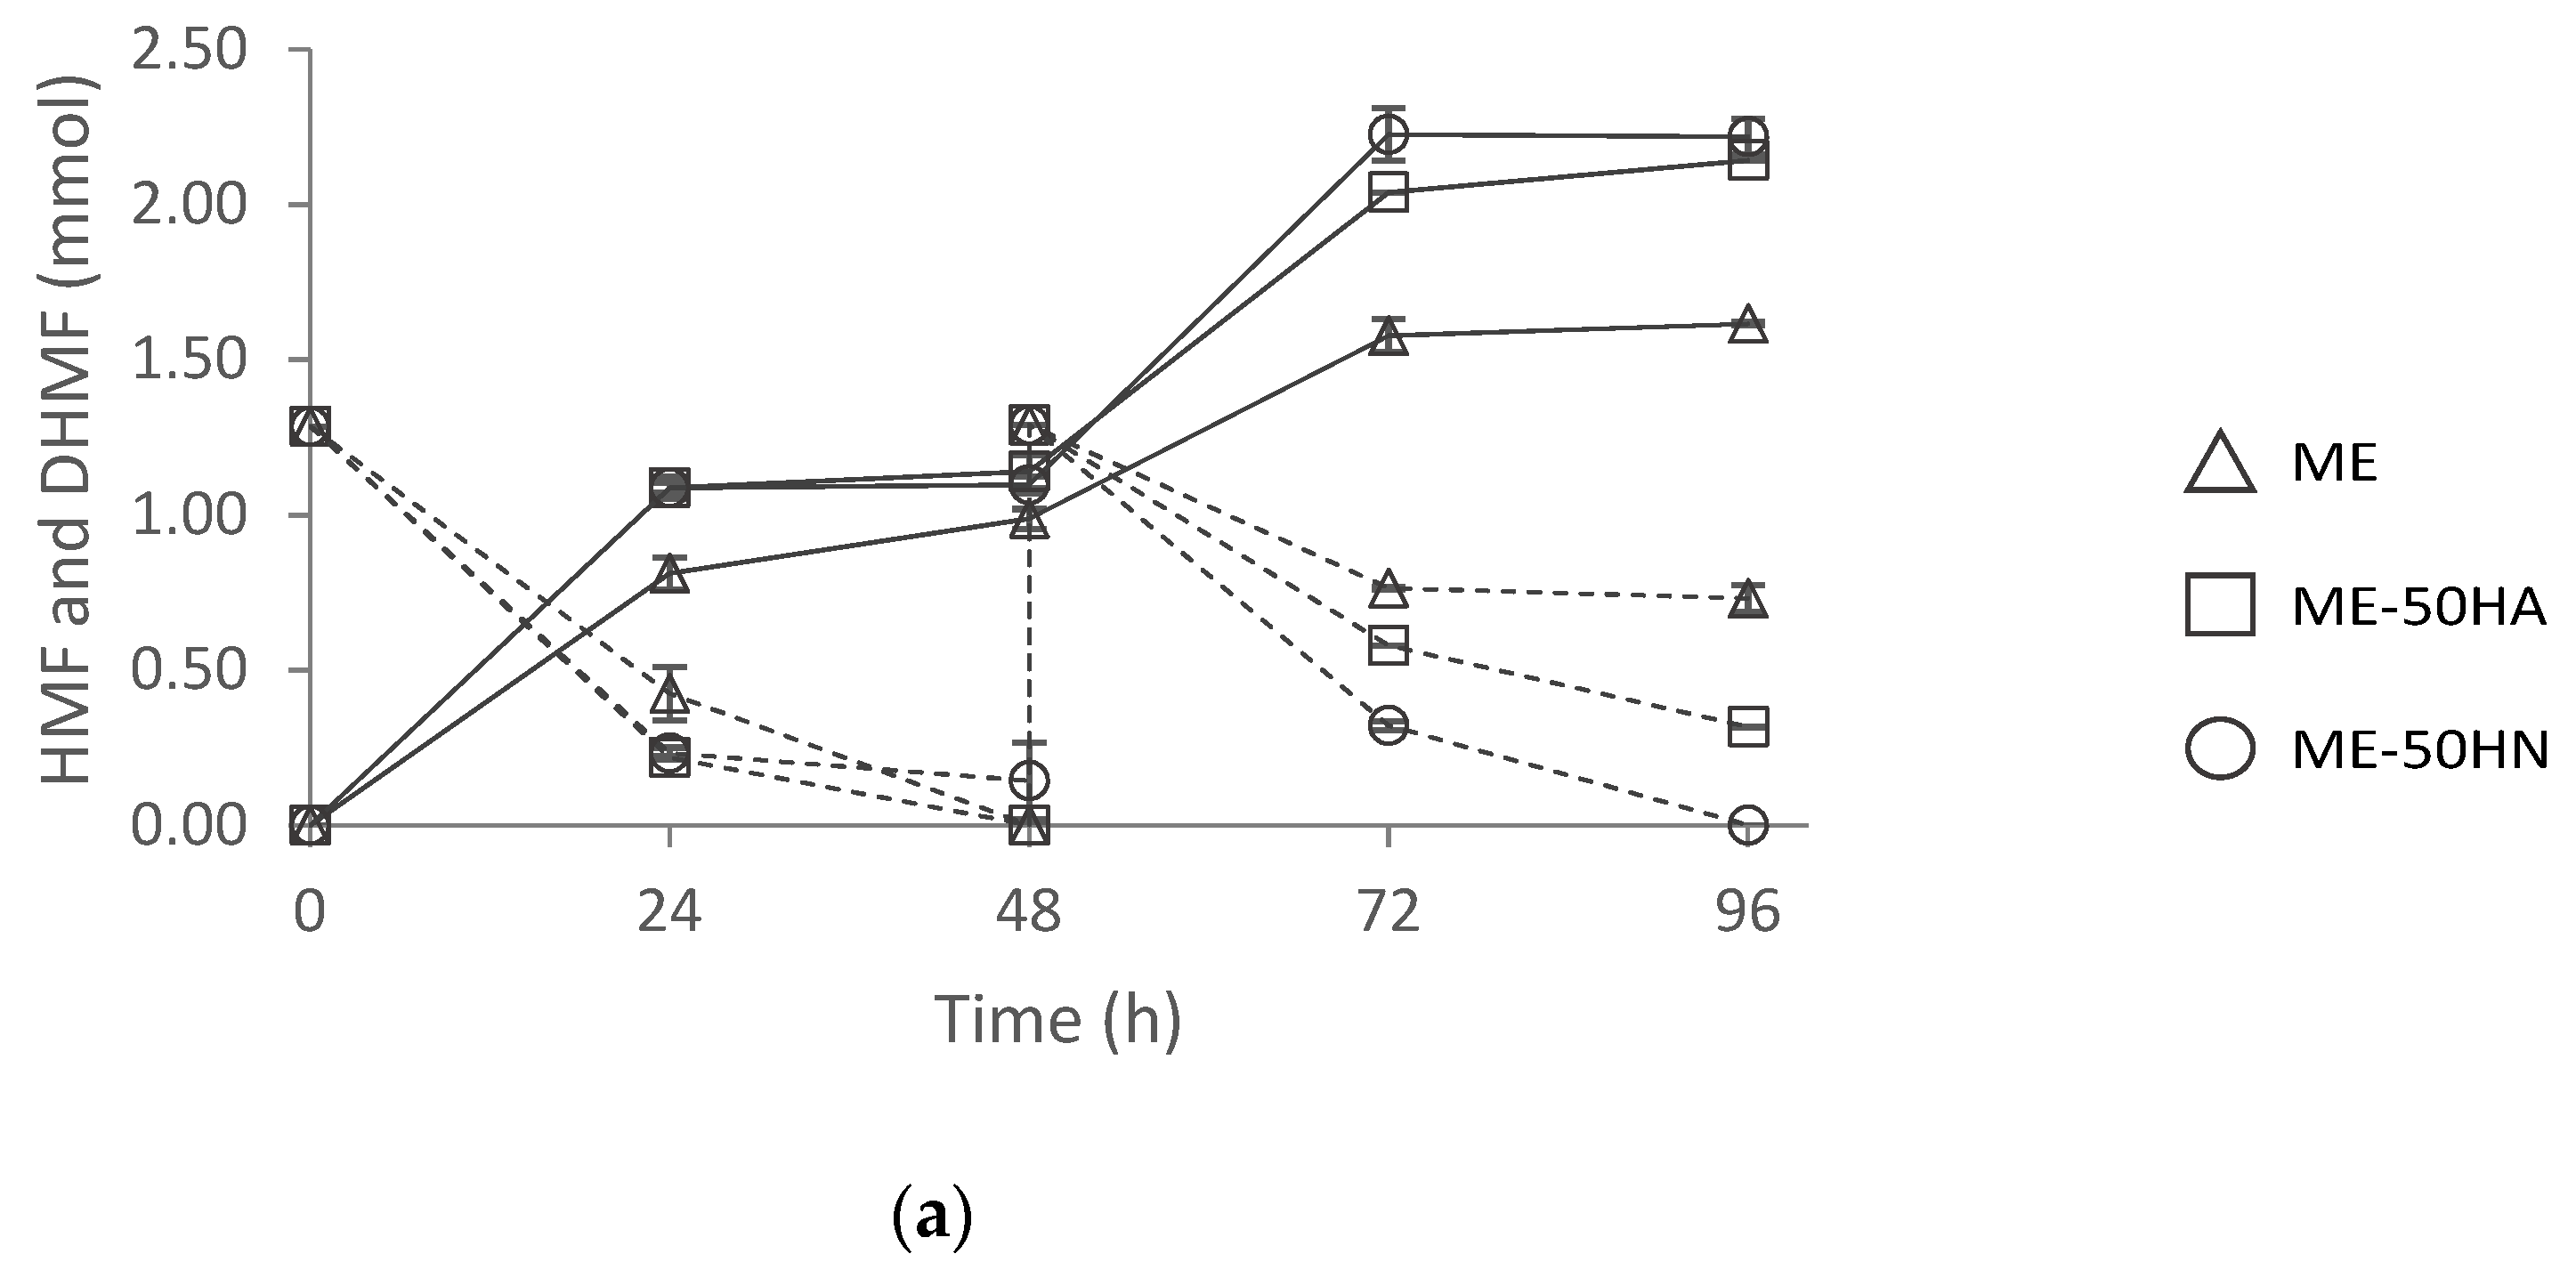
2.6.3. Effect of Nitrogen Source in HMF Biotransformation

In the previous substrate feeding approach, F. striatum showed the capacity to metabolize around 1 mmol within 24 h in ME-50HA and 0.8 mmol in ME. Based on these observations, four consecutive HMF additions of 45 mM (0.86 mmol) in time intervals of 24 h were carried out. For comparison purposes, all the culture media tested were inoculated with spores from fungi grown in MEA. The results are shown in Figure 7. F. striatum showed the capability to metabolize almost all the HMF in every addition performed. After 96 h of reaction, the remaining HMF ranged from 0.32 to 0.44 mmol, depending on the culture medium. It should be noted that HMF was never completely metabolized, leading to the successive accumulation of around 0.1 mmol every 24 h.
Within 72 h of the reaction, F. striatum reduced HMF to DHMF at a constant rate, achieving around 2.5 mmol of DHMF in the reaction media (Figure 7). After the fourth HMF addition, although HMF conversion rate was not reduced (90% of the HMF added was consumed), the DHMF production was slowed down, observing that only 30% was biotransformed to DHMF. HMF could have been used as carbon source or biotransformed to other non-detectable products with the methodology employed. These observations might be related to the F. striatum cells tolerance towards DHMF.
Although DHMF is reported to be nontoxic and highly tolerated by a wide range of microorganisms, the damage caused to proteins, nucleic acids, and cell organelles by the successive additions of HMF jointly with the high concentration of DHMF might have led to irreversible damage [5]. It could also be due to the long reaction times or the accumulation of DHMF inside the cells after long incubation times [80]. Statistical analysis showed that significant differences were observed after 72 h of the reaction time among the culture media. F. striatum grown in ME-HN and ME-HA culture media yielded more DHMF compared to the ME-WP culture medium. However, no significant differences were observed among ME, ME-50Meat, and ME-WP. This indicated that F. striatum was able to reduce HMF into DHMF without the addition of peptones, arguably due to the low toxicity of the HMF towards the cells at the concentration added. Note that although significantly better results were obtained in ME-HA and ME-HN, these differences are lower than in the previous assay, in which HMF was added at a concentration of 75 mM. Therefore, the addition of the hydrolysates HA and HN to the media increases the tolerance of F. striatum towards high concentrations of the substrate, but their positive effect on the DHMF production decreases for less toxic levels of HMF.

3. Materials and Methods

3.1. Materials

Inedible meat by-products, fines, were a kind gift provided by the local company Subcarn Echevarria S.L. (Cervera, Lleida, Spain). Fines were stored at 4 °C.
The enzymes Alcalase 2.4 L (EC 3.4.21.62) and Neutrase 0.8 L (EC 3.4.24.28), dithiothreitol, hydrochloric acid (HCl), serine standard, glycine, tryptone, acrylamide/bis-acrylamide, peptone from soybean, peptone Primatone® RLT, and β-mercaptoethanol were obtained from Sigma-Aldrich (St. Louis, MO, USA). Sodium hydroxide, (NaOH), sodium dodecyl sulfate (SDS), Coomassie blue G250, bromophenol blue, acetonitrile, methanol, and formic acid were from Fisher (Madrid, Spain). o-Phthaldialdehyde was from Across Organics (Geel, Belgium). Disodium tetraborate decahydrate and acetic acid were from Panreac (Barcelona, Spain). Bacteriological meat extract (A1710HA) was purchased from Biokar Diagnostics (Allonne, France). Glycerol was obtained from Vidrafoc (Barcelona, Spain).
All analytical reagents including the amino acid mixture (AAS18), hydroxyproline (Hyp), diglycine (Gly-Gly), reduced glutathione (GSH), glutathione disulfide (GSSG), bacitracin, insulin from bovine pancreas, and myoglobin from equine skeletal muscle were purchased from Sigma-Aldrich (Steinheim, Germany).
Malt extract and meat peptone were purchased from Biokar Diagnostics (Solabia Group, Pantin, France). Peptone from soybean was purchased from Acros Organics (Geel, Belgium). The 5-hydroxymethylfurfural (HMF) (98%) was purchased from Fluorochem Ltd. (Hadfield, UK). The 2,5-di(hydroxymethyl)furan (DHMF) (97%) was purchased from Apollo Scientific (Stockport, UK). Glucose, agar, 5-cetoxymethyl-2-furaldehyde, and 5-methylfurfural (MF), and 2,5-diformylfuran (DFF) were purchased from Sigma-Aldrich (St. Louis, MO, USA). Ethyl acetate was purchased from Honeywell (Morristown, NJ, USA). All chemicals used were of analytical grade or highest purity and were used as received without any further purification. All solutions were prepared with deionized water with a resistivity of 18.2 MΩ cm–1 or lower.

3.2. Methods

3.2.1. Raw Material and Protein Hydrolysates Preparation. Sample Pre-Treatment

Prior to enzymatic hydrolysis, the fines were dried at 40 °C for 48 h and sieved through a 2 mm screen (10 mesh). The homogenized material was partially defatted following the procedure previously selected as optimal (data not shown). Briefly, fines were mixed with water and the mixture was incubated at 80 °C in an orbital shaker (211DS Labnet International) for 4 h at 180 rpm, then cooled down to room temperature (RT) and centrifuged (Beckman Coulter Avanti® J-26 XP). After centrifugation, the fat and the interphase were easily removed while the remaining partially defatted fines (PDF) containing proteinaceous non-soluble solids were characterized and used for further hydrolysis experiments. All the fractions obtained were divided in plastic bags and kept in the fridge at 4 °C or in the freezer at −20 °C until further use.

3.2.2. Enzymatic Hydrolysis Optimization for Alcalase 2.4 L

To optimize the hydrolysis conditions for Alcalase 2.4 L, the effects of the variable’s enzyme/substrate (E/S) ratio (%), pH, and time were tested. The PDF fraction was mixed with deionized water with a solid/liquid (S/L) ratio of 1:4 (w/v). Solutions containing 250 g/L of PDF, resulting in a dry matter (DM) content concentration in a range of 9–12.5%, were prepared in NalgeneTM polypropylene centrifuge bottles with sealing caps. Mixture solutions were shaken vigorously and conditioned at 55 °C and 200 rpm for 30 min in a shaking incubator (211DS Labnet International). The pH of water solutions was adjusted to 8.0–8.3 by adding 6 M NaOH before enzyme addition. Then, the reaction was started by adding 0.026, 0.129, and 0.258 AU/g substrate (corresponding to 1, 5, and 10% of Alcalase 2.4 L (w/w)), and the reaction was conducted at 55 °C and 200 rpm. The reactions were carried out under controlled conditions of pH or not controlled. Under controlled conditions, the pH was manually adjusted every 2 h until 12 h at 8.0–8.3 by adding 1 M NaOH. Next, after 24 h, it was adjusted again if necessary. The process lasted for 24–48 h and aliquots were taken during the hydrolysis at specific times and inactivated at 95 °C for 15 min. Then, cooled hydrolysates were centrifuged at 13,000 rpm at RT for 10 min (Eppendorf® Centrifuge 5424R). Finally, the DH of the hydrolysates was determined. All the experiments were performed in triplicate.

3.2.3. Enzymatic Hydrolysis Optimization for Neutrase 0.8 L

To optimize hydrolysis conditions for Neutrase 0.8 L, the response surface methodology (RSM) was employed with a central composite design (CCD). According to the literature [47,50] four different variables, E/S ratio, hydrolysis time, initial pH value, and hydrolysis temperature were selected to perform one factor at a time (OFAT) experiments in order to choose their reasonable ranges. Fixed levels of factors were E/S ratio 5%, hydrolysis time 4 h, pH 7, and temperature 50 °C. Based on the data obtained performing OFAT experiments, the experimental ranges and the center point values of the independent variables were selected and are shown in Table 1. Therefore, a four-factor, five-level orthogonal CCD was developed, consisting of 29 treatments including 24 = 16 factorial points, 8 axial points (α = 1.48), and five replicates of the central point. DH was selected as the response to evaluate the OFAT and the combination of the independent variables. Several parameters have been estimated for the quadratic model and the behavior of the model was explained by a second-order polynomial Equation (2) [50]:
Y = b 0 + i = 1 4 b i X i + i = 1 4 b i i X i 2 + i = 1 3 j = i + 1 4 b i j X i X j
where Y represents the parameter to be modeled (DH); b0 is a constant coefficient; bi represents the regression coefficients for linear effects; bii represents the coefficients for quadratic effects, and bij represents the regression coefficients for interaction effects. Xi and Xj are the independent coded variables. The design was validated through the combination of parameters to obtain a higher response.
Each assay was composed of 500 mg of PDF in 50 mL of deionized water. The pH of the samples was adjusted with 1 M NaOH. Then, the samples were placed in a shaking incubator at 200 rpm in the specified conditions. The hydrolysis was terminated by inactivating the enzyme at 95 °C for 15 min. DH of the supernatants was determined after cooling down and centrifugation at 13,000 rpm for 10 min (Eppendorf® Centrifuge 5424R).

3.2.4. Protein Hydrolysates Production in Shake Flasks

Once optimal conditions were determined, peptones for further experiments were prepared with Alcalase 2.4 L and Neutrase 0.8 L. Solutions containing 250 g/L of PDF were incubated in the optimal conditions of temperature and agitation. After 30 min, pH was adjusted, and the enzyme was added. After the specific time required for each reaction, samples were incubated in a water bath at 95 °C for 15 min. After enzyme inactivation, the samples were centrifuged (Beckman Coulter Avanti® J-26 XP) for 30 min at 7000 rpm at RT and two fractions were collected: the sludge on the bottom and the supernatant containing the soluble protein hydrolysate. The supernatant was filtered using a Büchner funnel with filter paper and then it was freeze-dried under vacuum (Telstar LyoQuest) to obtain a dry powder. Final dry materials were termed HA–hydrolysate obtained with Alcalase 2.4 L and HN–hydrolysate obtained with Neutrase 0.8 L. The samples were kept in the fridge at 4 °C until further use.

3.2.5. Microorganisms, Media, and Inoculum Preparation

Fusarium striatum (UdL-TA-3.335) was obtained from to the culture collection of the food technology department (University of Lleida, Lleida, Spain).
F. striatum was maintained at 4 °C by replications on malt extract agar (MEA) containing the following (g/L): malt extract, 20; glucose, 20; peptone, 1; and agar, 15. Prior to the experiments, the strains were grown in MEA at 28 °C for seven days for activation.

3.2.6. Nitrogen Dose and Source Effect on F. striatum Sporulation and HMF Biotransformation

Sporulation
The induction of F. striatum sporulation was tested in seven different media, according to Table 2. The activated fungus was inoculated in all the culture media and incubated at 28 °C in the presence or the absence of visible light. Growth was monitored visually after 3 and 6 days. After 10 days of growth, spores were counted in a Neubauer chamber.
HMF biotransformation
(a)
Substrate feeding with 75 mM HMF
In a standard experiment, 3 discs of 8 mm or a suspension of spores (2.0 × 10⁶ spores/mL) of F. striatum were inoculated into flaks containing 15 mL of culture media according to Table 3. The culture medium ME was inoculated with spores from MEA, ME-50HA with spores from MEA-50HA, and ME-50HN with spores from MEA-50HN. The pH of all the media was adjusted to 7 with 1 M NaOH before autoclaving at 121 °C for 20 min. After 3 days at 28 °C and 160 rpm, HMF was added to obtain a concentration of 75 mM. Forty-eight hours after the first addition, a second HMF addition was performed.
(b)
Substrate feeding with 45 mM HMF.
In a standard experiment, a suspension of spores (2.0 × 10⁶ spores/mL) of F. striatum was inoculated into flasks containing 15 mL of culture media according to Table 4. All the culture media tested were inoculated with spores from fungus grown in MEA. The pH of all the media was adjusted with 1 M NaOH at 7 before autoclaving at 121 °C for 20 min. After 3 days of growth at 28 °C and 160 rpm, HMF was added to obtain a concentration of 45 mM. Subsequent HMF additions after 24, 48, and 72 h from the first addition were performed.

3.2.7. Analyses

Degree of Hydrolysis (DH)
The degree of hydrolysis (DH) was measured spectrophotometrically using o-phthaldialdehyde (OPA) as reactant following the method described by Nielsen et al. [81] with slight modifications or, alternatively, by the pH-stat method [82].
OPA reagent was prepared by dissolving 7.62 g of disodium tetraborate decahydrate and 200 mg of SDS in 150 mL of deionized water. Once reagents were completely dissolved, 160 mg of OPA, previously dissolved in 4 mL of ethanol, were transferred quantitatively to the solution mentioned above. Finally, 176 mg of dithiothreitol were added and the solution was made up to 200 mL with deionized water. Serine standard was prepared at a concentration of 0.1 mg/mL. For the measurements, the volumes were reduced to 120 µL of sample and 900 µL of OPA reagent. The method is based on the reaction of alfa amino (α-NH) groups with OPA, which gives a compound detectable at λ = 340 nm in a UV–Vis spectrophotometer. The reaction can be conducted at RT in a matter of minutes [83].
To calculate the DH, the following formula was employed (3):
D H   ( % ) = h h t o t × 100
where h is the number of hydrolyzed peptide bonds and htot is the total number of peptide bonds per protein equivalent (estimation of 7.6 meqv/g). The value of htot was not calculated for PDF. An established value by Adler-Nissen [82] for meat samples was used.
DH according to the pH-stat method was calculated as follows (4):
D H   ( % ) = h h t o t × 100 = B   ×   N b M P   ×   α   ×   h t o t × 100
where B is the added base volume (mL), Nb is the normality of the base, MP is the mass (g) of initial protein (N × 6.25), α is the average degree of dissociation of α-NH groups in the protein substrate (0.897 at pH 8 and 55 °C), and htot is the total number of peptide bonds in the substrate (estimation of 7.6 meqv/g).
Macrocomponents, amino acid composition and elementary analysis
The main components of the PDF fraction were characterized; thus, the percentages of moisture, fat, ash, and nitrogen were determined. The amino acid content of samples was determined on freeze-dried and pulverized material. Physiological elements as Na, Mg, P, S, K, Ca, Mn, Fe, Cu, and Zn were also measured. Details of the analytical methods applied can be found in the Supplementary Data.
Estimation of molecular weight distribution—SEC
Peptide molecular weight (MW) distribution of hydrolysates and commercial protein hydrolysates was analyzed according to the previous method reported by Fu et al. [84]. Briefly, size exclusion chromatography was carried out using an ultra-high performance liquid chromatography (UHPLC) system (Thermo Scientific Dionex Ultimate 3000, Denmark) with a Phenomenex BioSep™ SEC-S2000 column (300 mm × 4.6 mm) (Torrance, CA, USA). Ten µL of each diluted (1 mg/mL) and filtered hydrolysate were injected. The separation was under isocratic elution using 30% acetonitrile with 0.1% trifluoroacetic acid (TFA) at a flow rate of 0.2 mL/min and detection at 214 nm. MW standard curves were plotted using the standards Gly-Gly (132 Da), GSH (307 Da), GSSG (613 Da), bacitracin (1423 Da), insulin (5733 Da), and myoglobin (17600 Da). Data were processed and acquired via Chromeleon 7.0 Chromatography Data System software.
GC-FID analysis
HMF and DHMF were identified and quantified by GC-FID following the methodology previously described by Millán et al. [4]. Briefly, aqueous aliquots were extracted with ethyl acetate. Analysis was carried out with an Agilent 7890GC (Agilent Technologies, Palo Alto, CA, USA) coupled to an FID detector (Agilent Technologies, Palo Alto, CA, USA). An FFAP column (30 m × 0.25 mm i.d.; 0.25 µm film thickness) from Agilent was used at a constant flow using hydrogen as carrier gas. Injector temperature was 230 °C and the oven program was set as follows: initial temperature of 100 °C held for 1 min, increased to 240 °C by a ramp of 20 °C/min, and held for 5 min. Calibration curves were performed periodically for the quantification of the compounds, and 5-acetoxymethyl-2-furaldehyde was used as internal standard.
Statistical analysis
All the experiments were performed at least in duplicate. The presented results are the mean of replicates, and the standard deviations are shown as error bars in the figures. Data handling was performed using the Excel software package (Microsoft Excel, 2013). Statistical analysis was carried out using JMP Pro 14 statistical software (Statistical Discovery™ from SAS, Cary, NC, USA). Tukey’s HSD test with a significance level of 0.05 was used for means comparison.

4. Conclusions

In the present study, two low-cost protein hydrolysates prepared in our laboratory were evaluated as a nitrogen source and compared with commercial ones in the biocatalytic transformation of HMF by F. striatum.
The hydrolysates prepared from PDF with Alcalase 2.4 L and Neutrase 0.8 L presented significantly higher protein content and lower ash and fat content than PDF, which adds stability during storage. The SEC profile revealed that both hydrolysates contain a large proportion of low molecular weight peptides (<5 kDa). Albeit a similarity was revealed between PDF and the hydrolysates for most of the amino acids, the hydrolysates present a balanced amino acid composition.
The addition of HA stimulated sporulation significantly. Moreover, it supports better fungal growth, increasing the tolerance toward high HMF concentrations. Finally, using these hydrolysates as a nitrogen source allowed higher sporulation of the fungus and, therefore, the use of a lower volume of inoculum (three-fold), obtaining a DHMF yield > 90%, 50% higher than using commercial peptones.
Therefore, we have demonstrated that the animal-derived protein hydrolysates may be a promising alternative to commercial ones in HMF biotransformation using Fusarium whole cells as biocatalyst. In addition, the nitrogen source highly influences the metabolization of HMF if it represents a substantial part of the fungal growth medium.

Supplementary Materials

The following supporting information can be downloaded at: https://www.mdpi.com/article/10.3390/catal12080839/s1, Methods: Macrocomponents and elementary analysis methods, Amino acid composition; Figure S1: Response surface plots showing the effects of independent variables on DH in enzymatic hydrolysis of PDF with enzyme Neutrase 0.8 L: (a) E/S ratio vs. time; (b) temperature vs. initial pH; (c) temperature vs. E/S ratio; (d) temperature vs. time; (e) initial pH vs. E/S ratio, and (f) initial pH vs. time.; Figure S2: Profiles for the predicted DH and the desirability level for different factors for optimum DH for hydrolysis of PDF with Neutrase 0.8 L; Figure S3: Fusarium striatum growth in Petri dishes containing different culture media after 3 and 6 days; Figure S4: Cultural and morphological characters of F. striatum after 10 days in different culture media; Table S1: CCD for the enzymatic hydrolysis of PDF fraction with enzyme Neutrase 0.8 L; Table S2: Analysis of variance (ANOVA) for the response surface quadratic model; Table S3: Effect test of the independent variables and their interactions; Table S4: Proximate elemental composition of fines, PDF, freeze-dried hydrolysates, and precipitates based on DM; Table S5: Amino acid composition (mg amino acid/g sample) and total amino acid content expressed as mean ± SD. References [63,64,65] are cited in the supplementary materials.

Author Contributions

Conception and design of the research, G.V., J.E. and R.C.-G.; conduct the experiments and medium preparation, D.C., G.V. and J.E.; HMF biotransformation experiments, A.M.A., D.C. and R.C.-G.; determination of the molecular weight distribution of the hydrolysates, D.C., K.V.G., P.C.L., Q.L. and R.L.; hydrolysates data analysis, D.C., G.V. and J.E.; writing—review and editing, A.M.A., D.C., G.V., J.E. and R.C.-G.; funding acquisition, G.V., J.E. and R.C.-G. All authors have read and agreed to the published version of the manuscript.

Funding

This research was funded by the Spanish Ministry of Science and Innovation PID2019-110735RB-C21, by the Catalan government, 2017 SGR 828, and by the University of Lleida “Ajuts per a personal predoctoral de la UdL en formació i ajuts Jade Plus” awarded to Diana Cosovanu.

Data Availability Statement

Not applicable.

Acknowledgments

The authors would like to thank the company Subcarn Echevarria S.L. (Cervera, Lleida, Spain) for the kind donation of the inedible meat by-products, fines, used to perform all the experiments. The authors are also grateful to the DBA center for providing the research facilities and equipment. DBA is a certified agent TECNIO in the category of technology developers from the Government of Catalonia. The authors would like to thank the Catalan Government for the quality accreditation given to the Agricultural Biotechnology and Bioeconomy Unit (2017 SGR 828).

Conflicts of Interest

The authors declare no conflict of interest. The funders had no role in the design of the study; in the collection, analyses, or interpretation of data; in the writing of the manuscript, or in the decision to publish the results.

References

  1. Hu, L.; Lin, L.; Wu, Z.; Zhou, S.; Liu, S. Recent Advances in Catalytic Transformation of Biomass-Derived 5-Hydroxymethylfurfural into the Innovative Fuels and Chemicals. Renew. Sustain. Energy Rev. 2017, 74, 230–257. [Google Scholar] [CrossRef]
  2. Lalanne, L.; Nyanhongo, G.S.; Guebitz, G.M.; Pellis, A. Biotechnological Production and High Potential of Furan-Based Renewable Monomers and Polymers. Biotechnol. Adv. 2021, 107707. [Google Scholar] [CrossRef] [PubMed]
  3. Hu, L.; Xu, J.; Zhou, S.; He, A.; Tang, X.; Lin, L.; Xu, J.; Zhao, Y. Catalytic Advances in the Production and Application of Biomass-Derived 2,5-Dihydroxymethylfuran. ACS Catal. 2018, 8, 2959–2980. [Google Scholar] [CrossRef]
  4. Millán, A.; Sala, N.; Torres, M.; Canela-Garayoa, R. Biocatalytic Transformation of 5-Hydroxymethylfurfural into 2,5-Di(Hydroxymethyl)Furan by a Newly Isolated Fusarium striatum Strain. Catalysts 2021, 11, 216. [Google Scholar] [CrossRef]
  5. Domínguez de María, P.; Guajardo, N. Biocatalytic Valorization of Furans: Opportunities for Inherently Unstable Substrates. ChemSusChem 2017, 10, 4123–4134. [Google Scholar] [CrossRef] [PubMed]
  6. Chang, S.; He, X.; Li, B.; Pan, X. Improved Bio-Synthesis of 2,5-Bis(Hydroxymethyl)Furan by Burkholderia Contaminans NJPI-15 with Co-Substrate. Front. Chem. 2021, 9, 20. [Google Scholar] [CrossRef]
  7. Chen, D.; Cang, R.; Zhang, Z.D.; Huang, H.; Zhang, Z.G.; Ji, X.J. Efficient Reduction of 5-Hydroxymethylfurfural to 2, 5-Bis (Hydroxymethyl) Furan by a Fungal Whole-Cell Biocatalyst. Mol. Catal. 2021, 500, 111341. [Google Scholar] [CrossRef]
  8. He, Y.C.; Jiang, C.X.; Chong, G.G.; Di, J.H.; Ma, C.L. Biological Synthesis of 2,5-Bis(Hydroxymethyl)Furan from Biomass-Derived 5-Hydroxymethylfurfural by E. Coli CCZU-K14 Whole Cells. Bioresour. Technol. 2018, 247, 1215–1220. [Google Scholar] [CrossRef] [PubMed]
  9. Pan, X.; Wu, S.; Yao, D.; Liu, L.; Zhang, L.; Yao, Z.; Pan, Y.; Chang, S.; Li, B. Efficient Biotransformation of 5-Hydroxymethylfurfural to 5-Hydroxymethyl-2-Furancarboxylic Acid by a New Whole-Cell Biocatalyst Pseudomonas aeruginosa PC-1. React. Chem. Eng. 2020, 5, 1397. [Google Scholar] [CrossRef]
  10. Paukner, R.; Staudigl, P.; Choosri, W.; Haltrich, D.; Leitner, C. Expression, Purification, and Characterization of Galactose Oxidase of Fusarium sambucinum in E. coli. Protein Expr. Purif. 2015, 108, 73–79. [Google Scholar] [CrossRef] [PubMed] [Green Version]
  11. Xu, Z.H.; Cheng, A.D.; Xing, X.P.; Zong, M.H.; Bai, Y.P.; Li, N. Improved Synthesis of 2,5-Bis(Hydroxymethyl)Furan from 5-Hydroxymethylfurfural Using Acclimatized Whole Cells Entrapped in Calcium Alginate. Bioresour. Technol. 2018, 262, 177–183. [Google Scholar] [CrossRef]
  12. Yuan, H.; Li, J.; Shin, H.-D.; Du, G.; Chen, J.; Shi, Z.; Liu, L. Improved Production of 2,5-Furandicarboxylic Acid by Overexpression of 5-Hydroxymethylfurfural Oxidase and 5-Hydroxymethylfurfural/Furfural Oxidoreductase in Raoultella ornithinolytica BF60. Bioresour. Technol. 2018, 247, 1184–1188. [Google Scholar] [CrossRef] [PubMed]
  13. Li, Y.M.; Zhang, X.Y.; Li, N.; Xu, P.; Lou, W.Y.; Zong, M.H. Biocatalytic Reduction of HMF to 2,5-Bis(Hydroxymethyl)Furan by HMF-Tolerant Whole Cells. ChemSusChem 2017, 10, 372–378. [Google Scholar] [CrossRef] [PubMed]
  14. Liu, Z.L.; Slininger, P.J.; Dien, B.S.; Berhow, M.A.; Kurtzman, C.P.; Gorsich, S.W. Adaptive Response of Yeasts to Furfural and 5-Hydroxymethylfurfural and New Chemical Evidence for HMF Conversion to 2,5-Bis-Hydroxymethylfuran. J. Ind. Microbiol. Biotechnol. 2004, 31, 345–352. [Google Scholar] [CrossRef] [PubMed]
  15. Ra, C.H.; Jeong, G.T.; Shin, M.K.; Kim, S.K. Biotransformation of 5-Hydroxymethylfurfural (HMF) by Scheffersomyces stipitis during Ethanol Fermentation of Hydrolysate of the Seaweed Gelidium amansii. Bioresour. Technol. 2013, 140, 421–425. [Google Scholar] [CrossRef] [PubMed]
  16. Feldman, D.; Kowbel, D.J.; Glass, N.L.; Yarden, O.; Hadar, Y. Detoxification of 5-Hydroxymethylfurfural by the Pleurotus Ostreatus Lignolytic Enzymes Aryl Alcohol Oxidase and Dehydrogenase. Biotechnol. Biofuels 2015, 8, 63. [Google Scholar] [CrossRef] [Green Version]
  17. Ran, H.; Zhang, J.; Gao, Q.; Lin, Z.; Bao, J. Analysis of Biodegradation Performance of Furfural and 5-Hydroxymethylfurfural by Amorphotheca resinae ZN1. Biotechnol. Biofuels 2014, 7, 51. [Google Scholar] [CrossRef] [PubMed] [Green Version]
  18. Millán Acosta, A.; Cosovanu, D.; Cabañeros López, P.; Tjalfe Thomsen, S.; Gernaey, K.V.; Canela-Garayoa, R. Co-Cultivation of a Novel Fusarium striatum Strain and a Xylose Consuming Saccharomyces cerevisiae Yields an Efficient Process for Simultaneous Detoxification and Fermentation of Lignocellulosic Hydrolysates. Chem. Eng. J. 2021, 426, 131575. [Google Scholar] [CrossRef]
  19. Parrado, J.; Rodriguez-Morgado, B.; Tejada, M.; Hernandez, T.; Garcia, C. Proteomic Analysis of Enzyme Production by Bacillus Licheniformis Using Different Feather Wastes as the Sole Fermentation Media. Enzyme Microb. Technol. 2014, 57, 1–7. [Google Scholar] [CrossRef] [PubMed]
  20. Kampen, W.H. Nutritional Requirements in Fermentation Processes. In Fermentation and Biochemical Engineering Handbook: Principles, Process Design, and Equipment; Vogel, H.C., Todaro, C.M., Eds.; Elsevier Inc.: Amsterdam, The Netherlands, 2014; pp. 37–57. ISBN 9781455730469. [Google Scholar]
  21. Godan, T.K.; Rajesh, R.O.; Loreni, P.C.; Kumar Rai, A.; Sahoo, D.; Pandey, A.; Binod, P. Biotransformation of 5-Hydroxymethylfurfural by Acinetobacter Oleivorans S27 for the Synthesis of Furan Derivatives. Bioresour. Technol. 2019, 282, 88–93. [Google Scholar] [CrossRef] [PubMed]
  22. Hossain, G.S.; Yuan, H.; Li, J.; Shin, H.-D.; Wang, M.; Du, G.; Chen, J.; Liu, L. Metabolic Engineering of Raoultella ornithinolytica BF60 for Production of 2,5-Furandicarboxylic Acid from 5-Hydroxymethylfurfural. Appl. Environ. Microbiol. 2017, 83, e02312-16. [Google Scholar] [CrossRef] [PubMed] [Green Version]
  23. Koopman, F.; Wierckx, N.; de Winde, J.H.; Ruijssenaars, H.J. Efficient Whole-Cell Biotransformation of 5-(Hydroxymethyl)Furfural into FDCA, 2,5-Furandicarboxylic Acid. Bioresour. Technol. 2010, 101, 6291–6296. [Google Scholar] [CrossRef] [PubMed]
  24. Zhang, X.Y.; Zong, M.H.; Li, N. Whole-Cell Biocatalytic Selective Oxidation of 5-Hydroxymethylfurfural to 5-Hydroxymethyl-2-Furancarboxylic Acid. Green Chem. 2017, 19, 4544–4551. [Google Scholar] [CrossRef]
  25. Bhaskar, N.; Modi, V.K.; Govindaraju, K.; Radha, C.; Lalitha, R.G. Utilization of Meat Industry by Products: Protein Hydrolysate from Sheep Visceral Mass. Bioresour. Technol. 2007, 98, 388–394. [Google Scholar] [CrossRef] [PubMed]
  26. Šližyte, R.; Daukšas, E.; Falch, E.; Storrø, I.; Rustad, T. Characteristics of Protein Fractions Generated from Hydrolysed Cod (Gadus morhua) by-Products. Process Biochem. 2005, 40, 2021–2033. [Google Scholar] [CrossRef]
  27. Šližyte, R.; Daukšas, E.; Falch, E.; Storrø, I.; Rustad, T. Yield and Composition of Different Fractions Obtained after Enzymatic Hydrolysis of Cod (Gadus morhua) by-Products. Process Biochem. 2005, 40, 1415–1424. [Google Scholar] [CrossRef]
  28. Nilsang, S.; Lertsiri, S.; Suphantharika, M.; Assavanig, A. Optimization of Enzymatic Hydrolysis of Fish Soluble Concentrate by Commercial Proteases. J. Food Eng. 2005, 70, 571–578. [Google Scholar] [CrossRef]
  29. Benjakul, S.; Morrissey, M.T. Protein Hydrolysates from Pacific Whiting Solid Wastes. J. Agric. Food Chem. 1997, 45, 3423–3430. [Google Scholar] [CrossRef]
  30. Ovissipour, M.; Rasco, B.; Shiroodi, S.G.; Modanlow, M.; Gholami, S.; Nemati, M. Antioxidant Activity of Protein Hydrolysates from Whole Anchovy Sprat (Clupeonella engrauliformis) Prepared Using Endogenous Enzymes and Commercial Proteases. J. Sci. Food Agric. 2013, 93, 1718–1726. [Google Scholar] [CrossRef] [PubMed]
  31. de Carvalho, N.C.; Pessato, T.B.; Fernandes, L.G.R.; de Lima Zollner, R.; Netto, F.M. Physicochemical Characteristics and Antigenicity of Whey Protein Hydrolysates Obtained with and without PH Control. Int. Dairy J. 2017, 71, 24–34. [Google Scholar] [CrossRef]
  32. Sousa, R.; Lopes, G.P.; Pinto, G.A.; Almeida, P.I.F.; Giordano, R.C. GMC-Fuzzy Control of PH during Enzymatic Hydrolysis of Cheese Whey Proteins. Comput. Chem. Eng. 2004, 28, 1661–1672. [Google Scholar] [CrossRef]
  33. Guérard, F.; Dufossé, L.; De La Broise, D.; Binet, A. Enzymatic Hydrolysis of Proteins from Yellowfin Tuna (Thunnus albacares) Wastes Using Alcalase. J. Mol. Catal. B Enzym. 2001, 11, 1051–1059. [Google Scholar] [CrossRef]
  34. Qi, W.; He, Z. Enzymatic Hydrolysis of Protein: Mechanism and Kinetic Model. Front. Chem. China 2006, 1, 308–314. [Google Scholar] [CrossRef]
  35. Valencia, P.; Pinto, M.; Almonacid, S. Identification of the Key Mechanisms Involved in the Hydrolysis of Fish Protein by Alcalase. Process Biochem. 2014, 49, 258–264. [Google Scholar] [CrossRef]
  36. Lapeña, D.; Vuoristo, K.S.; Kosa, G.; Horn, S.J.; Eijsink, V.G.H. Comparative Assessment of Enzymatic Hydrolysis for Valorization of Different Protein-Rich Industrial Byproducts. J. Agric. Food Chem. 2018, 66, 9738–9749. [Google Scholar] [CrossRef]
  37. Noman, A.; Xu, Y.; AL-Bukhaiti, W.Q.; Abed, S.M.; Ali, A.H.; Ramadhan, A.H.; Xia, W. Influence of Enzymatic Hydrolysis Conditions on the Degree of Hydrolysis and Functional Properties of Protein Hydrolysate Obtained from Chinese Sturgeon (Acipenser sinensis) by Using Papain Enzyme. Process Biochem. 2018, 67, 19–28. [Google Scholar] [CrossRef]
  38. Liaset, B.; Lied, E.; Espe, M. Enzymatic Hydrolysis of By-Products from the Fish-Filleting Industry; Chemical Characterisation and Nutritional Evaluation. J. Sci. Food Agric. 2000, 80, 581–589. [Google Scholar] [CrossRef]
  39. Piazza, G.J.; Garcia, R.A. Proteolysis of Meat and Bone Meal to Increase Utilisation. Anim. Prod. Sci. 2014, 54, 200. [Google Scholar] [CrossRef] [Green Version]
  40. Webster, J.D.; Ledward, D.A.; Lawrie, R.A. Protein Hydrolysates from Meat Industry By-Products. Meat Sci. 1982, 7, 147–157. [Google Scholar] [CrossRef]
  41. Kurozawa, L.E.; Park, K.J.; Hubinger, M.D. Optimization of the Enzymatic Hydrolysis of Chicken Meat Using Response Surface Methodology. J. Food Sci. 2008, 73, C405–C412. [Google Scholar] [CrossRef]
  42. Bhaskar, N.; Benila, T.; Radha, C.; Lalitha, R.G. Optimization of Enzymatic Hydrolysis of Visceral Waste Proteins of Catla (Catla catla) for Preparing Protein Hydrolysate Using a Commercial Protease. Bioresour. Technol. 2008, 99, 335–343. [Google Scholar] [CrossRef] [PubMed]
  43. Bhaskar, N.; Mahendrakar, N.S. Protein Hydrolysate from Visceral Waste Proteins of Catla (Catla catla): Optimization of Hydrolysis Conditions for a Commercial Neutral Protease. Bioresour. Technol. 2008, 99, 4105–4111. [Google Scholar] [CrossRef] [PubMed]
  44. de Queiroz, A.L.M.; Bezerra, T.K.A.; de Freitas Pereira, S.; da Silva, M.E.C.; de Almeida Gadelha, C.A.; Gadelha, T.S.; Pacheco, M.T.B.; Madruga, M.S. Functional Protein Hydrolysate from Goat By-Products: Optimization and Characterization Studies. Food Biosci. 2017, 20, 19–27. [Google Scholar] [CrossRef]
  45. Dey, S.S.; Dora, K.C. Optimization of the Production of Shrimp Waste Protein Hydrolysate Using Microbial Proteases Adopting Response Surface Methodology. J. Food Sci. Technol. 2014, 51, 16–24. [Google Scholar] [CrossRef] [PubMed] [Green Version]
  46. Jiao, J.; Li, Z.G.; Gai, Q.Y.; Li, X.J.; Wei, F.Y.; Fu, Y.J.; Ma, W. Microwave-Assisted Aqueous Enzymatic Extraction of Oil from Pumpkin Seeds and Evaluation of Its Physicochemical Properties, Fatty Acid Compositions and Antioxidant Activities. Food Chem. 2014, 147, 17–24. [Google Scholar] [CrossRef]
  47. Yusoff, M.M.; Gordon, M.H.; Ezeh, O.; Niranjan, K. Aqueous Enzymatic Extraction of Moringa Oleifera Oil. Food Chem. 2016, 211, 400–408. [Google Scholar] [CrossRef]
  48. Zhang, K.; Zhang, B.; Chen, B.; Jing, L.; Zhu, Z.; Kazemi, K. Modeling and Optimization of Newfoundland Shrimp Waste Hydrolysis for Microbial Growth Using Response Surface Methodology and Artificial Neural Networks. Mar. Pollut. Bull. 2016, 109, 245–252. [Google Scholar] [CrossRef]
  49. Puri, S.; Beg, Q.K.; Gupta, R. Optimization of Alkaline Protease Production from Bacillus Sp. by Response Surface Methodology. Curr. Microbiol. 2002, 44, 286–290. [Google Scholar] [CrossRef]
  50. Montgomery, D.C. Design and Analysis of Experiments, 8th ed.; Montgomery, D.C., Ed.; John Wiley & Sons Inc.: Hoboken, NJ, USA, 2012. [Google Scholar]
  51. Cheong, C.W.; Lee, Y.S.; Ahmad, S.A.; Ooi, P.T.; Phang, L.Y. Chicken Feather Valorization by Thermal Alkaline Pretreatment Followed by Enzymatic Hydrolysis for Protein-Rich Hydrolysate Production. Waste Manag. 2018, 79, 658–666. [Google Scholar] [CrossRef]
  52. Elmalimadi, M.B.; Jovanović, J.R.; Stefanović, A.B.; Tanasković, S.J.; Djurović, S.B.; Bugarski, B.M.; Knežević-Jugović, Z.D. Controlled Enzymatic Hydrolysis for Improved Exploitation of the Antioxidant Potential of Wheat Gluten. Ind. Crops Prod. 2017, 109, 548–557. [Google Scholar] [CrossRef]
  53. Chalamaiah, M.; Rao, G.N.; Rao, D.G.; Jyothirmayi, T. Protein Hydrolysates from Meriga (Cirrhinus mrigala) Egg and Evaluation of Their Functional Properties. Food Chem. 2010, 120, 652–657. [Google Scholar] [CrossRef]
  54. Gbogouri, G.A.; Linder, M.; Fanni, J.; Parmenter, M. Influence of Hydrolysis Degree on the Functional Properties of Salmon Byproducts Hydrolysates. J. Food Sci. 2004, 69, C615–C622. [Google Scholar] [CrossRef]
  55. Hall, F.G.; Jones, O.G.; O’Haire, M.E.; Liceaga, A.M. Functional Properties of Tropical Banded Cricket (Gryllodes sigillatus) Protein Hydrolysates. Food Chem. 2017, 224, 414–422. [Google Scholar] [CrossRef] [PubMed]
  56. Kristinsson, H.G.; Rasco, B.A. Fish Protein Hydrolysates: Production, Biochemical, and Functional Properties. Crit. Rev. Food Sci. Nutr. 2000, 40, 43–81. [Google Scholar] [CrossRef] [PubMed]
  57. Garcia, R.A.; Pyle, D.J.; Piazza, G.J.; Wen, Z. Hydrolysis of Animal Protein Meals for Improved Utility in Non-Feed Applications. Appl. Eng. Agric. 2011, 27, 269–276. [Google Scholar] [CrossRef]
  58. Deydier, E.; Guilet, R.; Sarda, S.; Sharrock, P. Physical and Chemical Characterisation of Crude Meat and Bone Meal Combustion Residue: “Waste or Raw Material?”. J. Hazard. Mater. 2005, 121, 141–148. [Google Scholar] [CrossRef] [PubMed] [Green Version]
  59. Klompong, V.; Benjakul, S.; Kantachote, D.; Shahidi, F. Characteristics and Use of Yellow Stripe Trevally Hydrolysate as Culture Media. J. Food Sci. 2009, 74, S219–S225. [Google Scholar] [CrossRef]
  60. Lobo-Alfonso, J.; Price, P.; Jayme, D. Benefits and Limitations of Protein Hydrolysates as Components of Serum-Free Media for Animal Cell Culture Applications Protein Hydrolysates in Serum Free Media. In Protein Hydrolysates in Biotechnology; Springer: Dordrecht, The Netherlands, 2010; pp. 55–78. ISBN 9781402066733. [Google Scholar]
  61. Taskin, M. A New Strategy for Improved Glutathione Production from Saccharomyces Cerevisiae: Use of Cysteine- and Glycine-Rich Chicken Feather Protein Hydrolysate as a New Cheap Substrate. J. Sci. Food Agric. 2013, 93, 535–541. [Google Scholar] [CrossRef]
  62. Stanbury, P.F.; Whitaker, A.; Hall, S.J. Media for Industrial Fermentations. In Principles of Fermentation Technology; Stanbury, P.F., Whitaker, A., Hall, S.J., Eds.; Elsevier Ltd.: Amsterdam, The Netherlands, 2017; pp. 213–272. [Google Scholar]
  63. Colgrave, M.L.; Allingham, P.G.; Jones, A. Hydroxyproline Quantification for the Estimation of Collagen in Tissue Using Multiple Reaction Monitoring Mass Spectrometry. J. Chromatogr. A 2008, 1212, 150–153. [Google Scholar] [CrossRef] [PubMed]
  64. Dai, Z.; Wu, Z.; Jia, S.; Wu, G. Analysis of Amino Acid Composition in Proteins of Animal Tissues and Foods as Pre-Column o-Phthaldialdehyde Derivatives by HPLC with Fluorescence Detection. J. Chromatogr. B 2014, 964, 116–127. [Google Scholar] [CrossRef]
  65. Guo, S.; Duan, J.A.; Qian, D.; Tang, Y.; Qian, Y.; Wu, D.; Su, S.; Shang, E. Rapid Determination of Amino Acids in Fruits of Ziziphus Jujuba by Hydrophilic Interaction Ultra-High-Performance Liquid Chromatography Coupled with Triple-Quadrupole Mass Spectrometry. J. Agric. Food Chem. 2013, 61, 2709–2719. [Google Scholar] [CrossRef] [PubMed]
  66. Fountoulakis, M.; Lahm, H.W. Hydrolysis and Amino Acid Composition Analysis of Proteins. J. Chromatogr. A 1998, 826, 109–134. [Google Scholar] [CrossRef]
  67. Anzani, C.; Prandi, B.; Tedeschi, T.; Baldinelli, C.; Sorlini, G.; Wierenga, P.A.; Dossena, A.; Sforza, S. Degradation of Collagen Increases Nitrogen Solubilisation during Enzymatic Hydrolysis of Fleshing Meat. Waste Biomass Valorization 2018, 9, 1113–1119. [Google Scholar] [CrossRef]
  68. Cheung, I.W.Y.; Li-Chan, E.C.Y. Enzymatic Production of Protein Hydrolysates from Steelhead (Oncorhynchus Mykiss) Skin Gelatin as Inhibitors of Dipeptidyl-Peptidase IV and Angiotensin-I Converting Enzyme. J. Funct. Foods 2017, 28, 254–264. [Google Scholar] [CrossRef] [Green Version]
  69. Chi, C.F.; Cao, Z.H.; Wang, B.; Hu, F.Y.; Li, Z.R.; Zhang, B. Antioxidant and Functional Properties of Collagen Hydrolysates from Spanish Mackerel Skin as Influenced by Average Molecular Weight. Molecules 2014, 19, 11211–11230. [Google Scholar] [CrossRef] [PubMed] [Green Version]
  70. Nam, K.A.; You, S.G.; Kim, S.M. Molecular and Physical Characteristics of Squid (Todarodes Pacificus) Skin Collagens and Biological Properties of Their Enzymatic Hydrolysates. J. Food Sci. 2008, 73, C249–C255. [Google Scholar] [CrossRef] [PubMed]
  71. Sotelo, C.G.; Comesaña, M.B.; Ariza, P.R.; Pérez-Martín, R.I. Characterization of Collagen from Different Discarded Fish Species of the West Coast of the Iberian Peninsula. J. Aquat. Food Prod. Technol. 2016, 25, 388–399. [Google Scholar] [CrossRef] [Green Version]
  72. Gomez-Guillen, M.C.; Gimenez, B.; Lopez-Caballero, M.E.; Montero, M.P. Functional and Bioactive Properties of Collagen and Gelatin from Alternative Sources: A Review. Food Hydrocoll. 2011, 25, 1813–1827. [Google Scholar] [CrossRef] [Green Version]
  73. Zhang, Y.; Olsen, K.; Grossi, A.; Otte, J. Effect of Pretreatment on Enzymatic Hydrolysis of Bovine Collagen and Formation of ACE-Inhibitory Peptides. Food Chem. 2013, 141, 2343–2354. [Google Scholar] [CrossRef]
  74. Sandoval-Denis, M.; Lombard, L.; Crous, P.W. Back to the Roots: A Reappraisal of Neocosmospora. Persoonia Mol. Phylogeny Evol. Fungi 2019, 43, 90–185. [Google Scholar] [CrossRef]
  75. Su, Y.-Y.; Qi, Y.-L.; Cai, L. Induction of Sporulation in Plant Pathogenic Fungi. Mycology 2012, 3, 195–200. [Google Scholar] [CrossRef]
  76. Sharma, G.; Pandey, R.R. Influence of Culture Media on Growth, Colony Character and Sporulation of Fungi Isolated from Decaying Vegetable Wastes. J. Yeast Fungal Res. 2010, 1, 157–164. [Google Scholar]
  77. Lazarotto, M.; Mezzomo, R.; Gonzatto, M.; Finger, G.; Brião Muniz, M.F. Mycelia Growth and Sporulation of Fusarium Chlamydosporum Species Complex under Different Culture Conditions. Amaz. J. Agric. Environ. Sci. 2014, 57, 35–40. [Google Scholar] [CrossRef]
  78. Li, S.; Myung, K.; Guse, D.; Donkin, B.; Proctor, R.H.; Grayburn, W.S.; Calvo, A.M. FvVE1 Regulates Filamentous Growth, the Ratio of Microconidia to Macroconidia and Cell Wall Formation in Fusarium verticillioides. Mol. Microbiol. 2006, 62, 1418–1432. [Google Scholar] [CrossRef] [PubMed]
  79. Chehri, K.; Salleh, B.; Zakaria, L. Morphological and Phylogenetic Analysis of Fusarium Solani Species Complex in Malaysia. Microb. Ecol. 2015, 69, 457–471. [Google Scholar] [CrossRef] [Green Version]
  80. Martins, C.; Hartmann, D.O.; Varela, A.; Coelho, J.A.S.; Lamosa, P.; Afonso, C.A.M.; Silva Pereira, C. Securing a Furan-based Biorefinery: Disclosing the Genetic Basis of the Degradation of Hydroxymethylfurfural and Its Derivatives in the Model Fungus Aspergillus nidulans. Microb. Biotechnol. 2020, 13, 1983–1996. [Google Scholar] [CrossRef]
  81. Nielsen, P.M.; Petersen, D.; Dambmann, C. Improved Method for Determining Food Protein Degree of Hydrolysis. J. Food Sci. Food Chem. Toxicol. 2001, 66, 642–646. [Google Scholar] [CrossRef]
  82. Adler-Nissen, J. Enzymic Hydrolysis of Food Proteins, 1st ed.; Adler-Nissen, J., Ed.; Elsevier Applied Science Publishers: Amsterdam, The Netherlands, 1986. [Google Scholar]
  83. Rutherfurd, S.M. Methodology for Determining Degree of Hydrolysis of Proteins in Hydrolysates: A Review. J. AOAC Int. 2010, 93, 1515–1522. [Google Scholar] [CrossRef] [PubMed] [Green Version]
  84. Fu, Y.; Liu, J.; Hansen, E.T.; Bredie, W.L.P.; Lametsch, R. Structural Characteristics of Low Bitter and High Umami Protein Hydrolysates Prepared from Bovine Muscle and Porcine Plasma. Food Chem. 2018, 257, 163–171. [Google Scholar] [CrossRef] [PubMed]
Figure 1. Fines and the fractions recovered after thermal treatment: PDF and fat.
Catalysts 12 00839 g001
Figure 2. Hydrolysis curves (DH vs. time) of PDF with (a) 1% E/S ratio and (b) 5% E/S ratio under different pH conditions. The symbols correspond to the values obtained experimentally while the lines are drawn for illustration purposes.
Catalysts 12 00839 g002
Figure 3. Main effect plots of OFAT experiments on (a) DH vs. E/S ratio, (b) DH vs. incubation time, (c) DH vs. initial pH, and (d) DH vs. hydrolysis temperature. Data are expressed as mean ± standard deviation of triplicate determinations.
Catalysts 12 00839 g003
Figure 4. The MW distribution of the hydrolysates obtained with Alcalase 2.4 L (HA) and Neutrase 0.8 L (HN), and commercial peptones (meat tissue, tryptone from casein, and soybean).
Catalysts 12 00839 g004
Figure 5. Effect of medium composition and presence or absence of visible light on sporulation of F. striatum. MEA: malt extract agar medium; MEA-WP: malt extract agar medium without peptone; MEA-50WP: malt extract agar medium without peptone and 50% of malt extract; MEA-HA: malt extract agar medium containing Alcalase 2.4 L hydrolysate; MEA-50HA: malt extract agar medium with 50% of malt extract replaced by Alcalase 2.4 L hydrolysate; MEA-HN: malt extract agar medium containing Neutrase 0.8 L hydrolysate; and MEA-50HN: malt extract agar medium with 50% of malt extract replaced by Neutrase 0.8 L hydrolysate. Different letters indicate significant differences among culture media (p < 0.05).
Catalysts 12 00839 g005
Figure 6. HMF reduction to DHMF with (a) discs and (b) spores of F. Striatum. ME: malt extract medium, ME-50HA: malt extract medium with 50% of malt extract replaced by Alcalase 2.4 L hydrolysate, and ME-50HN: malt extract medium with 50% of malt extract replaced by Neutrase 0.8 L hydrolysate.
Catalysts 12 00839 g006aCatalysts 12 00839 g006b
Figure 7. Substrate approach with 0.86 mmol additions. The culture media assayed were the following: (a) ME, (b) ME-50WP, (c) ME-50HA, (d) ME-50HN, and (e) ME50Meat. ME: malt extract medium; ME-50WP: malt extract medium without peptone and 50% of malt extract; ME-50HA: malt extract medium with 50% of malt extract replaced by Alcalase 2.4 L hydrolysate, ME-50HN: malt extract medium with 50% of malt extract replaced by Neutrase 0.8 L hydrolysate, and ME-50Meat: malt extract medium containing meat peptone.
Catalysts 12 00839 g007
Table 1. Enzymatic hydrolysis variables and respective levels for CCD with Neutrase 0.8 L.
FactorsLevels
α (−1.48)−101α (1.48)
X1—E/S (%)2.595.0101517.41
X2—Time (h)0.572.5 6.510.512.43
X3—Initial pH5.526788.48
X4—T (°C)37.5940455052.41
Table 2. Composition of the culture media (g/L) tested based on MEA for the evaluation of HA and HN.
CompoundsCulture Media
MEAMEA-WPMEA-50WPMEA-HAMEA-50HAMEA-HNMEA-50HN
Malt extract20201020102010
Glucose20202020202020
Soybean peptone1------
HA---111--
HN-----111
Agar15151515151515
Table 3. Composition of the culture media (g/L) tested based on MEA for the evaluation of HA and HN.
CompoundCulture Medium
MEMe-50HAME-50HN
Malt extract201010
Glucose202020
Soybean peptone1--
HA-11-
HN--11
Table 4. Composition of the culture media (g/L) tested based on MEA for the evaluation of HA and HN.
CompoundCulture Medium
MEME-50WPME-50MeatME-50HAME-50HN
Malt extract2010101010
Glucose2020202020
Soybean peptone1----
Meat peptone--11--
HA---11-
HN----11
Publisher’s Note: MDPI stays neutral with regard to jurisdictional claims in published maps and institutional affiliations.

