
Effect of B4C/Gr on Hardness and Wear Behavior of Al2618 Based Hybrid Composites through Taguchi and Artificial Neural Network Analysis

 , ,
, ,
Abstract
1. Introduction
2. Results and Discussions
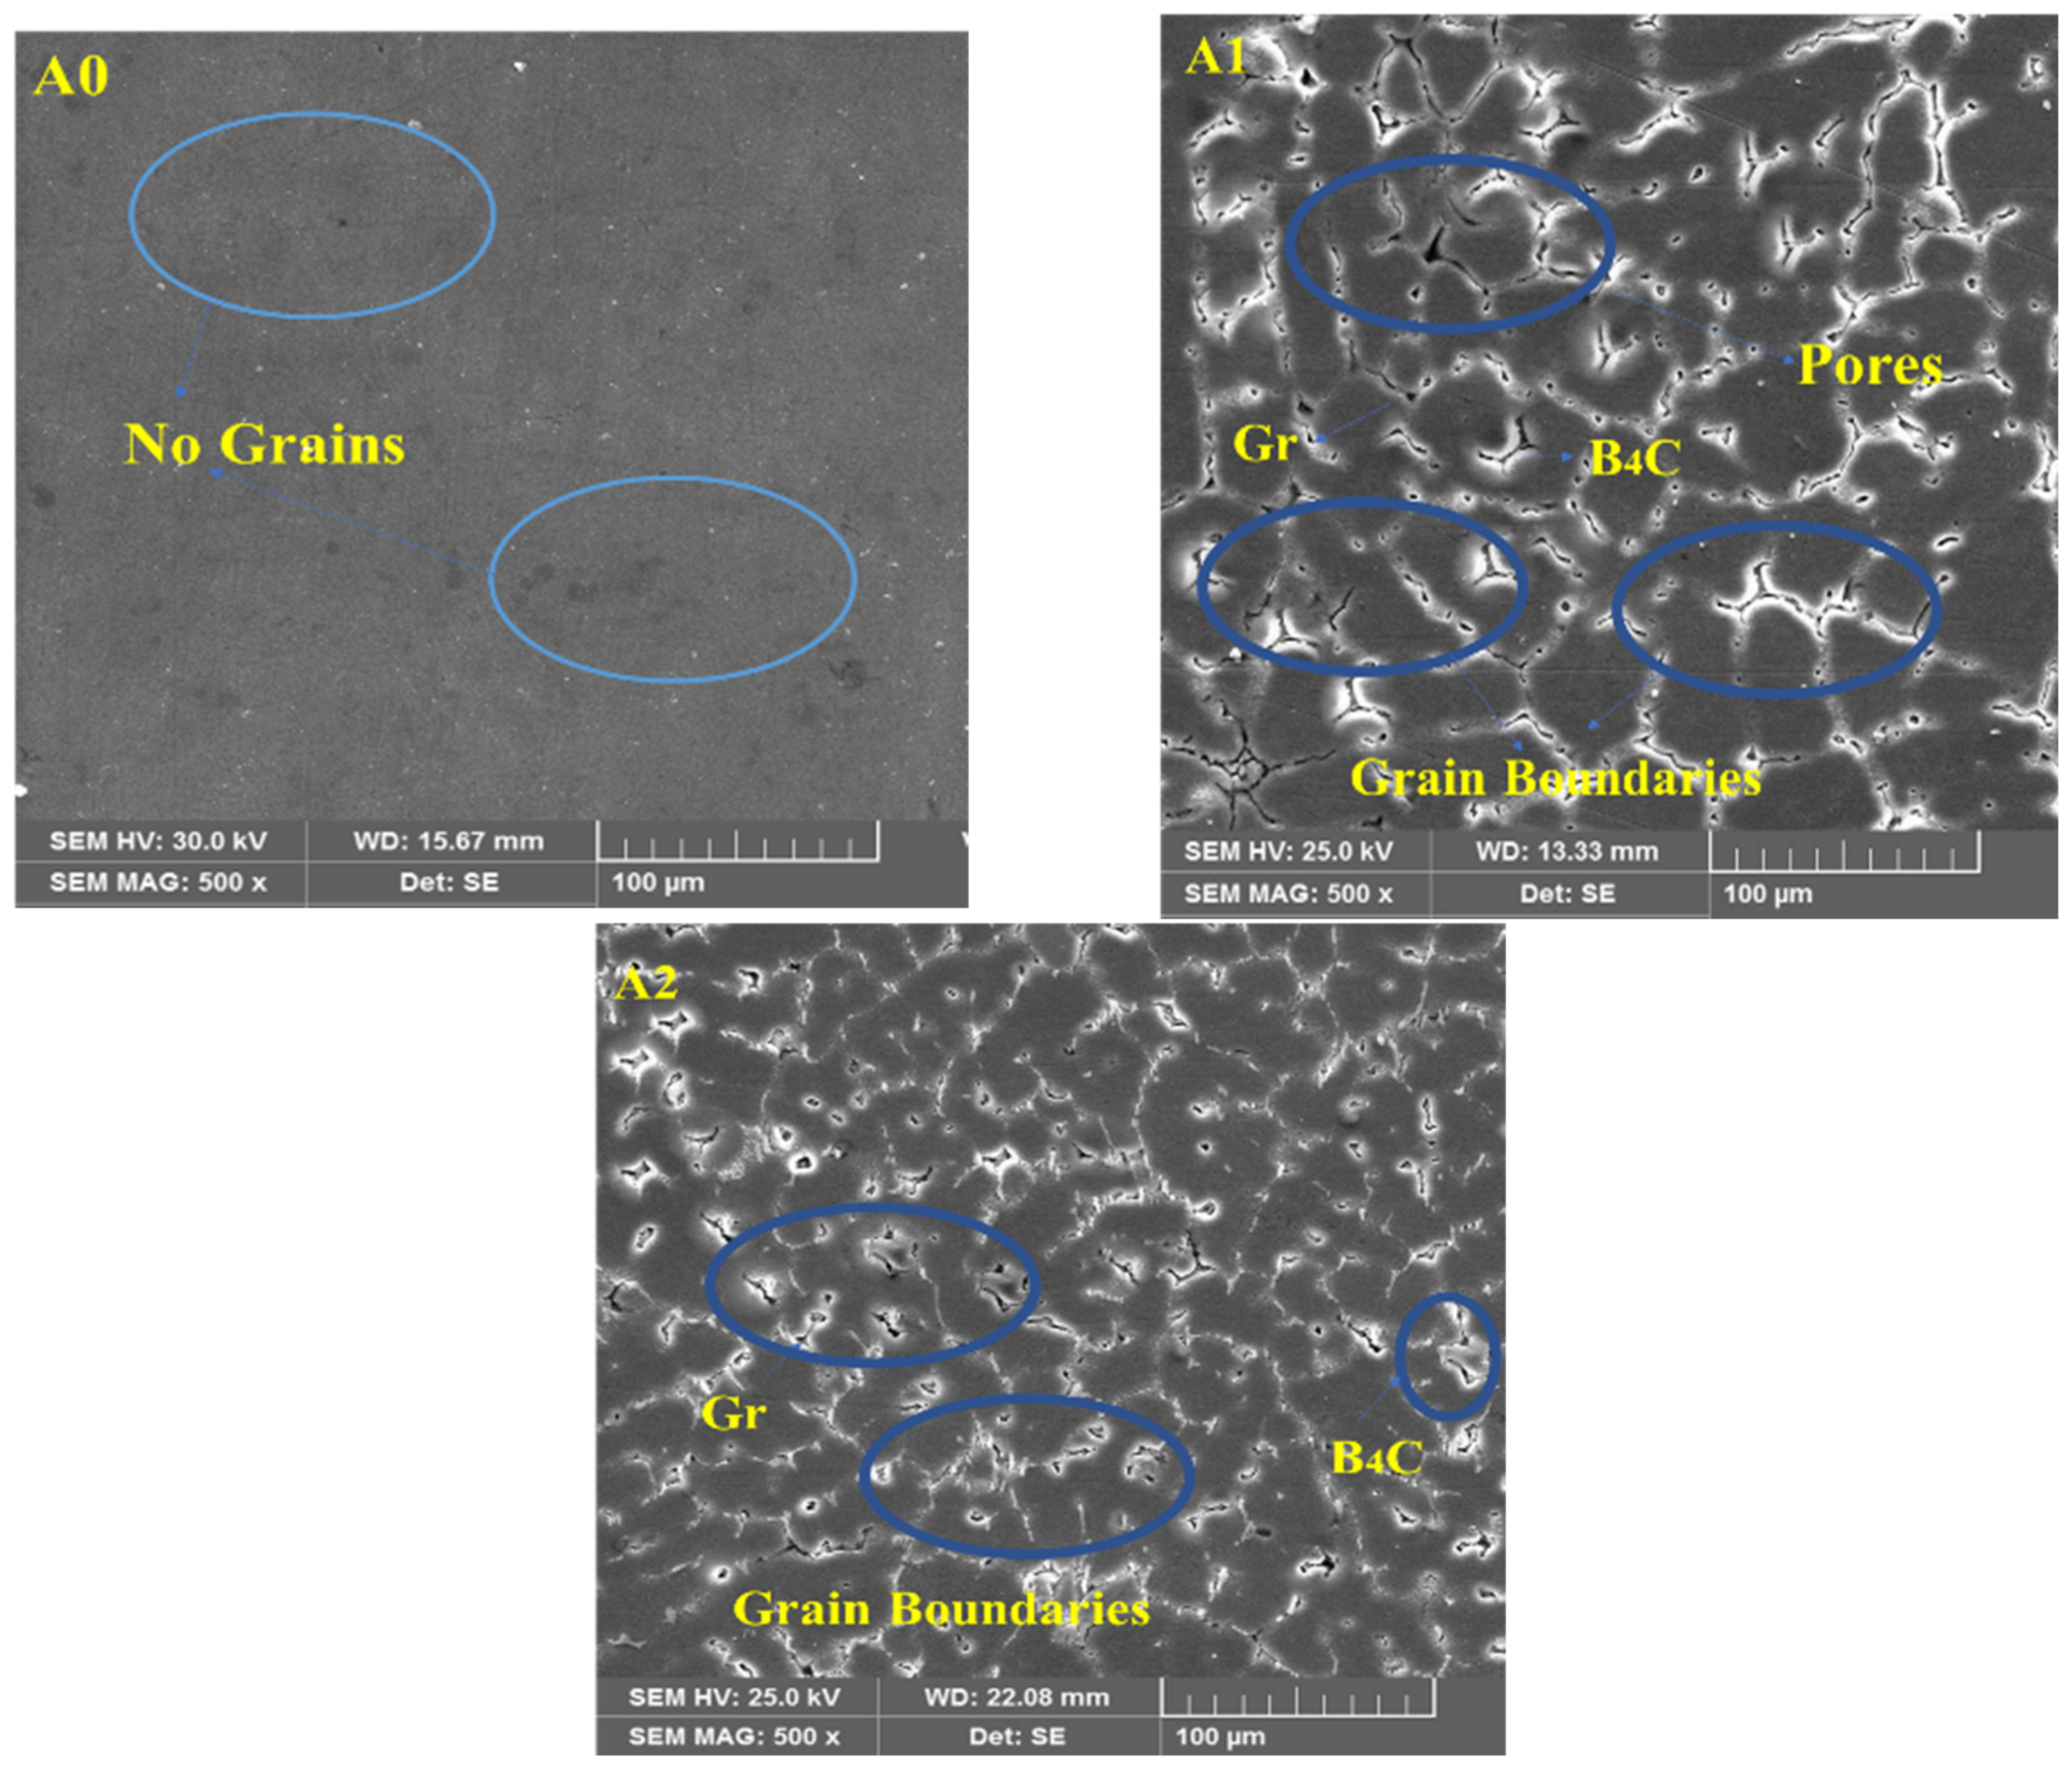
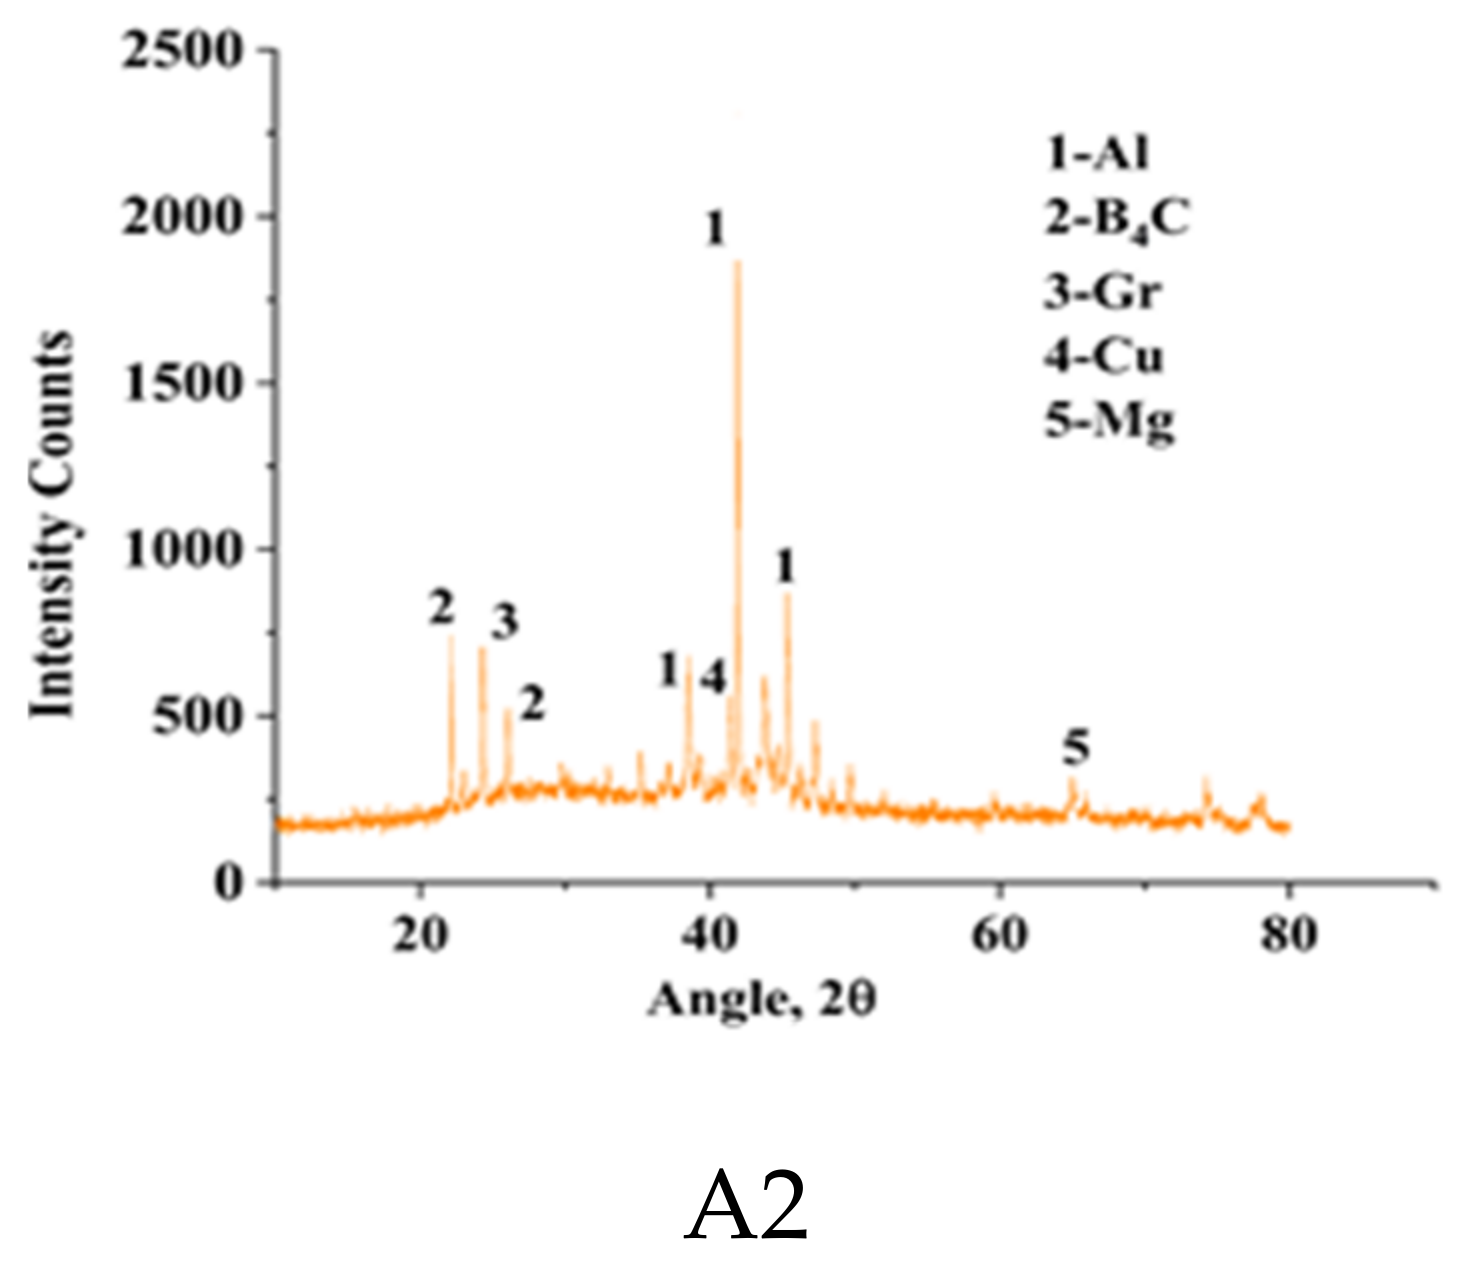
2.1. X-ray Analysis and Microstructural Study
2.2. Density and Porosity
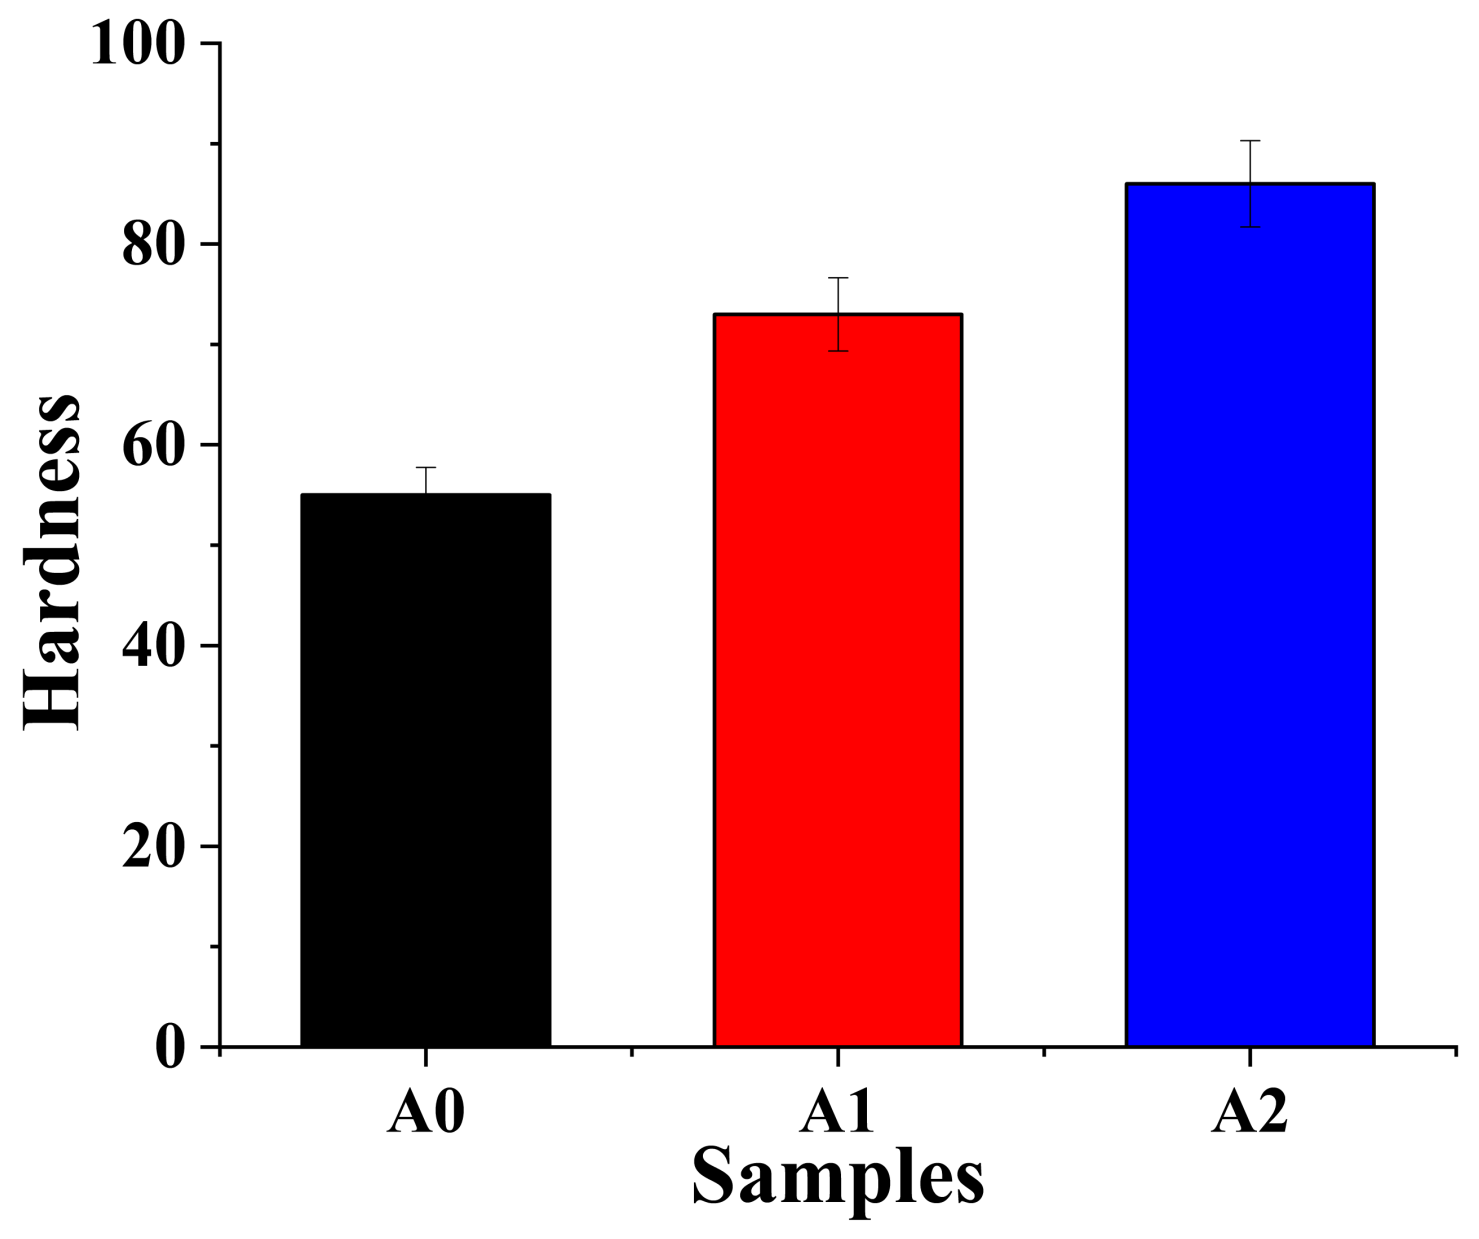
2.3. Hardness Test
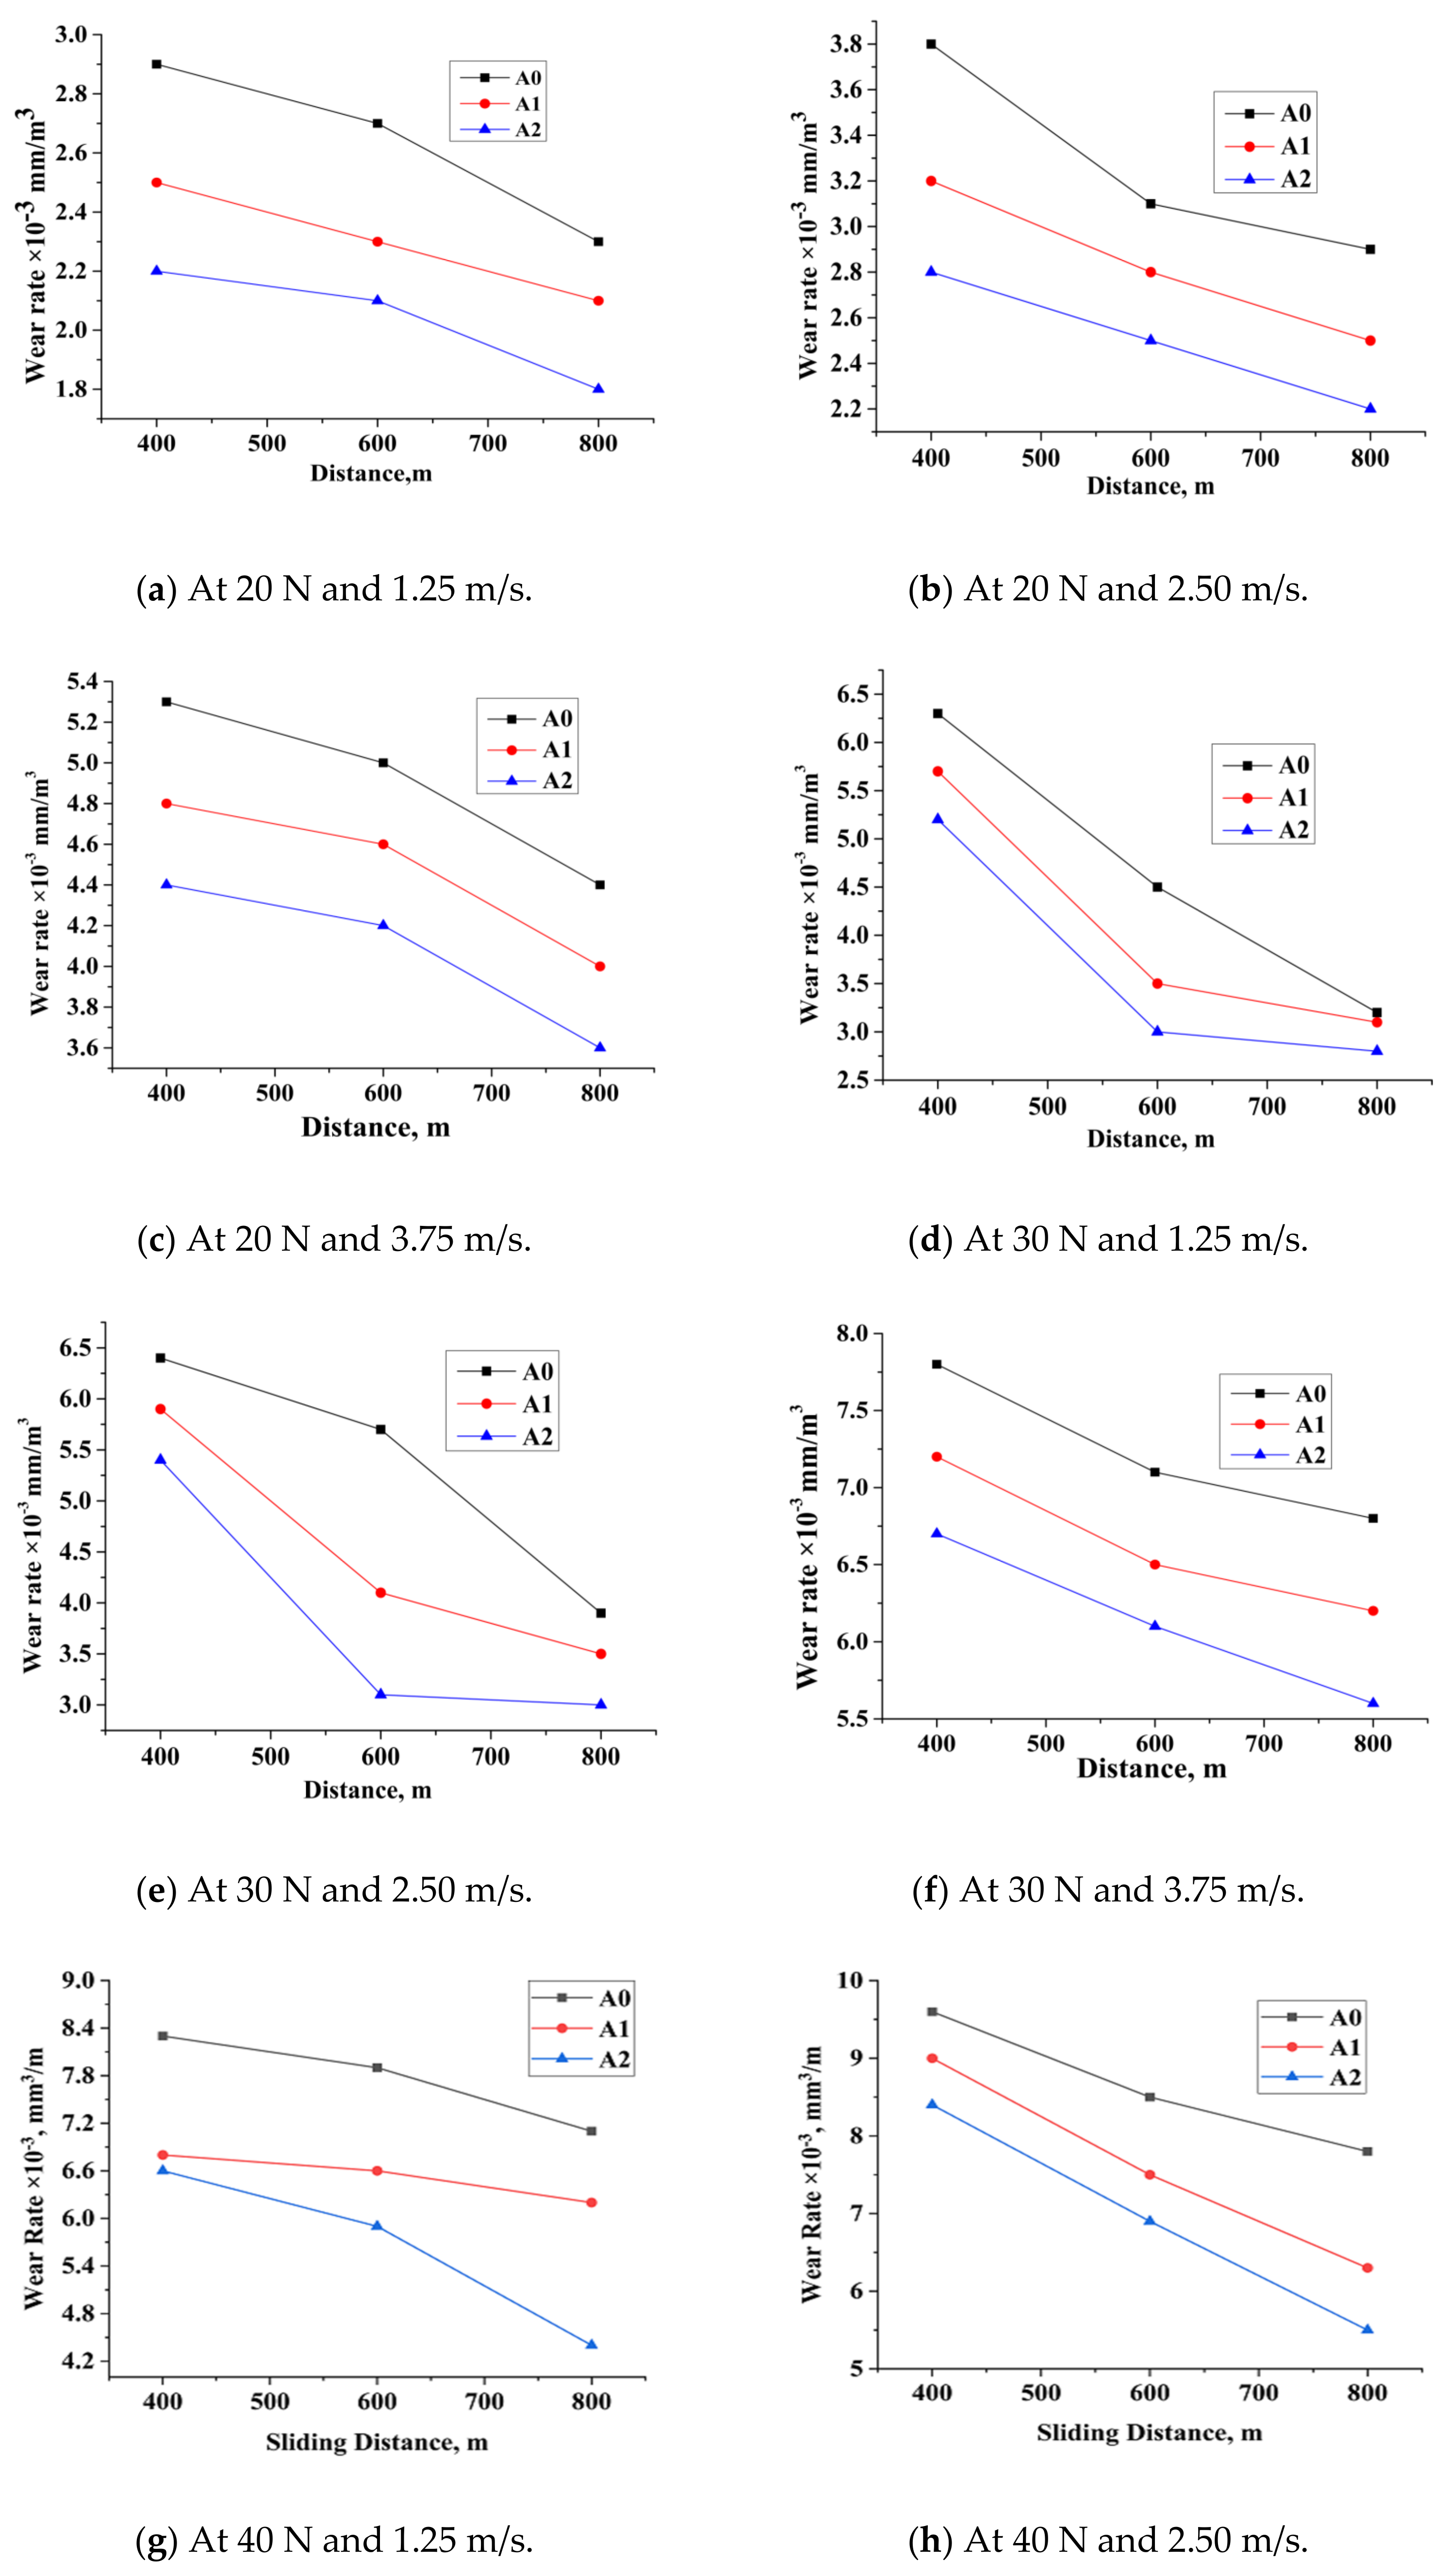
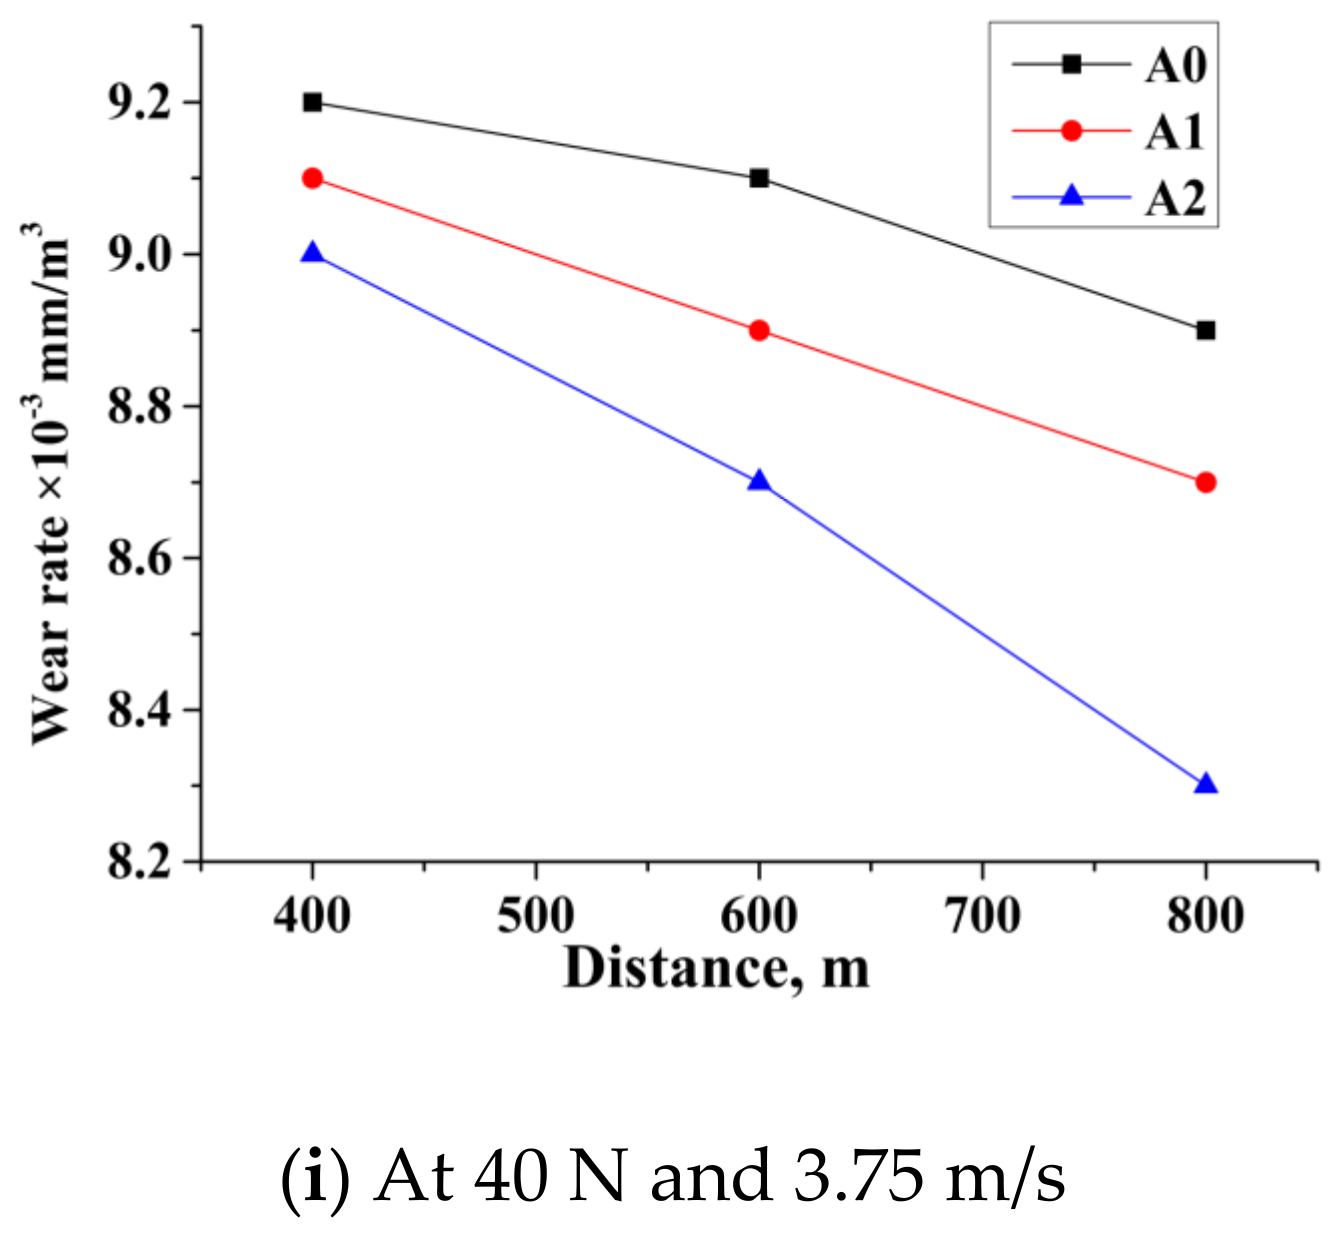
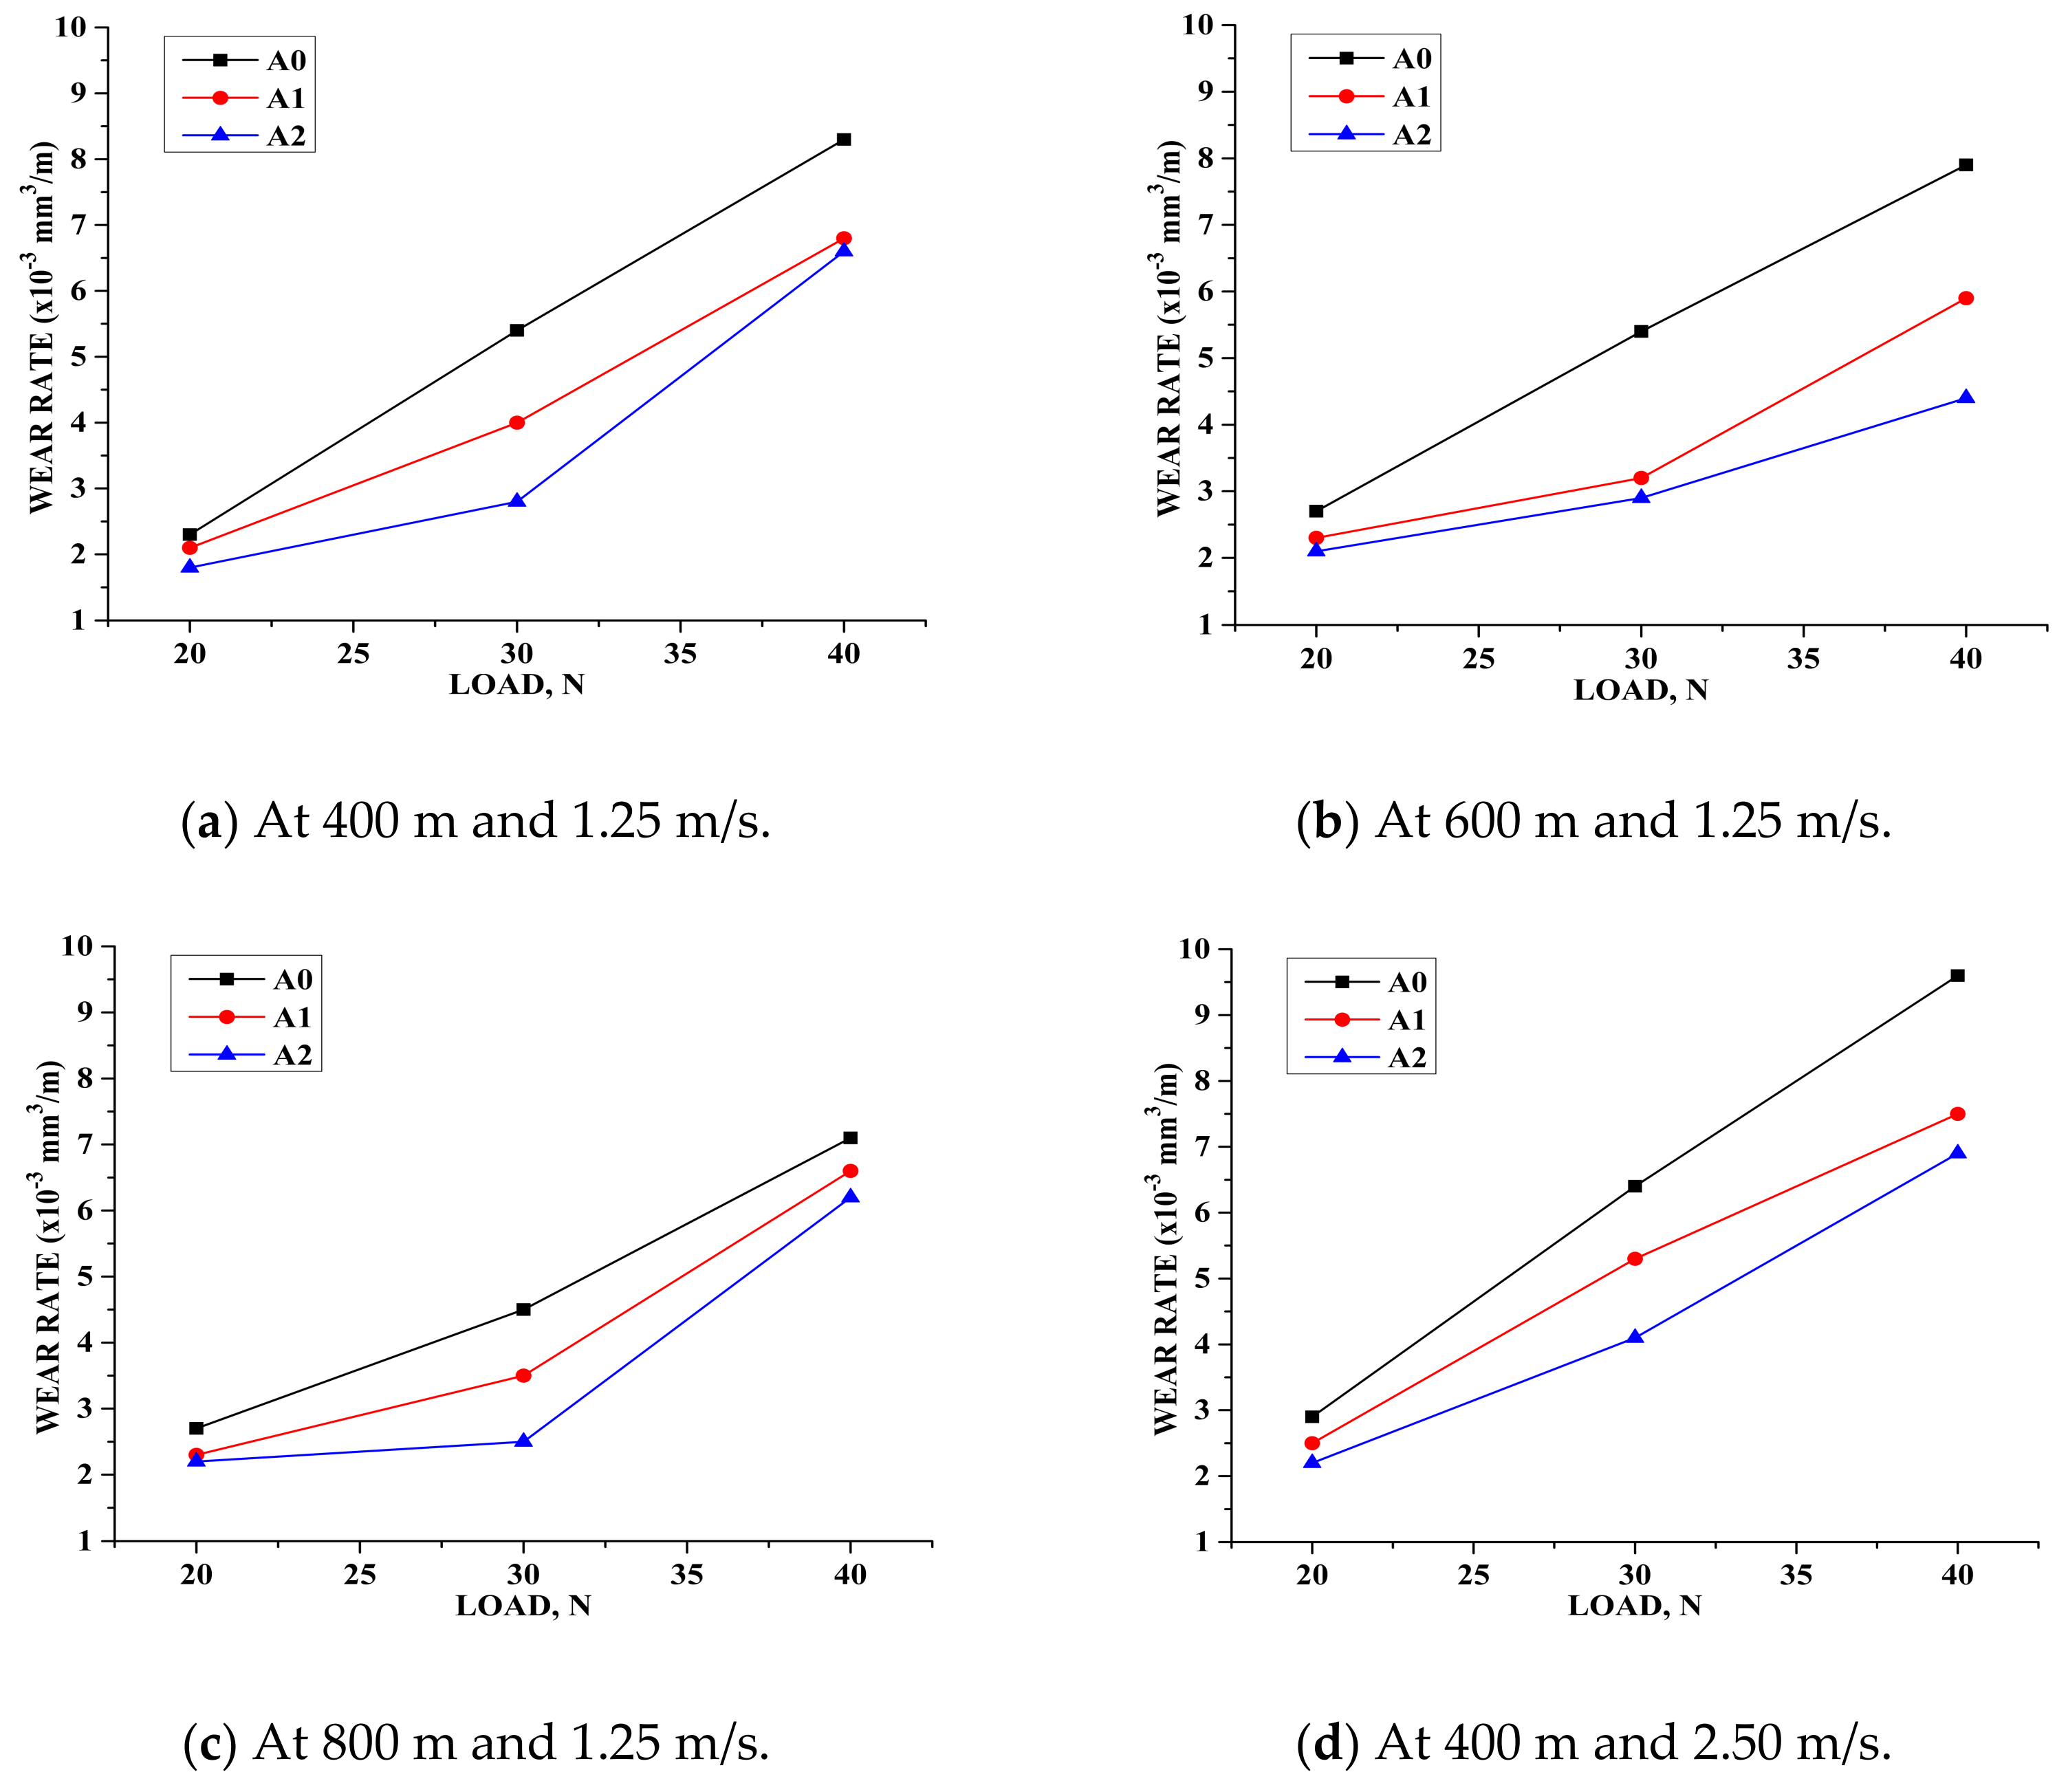
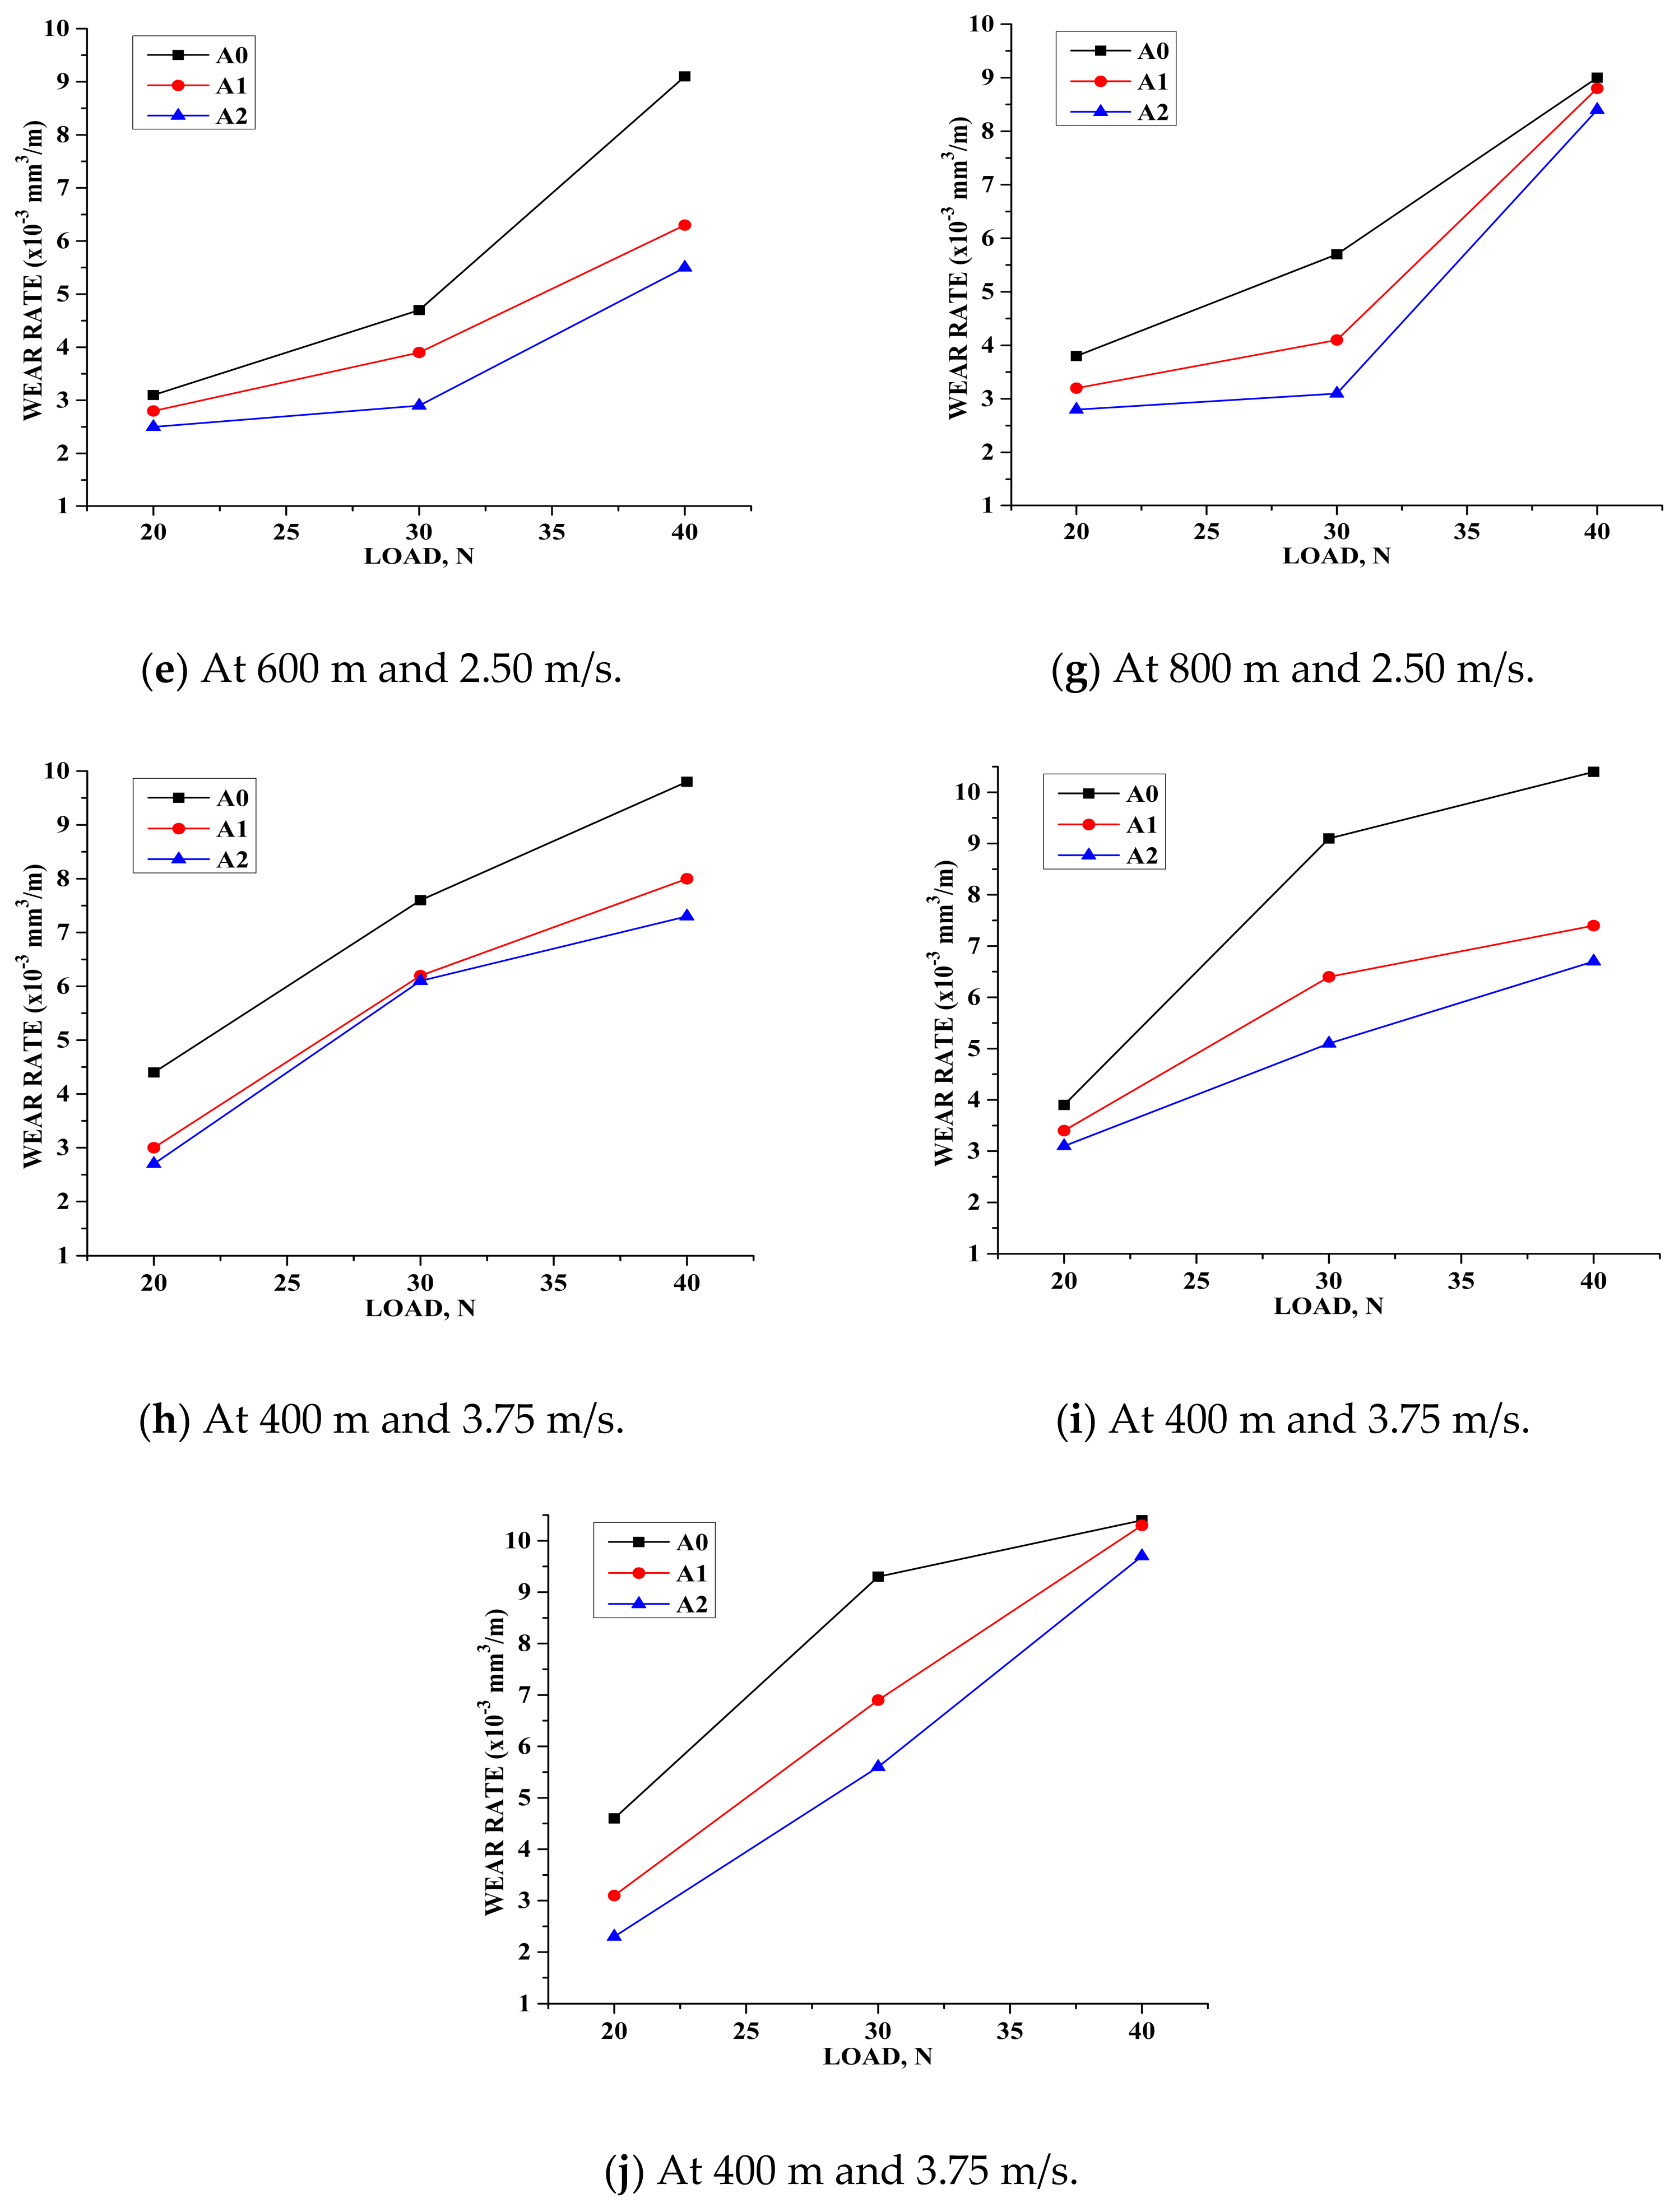
2.4. Wear Behavior
3. Materials and Methods
3.1. Fabrication of Composites by Using Stir Casting Method
3.2. X-ray Diffraction and Microstructural Study
3.3. Hardness Test
3.4. Wear Test
4. Evaluation of Wear Behavior
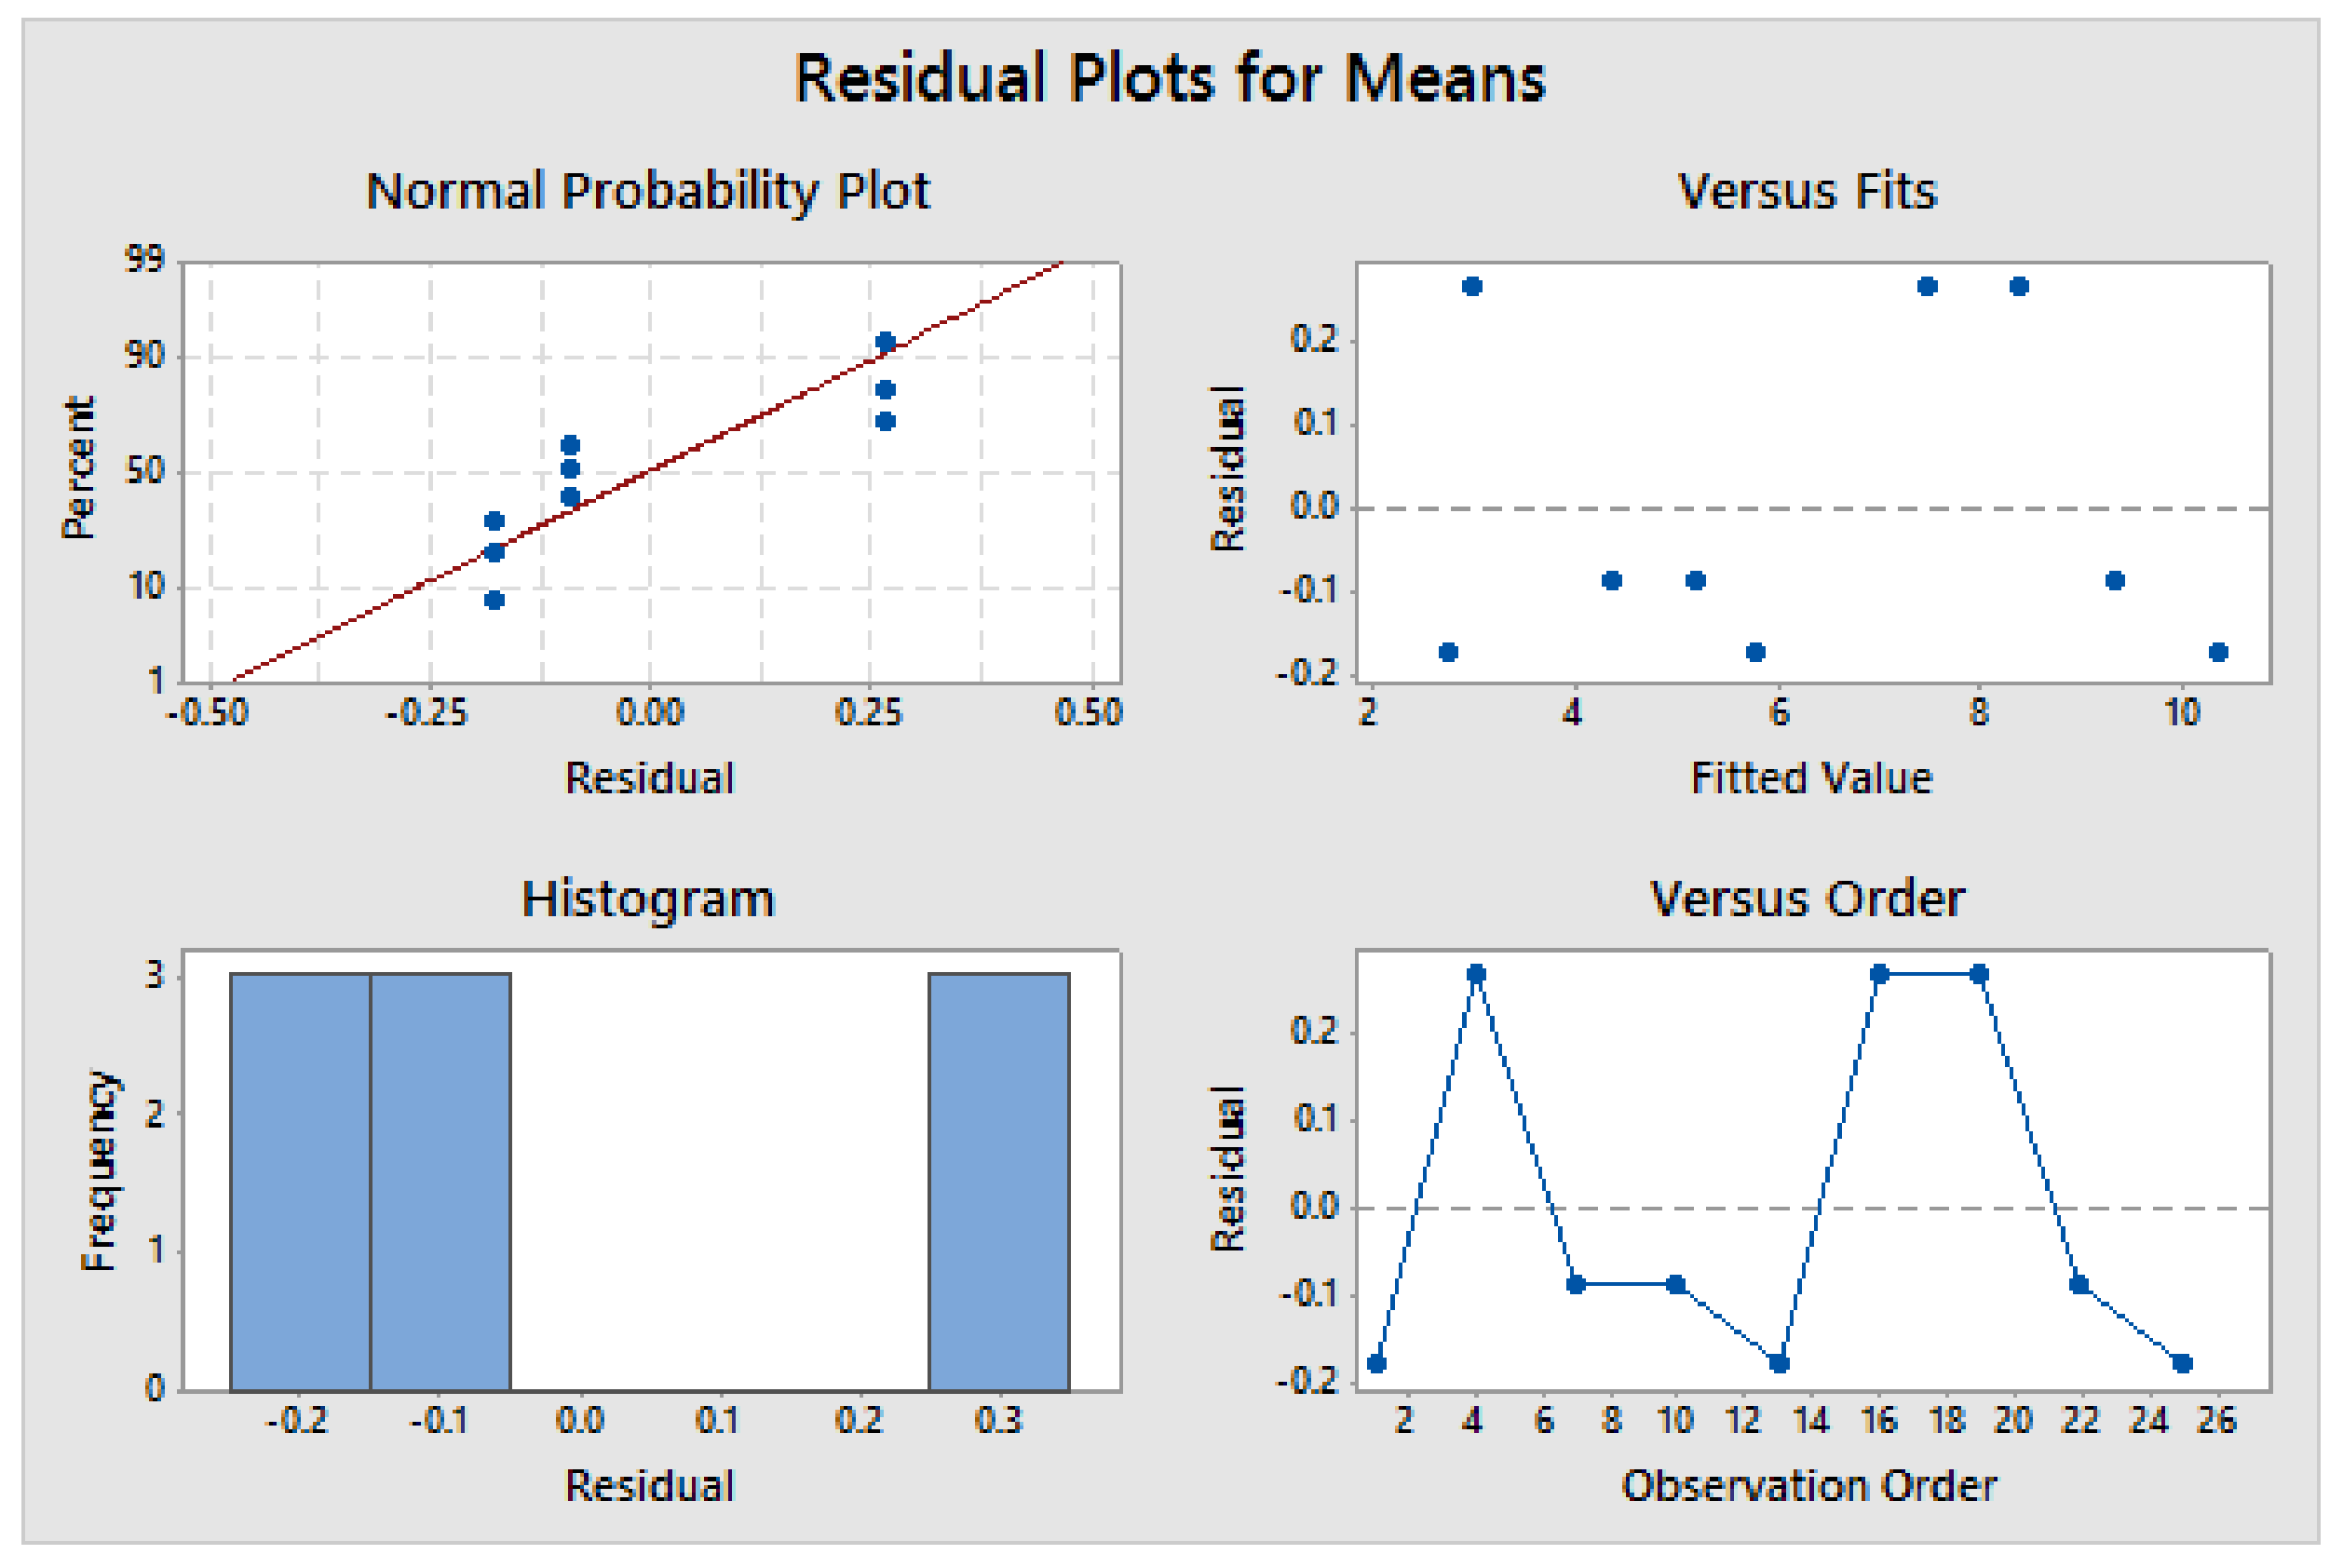
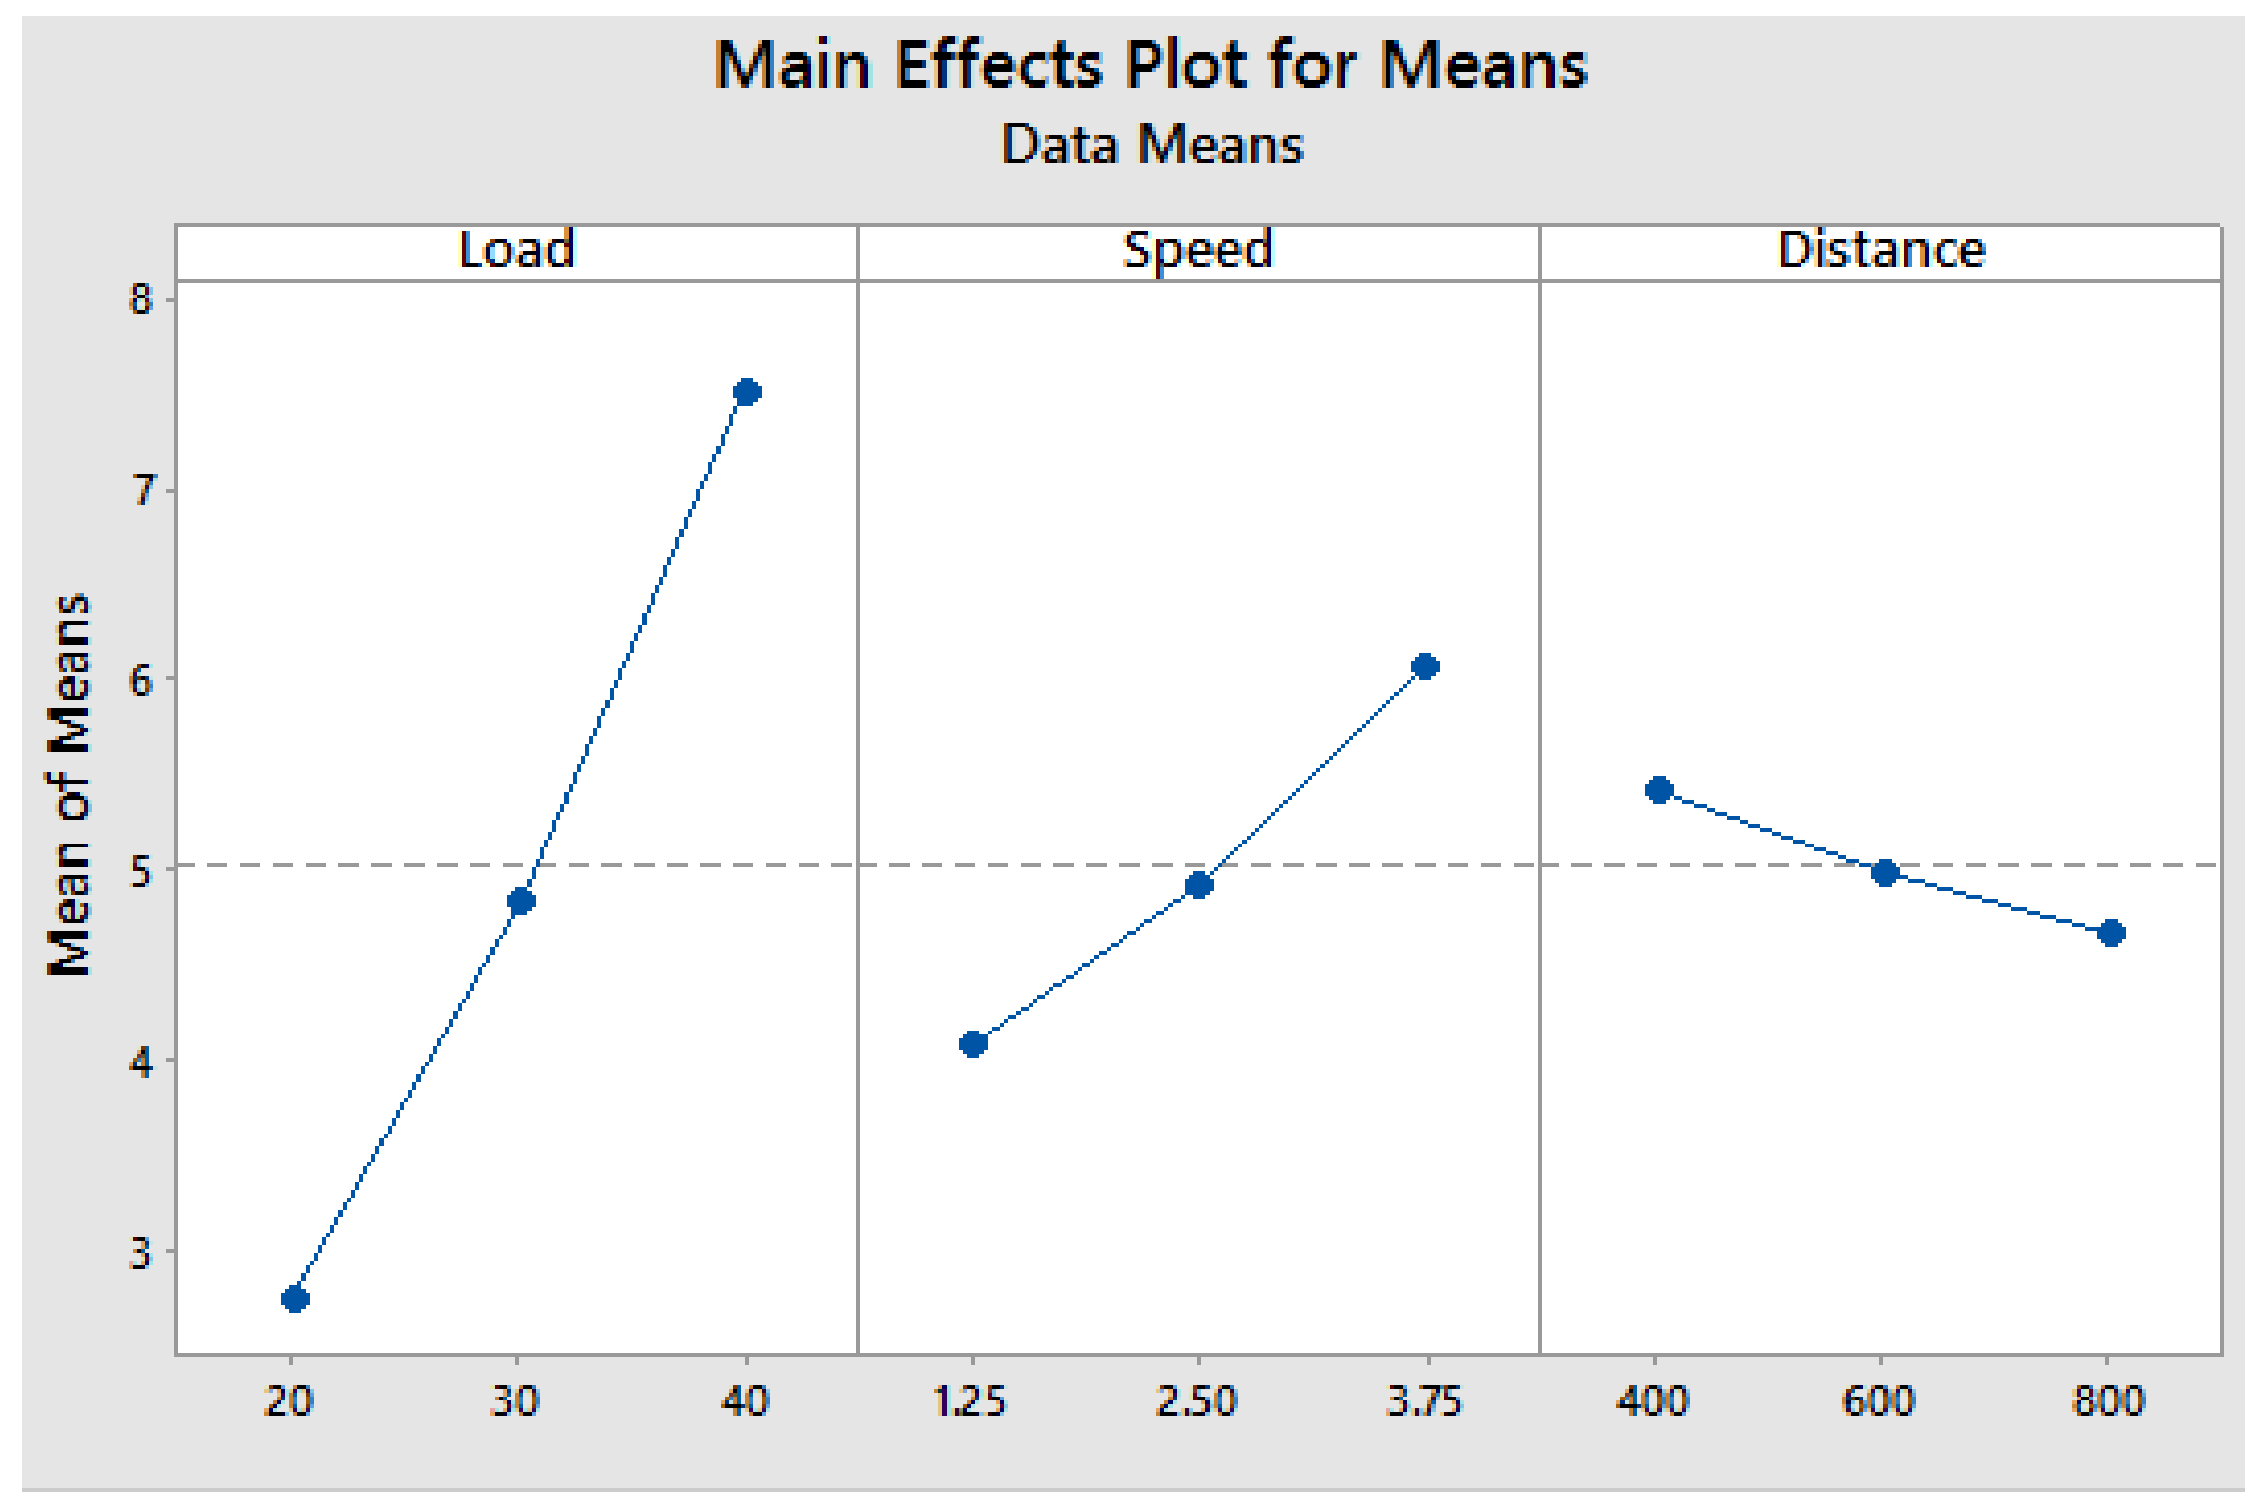
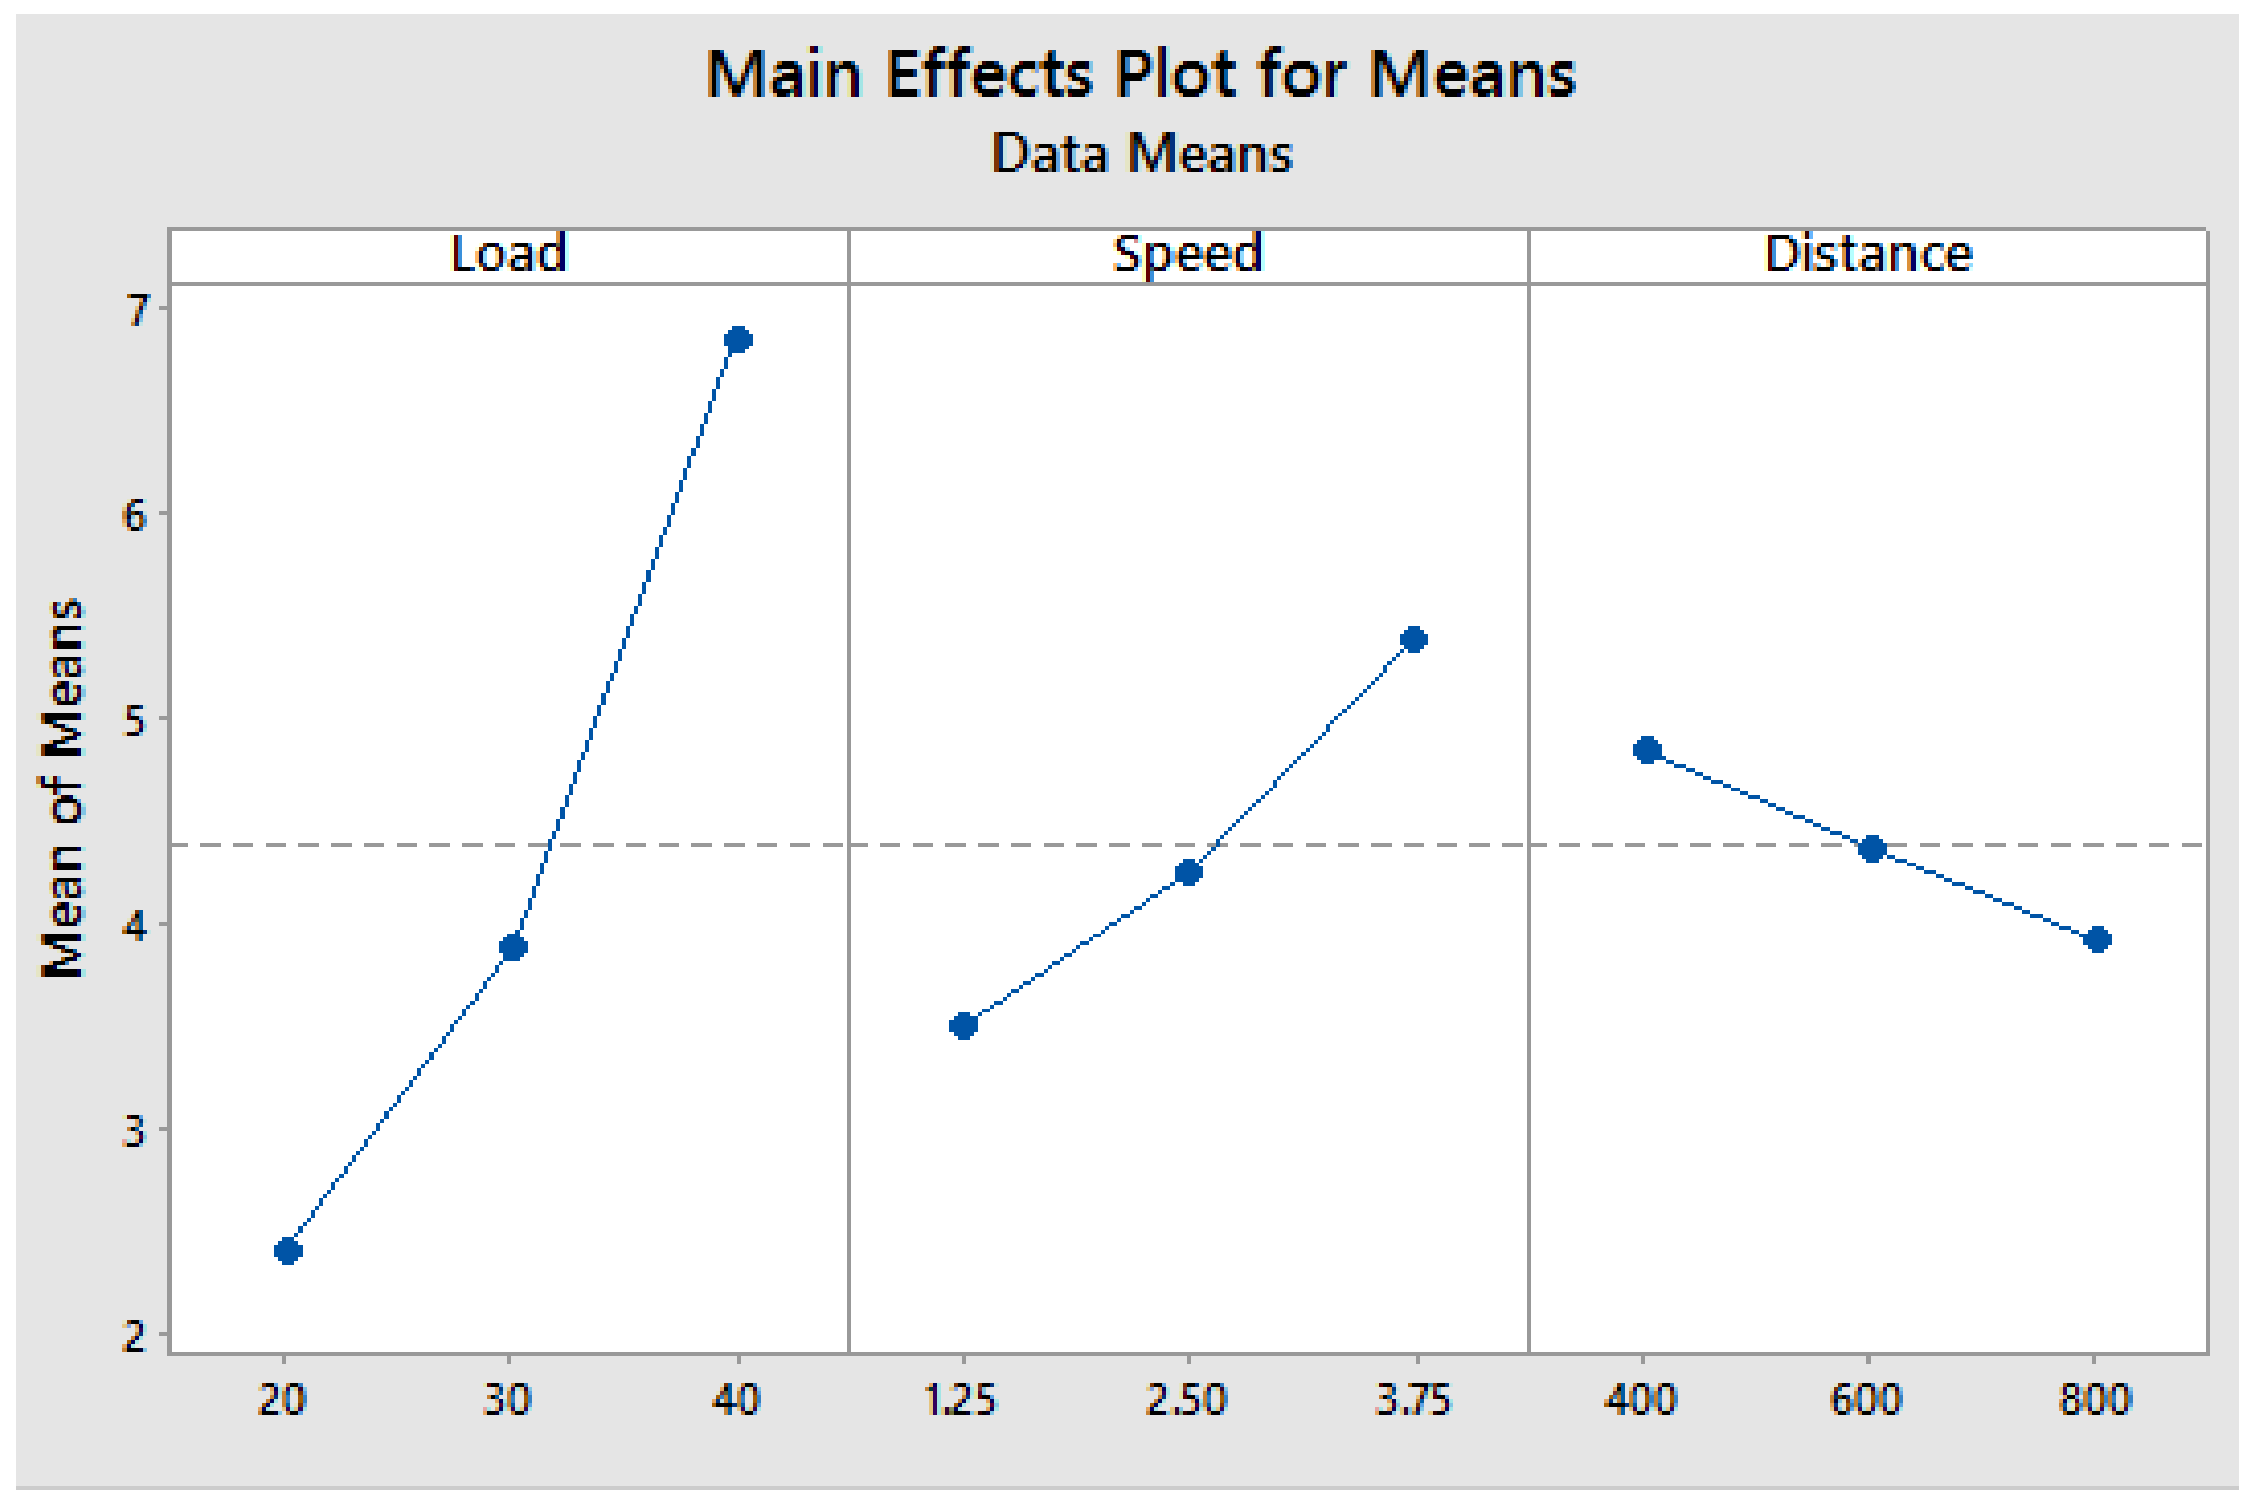
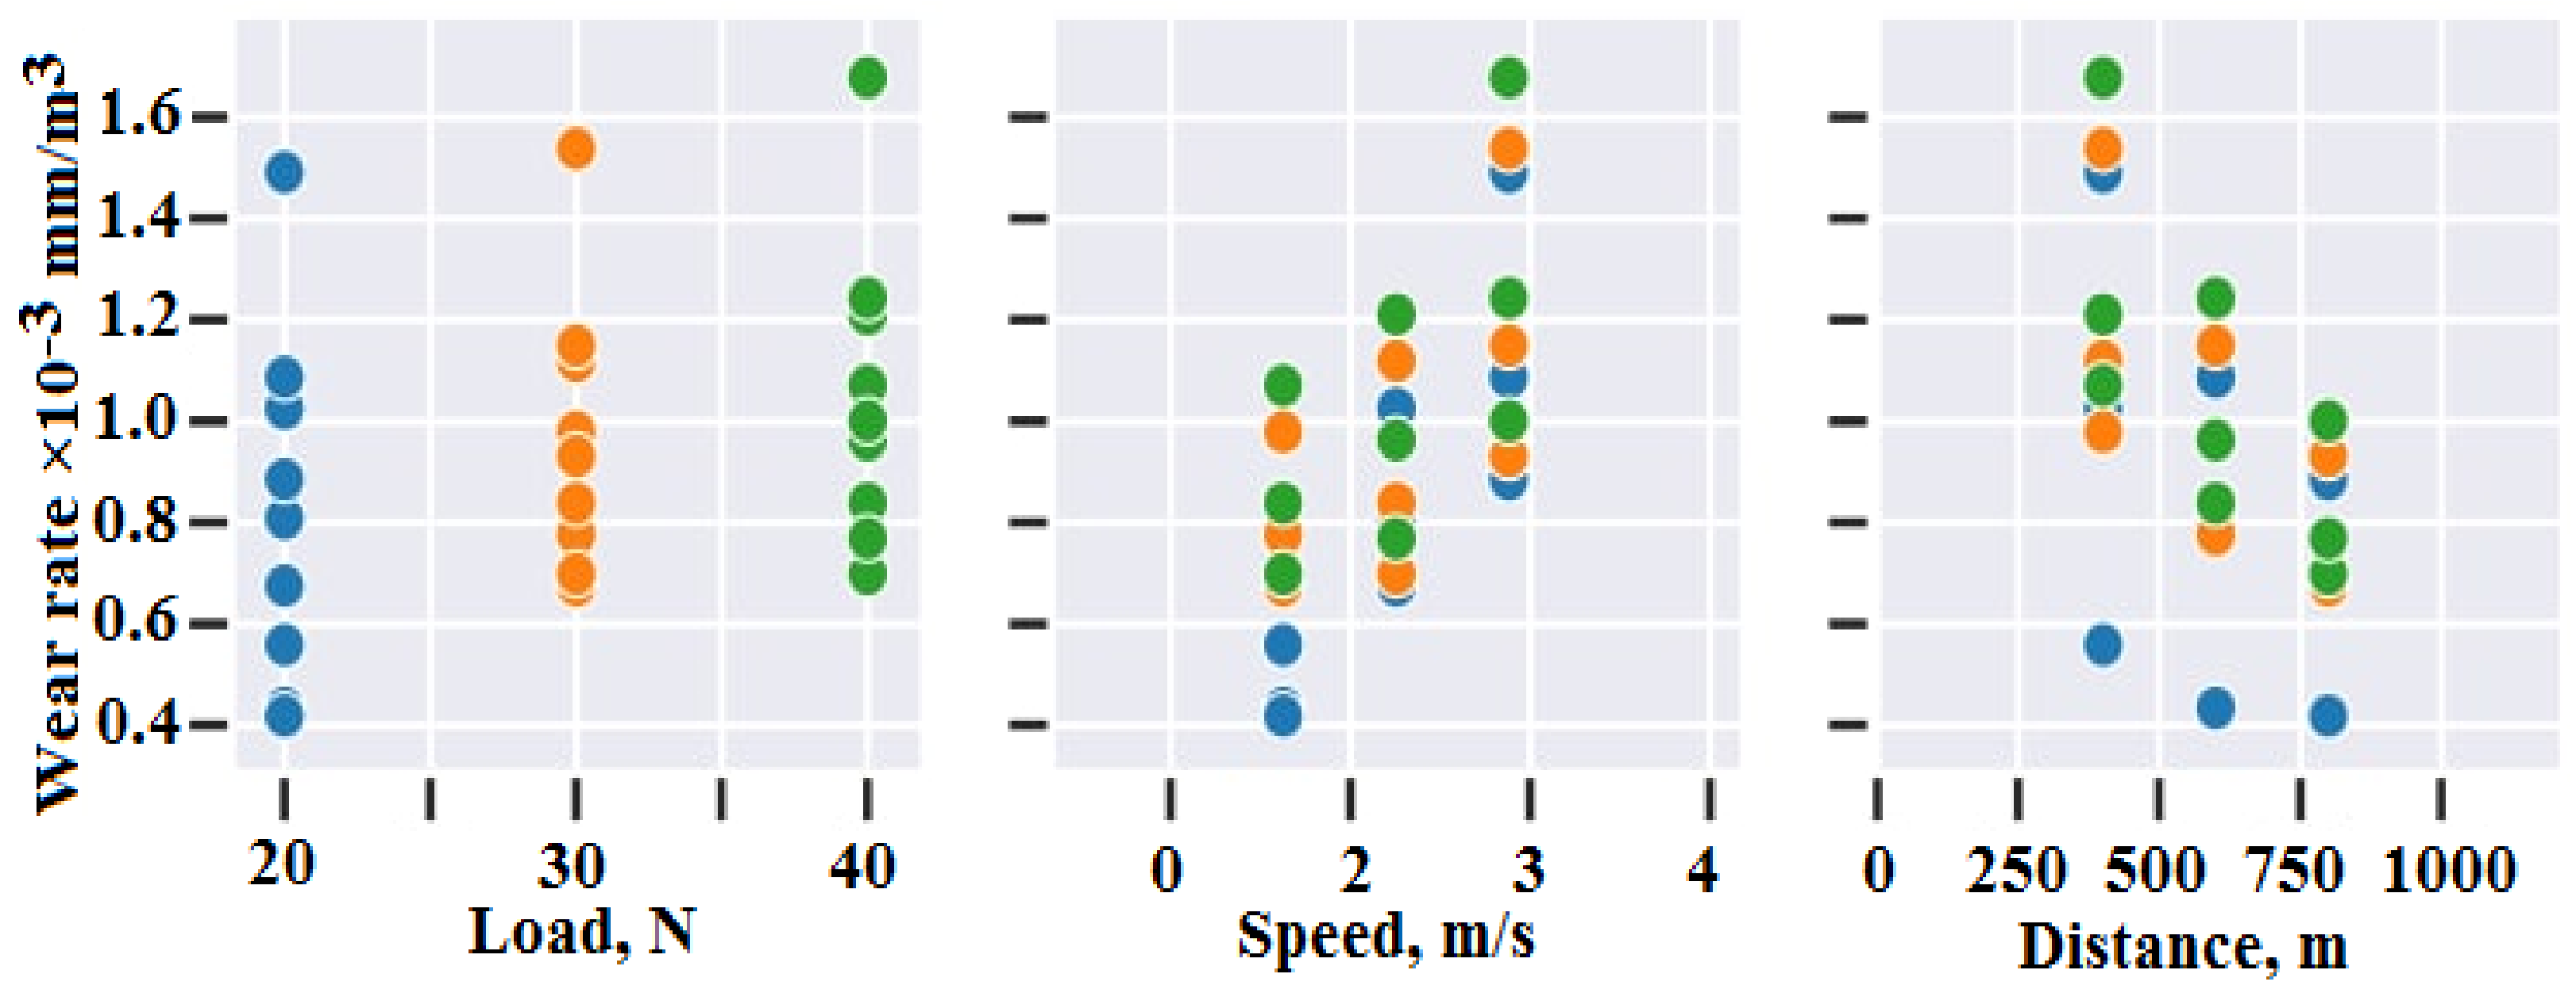
4.1. Analysis of Factors by Taguchi Method: Mini Tab_17
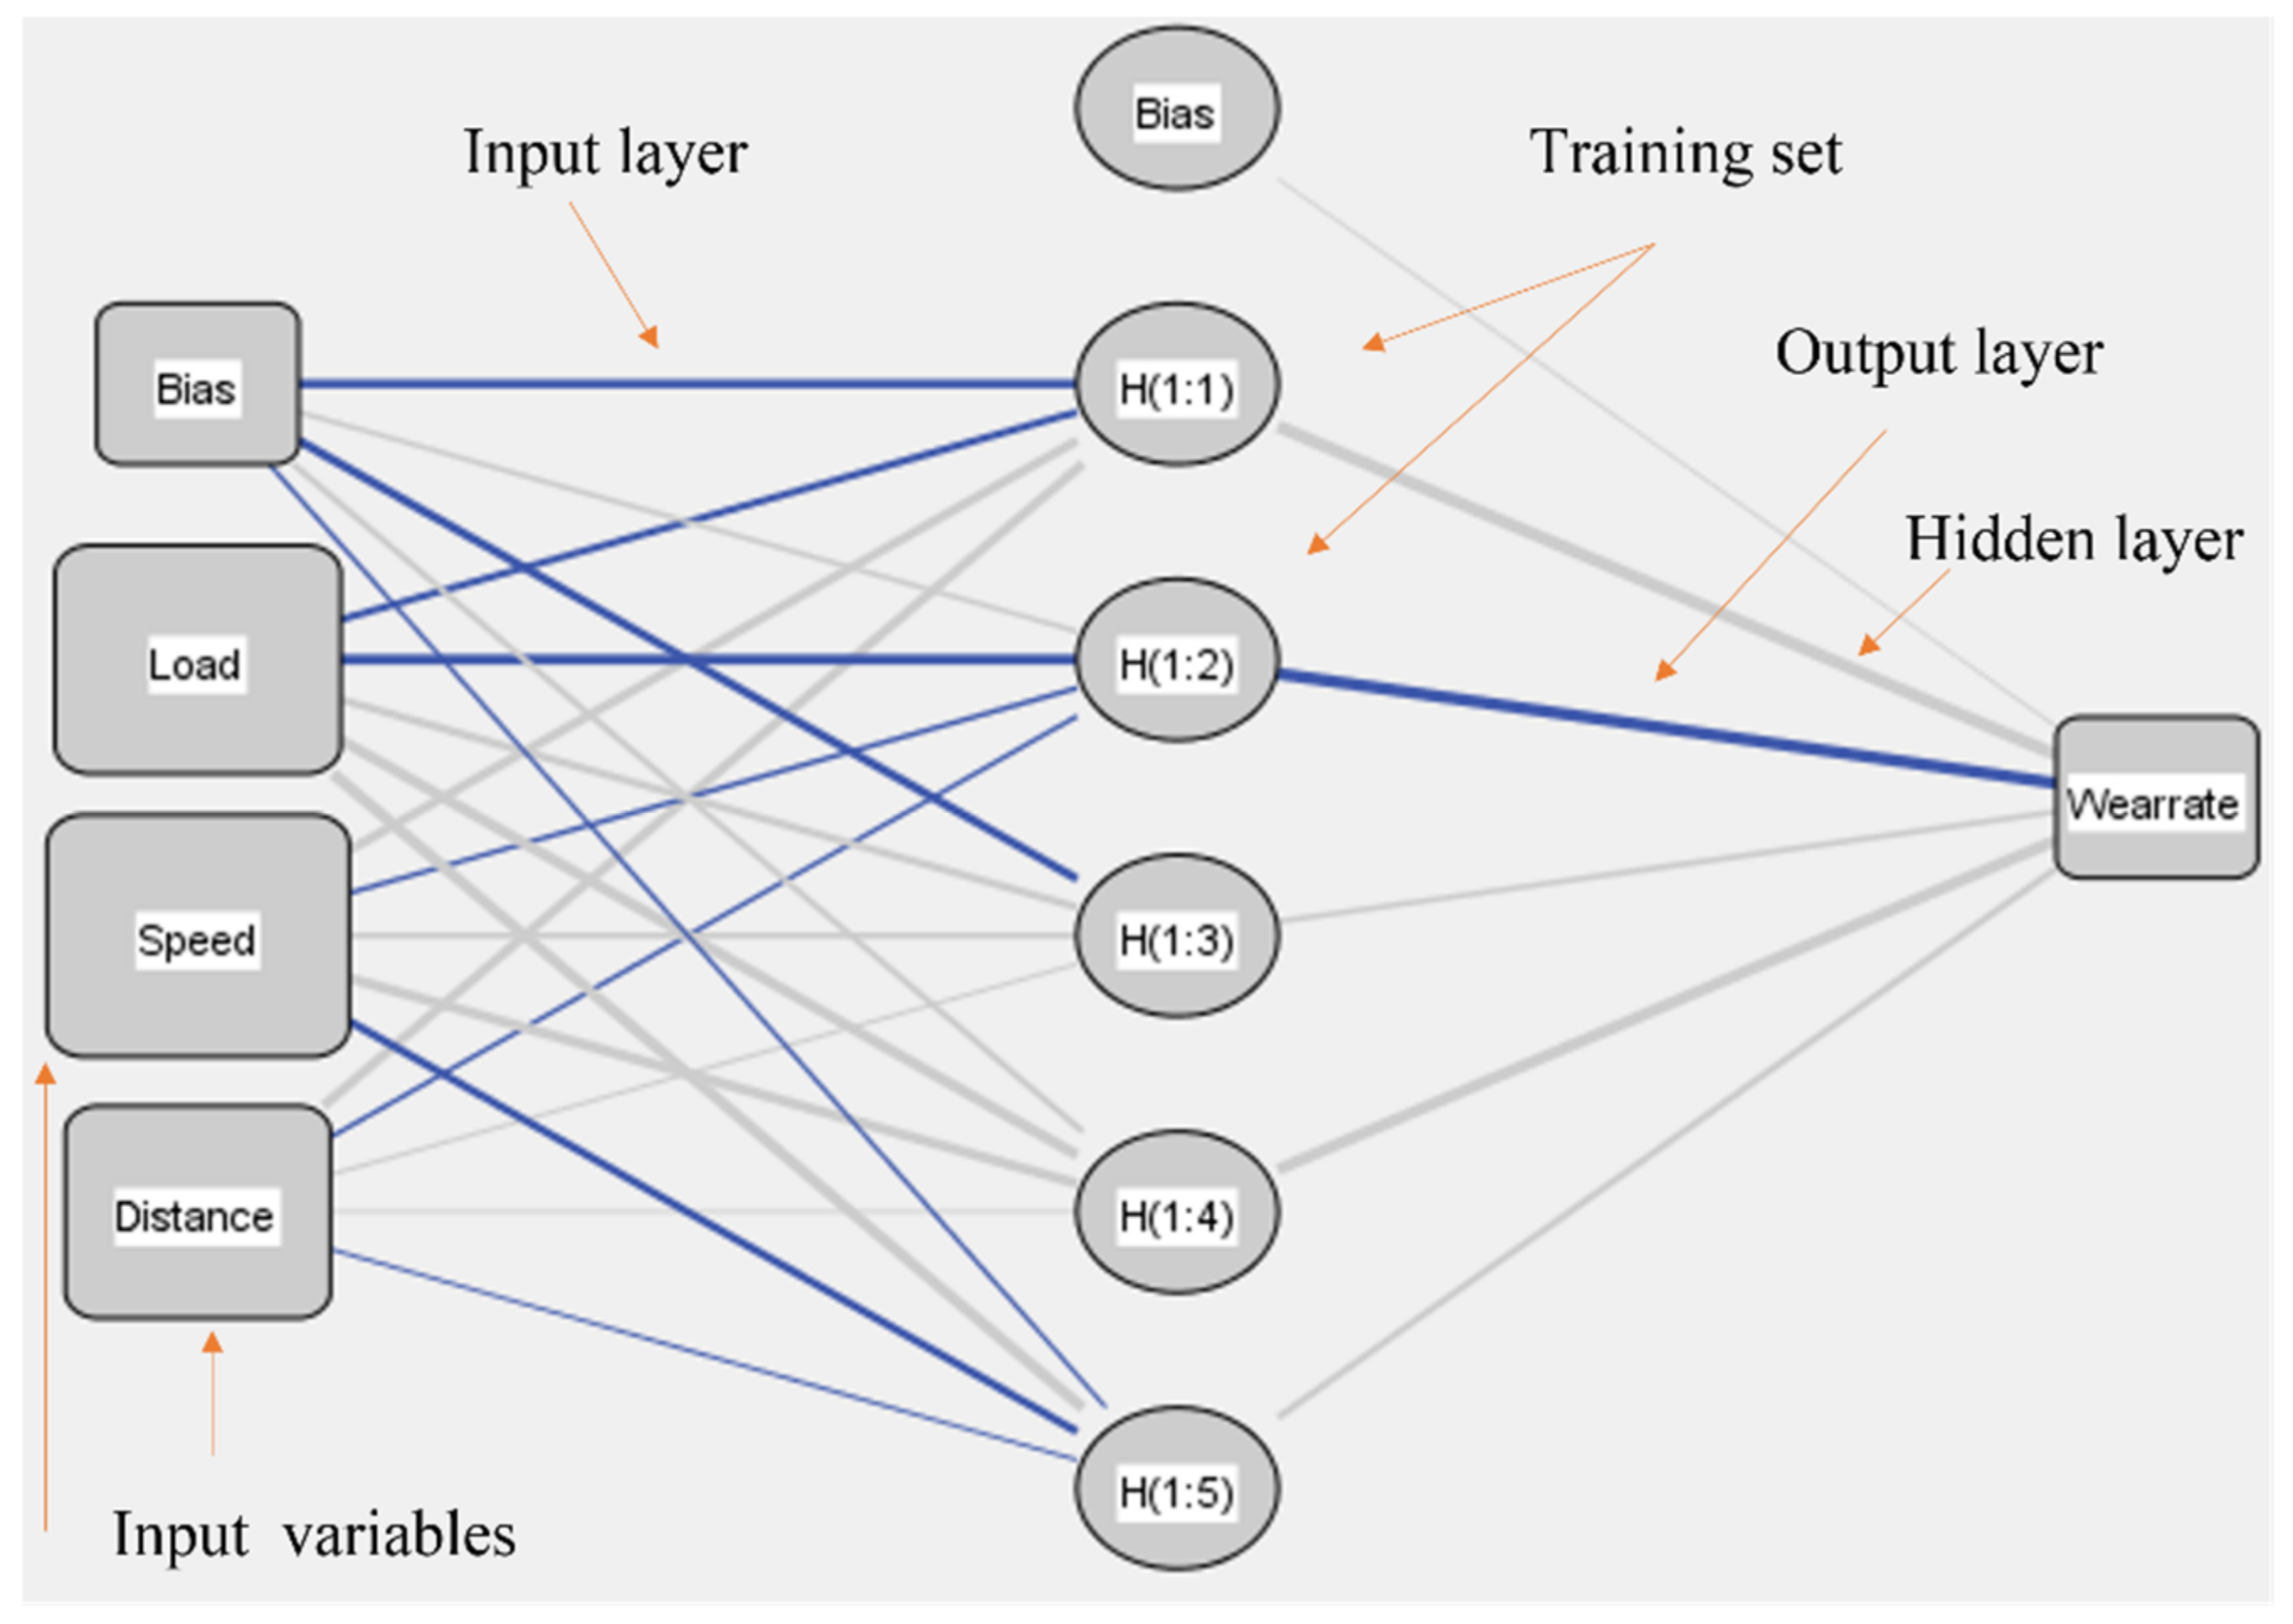
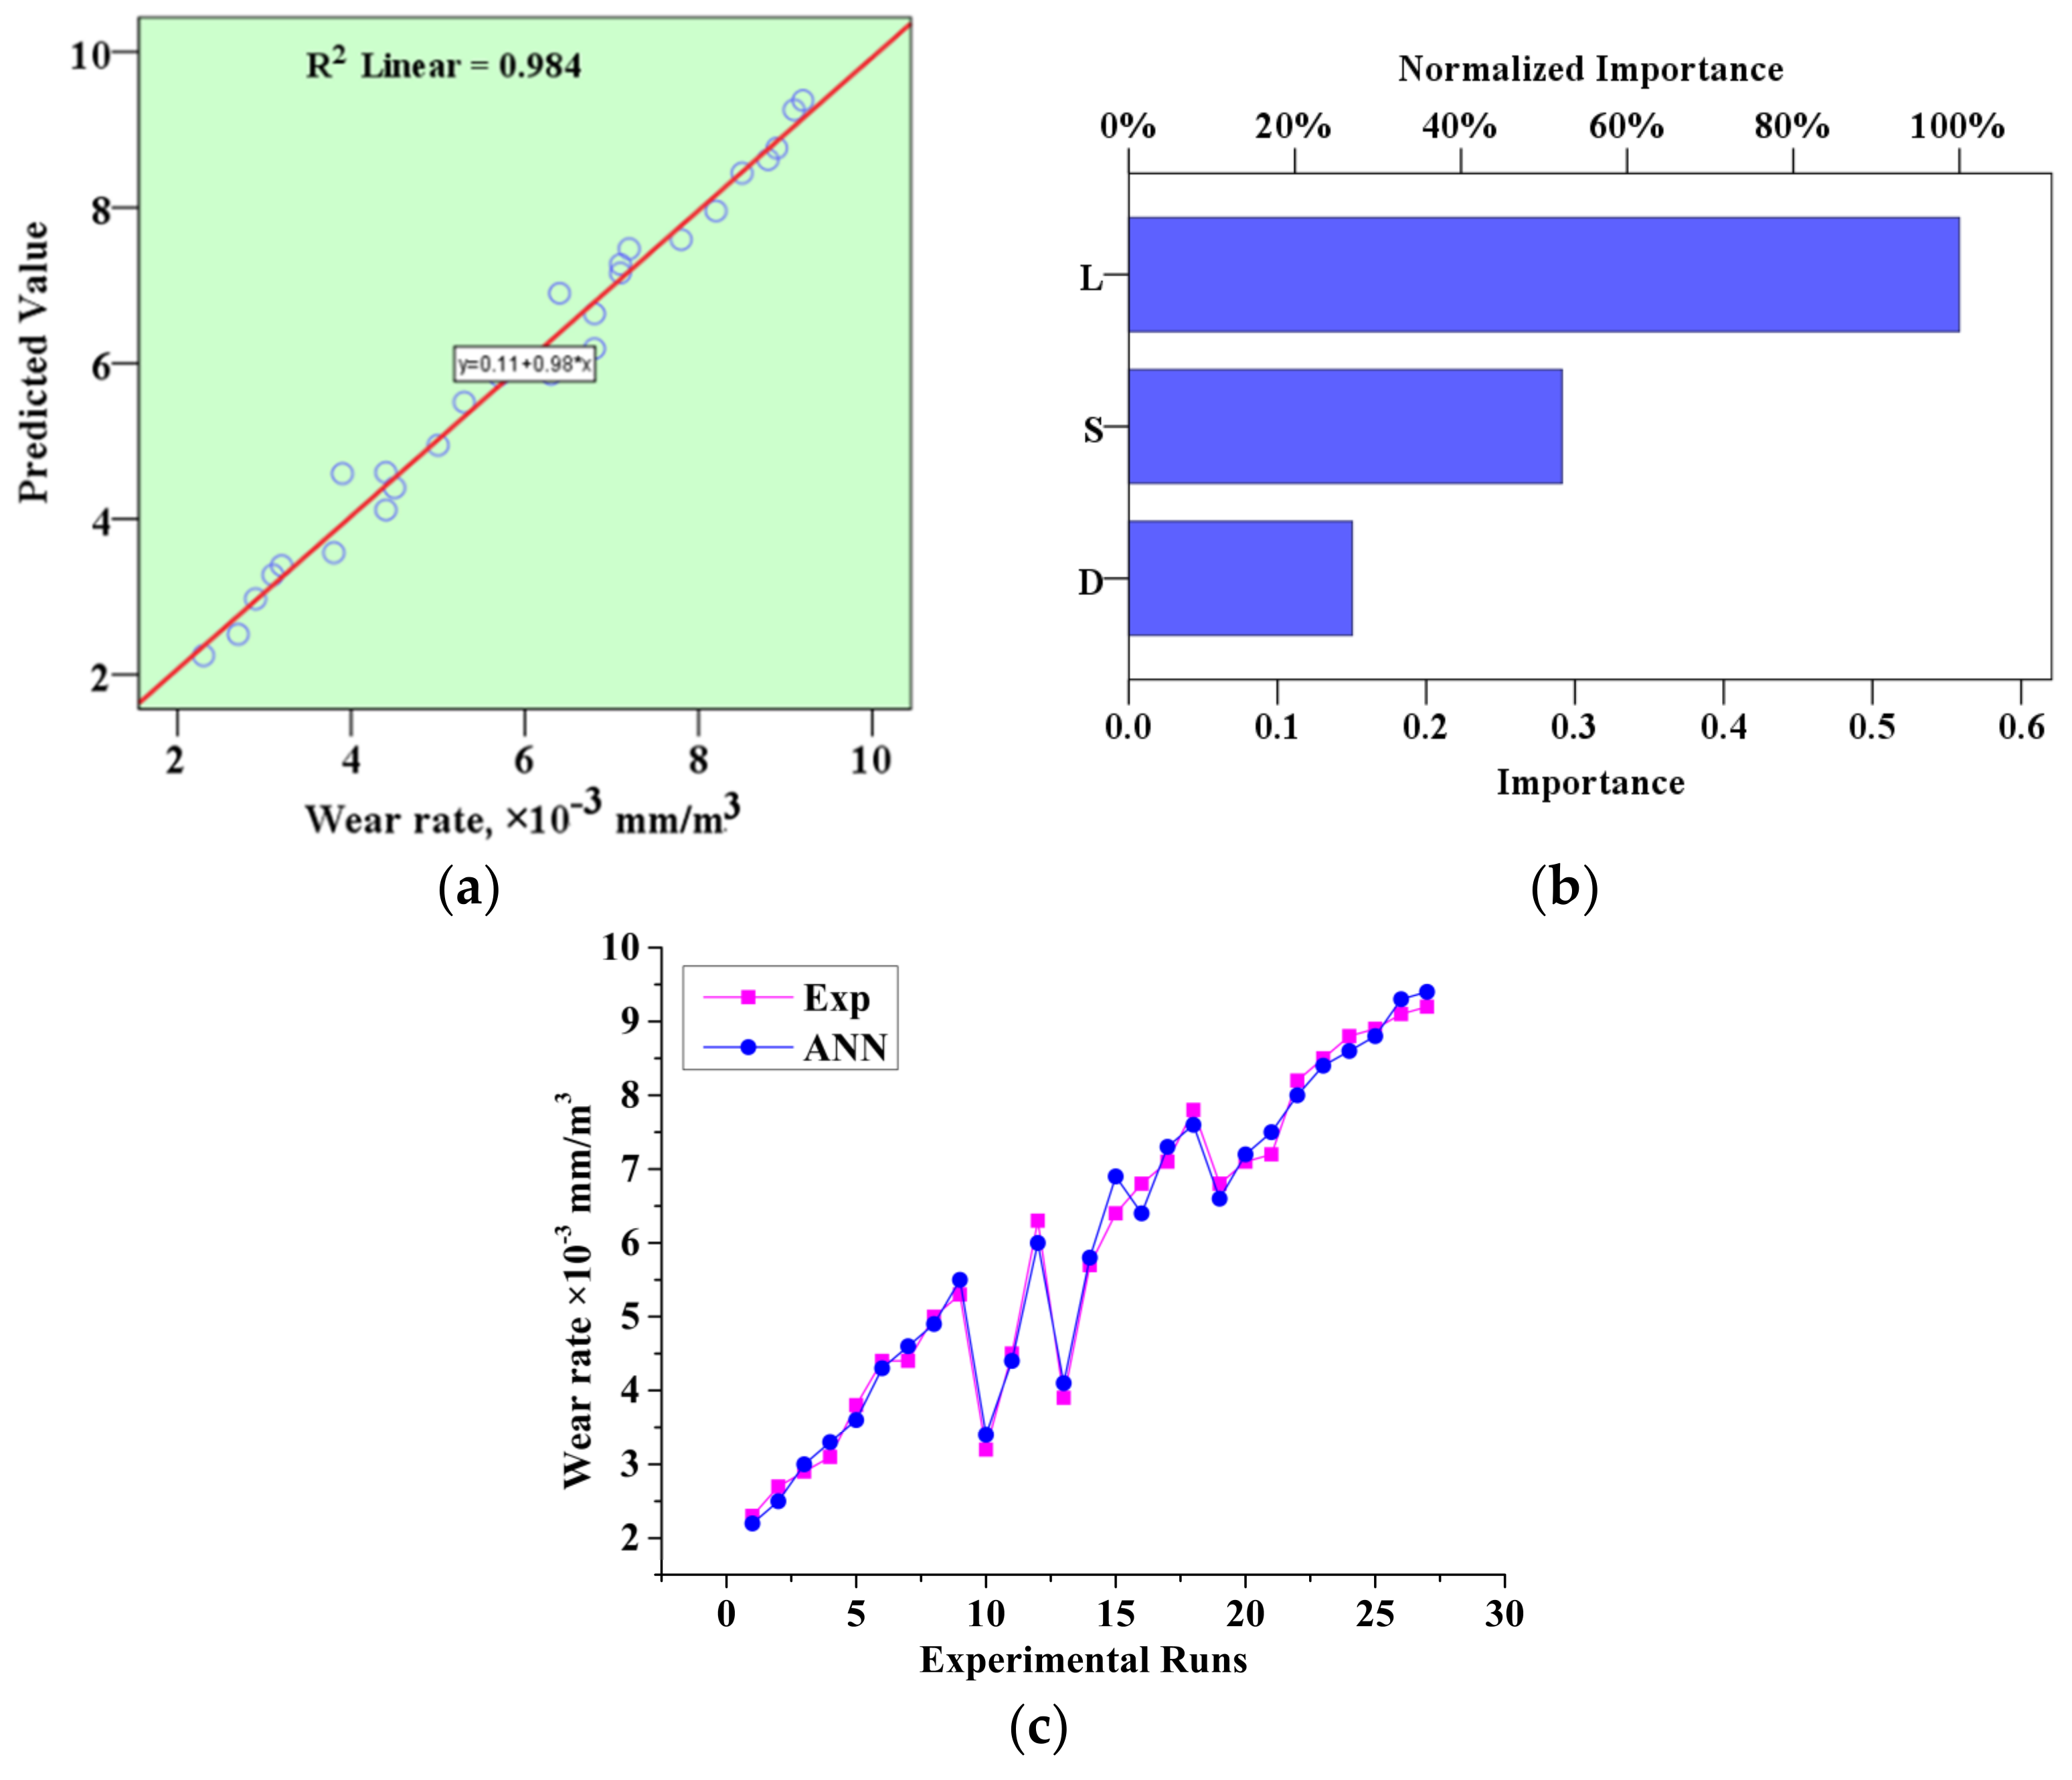
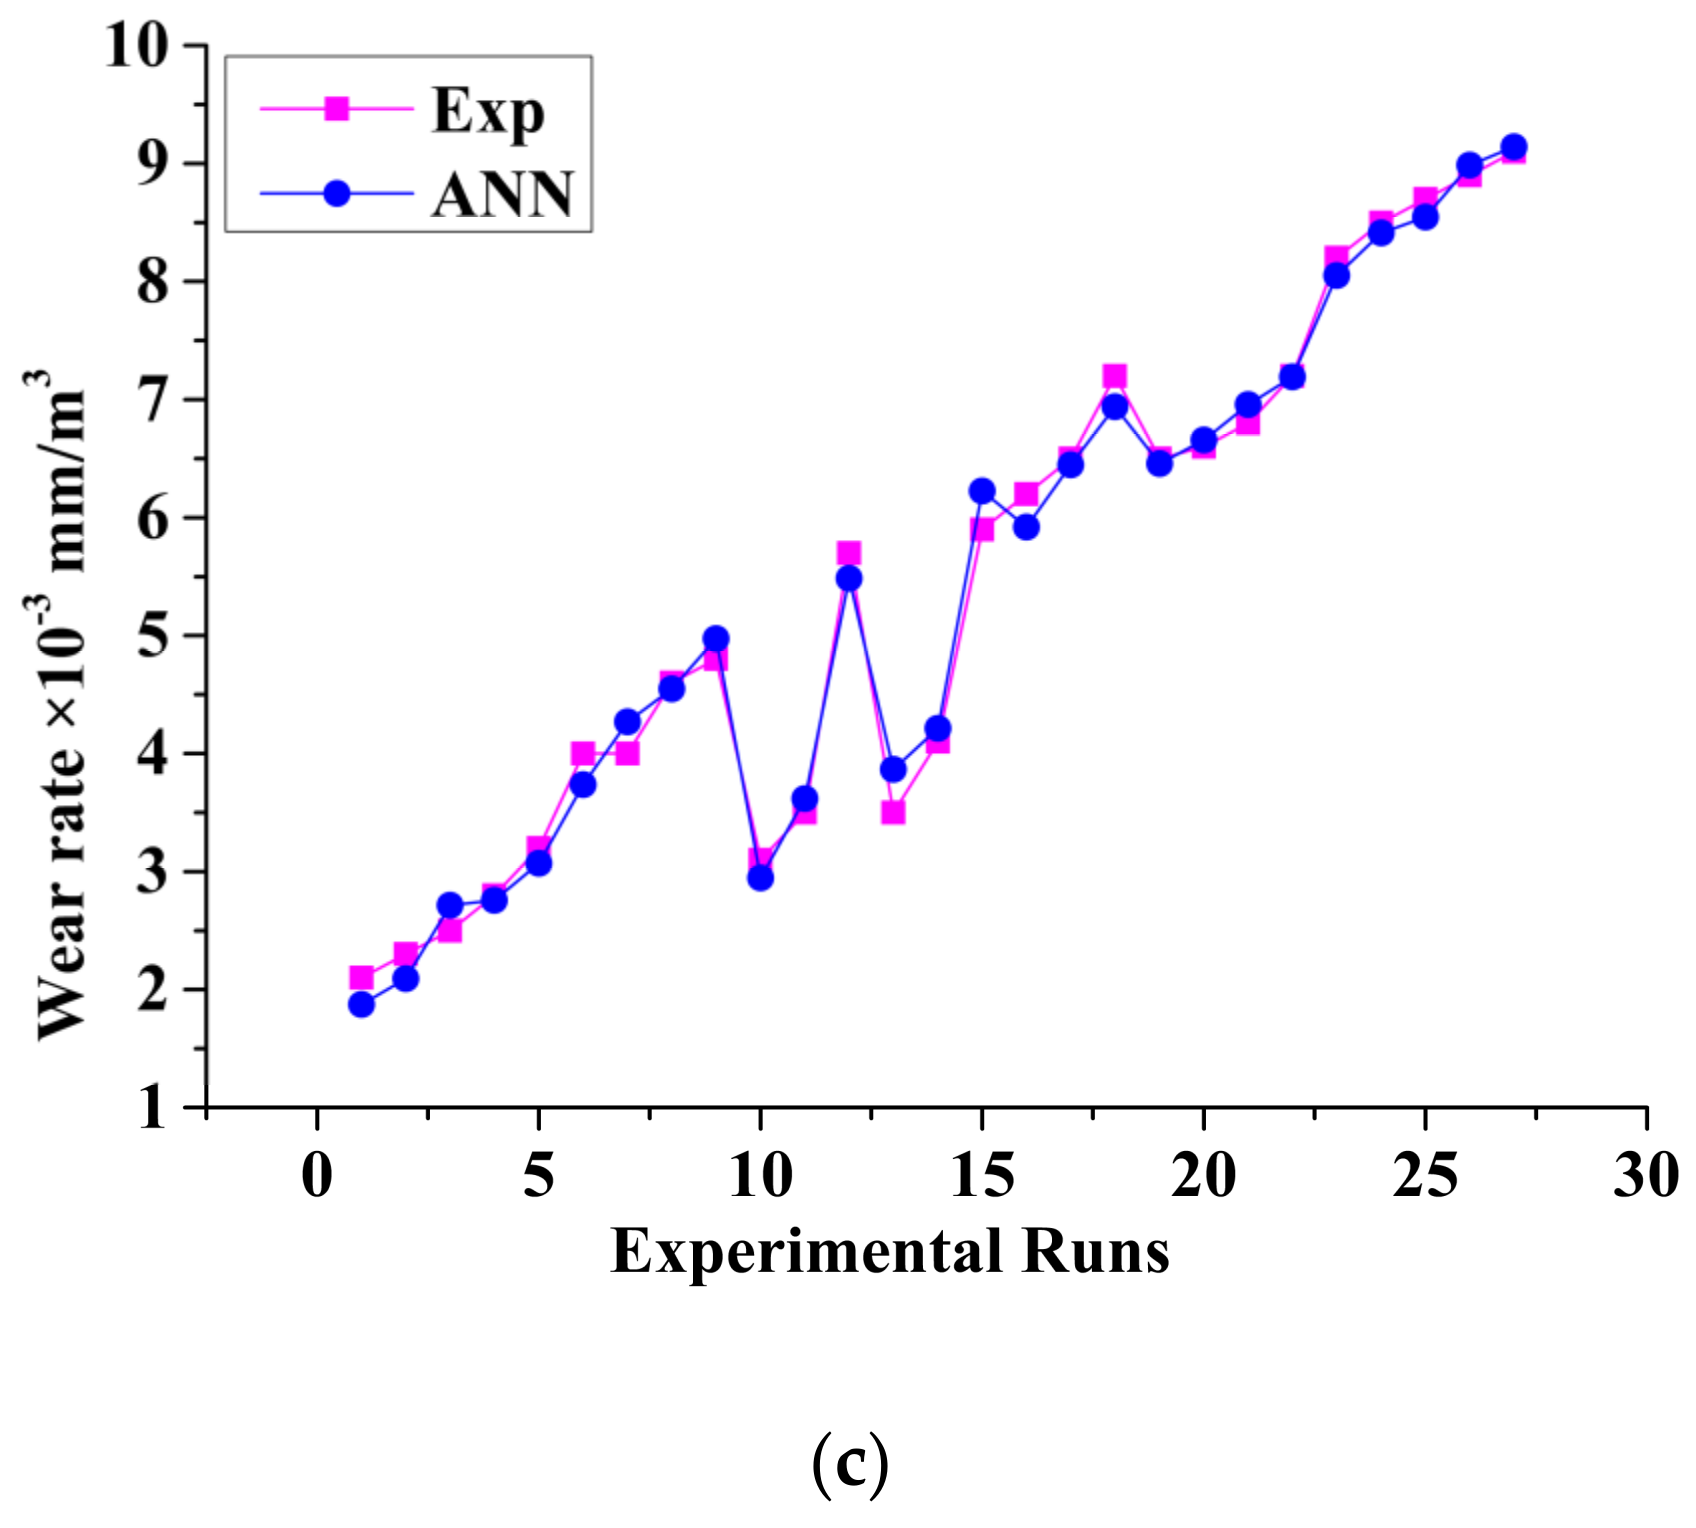
4.2. Analysis of Factors by Artificial Neural Network: IBMSSPSS Statistics 22
4.2.1. ANN Analysis for Sample A0
4.2.2. ANN Analysis for Sample A1
4.2.3. ANN Analysis for Sample A2
5. Worn Surface Morphology
6. Conclusions
- Hybridized composites were successfully fabricated through a liquid stir casting process.
- B4C and Gr particles were homogenously distributed in the Al2618 matrix.
- B4C and Gr particles were included in the B4C and Gr particles phase, creating a barrier to dislocation and helping to increase the matrix’s hardness.
- It was discovered that the degree of resistance to wear was exactly proportional to the hardness.
- The addition of the B4C and Gr particles makes it possible to speculate that this has the effect of increasing the matrix’s wear resistance.
- For the 10 wt.% B4C and 5 wt.% Gr, the presence of a mechanically mixed layer with B4C and Gr means the weight loss is substantially smaller.
- The ANN and Taguchi results confirm that load contributed more to the wear rate of the composites.
Author Contributions
Funding
Data Availability Statement
Conflicts of Interest
References
- Straffelini, G.; Pellizzari, M.; Molinari, A. Influence of load and temperature on the dry sliding behaviour of Al-based metal-matrix-composites against friction material. Wear 2004, 256, 754–763. [Google Scholar] [CrossRef]
- Sharath, B.N.; Venkatesh, C.V.; Afzal, A.; Aslfattahi, N.; Aabid, A.; Baig, M.; Saleh, B. Multi ceramic particles inclusion in the aluminium matrix and wear characterization through experimental and response surface-artificial neural networks. Materials 2021, 14, 2895. [Google Scholar] [CrossRef] [PubMed]
- Kumar, A.; Lal, S.; Kumar, S. Fabrication and characterization of A359/Al2O3 metal matrix composite using electromagnetic stir casting method. J. Mater. Res. Technol. 2013, 2, 250–254. [Google Scholar] [CrossRef]
- Zhang, G.S.; Xing, J.D.; Gao, Y.M. Impact wear resistance of WC/Hadfield steel composite and its interfacial characteristics. Wear 2006, 260, 728–734. [Google Scholar] [CrossRef]
- Uyyuru, R.K.; Surappa, M.K.; Brusethaug, S. Effect of reinforcement volume fraction and size distribution on the tribological behavior of Al-composite/brake pad tribo-couple. Wear 2006, 260, 1248–1255. [Google Scholar] [CrossRef]
- Sharath, B.N.; Madhu, K.S.; Venkatesh, C.V. Experimental Study on Dry Sliding Wear Behaviour of Al-B4C-Gr Metal Matrix Composite at Different Temperatures. Appl. Mech. Mater. 2019, 895, 96–101. [Google Scholar] [CrossRef]
- Gopalakrishnan, S.; Murugan, N. Production and wear characterisation of AA 6061 matrix titanium carbide particulate reinforced composite by enhanced stir casting method. Compos. B Eng. 2012, 43, 302–308. [Google Scholar] [CrossRef]
- Hamid, A.A.; Ghosh, P.K.; Jain, S.C.; Ray, S. Influence of particle content and porosity on the wear behaviour of cast in situ Al (Mn)–Al2O3 (MnO2) composite. Wear 2006, 260, 368–378. [Google Scholar] [CrossRef]
- Sharath, B.N.; Venkatesh, C.V. Study on Effect of boron carbide, aluminium oxide and graphite on dry sliding wear behaviour of aluminium based metal matrix composite at different temperature. Tribol.-Finn. J. Tribol. 2021, 38, 35–46. [Google Scholar]
- Klaffke, D.; Wäsche, R.; Janakiraman, N.; Aldinger, F. Tribological characterisation of siliconcarbonitride ceramics derived from preceramic polymers. Wear 2006, 260, 711–719. [Google Scholar] [CrossRef]
- Chikkegouda, S.P.; Gurudath, B.; Sharath, B.N.; Karthik, S.; Mahale, R.S. Mechanical and Tribological Characteristics of Aluminium 2618 Matrix Composite Reinforced with Boron Carbide. Biointerface Res. Appl. Chem. 2022, 12, 4. [Google Scholar]
- Lam, S.S.Y.; Petri, K.L.; Smith, A.E. Prediction and optimization of a ceramic casting process using a hierarchical hybrid system of neural networks and fuzzy logic. IISE Trans. 2000, 32, 83–91. [Google Scholar] [CrossRef]
- Karunakar, D.B.; Datta, G.L. Prevention of defects in castings using back propagation neural networks. Int. J. Adv. Manuf. Technol. 2007, 39, 1111–1124. [Google Scholar] [CrossRef]
- Dobrzanski, L.A.; Krupiński, M.; Zarychta, P.; Maniara, R. Analysis of influence of chemical composition of Al-Si-Cu casting alloy on formation of casting defects. J. Achiev. Mater. Manuf. Eng. 2007, 21, 53–56. [Google Scholar]
- Baradeswaran, A.; Perumal, A.E. Study on mechanical and wear properties of Al 7075/Al2O3/graphite hybrid composites. Compos. B Eng. 2014, 56, 464–471. [Google Scholar] [CrossRef]
- Hu, Q.; McColl, I.R.; Harris, S.J.; Waterhouse, R.B. The role of debris in the fretting wear of a SiC reinforced aluminium alloy matrix composite. Wear 2000, 245, 10–21. [Google Scholar] [CrossRef]
- Ayvaz, S.I.; Arslan, D.; Ayvaz, M. Investigation of mechanical and tribological behavior of SiC and B4C reinforced Al-Zn-Mg-Si-Cu alloy matrix surface composites fabricated via friction stir processing. Mater. Today Commun. 2022, 31, 103419. [Google Scholar] [CrossRef]
- Senthilkumar, N.; Tamizharasan, T.; Anbarasan, M. Mechanical characterization and tribological behaviour of Al-Gr-B4C metal matrix composite prepared by stir casting technique. Int. J. Adv. Eng. 2014, 1, 48–59. [Google Scholar]
- LLorca, J. High temperature fatigue of discontinuously-reinforced metal–matrix composites. Int. J. Fatigue 2002, 24, 233–240. [Google Scholar] [CrossRef]
- Rao, P.S.; Sivadasan, K.G.; Balasubramanian, P.K. Structure-property correlation on AA 2219 aluminium alloy weldments. Bull. Mater. Sci. 1996, 19, 549–557. [Google Scholar]
- Auradi, V.; Rajesh, G.L.; Kori, S.A. Processing of B4C Particulate Reinforced 6061Aluminum Matrix Composites by Melt Stirring Involving Two-step Addition. Procedia Manuf. 2014, 6, 1068–1076. [Google Scholar]
- Cho, M.H.; Ju, J.; Kim, S.J.; Jang, H. Tribological properties of solid lubricants (graphite, Sb2S3, MoS2) for automotive brake friction materials. Wear 2006, 260, 855–860. [Google Scholar] [CrossRef]
- Suresha, S.; Sridhara, B.K. Effect of silicon carbide particulates on wear resistance of graphitic aluminium matrix composites. Mater. Des. 2010, 31, 4470–4477. [Google Scholar] [CrossRef]
- Khan, A.; Puttegowda, M.; Jagadeesh, P.; Marwani, H.M.; Asiri, A.M.; Manikandan, A.; Khan, A.A.P.; Ashraf, G.M.; Rangappa, S.M.; Siengchin, S. Review on Nitride compounds and its polymer composites: A multifunctional material. J. Mater. Res. Technol. 2022, 18, 2175–2193. [Google Scholar] [CrossRef]
- Krakhmalev, P.V.; Bergström, J. Tribological behavior and wear mechanisms of MoSi2-base composites sliding against AA6063 alloy at elevated temperature. Wear 2006, 260, 450–457. [Google Scholar] [CrossRef]
- Kala, H.; Mer, K.K.S.; Kumar, S.A. Review on Mechanical and Tribological Behaviors of Stir Cast Aluminum Matrix Composites. Procedia Mater. Sci. 2014, 6, 1951–1960. [Google Scholar] [CrossRef]
- Patil, M.B.; Rajamani, S.B.; Mathad, S.N.; Patil, A.Y.; Hussain, M.A.; Alorfii, H.S.; Khan, A.; Asiri, A.M.; Khan, I.; Puttegowda, M. Microwave-assisted synthesis of poly (acrylamide-co-2-hydroxyethyl methacrylate)/chitosan semi-IPN ZnO nanocomposite membranes for food packaging applications. J. Mater. Res. Technol. 2022, 20, 3537–3548. [Google Scholar] [CrossRef]
- Khanna, V.; Kumar, V.; Bansal, S.A. Mechanical properties of aluminium-graphene/carbon nanotubes (CNTs) metal matrix composites: Advancement, opportunities and perspective. Mater. Res. Bull. 2021, 138, 111224. [Google Scholar] [CrossRef]
- Jayaprakash, D.; Niranjan, K.; Vinod, B. Studies on Mechanical and Microstructural Properties of Aluminium Hybrid Composites: Influence of SiC/Gr Particles by Double Stir-Casting Approach. Silicon 2022, 1–15. [Google Scholar] [CrossRef]
- Dey, A.; Khan, M.M. MCD approach for assessing the optimal operating condition during sliding wear characteristics of LM25/SiC AMCs processed by an improved stir casting technique. Silicon 2022, 14, 3673–3691. [Google Scholar] [CrossRef]
- NG, S.K.; Ravindranath, V.M.; GS, S.S. Dry sliding wear behavior of hybrid metal matrix composites. Int. J. Res. Eng. Technol. 2014, 3, 554–558. [Google Scholar]
- Hayajneh, M.T.; Hassan, A.M.; Mayyas, A.T. Artificial neural network modeling of the drilling process of self-lubricated aluminum/alumina/graphite hybrid composites synthesized by powder metallurgy technique. J. Alloy. Compd. 2009, 478, 559–565. [Google Scholar] [CrossRef]
- Alam, M.T.; Ansari, A.H. X-ray diffraction analysis and microstructural examination of al-sic composite fabricated by stir casting. Int. J. Sci. Technol. Manag. 2015, 4, 941–956. [Google Scholar]
- Suresha, S.; Sridhara, B.K. Friction characteristics of aluminium silicon carbide graphite hybrid composites. Mater. Des. 2012, 34, 576–583. [Google Scholar] [CrossRef]
- Basavarajappa, S.; Chandramohan, G.; Davim, J.P. Application of Taguchi techniques to study dry sliding wear behaviour of metal matrix composites. Mater. Des. 2007, 28, 1393–1398. [Google Scholar] [CrossRef]
- Prasad, D.S.; Shoba, C. Hybrid composites—A better choice for high wear resistant materials. J. Mater. Res. Technol. 2014, 3, 172–178. [Google Scholar] [CrossRef]
- Mahdavi, S.; Akhlaghi, F. Effect of the graphite content on the tribological behavior of Al/Gr and Al/30SiC/Gr composites processed by in situ powder metallurgy (IPM) method. Tribol. Lett. 2011, 44, 1–12. [Google Scholar] [CrossRef]
- Alaneme, K.K.; Sanusi, K.O. Microstructural characteristics, mechanical and wear behaviour of aluminium matrix hybrid composites reinforced with alumina, rice husk ash and graphite. Eng. Sci. Technol. Int. J. 2015, 18, 416–422. [Google Scholar] [CrossRef]
- Baradeswaran, A.E.P.A.; Perumal, A.E. Influence of B4C on the Tribological and Mechanical Properties of Al 7075-B4C Composites. Compos. B Eng. 2013, 54, 146–152. [Google Scholar] [CrossRef]
- Şenel, M.C.; Kanca, Y.; Gürbüz, M. Reciprocating sliding wear properties of sintered Al-B4C composites. J. Miner. Metall. 2022, 29, 1261–1269. [Google Scholar] [CrossRef]
- Halil, K.; İsmail, O.; Sibel, D.; Ramazan, Ç. Wear and mechanical properties of Al6061/SiC/B4C hybrid composites produced with powder metallurgy. J. Mater. Res. Technol. 2019, 8, 5348–5361. [Google Scholar] [CrossRef]
- Alizadeh, A.; Abdollahi, A.; Biukani, H. Creep behavior and wear resistance of Al 5083 based hybrid composites reinforced with carbon nanotubes (CNTs) and boron carbide (B4C). J. Alloy. Compd. 2015, 650, 783–793. [Google Scholar] [CrossRef]
- Radhika, N.; Sasikumar, J.; Sylesh, J.L.; Kishore, R. Dry reciprocating wear and frictional behaviour of B4C reinforced functionally graded and homogenous aluminium matrix composites. J. Mater. Res. Technol. 2020, 9, 1578–1592. [Google Scholar] [CrossRef]
- Madhu, K.S.; Venkatesh, C.V.; Sharath, B.N.; Karthik, S. Characterization and Evaluation of Mechanical Properties of Al-Zn Based Hybrid Metal Matrix Composites. Appl. Sci. Eng. Prog. 2022, 16, 5804. [Google Scholar] [CrossRef]
- Şenel, M.C.; Üstün, M. Dry Sliding Wear and Friction Behavior of Graphene/ZrO2 Binary Nanoparticles Reinforced Aluminum Hybrid Composites. Arab. J. Sci. Eng. 2022, 24, 9253–9269. [Google Scholar] [CrossRef]
- Özbek, N.A.; Karadag, M.İ.; Özbek, O. Optimization of flank wear and surface roughness during turning of AISI 304 stainless steel using the Taguchi method. Mater. Test. 2020, 62, 957–961. [Google Scholar] [CrossRef]
- Vedrtnam, A.; Kumar, A. Fabrication and wear characterization of silicon carbide and copper reinforced aluminium matrix composite. Mater. Discov. 2017, 9, 16–22. [Google Scholar] [CrossRef]
- Özbek, N.A. Optimization of flank wear and surface quality in the turning of 1.2343 tool steel using carbide tools coated via different methods. Surf. Topogr. Metrol. Prop. 2021, 9, 025028. [Google Scholar] [CrossRef]


| Element | Si | Fe | Cu | Mn | Mg | Cr | Ni | Zn | Ti | B | Ca | Al |
|---|---|---|---|---|---|---|---|---|---|---|---|---|
| Wt.% | 0.24 | 1.30 | 2.52 | 0.004 | 1.46 | 0.02 | 1.14 | 0.01 | 0.07 | 0.003 | 0.002 | Balance |
| Sample Designations | Composition | Al2618, % | Boron Carbide (B4C) wt.% | Graphite (Gr) wt.% |
|---|---|---|---|---|
| A0 | Al 2618 | 100 | 0 | 0 |
| A1 | Al 2618 + 5% B4C-5% Gr | 90 | 5 | 5 |
| A2 | Al 2618 + 10% B4C-5% Gr | 90 | 10 | 5 |
| Experimental Runs | Load (N) | Speed (m/s) | Distance (m) |
|---|---|---|---|
| 1 | 20 | 1.25 | 400 |
| 2 | 20 | 1.25 | 600 |
| 3 | 20 | 1.25 | 800 |
| 4 | 20 | 2.51 | 400 |
| 5 | 20 | 2.51 | 600 |
| 6 | 20 | 2.51 | 800 |
| 7 | 20 | 3.75 | 400 |
| 8 | 20 | 3.75 | 600 |
| 9 | 20 | 3.75 | 800 |
| 10 | 30 | 1.25 | 400 |
| 11 | 30 | 1.25 | 600 |
| 12 | 30 | 1.25 | 800 |
| 13 | 30 | 2.51 | 400 |
| 14 | 30 | 2.51 | 600 |
| 15 | 30 | 2.51 | 800 |
| 16 | 30 | 3.75 | 400 |
| 17 | 30 | 3.75 | 600 |
| 18 | 30 | 3.75 | 800 |
| 19 | 40 | 1.25 | 400 |
| 20 | 40 | 1.25 | 600 |
| 21 | 40 | 1.25 | 800 |
| 22 | 40 | 2.51 | 400 |
| 23 | 40 | 2.51 | 600 |
| 24 | 40 | 2.51 | 800 |
| 25 | 40 | 3.75 | 400 |
| 26 | 40 | 3.75 | 600 |
| 27 | 40 | 3.75 | 800 |
Publisher’s Note: MDPI stays neutral with regard to jurisdictional claims in published maps and institutional affiliations. |
© 2022 by the authors. Licensee MDPI, Basel, Switzerland. This article is an open access article distributed under the terms and conditions of the Creative Commons Attribution (CC BY) license (https://creativecommons.org/licenses/by/4.0/).
Share and Cite
Ballupete Nagaraju, S.; Kodigarahalli Somashekara, M.; Puttegowda, M.; Manjulaiah, H.; Kini, C.R.; Channarayapattana Venkataramaiah, V. Effect of B4C/Gr on Hardness and Wear Behavior of Al2618 Based Hybrid Composites through Taguchi and Artificial Neural Network Analysis. Catalysts 2022, 12, 1654. https://doi.org/10.3390/catal12121654
Ballupete Nagaraju S, Kodigarahalli Somashekara M, Puttegowda M, Manjulaiah H, Kini CR, Channarayapattana Venkataramaiah V. Effect of B4C/Gr on Hardness and Wear Behavior of Al2618 Based Hybrid Composites through Taguchi and Artificial Neural Network Analysis. Catalysts. 2022; 12(12):1654. https://doi.org/10.3390/catal12121654
Chicago/Turabian StyleBallupete Nagaraju, Sharath, Madhu Kodigarahalli Somashekara, Madhu Puttegowda, Hareesha Manjulaiah, Chandrakant R. Kini, and Venkatesh Channarayapattana Venkataramaiah. 2022. "Effect of B4C/Gr on Hardness and Wear Behavior of Al2618 Based Hybrid Composites through Taguchi and Artificial Neural Network Analysis" Catalysts 12, no. 12: 1654. https://doi.org/10.3390/catal12121654
APA StyleBallupete Nagaraju, S., Kodigarahalli Somashekara, M., Puttegowda, M., Manjulaiah, H., Kini, C. R., & Channarayapattana Venkataramaiah, V. (2022). Effect of B4C/Gr on Hardness and Wear Behavior of Al2618 Based Hybrid Composites through Taguchi and Artificial Neural Network Analysis. Catalysts, 12(12), 1654. https://doi.org/10.3390/catal12121654