
A Model of Catalytic Cracking: Catalyst Deactivation Induced by Feedstock and Process Variables


Abstract
:1. Introduction
2. Results and Discussion
2.1. Experimental
2.1.1. Feedstocks
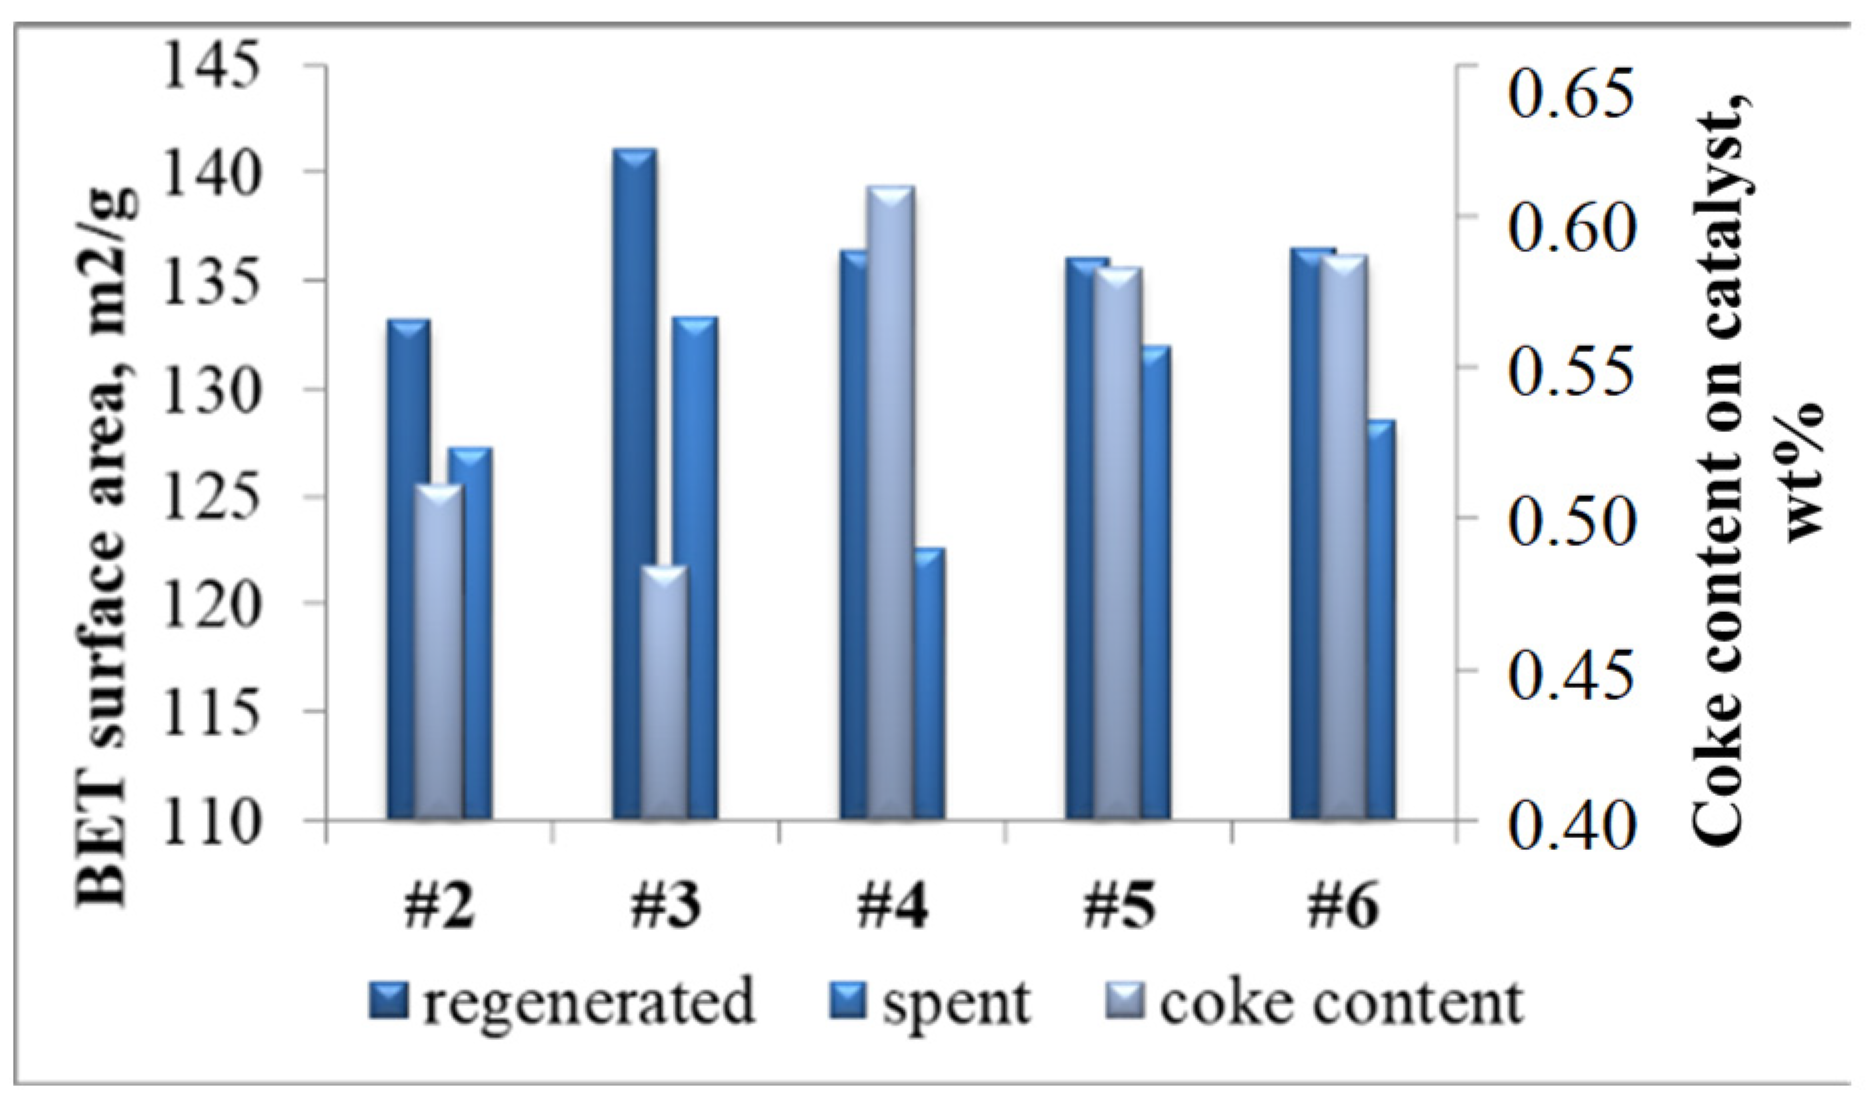
2.1.2. Catalysts
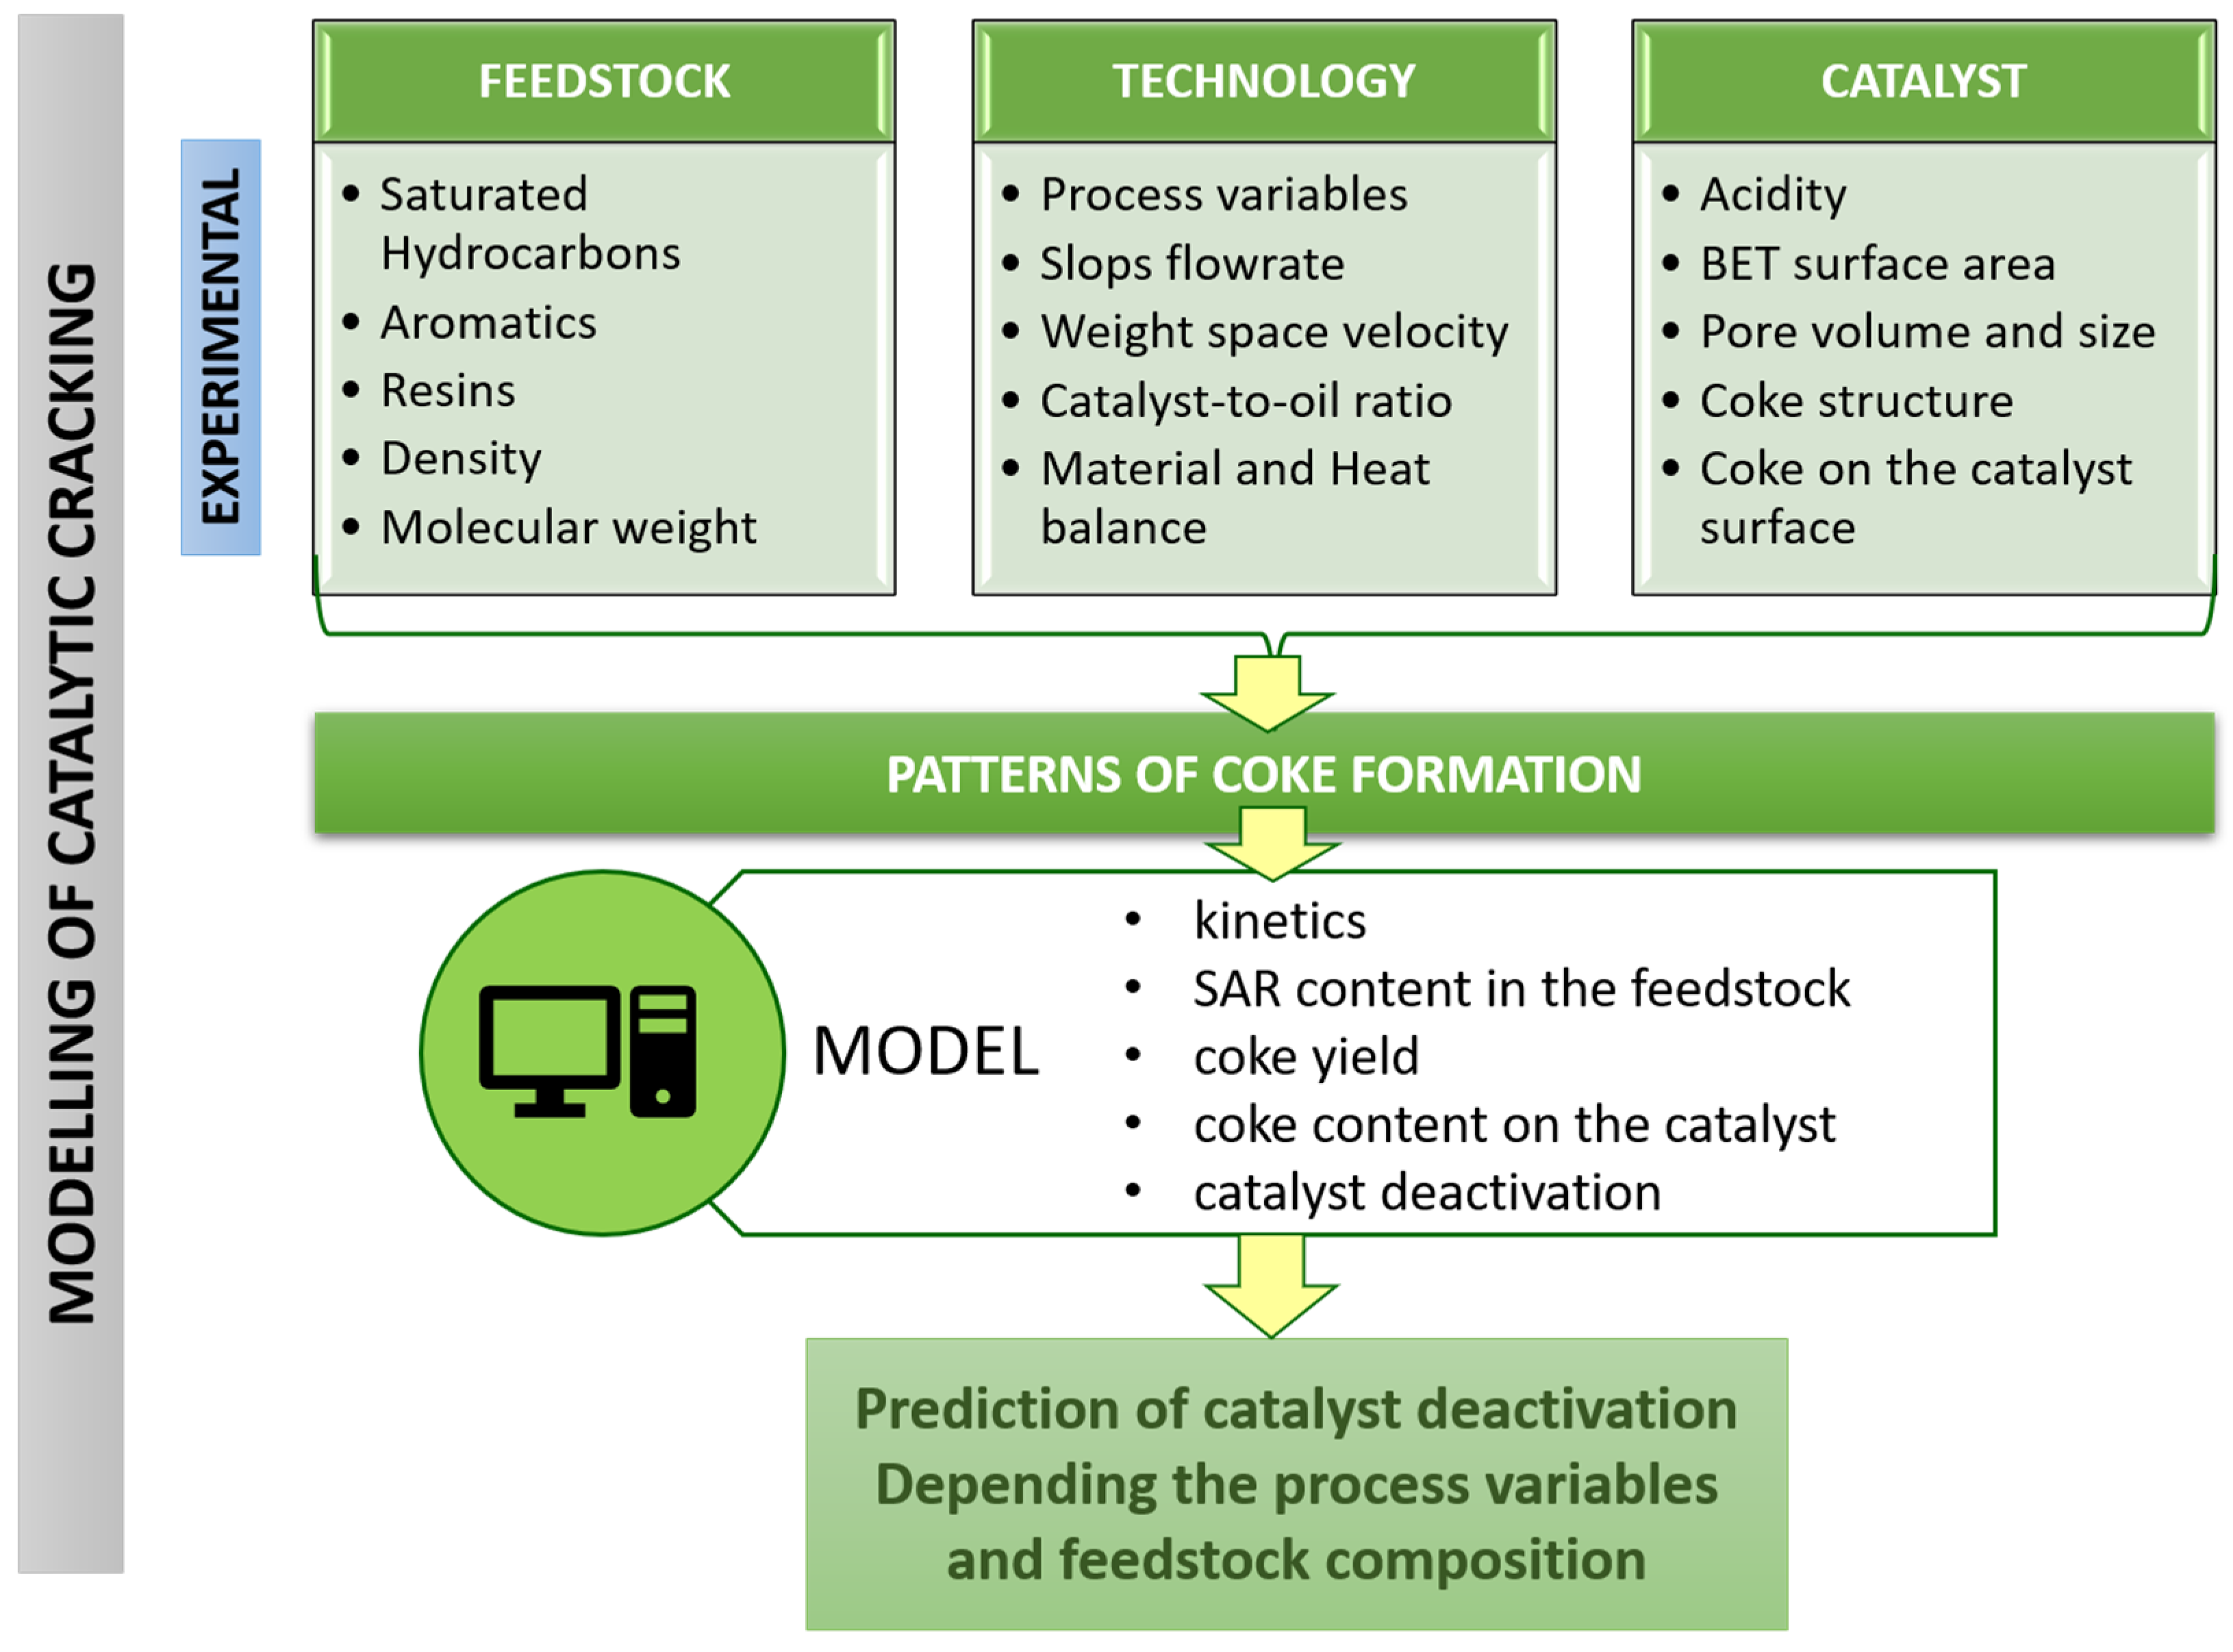
2.2. Modelling
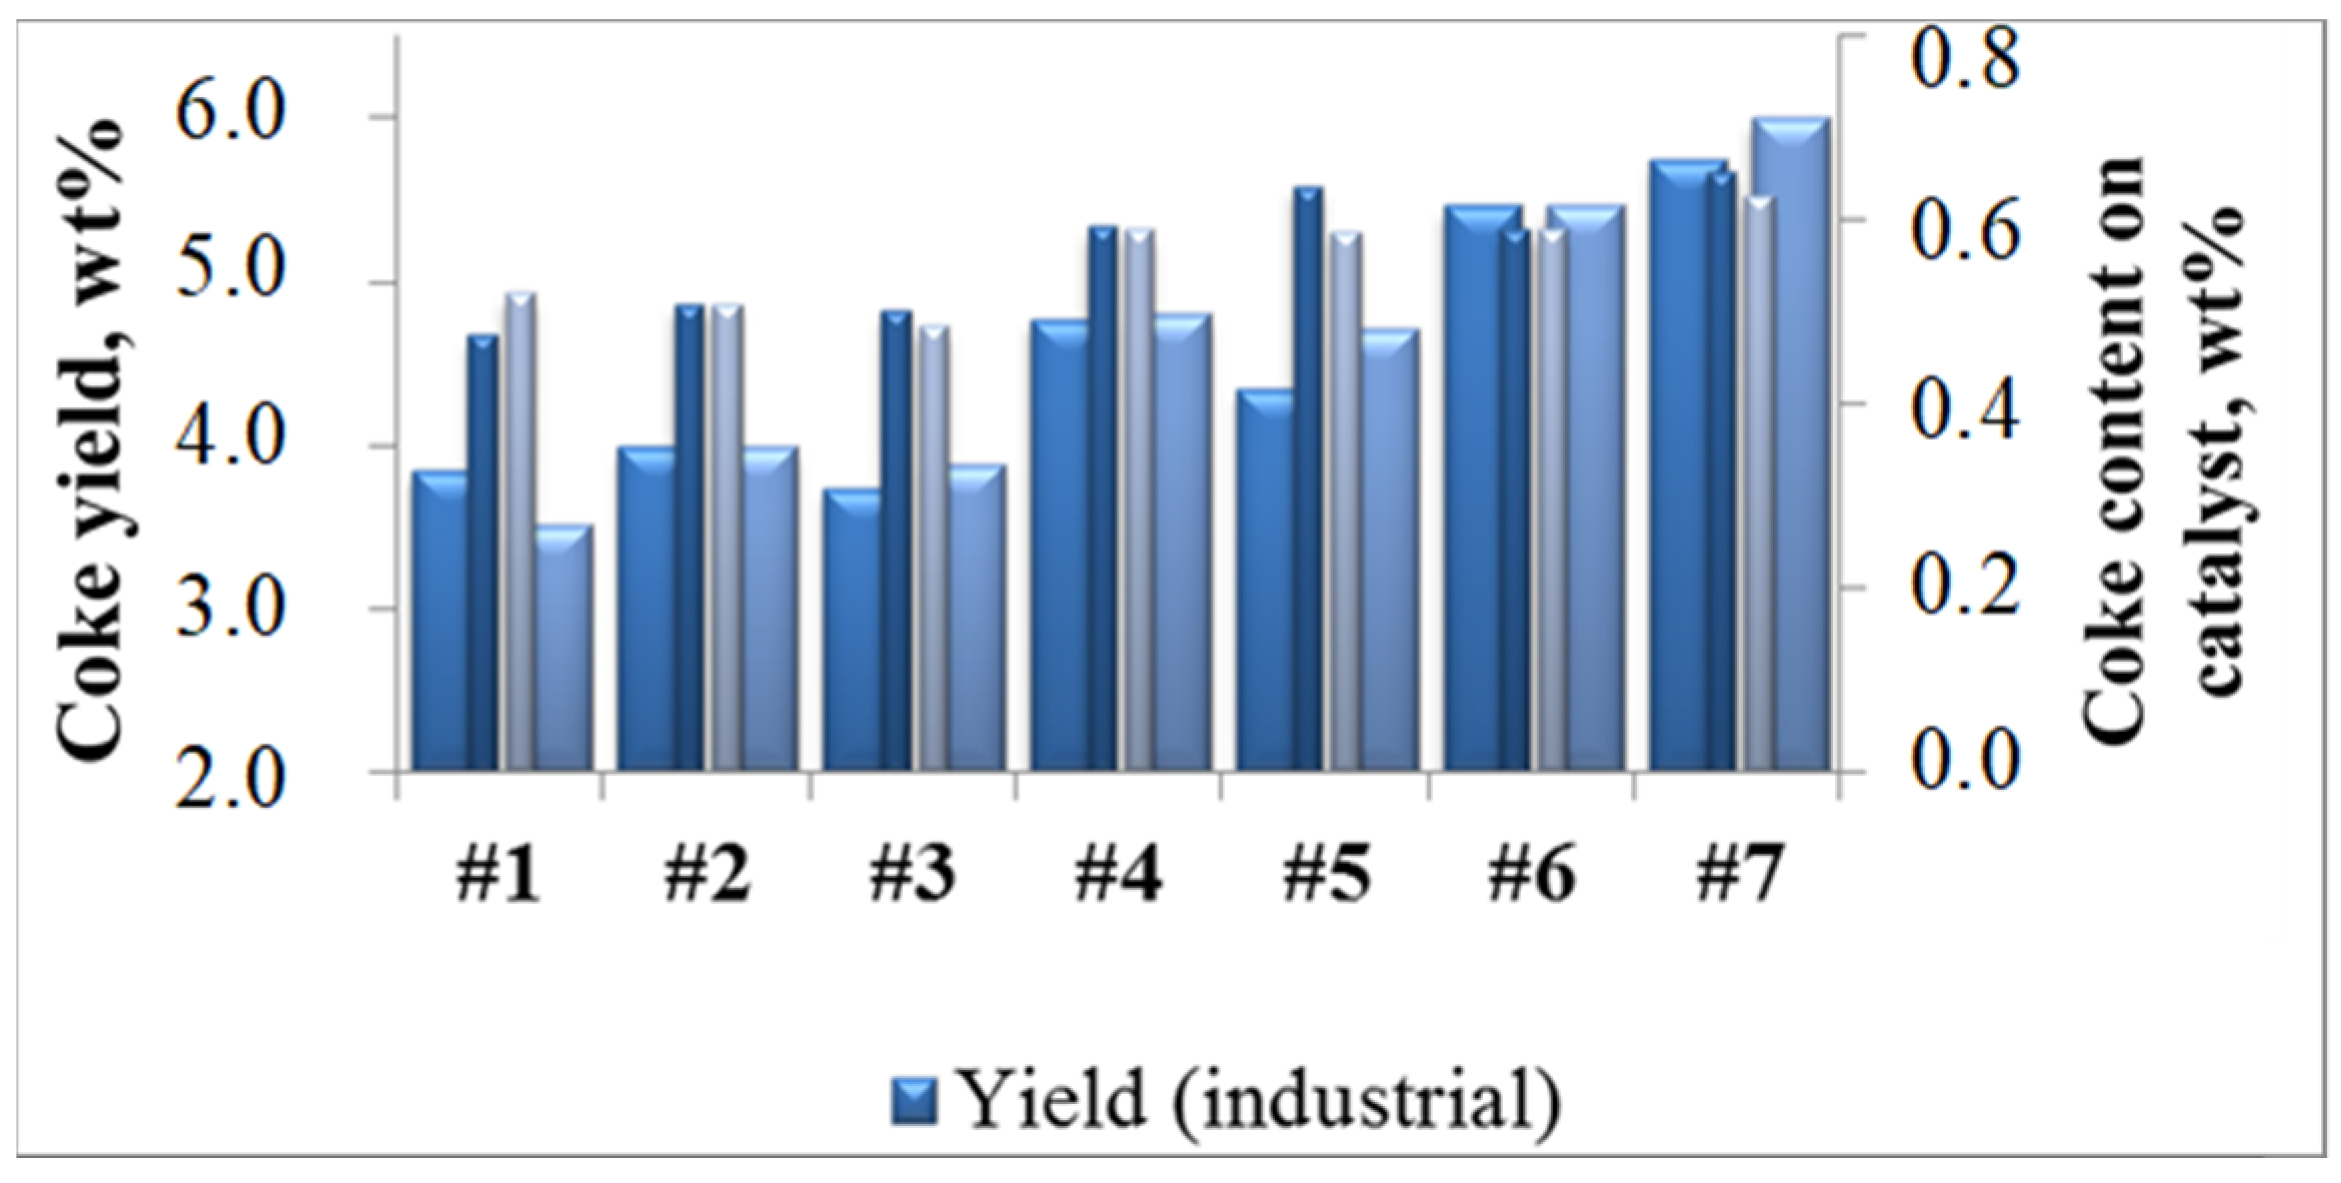
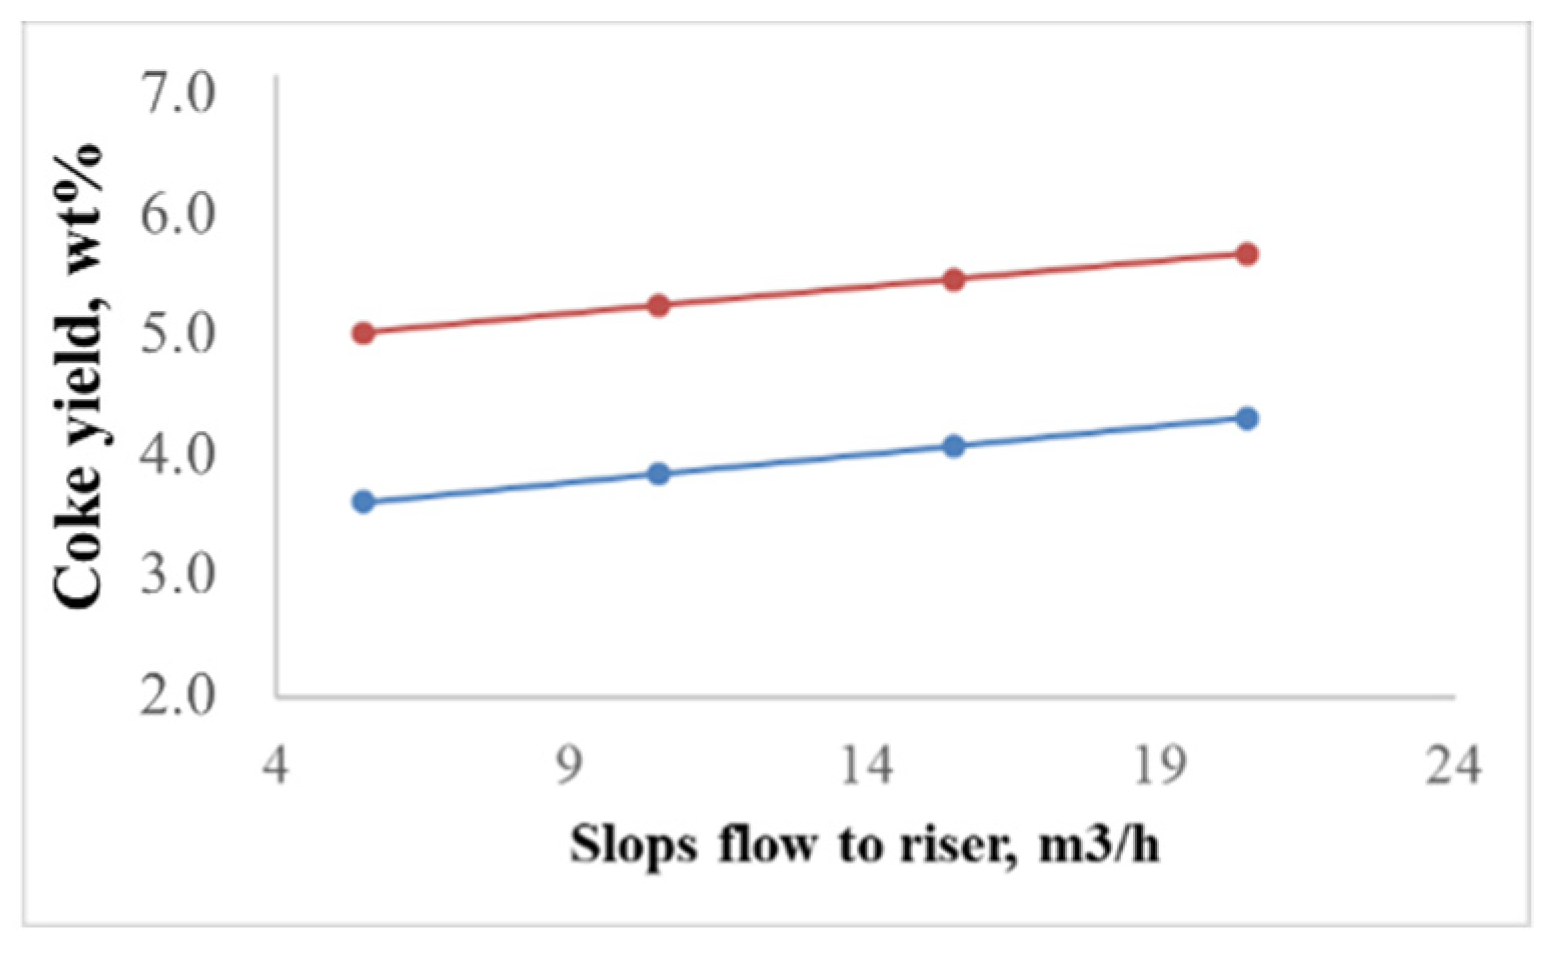
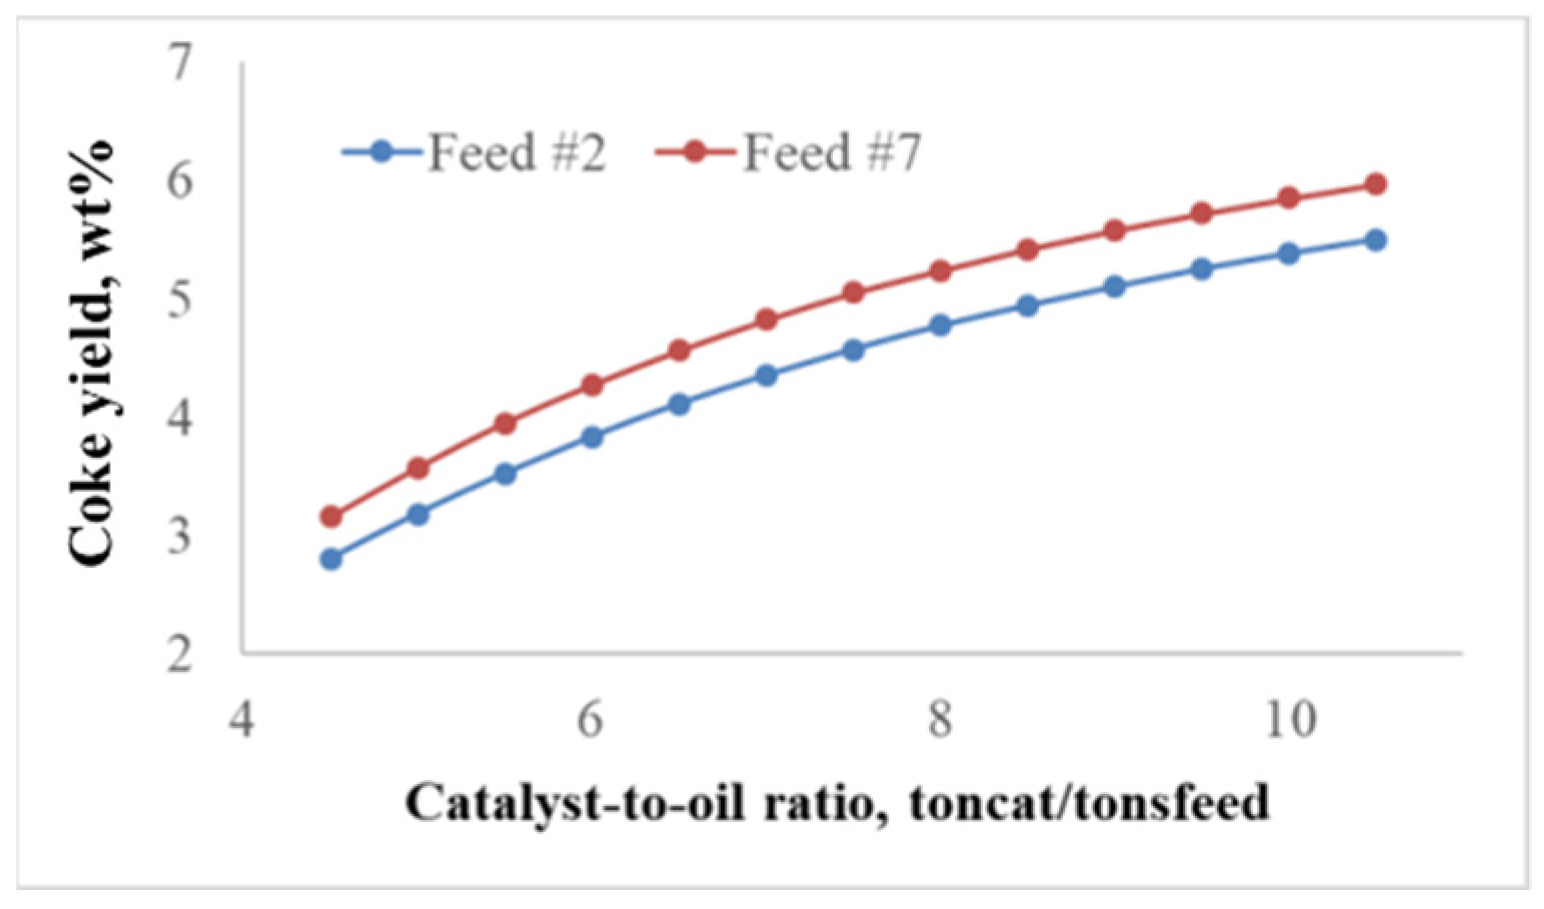
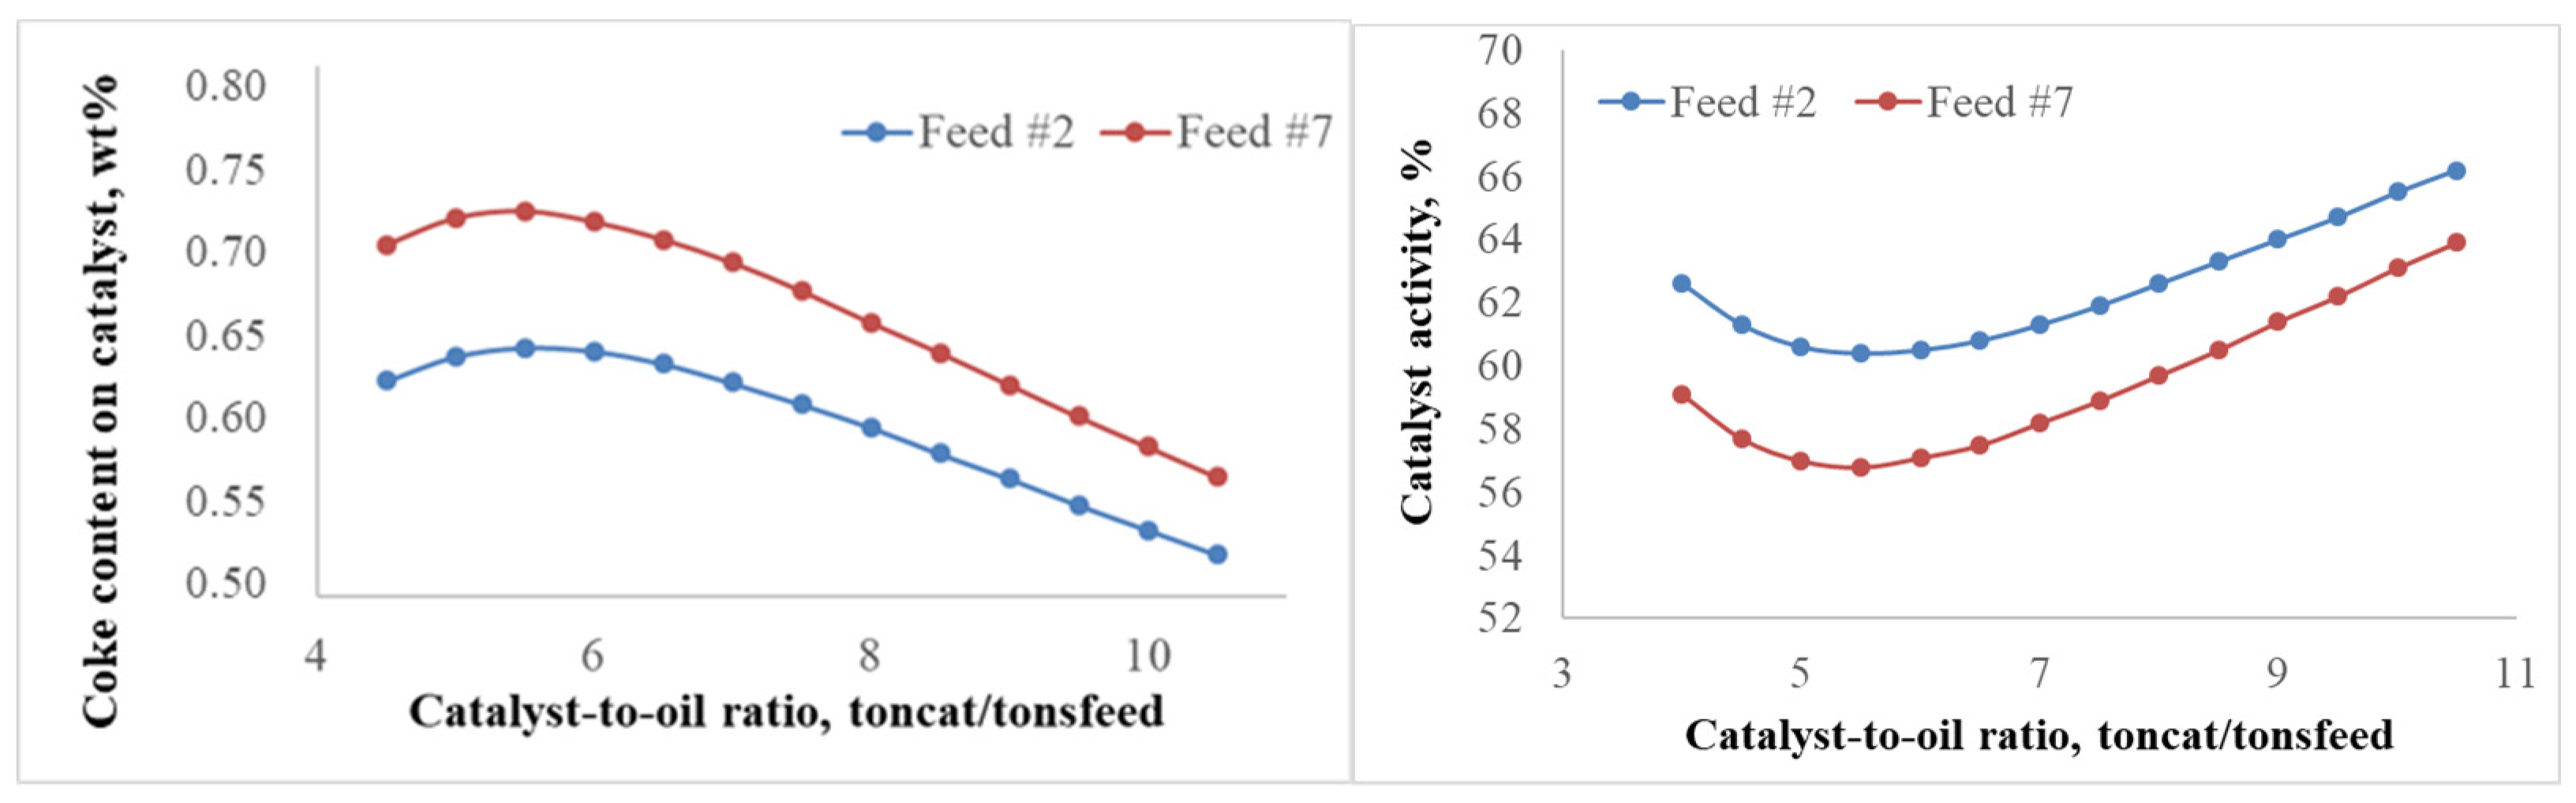
2.2.1. Effect of the Feedstock Composition and Process Variables on Coke Formation
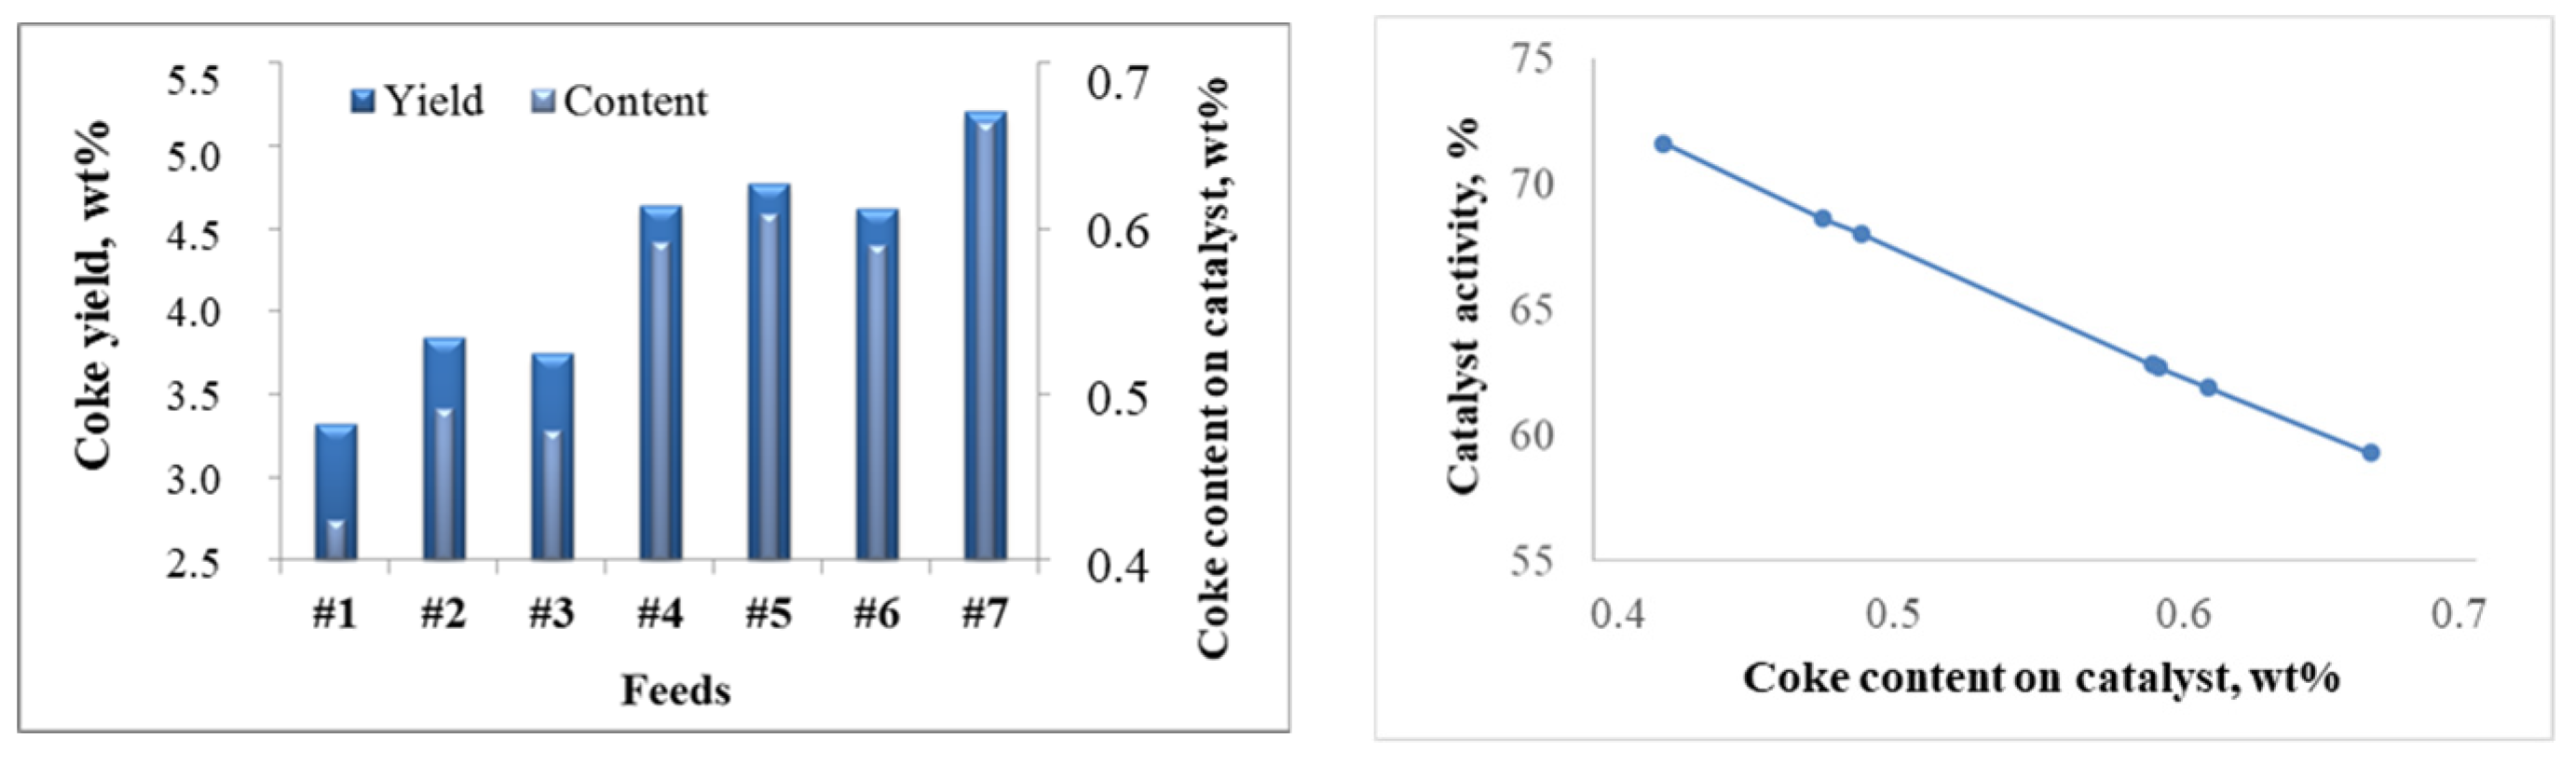
2.2.2. Patterns of Catalyst Deactivation by Coke
2.2.3. The Model
2.2.4. Application of Model
3. Methods
4. Conclusions
Author Contributions
Funding
Data Availability Statement
Acknowledgments
Conflicts of Interest
Abbreviations
| SAR | saturates, aromatics and resins |
| PPF | propane–propylene fractions |
| BBF | butane–butylene fractions |
| k | reaction rate constant, s−1 or L·s−1 mol−1 |
| kn | the average number of naphthenic rings |
| m/z | mass-to-charge ratio |
| Ci | concentration of the i-th hydrocarbons group, mol/m3 |
| Ci0 | initial concentration of the i-th hydrocarbons group, mol/m3 |
| T0 | initial temperature of cracking, K |
| Tit | the temperature of the thermal equilibrium between the feedstock and the catalyst, K |
| the thermal effects of the chemical reactions, kJ/mol | |
| the reaction rate in the forward and reverse directions, mol/(s·m3) | |
| T | temperature |
| pm | the density of flow, kg/m3 |
| cm | the heat capacity of flow, kJ/kg K |
| ψ | the deactivation function |
| j | the reaction number |
| τ | the contact time, s |
| i | number of components |
| j | number of reactions |
| A | the current relative catalyst activity (acidity), % |
| A0 | the regenerated catalyst activity, % |
| Ccoke | the coke content on the catalyst, wt% |
References
- Belinskaya, N.S.; Lutsenko, A.S.; Mauzhigunova, E.N.; Afanaseva, D.A.; Ivanchina, E.D.; Ivashkina, E.N. Development of the approach to the modeling of the destructive catalytic hydroprocesses of atmospheric and vacuum distillates conversion. The case of oil distillates hydrodewaxing process. Catal. Today 2021, 378, 219–230. [Google Scholar] [CrossRef]
- Yang, F.; Dai, C.; Tang, J.; Xuan, J.; Cao, J. A hybrid deep learning and mechanistic kinetics model for the prediction of fluid catalytic cracking performance. Chem. Eng. Res. Des. 2020, 155, 202–210. [Google Scholar] [CrossRef]
- Zhang, Y.; Liu, M.; Zhao, L.; Liu, S.; Gao, J.; Xu, C.; Ma, M.; Meng, Q. Modeling, simulation, and optimization for producing ultra-low sulfur and high-octane number gasoline by separation and conversion of fluid catalytic cracking naphtha. Fuel 2021, 299, 120740. [Google Scholar] [CrossRef]
- Sadrameli, S.M. Thermal/catalytic cracking of liquid hydrocarbons for the production of olefins: A state-of-the-art review II: Catalytic cracking review. Fuel 2016, 173, 285–297. [Google Scholar] [CrossRef]
- Parthasarathi, R.S.; Alabduljabbar, S.S. HS-FCC High-severity fluidized catalytic cracking: A newcomer to the FCC family. Appl. Petrochem. Res. 2014, 4, 441–444. [Google Scholar] [CrossRef] [Green Version]
- Castañeda, L.C.; Muñoz, A.D.; Ancheyta, J. Combined process schemes for upgrading of heavy petroleum. Fuel 2012, 100, 110–127. [Google Scholar] [CrossRef]
- Bai, P.; Etim, U.J.; Yan, Z.; Mintova, S.; Zhang, Z.; Zhong, Z.; Gao, X. Fluid catalytic cracking technology: Current status and recent discoveries on catalyst contamination. Catal. Rev. 2019, 61, 333–4053. [Google Scholar] [CrossRef]
- Rodríguez, E.; Elordi, G.; Valecillos, J.; Izaddoust, S.; Bilbao, J.; Arandes, J.M.; Castaño, P. Coke deposition and product distribution in the co-cracking of waste polyolefin derived streams and vacuum gas oil under FCC unit conditions. Fuel Process. Technol. 2019, 192, 130–139. [Google Scholar] [CrossRef]
- Afshar Ebrahimi, A.; Mousavi, H.; Bayesteh, H.; Towfighi, J. Nine-lumped kinetic model for VGO catalytic cracking; using catalyst deactivation. Fuel 2018, 231, 118–125. [Google Scholar] [CrossRef]
- Xiaojing, Z.; Shiyuan, S. Lumped Kinetic Modeling Method for Fluid Catalytic Cracking. Chem. Eng. Technol. 2020, 43, 2493–2500. [Google Scholar]
- Elizalde, I.; Ancheyta, J. Modeling catalyst deactivation during hydrocracking of atmospheric residue by using the continuous kinetic lumping model. Fuel Process. Technol. 2014, 123, 114–121. [Google Scholar] [CrossRef]
- Jarullah, A.T.; Awad, N.A.; Mujtaba, I.M. Optimal design and operation of an industrial fluidized catalytic cracking reactor. Fuel 2017, 206, 657–674. [Google Scholar] [CrossRef] [Green Version]
- Moustafa, T.M.; Corella, J.; Froment, G.F. Kinetic modeling of coke formation and deactivation in the catalytic cracking of vacuum gas oil. Ind. Eng. Chem. Res. 2003, 42, 14–25. [Google Scholar] [CrossRef]
- Jiménez-García, G.; Quintana-Solórzano, R.; Maya-Yescas, R. Improving accuracy in the estimation of kinetic frequency factors from laboratory data to model industrial catalytic cracking risers. Ind. Eng. Chem. Res. 2011, 50, 2736–2745. [Google Scholar] [CrossRef]
- Fernandes, J.L.; Domingues, L.H.; Pinheiro, C.I.C.; Oliveira, N.M.C.; Ribeiro, F.R. Influence of different catalyst deactivation models in a validated simulator of an industrial UOP FCC unit with high-efficiency regenerator. Fuel 2012, 97, 97–108. [Google Scholar] [CrossRef]
- Corella, J. On the Modeling of the Kinetics of the Selective Deactivation of Catalysts. Application to the Fluidized Catalytic cracking Process. Ind. Eng. Chem. Res. 2004, 43, 4080–4086. [Google Scholar] [CrossRef]
- Jiménez-García, G.; Quintana-Solórzano, G.; Aguilar-López, R.; Maya-Yescas, R. Modelling Catalyst Deactivation by External Coke Deposition during Fluid Catalytic Cracking. Int. J. Chem. Reactor Eng. 2010, 8, e17027. [Google Scholar] [CrossRef]
- Chen, Z.; Feng, S.; Zhang, L.; Wang, G.; Shi, Q.; Xu, Z.; Zhao, S.; Xu, C. Molecular-Level Kinetic Modeling of Heavy Oil FCC Process based on Hybrid Structural Unit and Bond-Electron Matrix. AIChE J. 2021, 1–15. [Google Scholar] [CrossRef]
- Roberto, P.; Rodríguez, E.; Gutierrez, A.; Bilbao, J.; Arandes, J. Kinetic modeling for the catalytic cracking of tires pyrolysis oil. Fuel 2022, 309, 122055. [Google Scholar] [CrossRef]
- Cerqueira, H.S.; Magnoux, P.; Martin, D.; Guisnet, M. Effect of contact time on the nature and location of coke during methylcyclohexane transformation over a USHY zeolite. Stud. Surf. Sci. Catal. 1999, 126, 105–112. [Google Scholar]
- Alkhlel, A.; de Lasa, H. Catalyst/feedstock ratio effect on FCC using different catalysts samples. Catalysts 2019, 9, 542. [Google Scholar] [CrossRef] [Green Version]
- Bartholomew, C.H. Mechanisms of catalyst deactivation. Appl. Catal. A General 2001, 212, 17–60. [Google Scholar] [CrossRef]
- Liao, Y.; Liu, T.; Du, X.; Gao, X. Distribution of Iron on FCC Catalyst and Its Effect on Catalyst Performance. Front. Chem. 2021, 9, 640413. [Google Scholar] [CrossRef] [PubMed]
- Lipin, P.V.; Doronin, V.P.; Gulyaeva, T.I. Conversion of higher n-alkanes under deep catalytic cracking conditions. Petrol. Chem. 2010, 50, 362–367. [Google Scholar] [CrossRef]
- Gayubo, A.G.; Llorens, F.J.; Cepeda, E.A.; Olazar, M.; Bilbao, J. Kinetic modelling for selective deactivation in the skeletal isomerization of n-butenes. Chem. Eng. Sci. 1997, 52, 2829–2835. [Google Scholar] [CrossRef]
- Oudar, J.; Wise, H. Deactivation and Poisoning of Catalysts; Marcel Dekker: New York, NY, USA, 1985; Volume 344. [Google Scholar]
- Guisnet, M.; Magnoux, P.; Martin, D. Roles of acidity and pore structure in the deactivation of zeolites by carbonaceous deposits. Stud. Surf. Sci. Catal. 1997, 111, 1–19. [Google Scholar] [CrossRef]
- Guisnet, M.; Magnoux, P. Coking and deactivation of zeolites: Influence of the Pore Structure Author links open overlay panel. Appl. Catal. 1989, 54, 1–27. [Google Scholar] [CrossRef]
- Nazarova, G.Y.; Ivashkina, E.N.; Ivanchina, E.D.; Vosmerikov, A.V.; Vosmerikova, L.N.; Antonov, A.V. A Model of Catalytic Cracking: Product Distribution and Catalyst Deactivation Depending on Saturates, Aromatics and Resins Content in Feed. Catalysts 2021, 11, 701. [Google Scholar] [CrossRef]
- Chuzlov, V.; Nazarova, G.; Ivanchina, E.; Ivashkina, E.; Dolganova, I.; Solopova, A. Increasing the economic efficiency of gasoline production: Reducing the quality giveaway and simulation of catalytic cracking and compounding. Fuel Proc. Technol. 2019, 196, 106139. [Google Scholar] [CrossRef]
- Ivanchina, E.; Ivashkina, E.; Nazarova, G. Mathematical modelling of catalytic cracking riser reactor. Chem. Eng. J. 2017, 329, 262–274. [Google Scholar] [CrossRef]
- Nazarova, G.; Ivashkina, E.; Ivanchina, E.; Oreshina, A. Modeling of the catalytic cracking: Catalyst deactivation by coke and heavy metals. Fuel Proc. Technol. 2020, 200, 12. [Google Scholar] [CrossRef]


| Properties and Groups | Feeds | ||||||
|---|---|---|---|---|---|---|---|
| #1 | #2 | #3 | #4 | #5 | #6 | #7 | |
| IBP, °C | 301.0 | 304.0 | 303.0 | 304.0 | 316.0 | 317.0 | 318.0 |
| 10%, °C | 346.0 | 347.0 | 3430. | 347.0 | 346.0 | 354.5 | 372.0 |
| 50%, °C | 411.0 | 413.5 | 413.0 | 413.5 | 412.0 | 421.0 | 433.0 |
| 90%, °C | 494.0 | 492.0 | 492.0 | 491.0 | 491.0 | 492.5 | 497.0 |
| FBP, °C | 541.0 | 5410. | 537.0 | 541.5 | 539.0 | 541.0 | 542.0 |
| Density 20 °C, kg/m3 | 888.0 | 886.0 | 888.0 | 888.0 | 892.0 | 890.0 | 893.0 |
| Molecular weight, g/mol | 331.3 | 330.3 | 343.3 | 339.7 | 345.1 | 338.5 | 342.2 |
| Saturates, wt% | 68.2 | 67.4 | 59.6 | 65.3 | 57.7 | 67.7 | 67.3 |
| Aromatics, wt% | 30.2 | 30.5 | 38.5 | 32.0 | 39.2 | 29.4 | 29.2 |
| Resins, wt% | 1.6 | 2.1 | 1.9 | 2.9 | 3.0 | 2.9 | 3.5 |
| Properties | Catalyst | |
|---|---|---|
| Regenerated | Spent | |
| BET surface area, m2/g | 133.2–141.1 | 122.6–131.8 |
| Pore volume, mm3/g | 157.0–179.0 | 150.0–152.0 |
| BJH method (pore size is 1.7–300 nm) | ||
| Surface area of pore, m2/g | 31.4–38.4 | 27.3–31.3 |
| Pore volume, mm3/g | 113.0–139.0 | 108.0–130.0 |
| Average pore size, nm | 14.8–17.8 | 13.8–14.4 |
| De Boer t-method | ||
| Micropore surface area, m2/g | 110.9–115.9 | 104.2–101.2 |
| Micropore volume, mm3/g | 56.0–60.0 | 53.0–56.0 |
| Horvath–Kawazoe | ||
| Maximum pore volume, mm3/g | 67.0–69.0 | 63.0–65.0 |
| Median pore width, Å | 7.1–7.2 | 7.0–7.1 |
| Process Conditions | Feed | ||||||
|---|---|---|---|---|---|---|---|
| #1 | #2 | #3 | #4 | #5 | #6 | #7 | |
| Weight space velocity, kg/(kg·h) | 0.14 | 0.13 | 0.13 | 0.12 | 0.14 | 0.11 | 0.11 |
| Feedstock temperature, °C | 295.80 | 283.90 | 294.00 | 291.80 | 306.10 | 288.20 | 302.50 |
| Slops flow rate to reactor, m3/h | 10.00 | 10.70 | 9.40 | 13.30 | 11.10 | 18.90 | 19.10 |
| Water vapor flow to reactor gripper, tons/h | 5.50 | 5.50 | 5.50 | 5.50 | 5.50 | 6.10 | 6.90 |
| Water vapor consumption for spraying feedstocks, kg/h | 2400.00 | 2400 | 2400.00 | 2400.00 | 2400.00 | 2400.00 | 2400.00 |
| Regenerated catalyst temperature, °C | 665.40 | 662.80 | 664.50 | 660.66 | 662.30 | 660.70 | 661.50 |
| Pressure in the reactor, MPa | 1.56 | 1.53 | 1.52 | 1.36 | 1.43 | 1.39 | 1.24 |
| Catalyst/oil ratio, tonscat/tonsfeedstock | 7.40 | 7.80 | 7.70 | 8.10 | 7.40 | 9.27 | 9.20 |
| No. | Reaction | k801, s−1 or L·s−1 mol−1 |
|---|---|---|
| 1 | C13–C40Alkanes ↔ C5–C12Alkanes + C5–C12Unsaturated HC | 0.10 |
| 2 | C13–C40Alkanes ↔ C5–C12Isoalkanes + C5–C12Unsaturated HC | 0.53 |
| 3 | HMW Cycloalkanes ↔ C5–C10 Cycloalkanes + 2 C5–C12Unsaturated HC | 0.10 |
| 4 | HMW Aromatics ↔ C5–C12 Aromatics + 2 C5–C12Unsaturated HC | 0.31 |
| 5 | HMW Cycloalkanes ↔ C5–C12 Aromatics + 2H2 + PPF | 0.31 |
| 6 | C5–C12 N-alkanes ↔ PPF + BBF | 0.02 |
| 7 | C5–C12 Isoalkanes ↔ PPF + BBF | 0.02 |
| 8 | C5–C12Unsaturated HC ↔ 2 Gas | 0.11 |
| 9 | C5–C12 Unsaturated HC ↔ BBF + BBF | 0.15 |
| 10 | C5–C12 Unsaturated HC ↔ PPF + PPF | 0.09 |
| 11 | C6–C12 Aromatics ↔ C6–C12 Aromatics + C5–C12 Unsaturated HC | 0.13 |
| 12 | C5–C12 Unsaturated HC C5–C10 ↔ C5–C10 Cycloalkanes | 0.05 |
| 13 | C5–C12 Unsaturated HC + PPF ↔ C5–C12 Aromatics + 2H2 | 0.34 |
| 14 | 2 C5–C12Unsaturated HC ↔ C5–C10 Cycloalkanes + C5–C12Isoalkanes 2 | 8.90 |
| 15 | C5–C12Unsaturated HC + C5–C10 Cycloalkanes ↔ C5–C12 Aromatics + C5–C12Isoalkanes | 31.5 |
| 16 | C6–C12 Aromatics + C5–C12Unsaturated HC ↔ HMW Aromatics + 2H2 | 0.21 |
| 17 | HMW Aromatics + C6–C12 Aromatics ↔ CNAC + 2H2 | 0.77 |
| 18 | CNAC ↔ COKE + 3H2 | 0.48 |
Publisher’s Note: MDPI stays neutral with regard to jurisdictional claims in published maps and institutional affiliations. |
© 2022 by the authors. Licensee MDPI, Basel, Switzerland. This article is an open access article distributed under the terms and conditions of the Creative Commons Attribution (CC BY) license (https://creativecommons.org/licenses/by/4.0/).
Share and Cite
Nazarova, G.Y.; Ivashkina, E.N.; Ivanchina, E.D.; Mezhova, M.Y. A Model of Catalytic Cracking: Catalyst Deactivation Induced by Feedstock and Process Variables. Catalysts 2022, 12, 98. https://doi.org/10.3390/catal12010098
Nazarova GY, Ivashkina EN, Ivanchina ED, Mezhova MY. A Model of Catalytic Cracking: Catalyst Deactivation Induced by Feedstock and Process Variables. Catalysts. 2022; 12(1):98. https://doi.org/10.3390/catal12010098
Chicago/Turabian StyleNazarova, Galina Y., Elena N. Ivashkina, Emiliya D. Ivanchina, and Maria Y. Mezhova. 2022. "A Model of Catalytic Cracking: Catalyst Deactivation Induced by Feedstock and Process Variables" Catalysts 12, no. 1: 98. https://doi.org/10.3390/catal12010098
APA StyleNazarova, G. Y., Ivashkina, E. N., Ivanchina, E. D., & Mezhova, M. Y. (2022). A Model of Catalytic Cracking: Catalyst Deactivation Induced by Feedstock and Process Variables. Catalysts, 12(1), 98. https://doi.org/10.3390/catal12010098