Article

Fabrication and Characterization of a Marine Wet Solar Cell with Titanium Dioxide and Copper Oxides Electrodes

Department of Marine Electronics and Mechanical Engineering, School of Marine Technology, Tokyo University of Marine Science and Technology, 2-1-6 Etchujima, Koto-ku, Tokyo 135-8533, Japan
*
Author to whom correspondence should be addressed.
Catalysts 2022, 12(1), 99; https://doi.org/10.3390/catal12010099
Submission received: 24 December 2021 / Revised: 9 January 2022 / Accepted: 13 January 2022 / Published: 15 January 2022
(This article belongs to the Special Issue Application of Photocatalysts in Environmental Chemistry)

Abstract

:
One of the effective ways of utilizing marine environments is to generate energy, power, and hydrogen via the effect of photocatalysts in the seawater. Since the ocean is vast, we are able to use its large area, but the power generation system must be of low cost and have high durability against both force and corrosion. In order to meet those requirements, this study focuses on the fabrication of a novel marine wet solar cell composed of a titanium dioxide photoanode and a copper oxide photocathode. These electrodes were deposited on type 329J4L stainless steel, which possesses relative durability in marine environments. This study focuses on the characterization of the photocatalytic properties of electrodes in seawater. Low-cost manufacturing processes of screen-printing and vacuum vapor deposition were applied to produce the titanium dioxide and copper oxides electrodes, respectively. We investigated the photopotential of the electrodes, along with the electrochemical properties and cell voltage properties of the cell. X-ray diffraction spectroscopy (XRD) of the copper oxides electrode was analyzed in association with the loss of photocatalytic effect in the copper oxides electrode. Although the conversion efficiency of the wet cell was less than 1%, it showed promising potential for use in marine environments with low-cost production. Electrochemical impedance spectroscopy (EIS) of the cell was also conducted, from which impedance values regarding the electrical properties of electrodes and their interfaces of charge-transfer processes were obtained. This study focuses on the early phase of the marine wet solar cell, which should be further studied for long-term stability and in actual marine environmental applications.

1. Introduction

1.1. Background

Since prehistoric times, we have utilized the marine environment and drawn benefits from it—especially in the areas of transportation and nutrition. Today, it has gained much attention not only for those areas, but also for its natural resources, such as oil and gas reserves. We have been able to produce electrical energy from the sustainable and renewable energy resources of the marine environment, such as tidal waters, waves, and wind power, as well as solar energy from floating solar farms. To counter the effects of global warming and climate change caused by the release of greenhouse gases and the exhaustion of fossil-related energy resources, it is vitally important to increase the use of alternative, renewable, and relatively clean energy resources (e.g., solar, wind, hydro, and geothermal) in order to meet the high demand for energy and to secure the development goals of humanity. Among those energy sources, solar energy is regarded as the most abundantly available and virtually infinite energy source [1,2]. Very large solar farms require a substantial utilization of land resources, with an adverse impact on the environment, causing deforestation, changes in soil quality, loss of agricultural lands and wastelands, and microclimate change [3]. To remedy those problems, the study and construction of floating solar farms has become an interesting topic in the photovoltaic industry. Hybrid floating solar farms in conjunction with wind turbines are installed near coastal areas. However, most of the studies on floating solar farms are focused on the installation design of the already commercially available solar panels above the water surface. As a way to consider an alternative method, and to effectively utilize the marine environment, we included the use of seawater as the electrolyte in this study of the marine wet solar cell. In this research, we consider the early phase of characterization of a novel marine wet solar cell using two photocatalyst electrodes and a seawater electrolyte.

1.2. Titanium Dioxide Photocatalyst

Titanium dioxide has been widely studied for its n-type semiconductor photocatalytic activity, having a wide band gap and higher resistance to photocorrosion [4]; it has been used as a catalyst for water splitting, and in dye-sensitized solar cells [5,6]. Titanium dioxide is naturally observed in three main polymorphs: two tetragonal structures of rutile, anatase, and orthorhombic brookite [7,8,9,10,11]. There are reportedly other phases of titanium dioxide at high pressures [12,13]. Rutile is a thermodynamically stable phase, but anatase and brookite phases are metastable. Moreover, the brookite phase is suboptimal for film formation [7,11,14]. Many studies and industrial uses of titanium dioxide have been reported, such as hydrogen production by electrolysis of water, dye-sensitized solar cells, wastewater treatment, cosmetics, and biomedicinal self-sterilizing coatings [5,15,16,17,18,19,20,21,22]. Research concerning the film-forming process of titanium dioxide has been conducted, including rapid thermal oxidation, chemical conversion methods, dip-coating, and the sol–gel method [19,23,24,25].

1.3. Copper Oxides Photocatalysts

Copper oxides, among metal oxides, have been attracting a lot of research interest due to their p-type semiconductor photocatalytic characteristics [26,27,28]. Copper has two main types of oxide: copper(I) oxide, or cuprous oxide (Cu2O); and copper(II) oxide, or cupric oxide (CuO). Both oxides show p-type semiconductor characteristics, but their crystal structures and band gaps are different. Cu2O shows a cubic crystal structure, and thin film Cu2O is used as an absorber layer in solar cells [26,27,28]. Mainly monoclinic CuO exhibits higher physical and chemical properties, electrochemical activity, thermal conductivity, and stability in solutions, as well as lower production cost [29,30]. Research studies concerning CuO include CuO as a photocatalyst for the removal of pollutants, and for water splitting [31,32]. Copper oxides have been synthesized electrochemically, physically, and chemically, such by spray pyrolysis, the sol–gel method, chemical vapor deposition, pulsed laser deposition, sputtering, and electrochemical deposition [33,34,35,36,37,38].

1.4. Study of the Marine Wet Solar Cell

This study aimed to fabricate and characterize a novel type of marine wet solar cell that consists of a titanium dioxide photoanode and a copper oxides photocathode. A wet solar cell is a type of light-harvesting solar cell that uses aqueous solutions as electrolytes. A marine wet solar cell calls for the use of seawater as an electrolyte. The purpose of this type of solar cell is to be used effectively in marine environments, and it has the potential to be used to supply power to offshore structures, or even (in future) to autonomous ships. The benefit of this type of solar cell is that because seawater is used as an electrolyte, the cell does not particularly need the cell walls to contain the electrolyte.
In this study, the film-forming of titanium dioxide was processed by the screen-printing method, using titanium dioxide paste. The screen-printing method is convenient, and can control the thickness and porosity of the titanium dioxide film [39]. This study utilized a titanium dioxide paste consisting of rutile and anatase phases. The photocatalytic activity of titanium dioxide is enhanced by the formation of a heterojunction of rutile and anatase layers in the titanium dioxide film [40]. On the other hand, many studies have been conducted concerning the use of platinum as a cathodic counter-electrode. There have been numerous studies on cathodes that can be used for this type of cell. Many such studies have concerned the use of platinum electrodes. If a platinum electrode is used as the cathode, the cost-to-cell-efficiency ratio makes it relatively unrealistic for deployment in vast oceanic areas. Passivated stainless steel can be considered to be a cost-effective alternative, but its photocatalytic activity is low and its tendency for corrosion becomes higher in seawater. Therefore, this study introduced the use of stainless steel on which a p-type semiconductor film was deposited. Although there are many p-type semiconductor metal oxides, this study utilized p-type semiconductor copper oxides, since high-temperature oxidation of the vacuum-deposited copper film on the stainless steel substrate shows photocatalytic activity at a relatively low cost compared to a platinum counter-electrode [41]. In this study, a thin film of copper oxides was formed as a part of a low-cost fabrication process by the vacuum vapor deposition in conjunction with a heat treatment process [42].
TiO2–Cu2O heterojunction solar cells were studied by Michele Pavan et al., in a study where both metal oxide layers were produced by the spray pyrolysis method, and silver was used as a back contact [33]. However, there are no reported studies of a marine wet solar cell with TiO2 and copper oxides electrodes and seawater as the electrolyte. This study emphasizes the fabrication of a novel type of marine wet solar cell—with a titanium dioxide photoanode, a copper oxides photocathode, and seawater as the electrolyte—and its photoelectrical characterization and analysis. The schematic presentation of the proposed solar cell is shown in Figure 1.

2. Results

2.1. Photocatalytic Properties of Each Electrode

Photopotential measurement of each electrode was carried out in order to confirm their semiconductor properties and to figure out the reaction potential of each electrode. Figure 2 presents the two graphs of the photopotential of each electrode and the voltage of the cells over time. When light was irradiated, the photocatalytic effect of each electrode caused the reactions at the surface of each electrode. For the TiO2 electrode, the surface oxidation reaction can be represented as follows:
2H2O + 2e→H2 + 2OH
which gives the standard electrode potential of −820 mV versus the standard hydrogen electrode (SHE) [40].
The reduction reaction at the surface of the copper oxides electrode can be expressed as follows:
4OH→O2 + 2H2O + 4e
with the standard electrode potential of 400 mV versus SHE [43].
As shown in Figure 2a, just after irradiation of the TiO2 electrode, the photopotential decreased swiftly to below −600 mV (vs SCE), but the values were rebounded back to −500 mV, and became stable throughout the 2 h measurement. This confirms the n-type semiconductor characteristics of titanium dioxide. The reason for the rebounded shift towards the increase in the photopotential of the TiO2 electrode is still under research.
The irradiation of the copper oxides electrode caused the electrode to activate its p-type photocatalytic semiconductor characteristics. The potential was increased to 300 mV, but dropped by ~50 mV and became stable in the region of 250 mV for the entire 2 h measurement period. This drop was the result of copper(I) oxide (Cu2O) still remaining during the heat treatment process, which underwent oxidation in the seawater during the irradiation testing (Figure 3). This can be seen more clearly in the XRD analysis of the copper oxides electrode shown in Section 3. By coupling these two electrodes, a cell voltage of 800 mV could be obtained.
The cell voltage over a 24 h period of the TiO2–copper oxides cell and a TiO2–passivated stainless steel cell can be seen in Figure 2b. In the TiO2–copper oxides cell, the voltage went up to 850 mV just after irradiation, but then dropped until it reached just below 750 mV at 5 h, after which the photopotential increased once more. After the first 12 h, the cell voltage became stable at 800 mV. In the TiO2–stainless steel cell, the cell voltage went up to 400 mV after irradiation, and then slowly increased until it reached 600 mV, becoming stable at this voltage value until the end of the measurement. During a 24 h measurement, there was no drop in the cell voltage in the TiO2–S.S. cell, but a decrease in voltage was observed in the TiO2–copper oxides cell. By comparing the results of these two cells, it can be concluded that the drop in cell voltage was mainly caused by the defects in the copper oxides electrode. The cause of photocatalytic reduction at the copper oxides electrode will be discussed in Section 3.

2.2. X-ray Diffraction Analysis of Copper oxides Electrode

In order to better understand the decrease in cell voltage in the measurement of the TiO2–copper oxides cell, XRD analysis was performed on the copper oxides electrode before and after photopotential measurement. Figure 3 shows the XRD profiles of the base stainless steel substrate, pure copper-deposited substrate, and copper oxides electrodes before and after photopotential measurement. In the analysis of the copper-deposited substrate, the peaks of deposited pure copper were superpositioned with that of the substrate at 2θ = 43° and 51° [44].
Two peaks of copper(II) oxide (CuO) were detected between 2θ = 35° and 40° in the copper oxides electrode. The electrode before photopotential measurement showed the peak of copper(I) oxide (Cu2O), but this peak disappeared after the photopotential measurement.

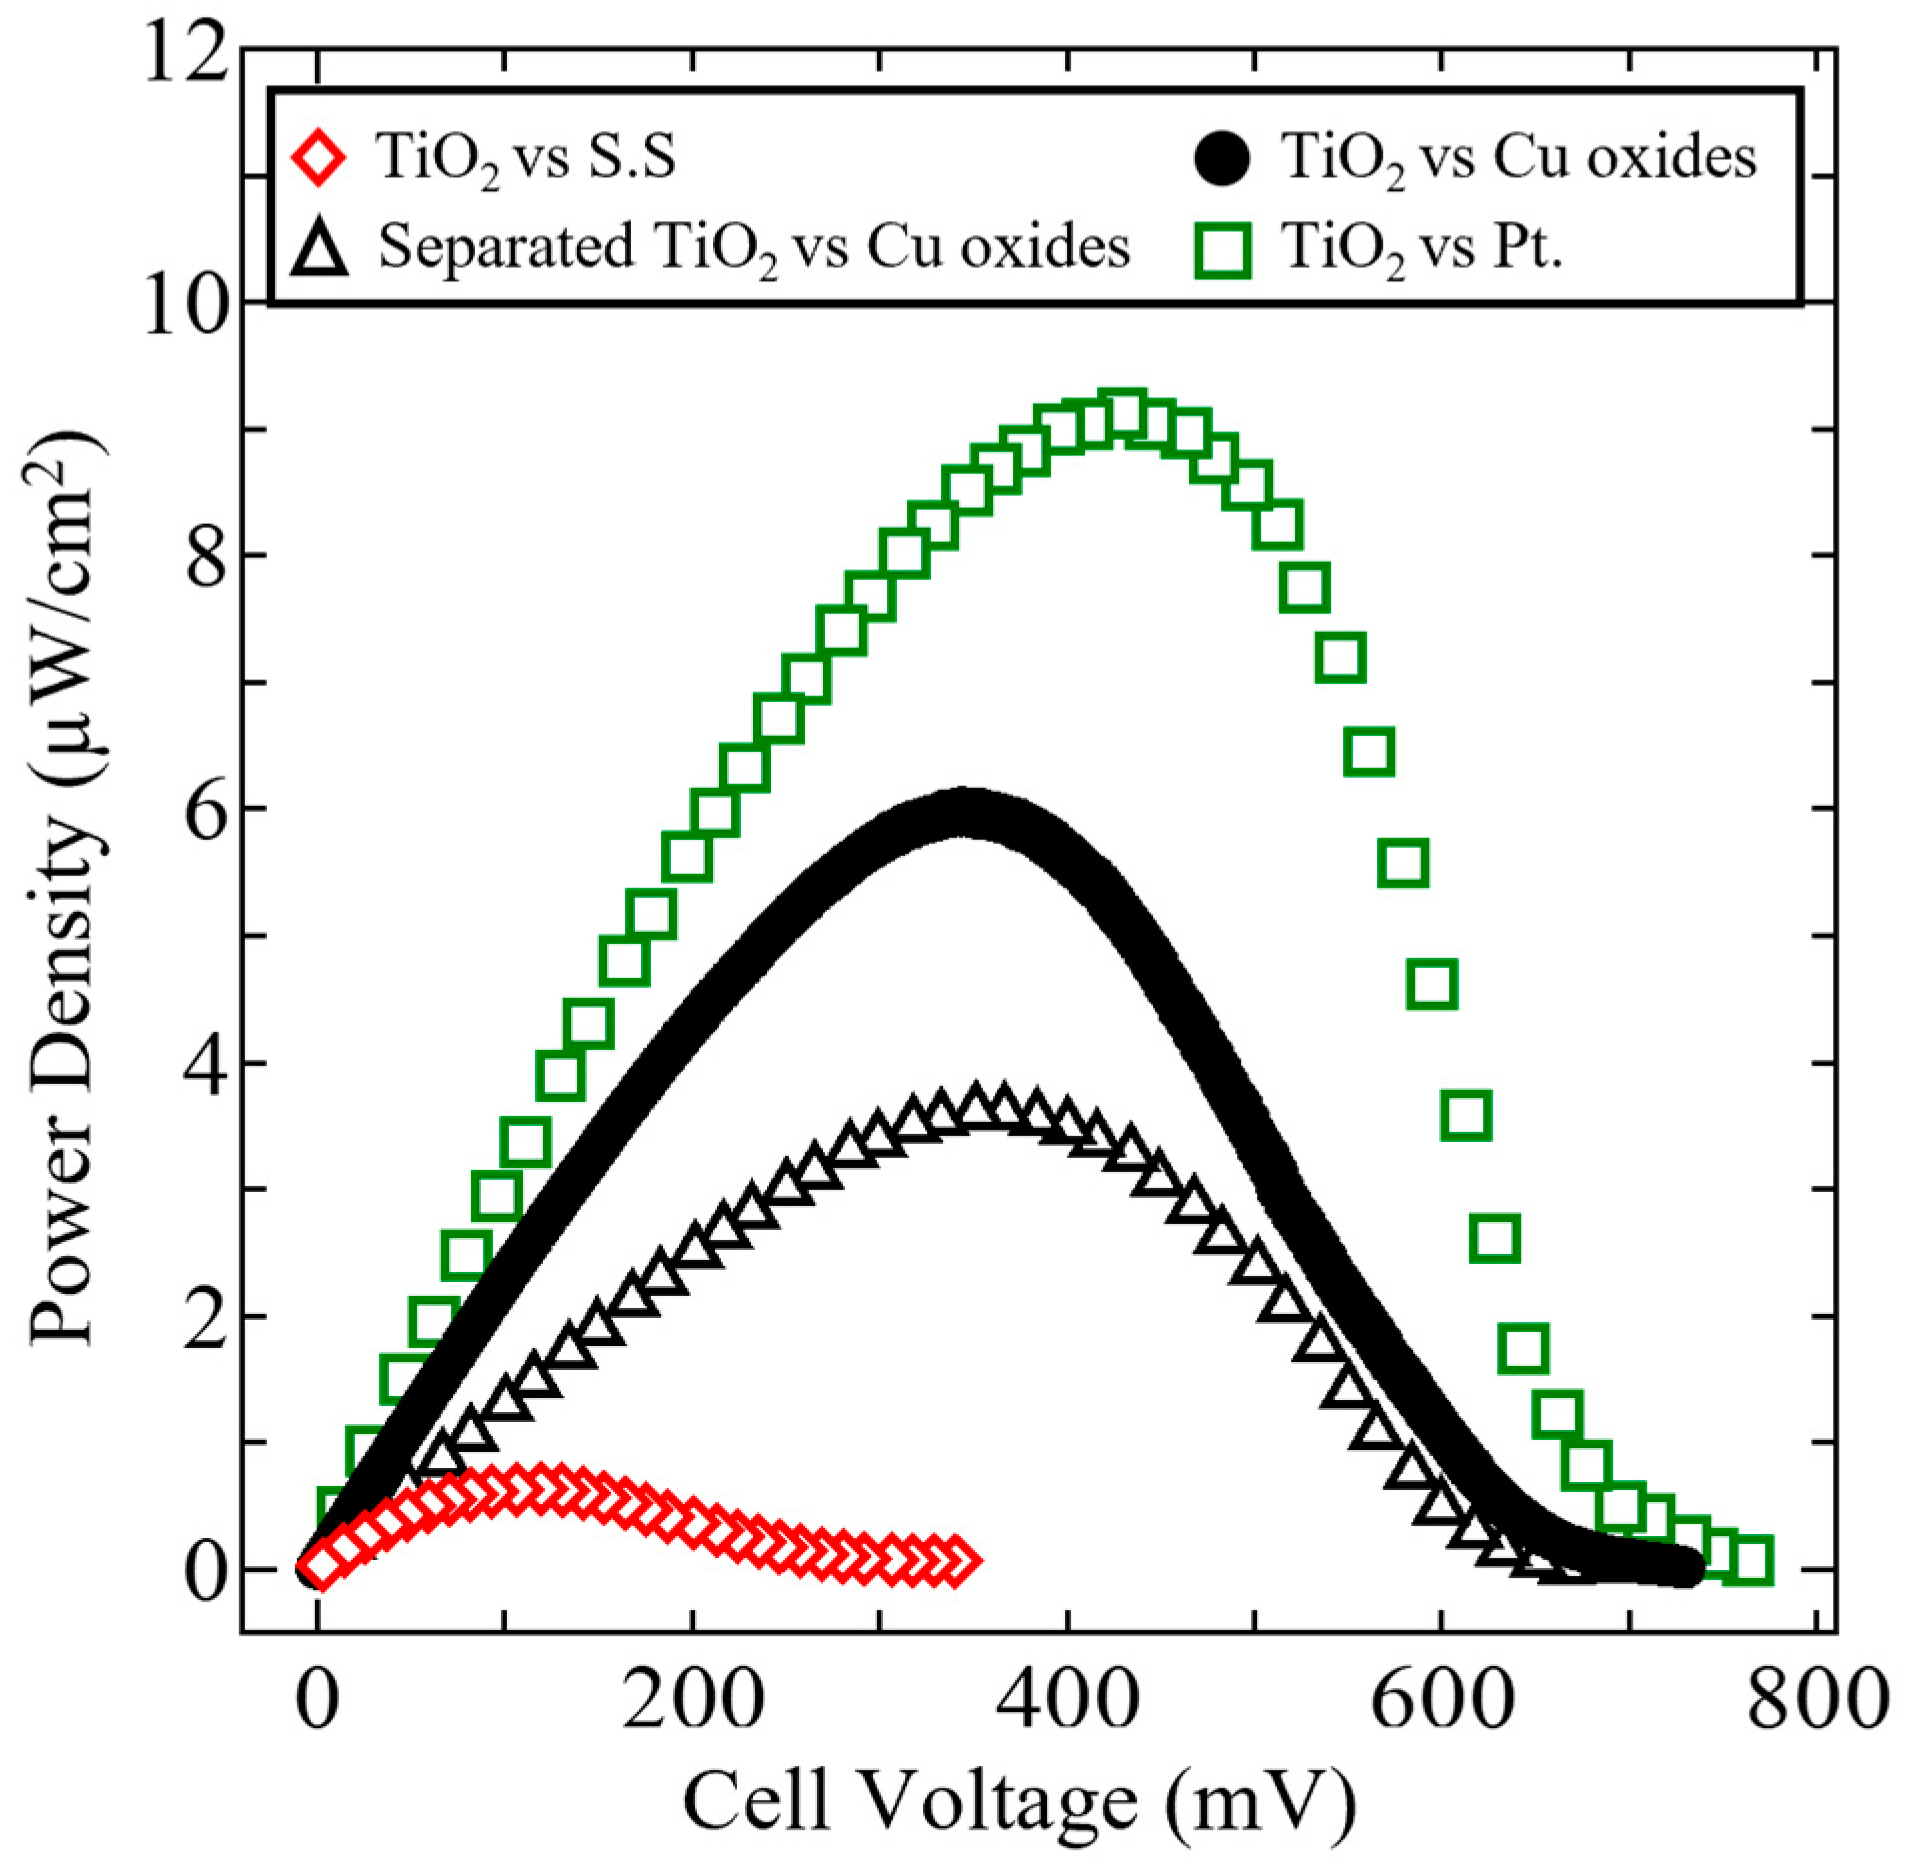
2.3. Power Density–Cell Voltage Characteristics of Each Cell

The power density versus cell voltage measurement of four types of electrodes under irradiation is shown in Figure 4. The comparative short-circuit current density (Jsc), open-circuit voltage (Voc), maximum power density (Pmax), and fill factor (FF) values of the cells can be seen in Table 1.
In the case of the cell with TiO2–S.S., the maximum power was the lowest, at 0.6 µW/cm2, which is 10% of that of the TiO2–copper oxides combined cell. Moreover, the fill factor (FF) is very much lower (at 10.2%) when compared with other cells. This is considered to be due to the lower photocatalytic effect of stainless steel, which contributes to the lower band gap for light harvesting.
In the cells of combined TiO2–Cu oxides and separated TiO2–Cu oxides, the maximum power density was higher in the combined cell, at 6 µW/cm2. Although Voc in both cells was around 730 mV, the current density of the combined cell was higher than that of separated cell. When the electrodes were placed a few centimeters apart in the seawater, the maximum power was reduced to 4 µW/cm2.
The maximum power density of the combined TiO2–Cu oxides cell was two-thirds of that of the TiO2–platinum cell. The maximum power density of the TiO2–platinum cell was the highest among the cells, at 9 µW/cm2. Even with the highest maximum power output of the TiO2–platinum cell, the conversion efficiency from light to electrical energy was less than 1%, and the fill factor was ~35%. Using the results obtained from the Tafel regions of the P–V graph, the EIS analysis was performed for the charge-transfer resistance of the electrodes.

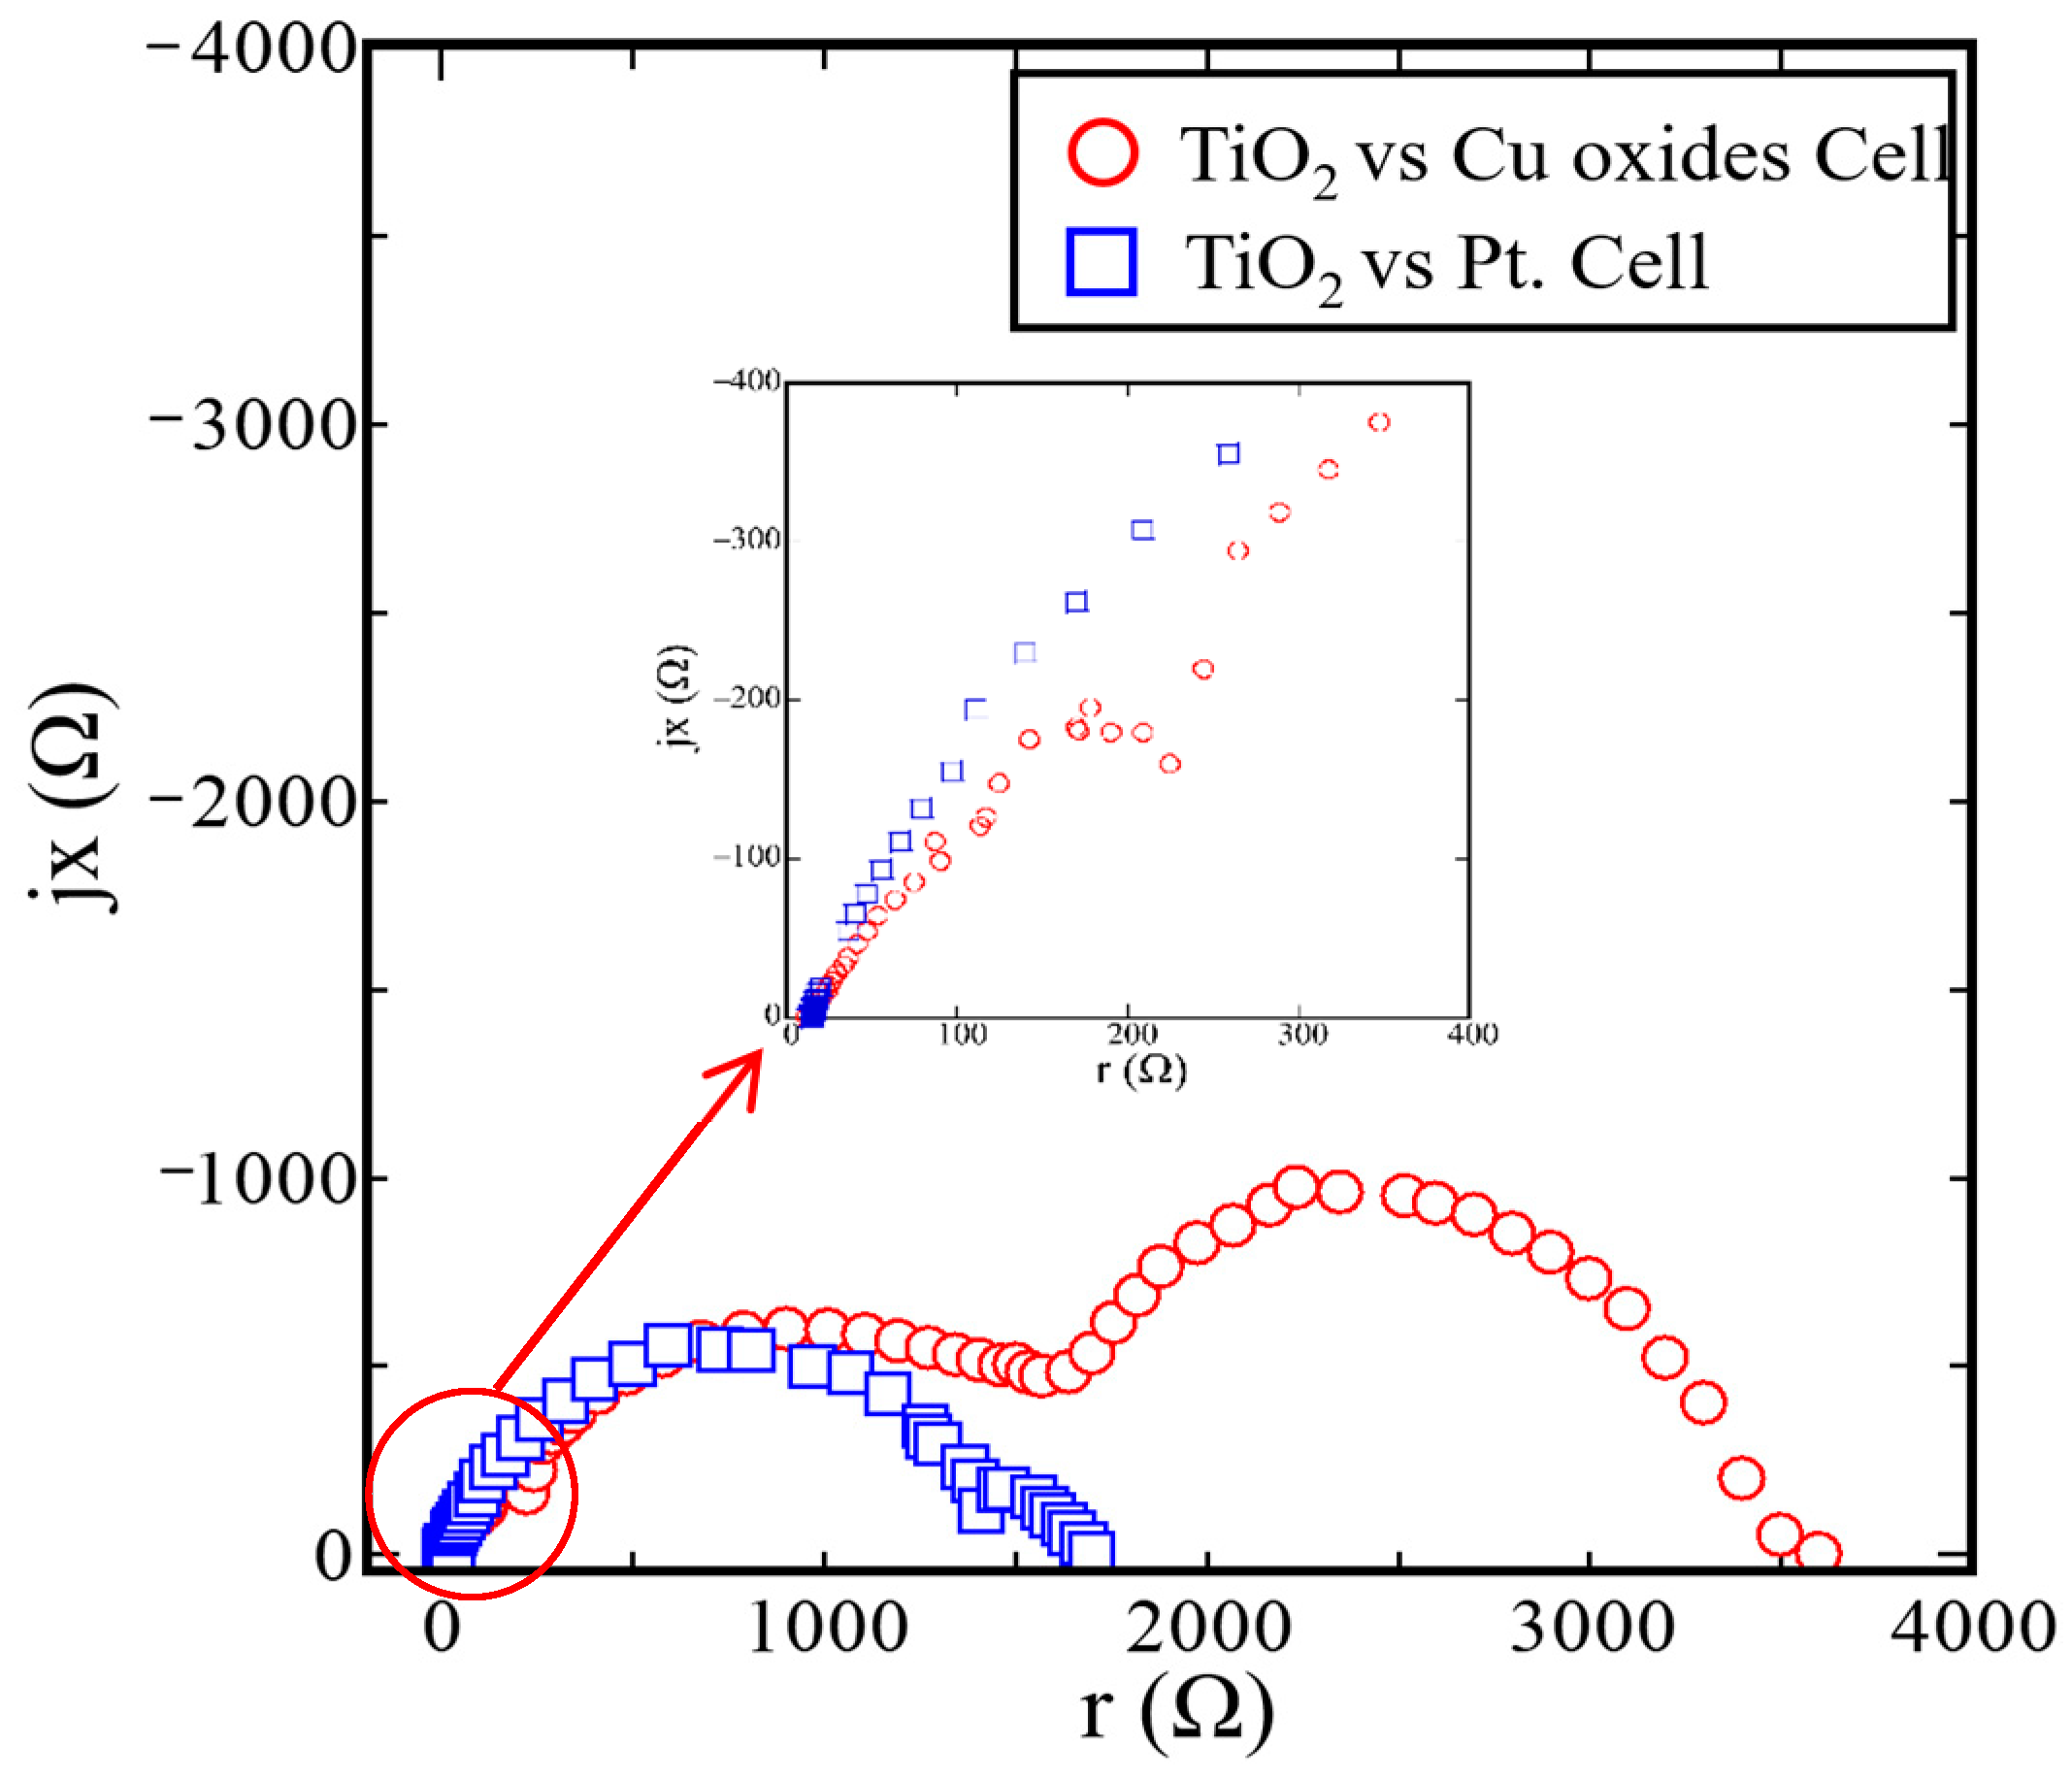
2.4. Electrochemical Properties of Electrodes by EIS Analysis

EIS analysis was conducted in order to identify the charge-transfer process in the electrolyte–electrode interface, and to determine the electrical properties of the electrodes [45,46,47]. Knowing the electrical properties helped us to reduce the resistance parameters of the cell. Figure 5 shows the impedance spectra of two types of cell: TiO2–Cu oxides, and TiO2–platinum. The equivalent circuits were constructed using a simple curve-fitting method for TiO2–Cu oxides and TiO2–platinum cells, in order to identify the impedance values of those cells [45,46]. The impedance values of TiO2–Cu oxides cells fluctuated in the low-frequency region of the plot. An equivalent circuit containing one series resistance and three resistance–capacitance (R–C) parallel circuits was constructed for the TiO2–copper oxides cell, and one series resistance and two R–C circuits for the TiO2–platinum cell (Figure 6). The impedance values obtained for these two cells are shown in Table 2.
The impedance values of the interfaces of the electrodes were determined from Nyquist plots (Table 2). The series resistance values were not much different in both cells; this is considered to be the resistance value of the electrolyte solution. RC circuit 1 appears in the equivalent circuit of the TiO2–copper oxides cell, but not in the TiO2–platinum cell. This is due to the effect of the base stainless steel substrate in the copper oxides electrode, since there is no stainless steel substrate in the cathodic counter-electrode (only platinum). Therefore, these impedance values represent the copper oxides–stainless steel interface and the internal circuit resistance. The resistance values of RC circuit 2 are similar; this is due to the effect of the common electrode in both cells—the TiO2 electrode. Therefore, these impedance values represent the electrolyte–TiO2 cathode interface. In RC circuit 3, the impedance values of the TiO2–Cu oxides cell are more than 10 times higher than those of the TiO2–platinum cell. The resistivity of platinum is much lower than that of copper oxides [48]. Since platinum is a noble metal with high electrical conductivity, the increase in the impedance values of TiO2–Cu oxides should be the combined represented values for the Cu oxides electrode–electrolyte (seawater) interface.

3. Discussions

From these results, the photopotential values of the titanium dioxide electrode and the copper oxides electrode were found to be stable during the 2 h measurement, and their cell voltage also remained stable during the 24 h measurement (Figure 2). The measured cell voltage was around 800 mV, which is close to the summation of their standard electrode potential. The potential reduction occurred in the early phase of photopotential measurement of both electrodes. In the 24 h cell voltage measurement, the decrease in voltage was observed in the first half of the measurement in the TiO2–Cu oxides cell. However, there was no decrease in voltage in the measurement of the TiO2–stainless steel cell (Figure 2). This result was related to the copper oxides electrode.
In the XRD patterns shown in Figure 3, the peak of Cu2O appeared in the electrode before the photopotential measurement, but it was absent after photopotential measurement. During the heat treatment of deposited copper at 350 °C, the thermal oxidation mechanism of copper takes place in the sequence of Cu→ (Cu + Cu2O)→Cu2O→ (Cu2O + CuO)→CuO. [38] However, there was still Cu2O left during the heat treatment of copper for 30 min, depending on the variation in the thickness of the deposited copper film during vacuum vapor deposition process. The copper(I) oxide phase underwent oxidation under irradiation in the presence of seawater. This oxidation reaction caused the decrease in the p-type semiconductor photocatalytic effect of the copper oxides electrode and, hence, caused the scattered decrease in cell voltage in the measurement of the TiO2–copper oxides cell.
In the power density vs. cell voltage measurement (Figure 4), the maximum cell power density of the combined TiO2–Cu oxides cell was ~6 µW/cm2, and this cell efficiency was less than 1% when the incident light intensity was 10.5 mW/cm2 (excluding the light-reduction effect of quartz glass). When the two electrodes were separated by 10 cm (separated TiO2–Cu oxides cell) in ASW, the power density was further reduced by more than 20%, to 4.2 µW/cm2; this was due to the loss of ion exchange between the electrodes in seawater. Therefore, the use of seawater as the electrolyte is an important factor in the power output of the cell. In the EIS analysis, the impedance values of the electrodes in both the TiO2–Cu oxides and TiO2–platinum cells were higher compared to those of dye-sensitized solar cells (DSSCs) [49]. This confirms the loss of charge transfer between electrodes in seawater as an electrolyte.
The maximum power density of the TiO2–platinum cell was the highest among the cells, at 9 µW/cm2. On the other hand, the maximum power density of the combined TiO2–Cu oxides cell was two-thirds of that of the TiO2–platinum cell. Considering the cost-to-cell-efficiency ratio, the cost effectiveness of the combined TiO2–Cu oxides cell was much higher than that of the TiO2–platinum cell, since the materials and the preparation of the copper oxides electrode required simple processes, and were not costly. This is the reason for using copper oxides electrodes to replace platinum counter-electrodes in the fabrication of marine wet solar cells.

4. Experimental

4.1. Fabrication of the Marine Wet Solar Cell

For both electrodes, the same type 329J4L stainless steel with a thickness of 1 mm was used as the base substrate. This stainless steel showed a dual-phase structure of ferrite and austenite. Dual-phase stainless steel is used in marine environments due to its relatively high corrosion resistance compared to other single-phase stainless steels [50]. The composition of type 329J4L stainless steel is shown in Table 3.

4.1.1. Preparation of Titanium Dioxide Electrode

The surface of the substrate was ground with 60-grade sandpaper in the horizontal and transverse directions. After that, the substrate was put in a beaker of acetone and cleaned in an ultrasonic cleaner for 10 min. The substrate was then passivated, and the passivation treatment was performed by placing the substrate in a solution of 10 volume % nitric acid (HNO3). The passivation was carried out on the surface of the substrate to remove active ions from the surface, and to form a thin passive layer, which enhanced the pitting and crevice corrosion resistance of the substrate [51]. The temperature was maintained at 60 °C for 30 min for passivation treatment. After passivation, the surface of the passivated substrate was printed with TiO2 paste. TiO2 paste was obtained from Showa Denko (product name-SP-100, reference name-CE-JP930). The composition of the TiO2 paste is shown in Table 4. Two layers of TiO2 were printed with the screen printer. Printing of the first layer was followed by heat treatment at a temperature of 150 °C for 1 h, after which the electrode was cooled down slowly in the oven. After printing the second layer, the electrode was sintered at a temperature of 550 °C for 30 min, and then cooled down in ambient conditions. Hence, a thin double-layered TiO2 film of ~120 µm thickness was formed on the substrate, forming the TiO2 electrode [40].

4.1.2. Preparation of Copper Oxides Electrode

The substrate was cleaned and passivated in the same way as the preparation of the TiO2 electrode. The passivated substrate was deposited with pure copper in the vacuum vapor deposition chamber. The conditions for vacuum deposition were 0.4 mPa and a current of 40 A with 1.3 volts [43]. The thickness of the copper deposited was less than 0.3 µm. After deposition with pure copper, the substrate was sintered at 350 °C for 30 min, and it was cooled down in ambient conditions to form a copper oxides (mainly CuO and Cu2O) film with a thickness of ~0.3 µm on the substrate.

4.1.3. Fabrication of the Cell

Four types of cells were prepared to distinguish the photocatalytic properties and electrochemical characteristics of TiO2–copper oxides cells, along with each electrode’s properties:
  • The first was a separated TiO2–copper oxides cell. In the separated cell, the two electrodes were insulated with epoxy resin separately, and were measured 10 cm apart in artificial seawater;
  • The second cell was a combined TiO2–copper oxides cell. In this combined cell, the TiO2 electrode and copper oxides electrode were connected using a silicon binder, which acted as an insulator between the electrodes. The cell was covered with epoxy resin in preparation for the measurement;
  • In the third type of cell, the passivated stainless steel substrate was used as the cathodic electrode coupled with the TiO2 electrode (TiO2–S.S. cell);
  • The last cell was the TiO2 electrode vs. platinum counter-electrode (TiO2–Pt cell). A simple illustration regarding the preparation procedure of the electrodes is shown in Figure 7, along with the image of the prepared combined cell.

4.2. Electrochemical Measurement

The electrochemical measurement consisted of photopotential measurement of each electrode, cell voltage measurement of the cells, power density–cell voltage (P–V) measurement of the cells, and electrochemical impedance spectroscopy (EIS) of the cells. Each electrochemical measurement was performed using artificial seawater as the electrolyte. For irradiation measurement, a xenon lamp with a calibrated wavelength range of 250–800 nm and an irradiation intensity of 10.5 mW/cm2 was used as a light source. A saturated calomel electrode (SCE) was used as a reference electrode. The potentiostat was used for photopotential measurement, and the electrochemical impedance analyzer with a frequency-response analyzer was used for the electrochemical impedance analysis (EIS).
The photopotential measurement for each electrode was performed for 2 h under irradiation, with an initial 3 min of darkness. Based on the results of the photopotential measurement, the cell voltage measurement was conducted for 24 h. The power density versus cell voltage (P–V) measurement was carried out under irradiation, within a voltage range from open-circuit voltage (Voc) to short-circuit voltage (Vsc). Based on the current obtained from the Tafel region of the P–V curve, EIS measurement was performed in a frequency range from 100 kHz to 1 mHz. Figure 8 shows the schematic diagram of electrochemical measurement of each electrode and each cell.

4.3. XRD Analysis of the Electrodes

X-ray diffraction (XRD) analysis was performed to obtain the phase information of the electrodes. Data on the copper oxides electrode will be used for discussion. For the copper oxides electrode, the analysis was performed for the substrate, the substrate with pure copper deposited, and the copper oxides electrode before and after photopotential measurement. Cu-Kα radiation with λ = 1.54 Å was used as the X-ray source, with an X-ray-generating voltage of 40 kV and an emission current of 15 mA.

5. Conclusions and Perspectives

This study, to the best of our knowledge, is the first to focus on the fabrication of a low-cost novel marine wet solar cell with a titanium dioxide photoanode and a copper oxides photocathode instead of a platinum counter-electrode The purpose is to effectively utilize the marine environment for the harvesting of light. The photocatalytic properties of the titanium dioxide anode and copper oxides cathode were examined. The respective cell voltage, cell power density, and cell characteristics were measured and analyzed, and the effect of decreasing voltage was studied. The cells’ electrochemical properties were examined and evaluated. This research focused on the early phase of study of the marine wet solar cell with seawater as the electrolyte.
  • The measurement of each electrode showed that their photopotential values remained stable, and close to the standard potential of each electrode;
  • The cell voltage of the TiO2–Cu oxides cell was stable over 24 h of measurement, with a few drops in the early hours. The factors affecting that drop were revealed. Some residual Cu2O that remained in the Cu oxides electrode after heat treatment underwent oxidation in the seawater under irradiation. This oxidation led to lower p-type semiconductor photocatalytic activity of the Cu oxides electrode;
  • We have achieved a power profile of the combined TiO2–Cu oxides cell in which the maximum power density was two-thirds of that of the TiO2–platinum cell. This can support the replacement of platinum counter-electrodes with copper oxides electrodes in terms of cost-to-energy-conversion efficiency;
  • From the EIS measurements, the impedance values for the charge-transfer resistance of the semiconductor electrode/electrolyte were evaluated by constructing a simple equivalent circuit. From this, we can consider the preparation techniques and the materials to reduce the resistance of the electrode.
The future perspective of this research is to study the cause of the reduction in photocatalytic effect in TiO2 electrodes, in order to improve the long-term stability and durability of the cell, its practical application, and its impact on the environment.

Author Contributions

Conceptualization, S.M. and M.M.; methodology, S.M., M.M., and H.N.W.; software, H.N.W.; formal analysis, H.N.W.; investigation, H.N.W.; writing—original draft preparation, H.N.W.; writing—review and editing, S.M. and M.M.; supervision, S.M.; funding acquisition, S.M. and M.M. All authors made a significant contribution to the completion of this manuscript. All authors have read and agreed to the published version of the manuscript.

Funding

Part of this research is funded by the Grant-in-Aid for Scientific Research from the Japan Society for the Promotion of Science (JSPS) (No. 26281045), and the 22nd and 27th Research Promotion Grant of the Iron and Steel Institute of Japan (ISIJ) (H25-012 and H27-030).

Data Availability Statement

The data presented in this article are sharable on request to the corresponding author.

Acknowledgments

Part of this manuscript is included in the doctoral dissertation submitted by Author Htoo Nay Wunn to Tokyo University of Marine Science and Technology. The university encouraged the author to submit the manuscript for publication.

Conflicts of Interest

The authors declare no conflict of interest.

References

  1. Perera, H.D.M.R. Designing of 3MW Floating Photovoltaic Power System and its Benefits over Other PV Technologies. Int. J. Adv. Sci. Res. Eng. 2020, 6, 37–48. [Google Scholar] [CrossRef]
  2. Solomin, E.; Sirotkin, E.; Cuce, E.; Selvanathan, S.P.; Kumarasamy, S. Hybrid Floating Solar Plant Designs: A Review. Energies 2021, 14, 2751. [Google Scholar] [CrossRef]
  3. Sreenath, S.; Sudhakar, K.; Yusop, A.F.; Solomin, E.; Kirpichnikova, I.M. Solar PV Energy System in Malaysian Airport: Glare Analysis, General Design and Performance Assessment. Energy Rep. 2020, 6, 698–712. [Google Scholar] [CrossRef]
  4. Bakranov, N.; Zhabaikhanov, A.; Kudaibergenov, S.; Ibraev, N. Decoration of Wide Bandgap Semiconducting Materials for Enhancing Photoelectrochemical Efficiency of PEC Systems. In Journal of Physics: Conference Series; IOP Publishing: Bristol, UK, 2018; p. 012028. [Google Scholar] [CrossRef] [Green Version]
  5. Fujishima, A.; Honda, K. Electrochemical Photolysis of Water at a Semiconductor Electrode. Nature 1972, 238, 37–38. [Google Scholar] [CrossRef] [PubMed]
  6. O’Regan, B.; Grätzel, M. A Low-Cost, High-Efficiency Solar Cell Based on Dye-Sensitized Colloidal TiO2 Films. Nature 1991, 353, 737–740. [Google Scholar] [CrossRef]
  7. Fahmi, A.; Minot, C.; Silvi, B.; Causa, M. Theoretical Analysis of the Structures of Titanium Dioxide Crystals. Phys. Rev. B 1993, 47, 11717. [Google Scholar] [CrossRef] [Green Version]
  8. Ding, X.Z.; Liu, X.H.; He, Y.Z. Grain Size Dependence of Anatase-to-Rutile Structural Transformation in Gel-Derived Nanocrystalline Titania Powders. J. Mat. Sci. Let. 1996, 15, 1789–1791. [Google Scholar] [CrossRef]
  9. Smith, S.J.; Stevens, R.; Liu, S.; Li, G.; Navrotsky, A.; Boerio-Goates, J.; Woodfield, B.F. Heat Capacities and Thermodynamic Functions of TiO2 Anatase and Rutile: Analysis of Phase Stability. Amer. Miner. 2009, 94, 236–246. [Google Scholar] [CrossRef]
  10. Ghosh, T.B.; Dhabal, S.; Datta, A.K. On Crystallite Size Dependence of Phase Stability of Nanocrystalline TiO2. J. Appl. Phys. 2003, 94, 4577. [Google Scholar] [CrossRef]
  11. Beltran, A.; Gracia, L.; Andres, J. Density Functional Theory Study of the Brookite Surfaces and Phase Transitions between Natural Titania Polymorphs. J. Phys. Chem. B 2006, 110, 23417–23423. [Google Scholar] [CrossRef]
  12. El Goresy, A.; Chen, M.; Dubrovinsky, L.S.; Gillet, P.; Graup, G. An Ultradense Polymorph of Rutile with Seven-Coordinated Titanium from the Ries Crater. Science 2001, 293, 1467–1470. [Google Scholar] [CrossRef] [PubMed]
  13. Muscat, J.; Swamy, V.; Harrison, N.M. First-Principles Calculations of The Phase Stability of TiO2. Phys. Rev. B 2002, 65, 224112. [Google Scholar] [CrossRef]
  14. Reyes, C.D.; Rodriguez, G.G.; Espinosa, P.M.E.; Cab, C.; de Coss, R.; Oskam, G. Phase-Pure TiO2 Nanoparticles: Anatase, Brookite and Rutile. Nanotechnology 2008, 19, 145605. [Google Scholar] [CrossRef]
  15. Kalyanasundaram, K.; Bertoz, M.; Bisquert, J.; Angelis, F.D.; Desilvestro, H.; Santiago, F.F.; Fantacci, S.; Hagfeldt, I.S.; Jiang, K.J.; Kamat, P.V.; et al. Dye-Sensitized Solar Cell, 1st ed.; CRC Press, Taylor and Francis Group: Boca Raton, FL, USA, 2010; pp. 1–76. [Google Scholar]
  16. Hanaor, D.A.H.; Sorrell, C.C. Review of The Anatase to Rutile Phase Transformation. J. Mater. Sci. 2011, 46, 855–874. [Google Scholar] [CrossRef] [Green Version]
  17. Wold, A. Photocatalytic Properties of Titanium Dioxide (TiO2). Chem. Mater. 1993, 5, 280–283. [Google Scholar] [CrossRef]
  18. Gratzel, M. Solar Energy Conversion by Dye-Sensitized Photovoltaic Cells. Inorg. Chem. 2005, 44, 6841–6851. [Google Scholar] [CrossRef]
  19. Bessekhouad, Y.; Robert, D.; Weber, J.V. Preparation of TiO2 Nanoparticles by Sol-Gel Route. Int. J. Photoenergy 2003, 5, 153–158. [Google Scholar] [CrossRef]
  20. Baram, N.; Starosvetsky, D.; Starosvetsky, J.; Epshtein, M.; Armon, R.; Ein-Eli, Y. Enhanced Photo-Efficiency of Immobilized TiO2 Catalyst Via Intense Anodic Bias. Electrochem. Commun. 2007, 9, 1684–1688. [Google Scholar] [CrossRef]
  21. Mitoraj, D.; Janczyk, A.; Strus, M.; Kisch, H.; Stochel, G.; Heczko, P.B.; Macyk, W. Visible Light Inactivation of Bacteria and Fungi by Modified Titanium Dioxide. Photochem. Photobiol. Sci. 2007, 6, 642. [Google Scholar] [CrossRef]
  22. Kisch, H.; Burgeth, G.; Macyk, W. Visible Light Photocatalysis by A Titania Transition Metal Complex. Adv. Inorg. Chem. 2004, 56, 241–259. [Google Scholar] [CrossRef]
  23. Fujino, T.; Matzuda, T. Synthetic Process of Titanium Dioxide Coating on Aluminum by Chemical Conversion Method. Mater. Trans. 2006, 47, 849–853. [Google Scholar] [CrossRef] [Green Version]
  24. León, A.; Reuquen, P.; Garín, C.; Segura, R.; Vargas, P.; Zapata, P.; Orihuela, P.A. FTIR and Raman Characterization of TiO2 Nanoparticles Coated with Polyethylene Glycol as Carrier for 2-Methoxyestradiol. Appl. Sci. 2017, 7, 49. [Google Scholar] [CrossRef]
  25. Burns, G.P. Titanium Dioxide Dielectric Films Formed by Rapid Thermal Oxidation. J. Appl. Phys. 1989, 65, 2095. [Google Scholar] [CrossRef]
  26. Mittiga, A.; Salza, E.; Sarto, F.; Tucci, M.; Vasanthi, R. Heterojunction Solar Cell with 2% Efficiency Based on a Cu2O Substrate. Appl. Phys. Lett. 2006, 88, 163502. [Google Scholar] [CrossRef]
  27. Minami, T.; Miyata, T.; Ihara, K.; Minamino, Y.; Tsukada, S. Effect of ZnO Film Deposition Methods on the Photovoltaic Properties of ZnO–Cu2O Heterojunction Devices. Thin Solid Films 2006, 494, 47–52. [Google Scholar] [CrossRef]
  28. Wong, L.M.; Chiam, S.Y.; Huang, J.Q.; Wang, S.J.; Pan, J.S.; Chim, W.K. Growth of Cu2O on Ga-doped ZnO and Their Interface Energy Alignment for Thin Film Solar Cells. J. Appl. Phys. 2010, 108, 033702. [Google Scholar] [CrossRef]
  29. Raizada, P.; Sudhaik, A.; Patial, S.; Hasija, V.; Khan, A.A.P.; Singh, P.; Gautam, S.; Kaur, M.; Nguyen, V.H. Engineering Nanostructures of CuO-Based Photocatalysts for Water Treatment: Current Progress and Future Challenges. Arab. J. Chem. 2020, 13, 8424–8457. [Google Scholar] [CrossRef]
  30. Narayanan, R.; El-Sayed, M.A. Catalysis with Transition Metal Nanoparticles in Colloidal Solution:  Nanoparticle Shape Dependence and Stability. J. Phys. Chem. B 2005, 109, 12663–12676. [Google Scholar] [CrossRef] [PubMed]
  31. Kumar, K.Y.; Muralidhara, H.B.; Nayaka, Y.A.; Hanumanthappa, H.; Veena, M.S.; Kumar, S.R. Hydrothermal Synthesis of Hierarchical Copper Oxide Nanoparticles and Its Potential Application as Adsorbent for Pb (II) with High Removal Capacity. Sep. Sci. Technol. 2014, 49, 2389–2399. [Google Scholar] [CrossRef]
  32. Verma, N.; Kumar, N. Synthesis and Biomedical Applications of Copper Oxide Nanoparticles: An Expanding Horizon. Biomater. Sci. Eng. 2019, 5, 1170–1188. [Google Scholar] [CrossRef]
  33. Pavan, M.; Ruhle, S.; Ginsburg, A.; Keller, D.A.; Barad, H.N.; Sberna, P.M.; Nunes, D.; Martins, R.; Anderson, A.Y.; Zaban, A.; et al. TiO2/Cu2O All-Oxide Heterojunction Solar Cells Produced by Spray Pyrolysis. Sol. Energy Mater. Sol. Cells 2014, 132, 549–556. [Google Scholar] [CrossRef] [Green Version]
  34. Armelao, L.; Barreca, D.; Bertapelle, M.; Bottaro, G.; Sada, C.; Tondello, E. A Sol–Gel Approach to Nanophasic Copper Oxide Thin Films. Thin Solid Films 2003, 442, 48–52. [Google Scholar] [CrossRef]
  35. Kosugi, T.; Kaneko, S. Novel Spray-Pyrolysis Deposition of Cuprous Oxide Thin Films. J. Am. Ceram. Soc. 1998, 81, 3117–3124. [Google Scholar] [CrossRef]
  36. Heiroth, S.; Ghisleni, R.; Lippert, T.; Michler, J.; Wokaun, A. Optical and Mechanical Properties of Amorphous and Crystalline Yttria-Stabilized Zirconia Thin Films Prepared by Pulsed Laser Deposition. Acta Mater. 2011, 59, 2330–2340. [Google Scholar] [CrossRef]
  37. Ogale, S.B.; Bilurkar, P.G.; Mate, N.; Kanetkar, S.M. Deposition of Copper Oxide Thin Films on Different Substrates by Pulsed Excimer Laser Ablation. J Appl. Phys. 1992, 72, 3765. [Google Scholar] [CrossRef]
  38. Choudhary, S.; Sarma, J.V.N.; Pande, S.; Girard, S.A.; Turban, P.; Lepine, B.; Gangopadhyay, S. Oxidation Mechanism of Thin Cu Films: A Gateway Towards the Formation of Single Oxide Phase. AIP Adv. 2018, 8, 055114. [Google Scholar] [CrossRef]
  39. Ito, S.; Chen, P.; Comte, P.; Nazeeruddin, M.K.; Liska, P.; Pechy, P.; Gratzel, M. Fabrication of Screen-Printing Pastes from TiO2 Powders for Dye-Sensitized Solar Cells. Prog. Photovolt. Res. Appl. 2007, 15, 603–612. [Google Scholar] [CrossRef]
  40. Motoda, S.; Morita, M.; Tamura, S. Characteristics of Double Layered TiO2 Anode Assembling to Marine Microbial Fuel Cell. ECS Trans. 2017, 75, 133–143. [Google Scholar] [CrossRef]
  41. Alami, A.H.; Rajab, B.; Abed, J.; Faraj, M.; Hawili, A.A.; Alawadhi, H. Investigating Various Copper Oxides-Based Counter Electrodes for Dye Sensitized Solar Cell Applications. Energy 2019, 174, 526–533. [Google Scholar] [CrossRef]
  42. Shibata, M.; Sakai, Y.; Yokoyama, D. Advantages and Disadvantages of Vacuum-Deposited and Spin-Coated Amorphous Organic Semiconductor Films for Organic Light-Emitting Diodes. J. Mater. Chem 2015, 3, 11178–11191. [Google Scholar] [CrossRef]
  43. Morita, M.; Kishihara, K.; Motoda, S.; Koga, N.; Shinohara, T. Effect of Oxidation Temperature on Photo-Catalytic Properties of Stainless Steel Coated by Copper Oxide. ISIJ Int. 2017, 57, 1609–1616. [Google Scholar] [CrossRef] [Green Version]
  44. Raja, M.; Subha, J.; Ali, F.B.; Ryu, S.H. Synthesis of Copper Nanoparticles by Electroreduction Process. Mater. Manuf. Processes 2008, 23, 782–785. [Google Scholar] [CrossRef]
  45. Mehmood, U.; Aslam, H.M.Z.; Sulaiman, F.A.A.; Ahmed, A.A.; Ahmed, S.; Malik, M.I.; Younas, M. Electrochemical Impedance Spectroscopy and Photovoltaic Analyses of Dye-Sensitized Solar Cells Based on Carbon/TiO2 Composite Counter Electrode. J. Electrochem. Soc. 2016, 163, H339. [Google Scholar] [CrossRef]
  46. Itagaki, M.; Suzuki, S.; Shitanda, I.; Watanabe, K. Electrochemical Impedance and Complex Capacitance to Interpret Electrochemical Capacitor. Electrochemistry 2007, 75, 649–655. [Google Scholar] [CrossRef] [Green Version]
  47. Sarker, S.; Ahammad, A.J.S.; Seo, H.W.; Kim, D.M. Electrochemical Impedance Spectra of Dye-Sensitized Solar Cells: Fundamentals and Spreadsheet Calculation. Int. J. Photoenergy 2014, 2014, 851705. [Google Scholar] [CrossRef] [Green Version]
  48. Valladares, L.D.L.S.; Salinas, D.H.; Dominguez, A.B.; Najarro, D.A.; Khondaker, S.I.; Mitrelias, T.; Barnes, C.H.W.; Aguiar, J.A.; Majima, Y. Crystallization and Electrical Resistivity of Cu2O and CuO Obtained by Thermal Oxidation of Cu Thin Films on SiO2/Si Substrate. Thin Solid Films 2012, 520, 6368–6374. [Google Scholar] [CrossRef]
  49. Saadmim, F.; Forhad, T.; Sikder, A.; Ghann, W.; M Ali, M.M.; Sitther, V.; Ahammad, A.J.S.; Subhan, M.A.; Uddin, J. Enhancing the Performance of Dye Sensitized Solar Cells Using Silver Nanoparticles Modified Photoanode. Molecules 2020, 25, 4021. [Google Scholar] [CrossRef] [PubMed]
  50. Featured Products, NAS Stainless Steel Strip MFG. Co., Ltd. Available online: http://www.nas-kotai.co.jp/en/leaflet/354n.html# (accessed on 3 October 2021).
  51. Noh, J.S.; Laycock, N.J.; Gao, W.; Wells, D.B. Effects of Nitric Acid Passivation on the Pitting Resistance of 316 Stainless Steel. Corros. Sci. 2000, 42, 2069–2084. [Google Scholar] [CrossRef]
Figure 1. Schematic representation of the proposed marine wet solar cell.
Catalysts 12 00099 g001
Figure 2. (a) Photopotential of the TiO2 and copper oxides electrodes, and (b) cell voltage over a 24 h period of combined TiO2–Cu oxides cell and TiO2–stainless steel cell.
Catalysts 12 00099 g002
Figure 3. XRD patterns of stainless steel substrate, pure Cu-deposited substrate, Cu oxides electrode before photopotential measurement, and Cu oxides electrode after photopotential measurement.
Catalysts 12 00099 g003
Figure 4. Power vs. cell voltage (P–V) of four types of cells.
Catalysts 12 00099 g004
Figure 5. Nyquist plots of two types of electrodes.
Catalysts 12 00099 g005
Figure 6. Equivalent circuits by curve fitting: (a) TiO2–Cu oxides cell (b) TiO2–platinum cell.
Catalysts 12 00099 g006
Figure 7. Preparation of each electrode of the TiO2–copper oxides cell, and its image.
Catalysts 12 00099 g007
Figure 8. Schematic representation of electrochemical measurement of electrodes and cells.
Catalysts 12 00099 g008
Table 1. P, I, and V values of the cells under irradiation.
CellsJsc (μA/cm2)Voc (mV)Pmax (μW/cm2)FF (%)
Separated TiO2–Cu oxides17.96727.44.2032.15
Combined TiO2–Cu oxides23.44730.35.9634.82
TiO2–stainless steel11.20561.60.6410.20
TiO2–platinum31.68764.19.1137.63
Table 2. Impedance values of two cells under irradiation.
CellsImpedance Values
Series ResistanceRC Circuit 1RC Circuit 2RC Circuit 3
RsR1 (Ω)C1 (mF)R2 (Ω)C2 (mF)R3 (Ω)C3 (mF)
TiO2–Cu oxides15.26156.810.0112900.3621805.36
TiO2–platinum14.03 13301.9981.910.81
Table 3. Chemical composition of type 329J4L stainless steel (mass%).
CSiMnPNiCrMoWNFe
0.0250.440.770.0276.3424.963.220.140.27Bal.
Table 4. Composition of TiO2 paste (weight %).
TiO2 PasteTiO2C2H5OHCH3OHC3H7OHConfidentialWater
165–150–10–21–10Bal.
Publisher’s Note: MDPI stays neutral with regard to jurisdictional claims in published maps and institutional affiliations.

