Article

Highly Active TiO2 Photocatalysts for Hydrogen Production through a Combination of Commercial TiO2 Material Selection and Platinum Co-Catalyst Deposition Using a Colloidal Approach with Green Reductants

by
Michael Schwarze
1,
Charly Klingbeil
1,
Ha Uyen Do
1,
Edith Mawunya Kutorglo
1,2,
Riny Yolandha Parapat
1,3 and
Minoo Tasbihi
1,*
1
Department of Chemistry, Technische Universität Berlin, Straße des 17, Juni 124, 10623 Berlin, Germany
2
Department of Chemical Engineering, University of Chemistry and Technology, Technická 3, Dejvice, 166 28 Prague, Czech Republic
3
Department of Chemical Engineering, PHH Mustopha 23, National Institute of Technology (ITENAS), Bandung 40124, Indonesia
*
Author to whom correspondence should be addressed.
Catalysts 2021, 11(9), 1027; https://doi.org/10.3390/catal11091027
Submission received: 3 May 2021 / Revised: 6 August 2021 / Accepted: 16 August 2021 / Published: 25 August 2021

Abstract

:
In this contribution, four different commercial TiO2 catalysts (P25, P90, PC105, and PC500) were screened for the photocatalytic production of hydrogen using ethanol as the sacrificial agent. The physico-chemical properties of the TiO2 powders were characterized by using different methods. The photocatalysts mainly vary in the ratio of anatase and rutile phases, and in the surface area. It was found that the photocatalytic activity is governed by the surface area of the photocatalyst. Pure TiO2,PC500 showed the best performance, and in comparison to P25, the activity was more than twenty times higher due to its high surface area of about 270 m2 g−1. For further improvement of the photocatalytic activity, platinum nanoparticles (PtNPs) were immobilized onto TiO2,PC500 using two methods: a colloidal approach and a photodeposition method. For the reduction of the platinum salt precursor in the colloidal approach, different green reducing agents were used in comparison to ascorbic acid. The obtained platinum nanoparticles using natural reductants showed a higher photocatalytic activity due to the formation of smaller nanoparticles, as proven by transmission electron microscopy (TEM). The highest activity was obtained when mangosteen was used as the green reducing agent. Compared to ascorbic acid as a classical reducing agent, the photocatalytic activity of the Pt@TiO2,PC500 prepared with mangosteen was about 2–3 times higher in comparison to other as-prepared photocatalysts. The Pt@TiO2,PC500 catalyst was further studied under different operating conditions, such as catalyst and sacrificial agent concentration.

1. Introduction

Hydrogen is the most important clean energy source able to solve the increasing concern of the declining fossil fuel reserves and environmental pollution. Nowadays, most of the hydrogen is still generated through steam reforming and water electrolysis [1,2]. However, these processes are neither sustainable nor economical as they utilize nonrenewable resources or have enormous energy consumption. The direct conversion of solar energy as an abundant energy source into hydrogen via photocatalytic water splitting has attracted many kinds of research because of its sustainable nature [3,4,5,6]. In 1972, Akira Fujishima and Kenichi Honda, for the first time, performed artificial photosynthesis to produce chemical energy from light energy [7]. They generated hydrogen in a photoelectrochemical setup with titanium dioxide (TiO2) as the photocatalyst. TiO2 was capable of using light to promote the chemical reaction. After this groundbreaking discovery, photocatalysis became an important research field. It led to numerous new photocatalysts and methods to improve the performance of existing photocatalysts [8,9,10,11]. Although much work has been done in this field, the number of photocatalysts which can split water into hydrogen and oxygen in a single step is still limited to a few examples. The best-known example is (Ga1−xZnx)(N1−xOx), studied by Domen [12,13,14]. The major challenge is the synthesis of a catalyst that can fulfill the requirements of visible light absorption and utilization of the photo-generated electron–hole pairs for the water-splitting reaction without having the drawbacks of hole-quenching and backward reactions [15,16]. If small alcohols are used as sacrificial agents, e.g., methanol or ethanol, the efficiency for hydrogen production can be significantly increased [17,18]. The sacrificial agent is usually oxidized faster by the holes so that it replaces the challenging water oxidation step. A large number of photocatalysts are available to perform water reduction in the presence of sacrificial agents [19,20]. During the years, TiO2 became one of the most investigated semiconductor materials in photocatalysis, although it is only able to use UV light [21,22]. P25 is the most used type of TiO2, which is a mixture of two structures: anatase (82%) and rutile (18%). However, other types of commercially available TiO2 have been rarely investigated in photocatalysis. Therefore, the first goal of this contribution was to screen different types of TiO2 for the water reduction reaction and to identify the main TiO2 parameter that governs the photocatalytic activity. As it is known that for water reduction, platinum nanoparticles (PtNPs) are usually deposited onto the surface of the semiconductor to increase the activity, the second goal of this contribution was to study the PtNPs’ loading in more detail. Based on our earlier experience in the preparation of supported catalysts [23,24,25], a colloidal approach was used to deposit PtNPs onto the surface of TiO2. This approach was also compared with the photodeposition technique that is usually applied in photocatalysis for co-catalyst loading [26]. The immobilization route and experimental conditions have an enormous impact on the formation of PtNPs, as it has been reported by several researchers [27,28,29,30,31].
It was already shown by Schröder et al. for a carbon nitride photocatalyst that the colloidal approach for the immobilization of PtNPs results in a more active photocatalyst [32]. Recently, it was shown by Parapat et al. that green reductants in the colloidal approach outperform classical reducing agents in the preparation of PtNPs supported on alumina (Pt@Al2O3) used as catalysts for the heterogeneously catalyzed hydrogenation of α-methyl styrene (AMS) or levulinic acid (LA) [33]. To prepare a very active water reduction photocatalyst based on TiO2, the most active TiO2 photocatalyst powder from the screening experiments was further modified with PtNPs prepared using green reductants in the colloidal deposition method. In summary, this contribution focuses on the combination of material selection and co-catalyst deposition to obtain very active catalysts for photocatalytic water reduction.

2. Results and Discussion

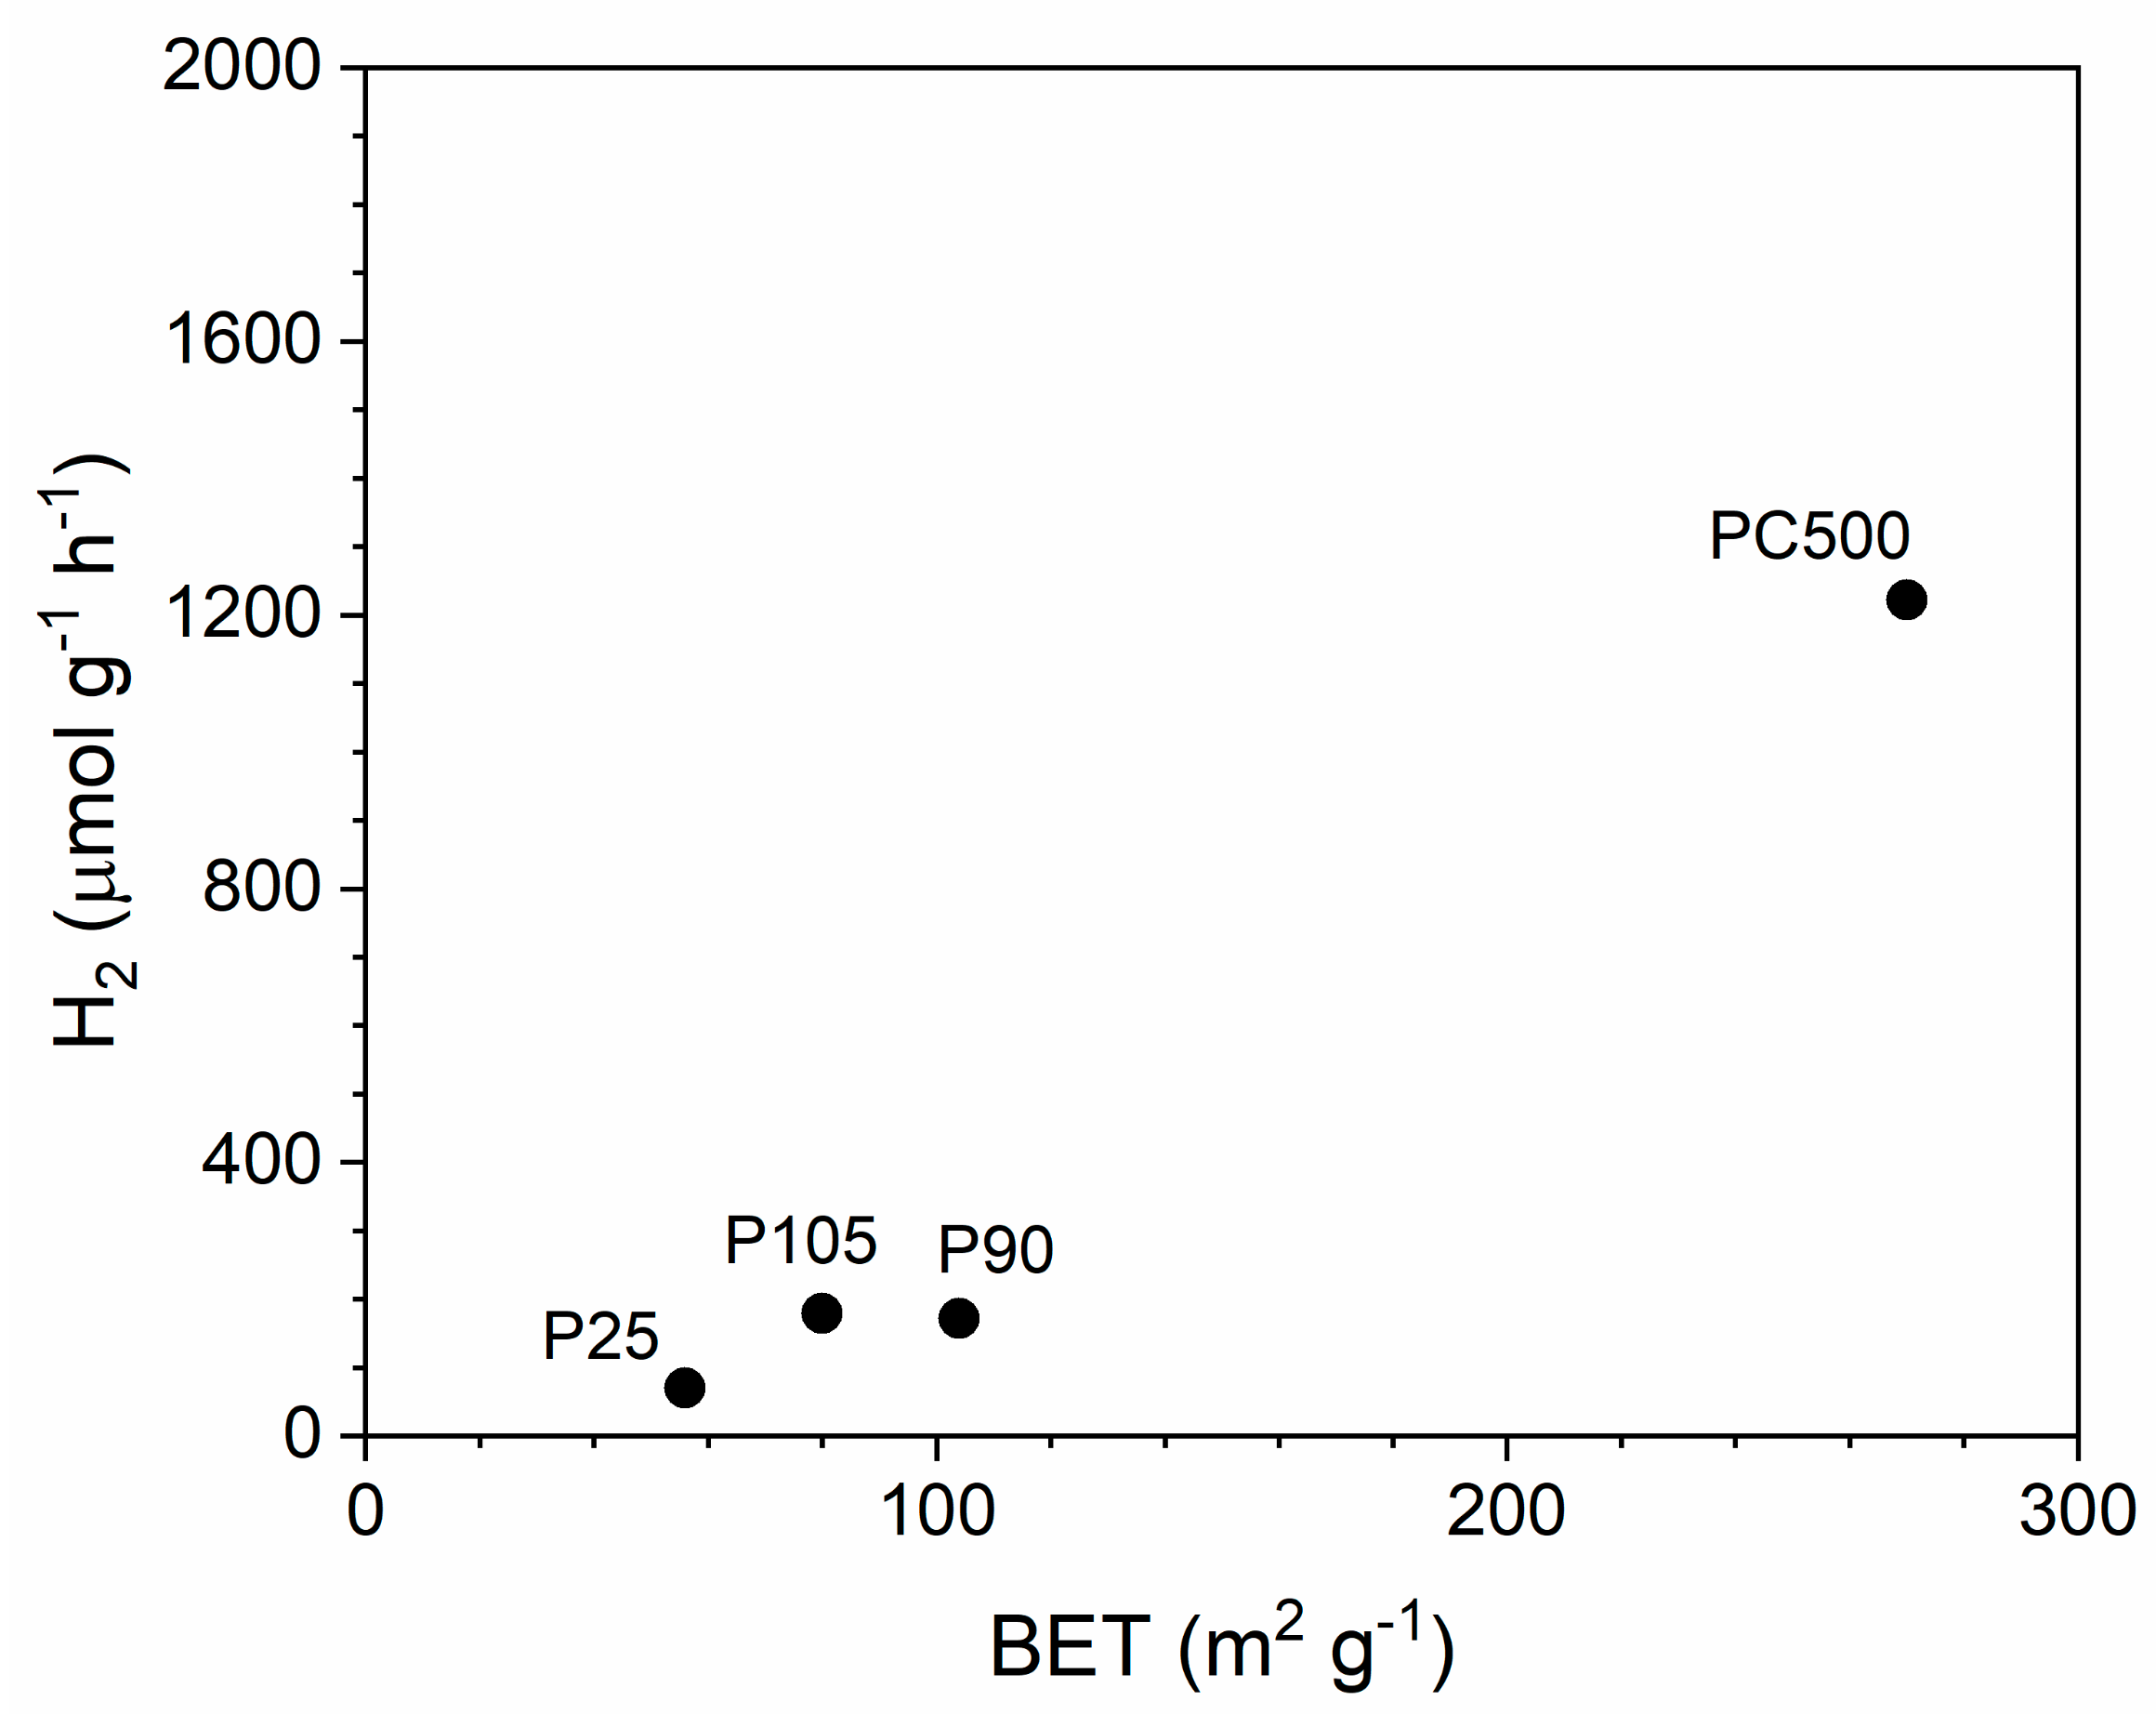
2.1. Screening of TiO2 Catalysts

In photocatalysis, P25 is the most investigated type of TiO2. However, there are other types of TiO2 commercially available. To investigate if one of these types is more suitable for water reduction, four different TiO2 powders, namely P25, P90, PC105, and PC500, were screened for the water reduction reaction using ethanol as the sacrificial agent. In heterogenous photocatalysis, many parameters can influence the photocatalytic activity, and some of them are directly related to the semiconductor’s properties, e.g., surface area, bandgap energy, crystallinity, etc. An overview on how the photocatalytic activity is influenced is provided by Rajeshwar et al. [34]. The characteristic values of the investigated TiO2 photocatalysts are summarized in Table 1. Crystallite size (CS) and bandgap energy (BGE) were obtained from previous publications [35]. BGE is about (3.2 ± 0.1) eV, and UV light is required for photocatalytic experiments, which was provided by the 300 W Xe lamp. The used TiO2 photocatalysts have different compositions (between 80% and 100% anatase phase), as verified by the XRD (Supplementary Figure S3). However, the largest differences are in the surface area and crystallite size. The surface area changes from about 60 m2 g−1 for P25 to about 270 m2 g−1 for PC500. The largest TiO2 particles are obtained for P25 and PC105 (21.3 and 20.9 nm), followed by P90 (12.6 nm) and PC500 (6.0 nm). The characteristic data show that PC500 consists of pure anatase phase, has the highest surface area, and the smallest crystallite size. All these values should be beneficial toward photocatalytic hydrogen production.
There are differences in the hydrogen productivity, as expected. The lowest rate is observed for P25 (about 48 μmol g−1 h−1), and the highest rate is obtained for PC500 (about 1222 μmol g−1 h−1). The catalytic activity for all investigated titania catalysts is in the following order: PC500 > PC105 > P90 > P25. The hydrogen productivity is plotted vs. the surface area (Figure 1), and there is quite a good correlation between them. When the surface area increases by a factor of about 5, the activity increases by a factor of about 25. The surface area is crucial in catalysis because it provides better adsorption abilities for the reactants. Increased activity has been reported, e.g., by Amano et al. for the decomposition of acetaldehyde [36] or by Cheng et al. for the degradation of dyes [37]. Furthermore, improved hydrogen production from high surface area carbon nitride prepared via a sol-gel route is reported by Kailasam et al., that outperforms bulk carbon nitride [38]. For further evaluation, the H2 activity was normalized to the surface area, showing an over-proportional increase for PC500. If only the surface area is responsible for H2 productivity, a linear trend is expected, as shown by Amano et al. [36]. This is not the case, and therefore other TiO2 characteristics must be considered, too. It is assumed that here, the smaller crystallite size (6.0 nm) of PC500 is responsible for the over-proportional H2 productivity. A smaller crystallite size is better for the charge separation after irradiation and lowers the probability of charge recombination.
Even though a high surface area material is beneficial for photocatalysis in most cases, further modification of the photocatalyst is necessary. One technique is the modification of the photocatalyst using noble-metal nanoparticles as co-catalysts. The noble-metal co-catalyst can act as an electron trap and thus lower the electron–hole charge recombination [39].

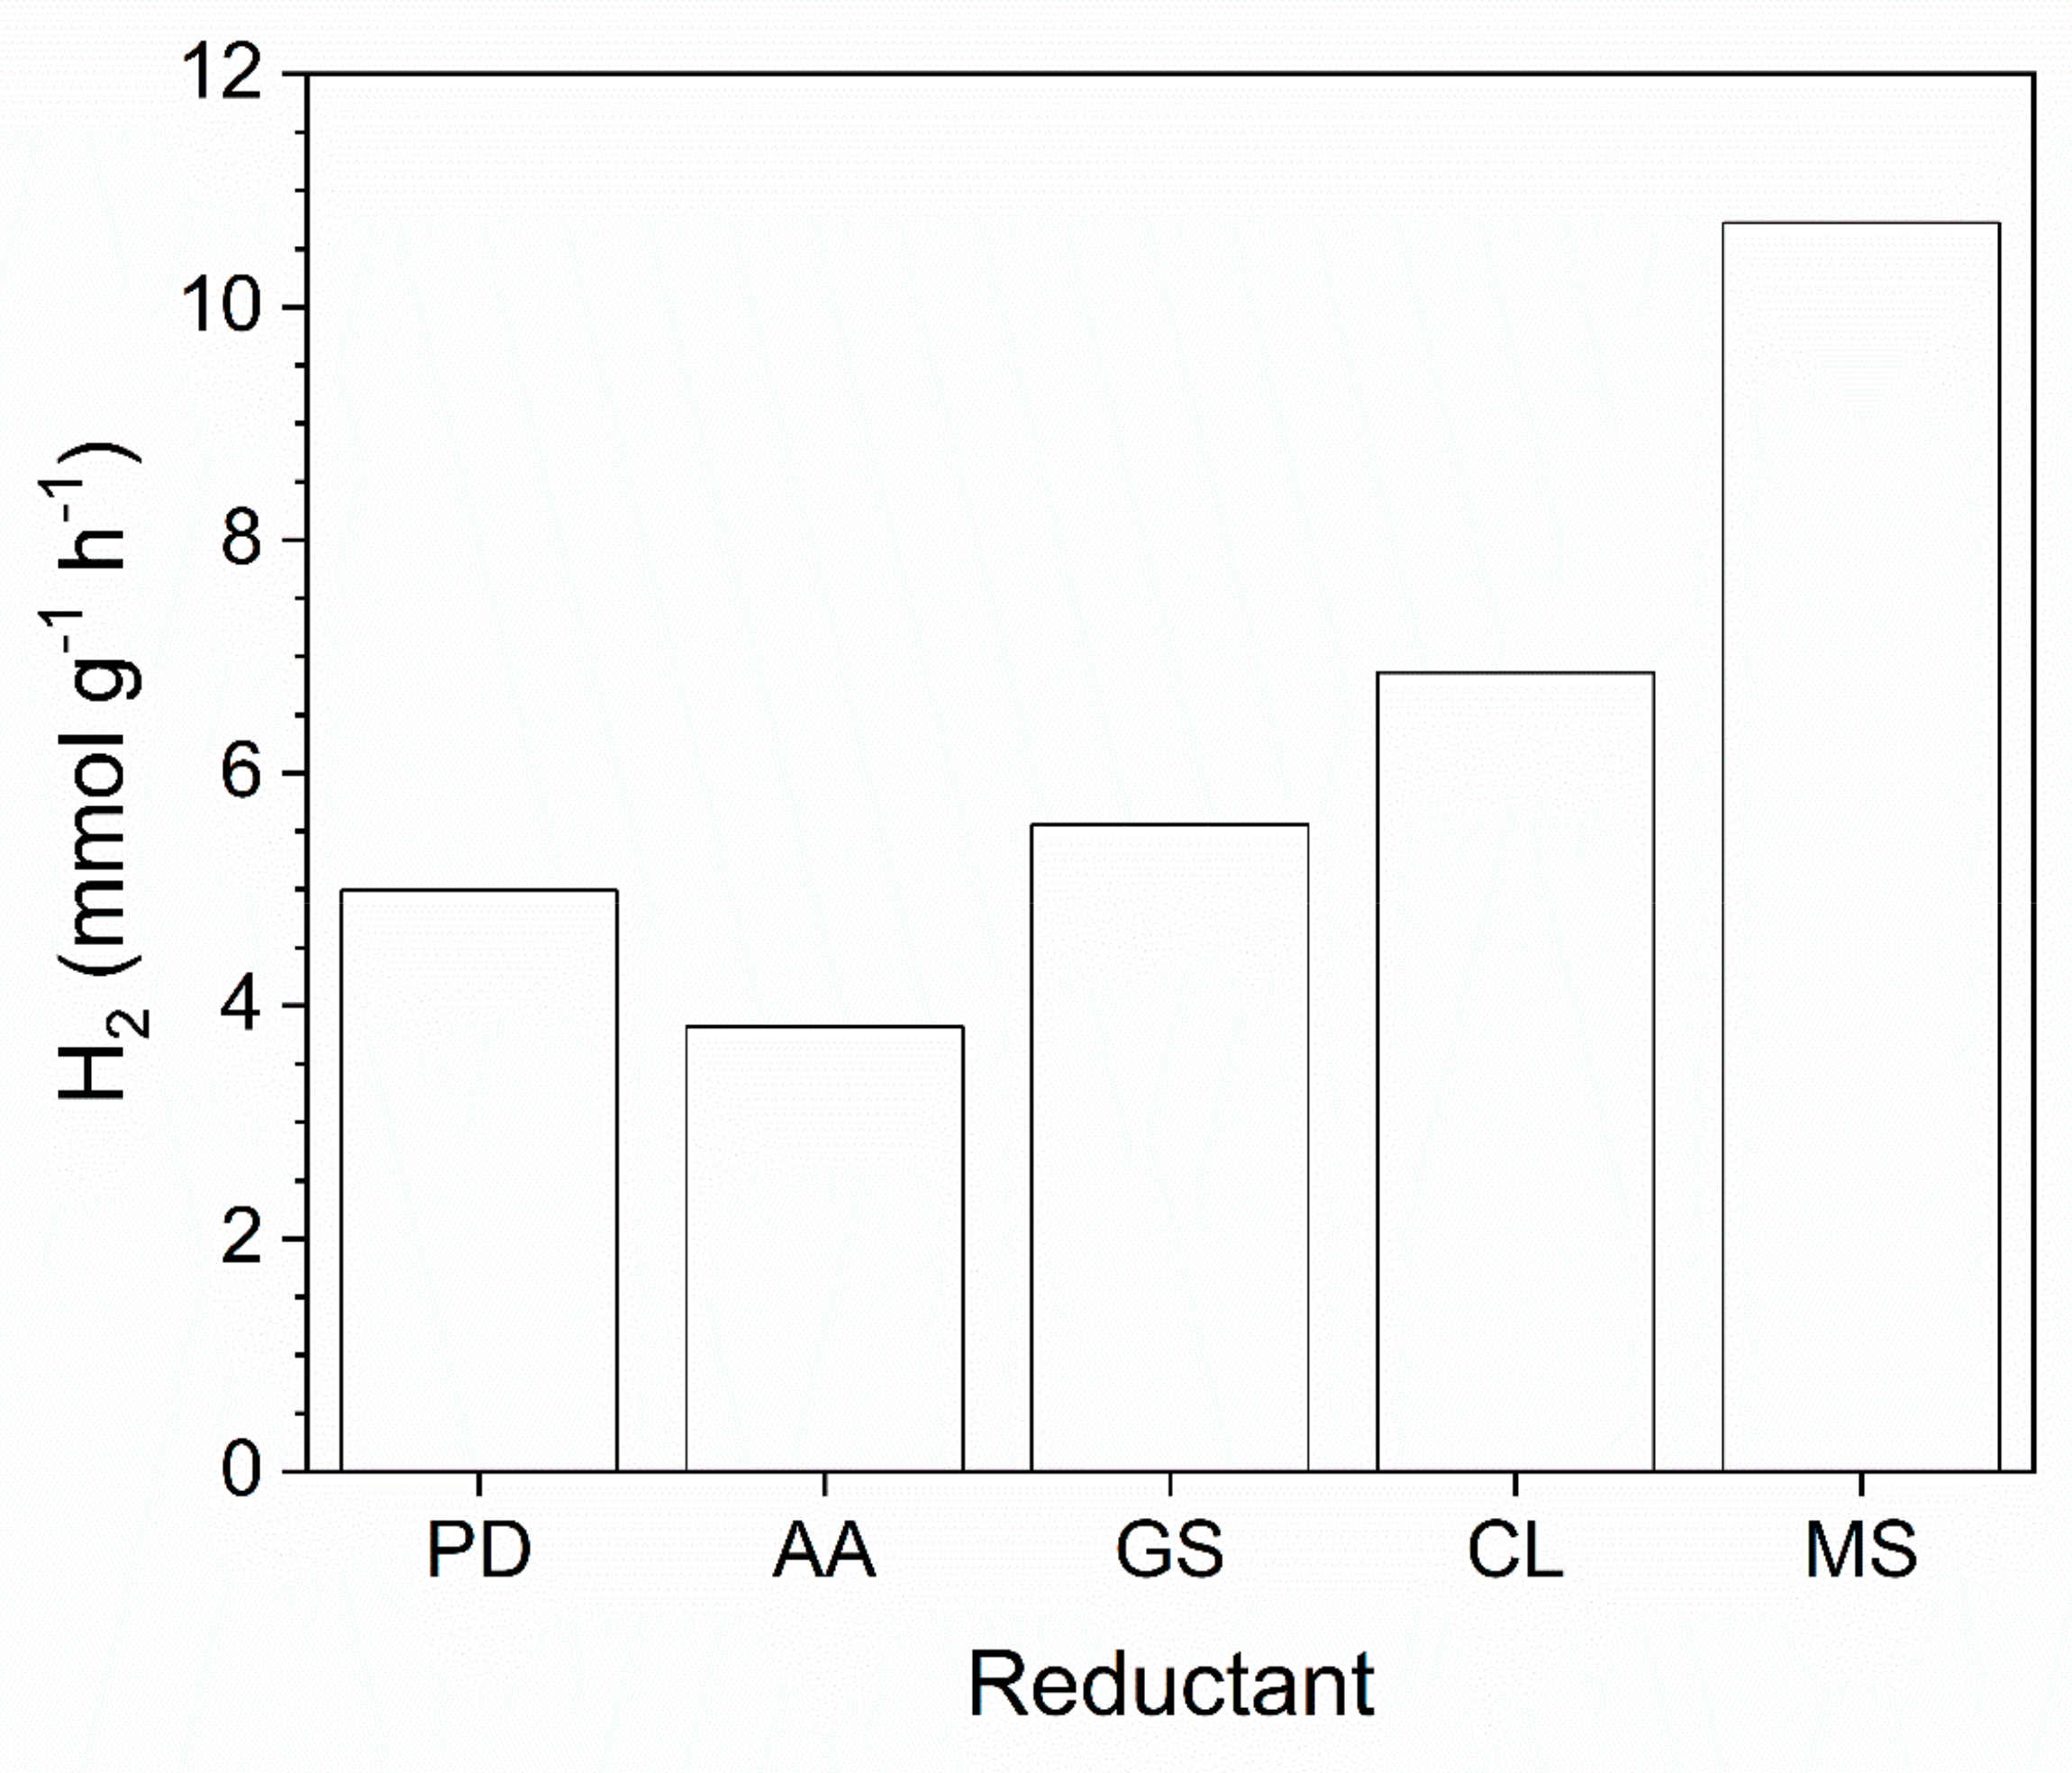
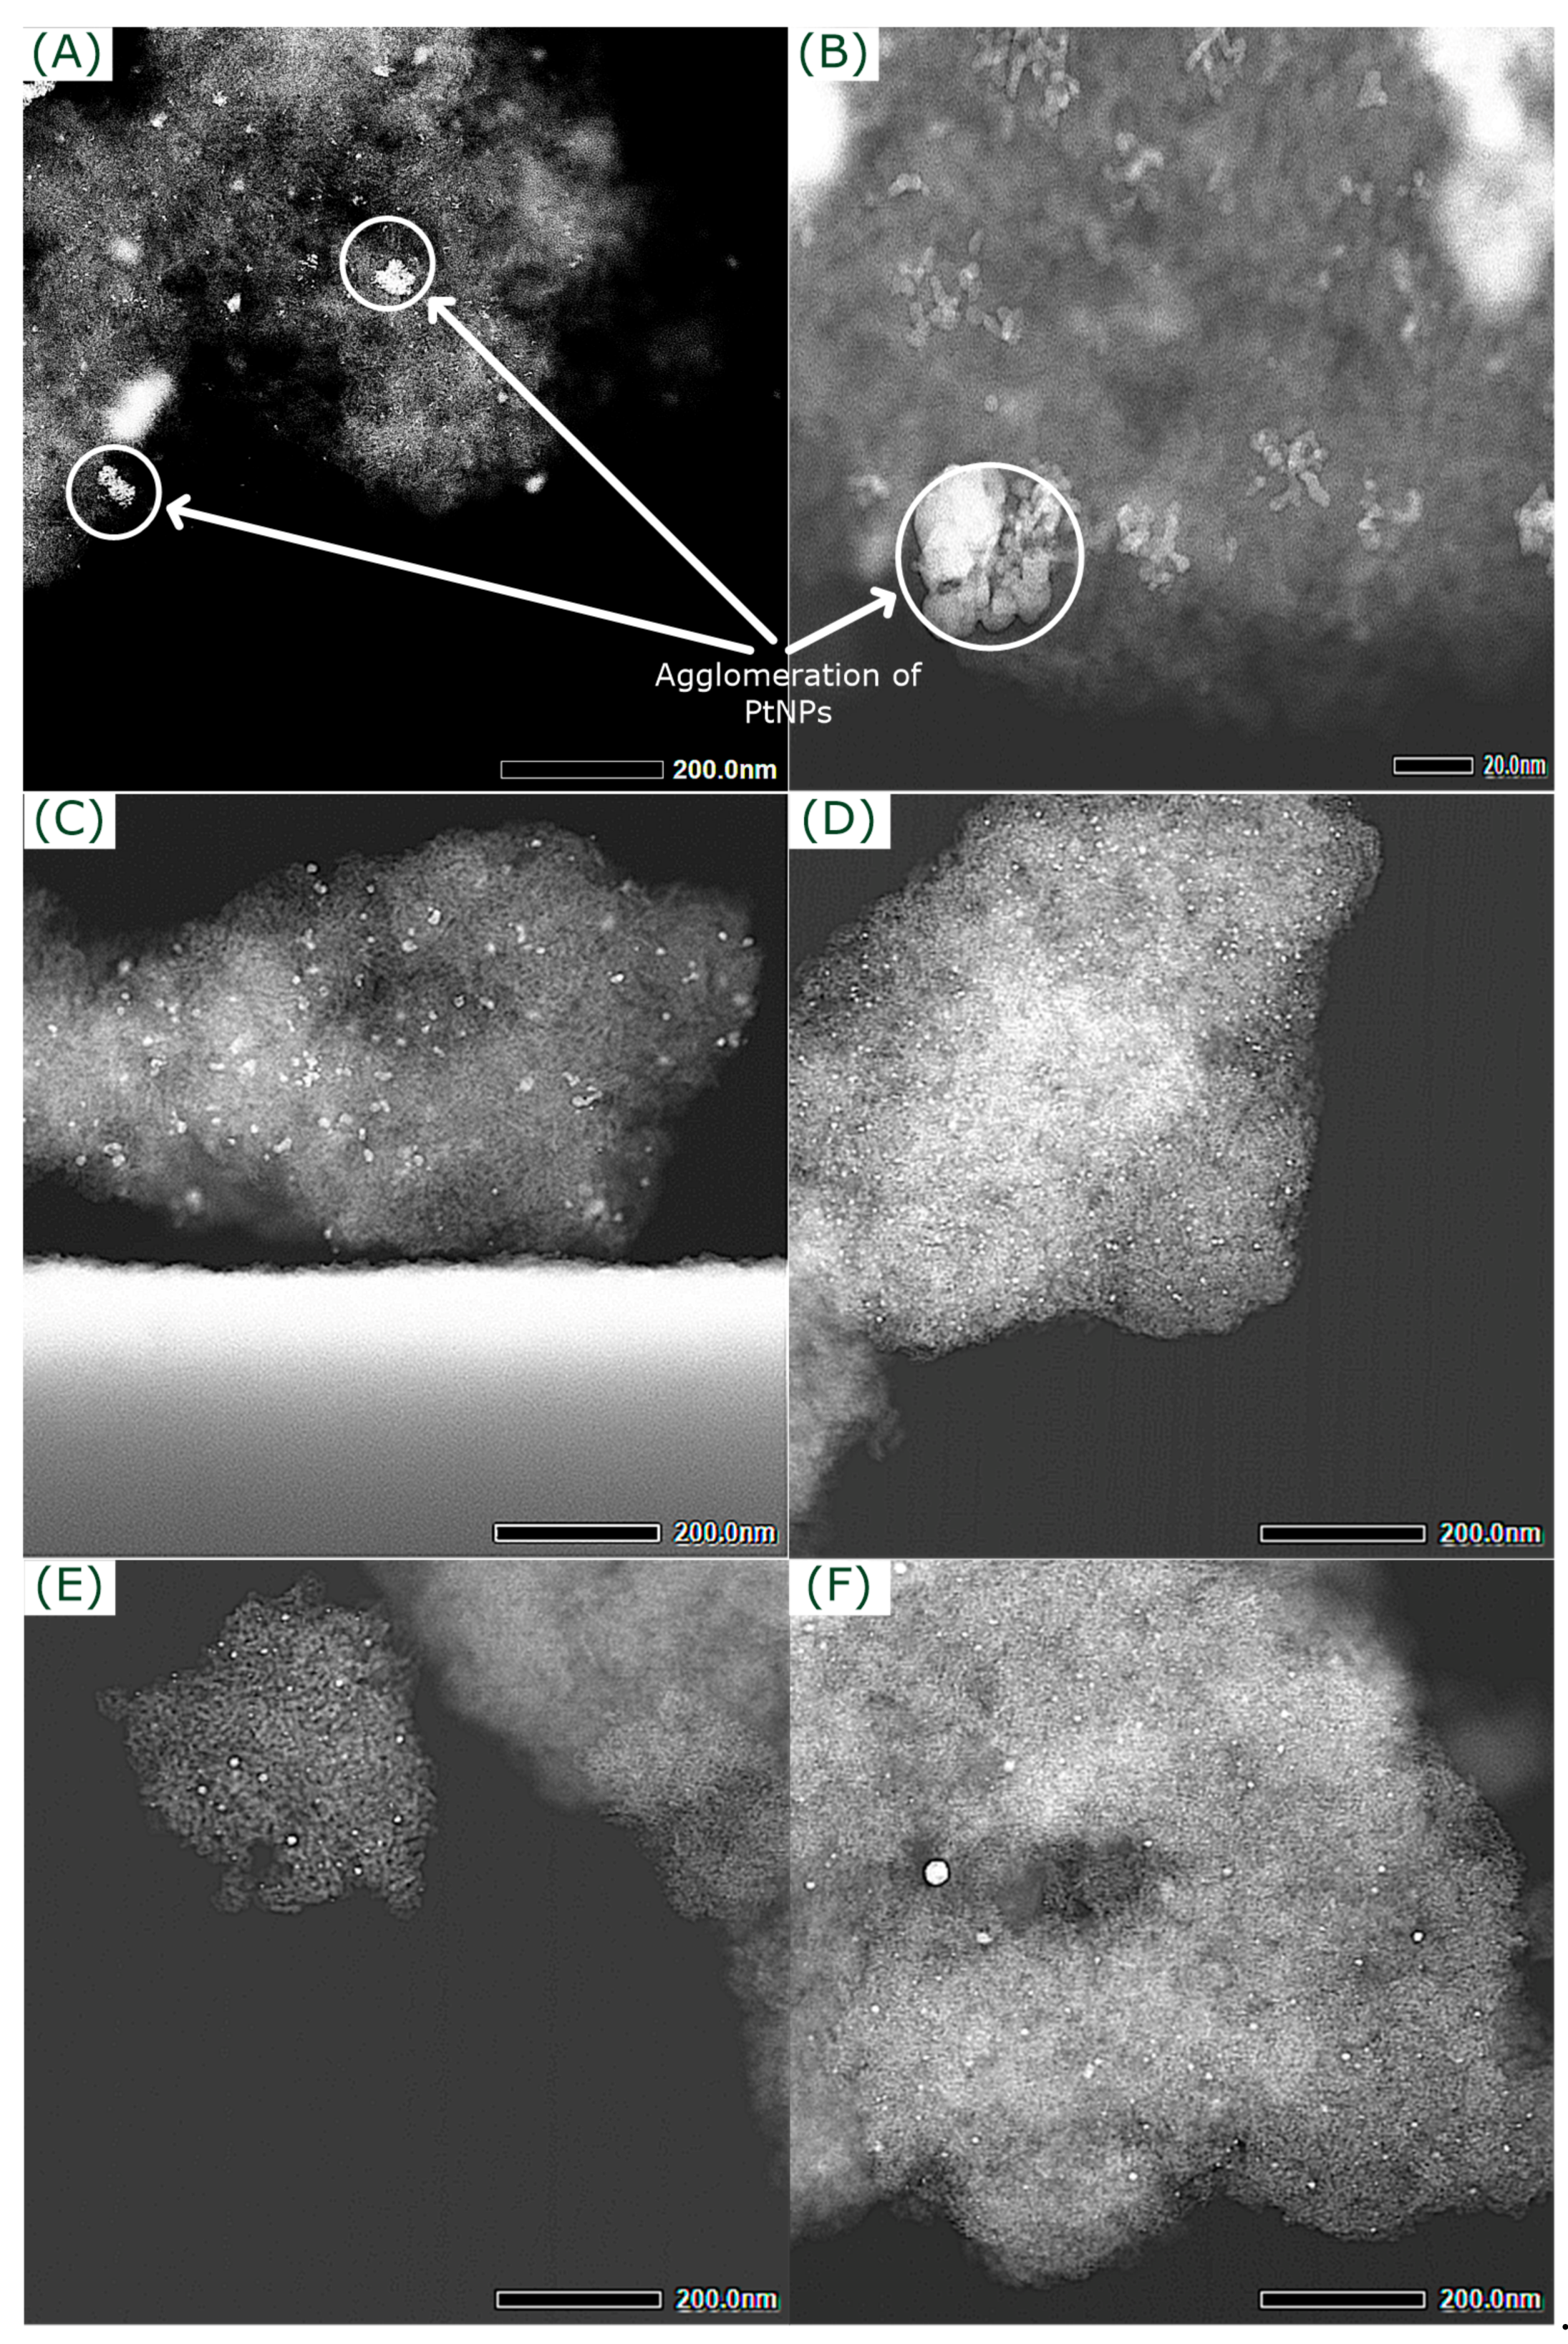
2.2. Impact of Pt Immobilization

As TiO2,PC500 showed the highest value for hydrogen productivity, it was used in the further experiments. The main goal of the second step was the improvement of hydrogen productivity by using a co-catalyst. For this purpose, PtNPs were immobilized onto the surface of TiO2,PC500 as it is well-known that PtNPs are the most active co-catalyst for H2 production [40,41,42]. Two methods were used for the immobilization of PtNPs: (a) a colloidal approach and (b) photodeposition. Further, besides the deposition method, the reducing agent was also varied. Often, the metal salt precursor is simply reduced to metal nanoparticles using an excess of sodium borhydride or ascorbic acid. Here, the precursor is reduced using green reductants, e.g., grape seed, clove, or mangosteen. These reducing agents contain polyphenols and have been reported as efficient to produce active nanoparticles. Recently, Parapat et al. used the colloidal approach in combination with green reductants to prepare Pt@Al2O3 catalysts for the hydrogenation of α-methyl styrene [33]. The catalysts prepared using the green reductants were more active than the catalysts prepared with ascorbic acid. To follow the idea to produce a very active catalyst for water reduction based on TiO2, this method was adopted. The hydrogen productivity is shown in Figure 2.
As shown, the preparation conditions have an impact on the activity and hydrogen productivity of Pt@PC500. Related to the amount of used catalyst, the activities were in the following order: MS > CL > GS > PD > AA. The highest activity of about 10 mmol g−1 h−1 was obtained for the catalyst that used mangosteen as the reducing agent. The activity was about two times higher compared to ascorbic acid as the reducing agent and about seven times higher compared to pure PC500. In comparison to the pure PC500 powder, the individual properties of the prepared Pt@PC500 must be compared in detail to understand the differences in the photocatalytic activity. The first parameter that can be responsible is the Pt loading. A nominal Pt loading of 1 wt.% was aspired for all samples, but the real loading, determined by ICP-OES, was in the range of 0.3–0.5 wt.%. The highest loading of about 0.49 wt.% was obtained for Pt@PC500 prepared by PD (Table 2, Entry 2). The lowest loading of about 0.31 wt.% was determined for Pt@PC500 prepared via the colloidal approach with AA as the reducing agent (Table 2, Entry 3). The loading of Pt@PC500 prepared by the colloidal approach with the natural reductants GS, CL, and MS was about 0.37 wt.% (Table 2, Entry 4–6). The XRD spectra were recorded for Pt@PC500 (not shown), but no change was observed. Due to both the low Pt loading and small size of Pt nanoparticles, the Pt signal was not observed in XRD.
Non-quantitative loading of Pt for the two methods is known. The main reason is that in both cases, the nanoparticles are firstly produced in solution, and secondly deposited onto PC500. Therefore, the contact of the Pt precursor and the PC500 support material before starting the reduction is low. As shown, the H2 productivity does not only depend on the Pt loading. The highest value of about 10 mmol g−1 h−1 was obtained for MS as the reduction agent, which was not the highest loading among the produced catalysts. If hydrogen productivity is normalized to the amount of Pt, the following order of activity is obtained: MS > CL > GS > AA > PD. Still, the more active Pt@PC500 photocatalyst is produced by the colloidal approach using a green reductant. If only the total amount of immobilized Pt is responsible for the different activities, the H2 values ( mol   g Pt 1   h 1 ) should be similar. As it is obvious from Table 2, the PtNPs which are produced using the green reductants as the reducing agent are used more efficiently than the PtNPs produced by photodeposition. Such a difference can only be explained by the individual properties of the produced nanoparticles, such as size, shape, and dispersion. To obtain more information about the nature of the produced PtNPs, TEM measurements were performed. Figure 3 shows a larger section of the Pt@PC500 photocatalysts produced. From these images, first, general information about the size and distribution of the PtNPs can be obtained.
As can be seen, there are clear differences in the PtNPs produced by photoreduction and the colloidal method with different reductants. The PtNPs produced by photoreduction are strongly agglomerated and form larger particles (Figure 3A,B). Further, they are not very homogenously distributed. The PtNPs produced by the colloidal method with ascorbic acid as the reductant are also large, however less agglomerated (Figure 3C). In comparison to the photoreduction, in this case, the PtNPs are better distributed. All the PtNPs obtained using the natural reductants in the colloidal deposition process are much smaller with good distribution, and show no agglomeration.
For further evaluation, particle size and particle size distribution of PtNPs were determined from TEM images using Digital Micrograph® from Gatan. The TEM images with considered PtNPs (marked as red circles) and the respective histograms are shown in Supplementary Figures S4–S8. Mean particle sizes and deviations are summarized in Table 3.
The particles’ sizes for the colloidal method using natural reductants (Table 3, Entry 3–5, and Supplementary Figures S6–S8) are in the range from 3 to 6 nm. In all cases, frequently larger particles are observed. In case of ascorbic acid as the reducing agent, the particles are about 9 nm (Table 3, Entry 2, and Supplementary Figure S5). For the photoreduction process, the determination of a mean particle size was not possible due to the strong agglomeration. Partially, isolated particles in the range of 3–5 nm are observed (not shown), but mostly, these particles agglomerate to big aggregates (Table 3, Entry 1, and Supplementary Figure S4). It has to be mentioned that TEM analysis of the samples is challenging due to the high surface area of the porous photocatalyst and the low loading with PtNPs.
For the same Pt deposition method, the characteristics of the PtNPs depend on the applied reducing agent. Here, ascorbic acid, clove, grape seed, and mangosteen were used to reduce the Pt-salt precursor. The reductants differ in purity and reduction potential. Ascorbic acid was applied as a pure substance, while the other three are extracts composed of different molecules. In clove extract, the main active compound is eugenol. For grape seed and mangosteen, the main active compounds are oligomeric pro-anthocyanidin complexes (OCPs) and mangostins (α and γ), respectively. The main active compounds of the reducing agents are summarized in Table 4 and the structures of the active compounds are shown in Supplementary Figure S9.
When comparing the observed activities for hydrogen production with the characteristics of the PtNPs, almost the same trend is observed. The activities (Table 2) are in the order MS > CL > GS > AA > PD. The determined particles’ sizes (Table 3) are in the following order: GS < MS < CL < AA < PD. In the case of photoreduction and reduction with ascorbic acid, the larger particle sizes or strong agglomeration are the reason for the lower hydrogen productivity. For the three natural reductants, GS, CL, and MS, the order does not fit. One reason could be the evaluation of the particles. In principle, many more particles are required for statistical analysis, but as mentioned, the particles are small, and the loading is very low. This makes the analysis very difficult. However, the main motivation was to show that the colloidal deposition method leads to photocatalysts with higher activity when natural reductants are used. The smaller size and better distribution of PtNPs can explain the better performance in comparison to AA and PD. The difference between MS, CL, and GS needs further evaluation. From Figure 3, it is assumed that MS (Figure 3F) shows a better distribution of the PtNPs, followed by CL (Figure 3D) and GS (Figure 3E). Different photocatalytic activity can also be due to a change in BGE, but from previous studies, it is known that co-catalyst immobilization by photodeposition or colloidal method have no impact on BGE [53].

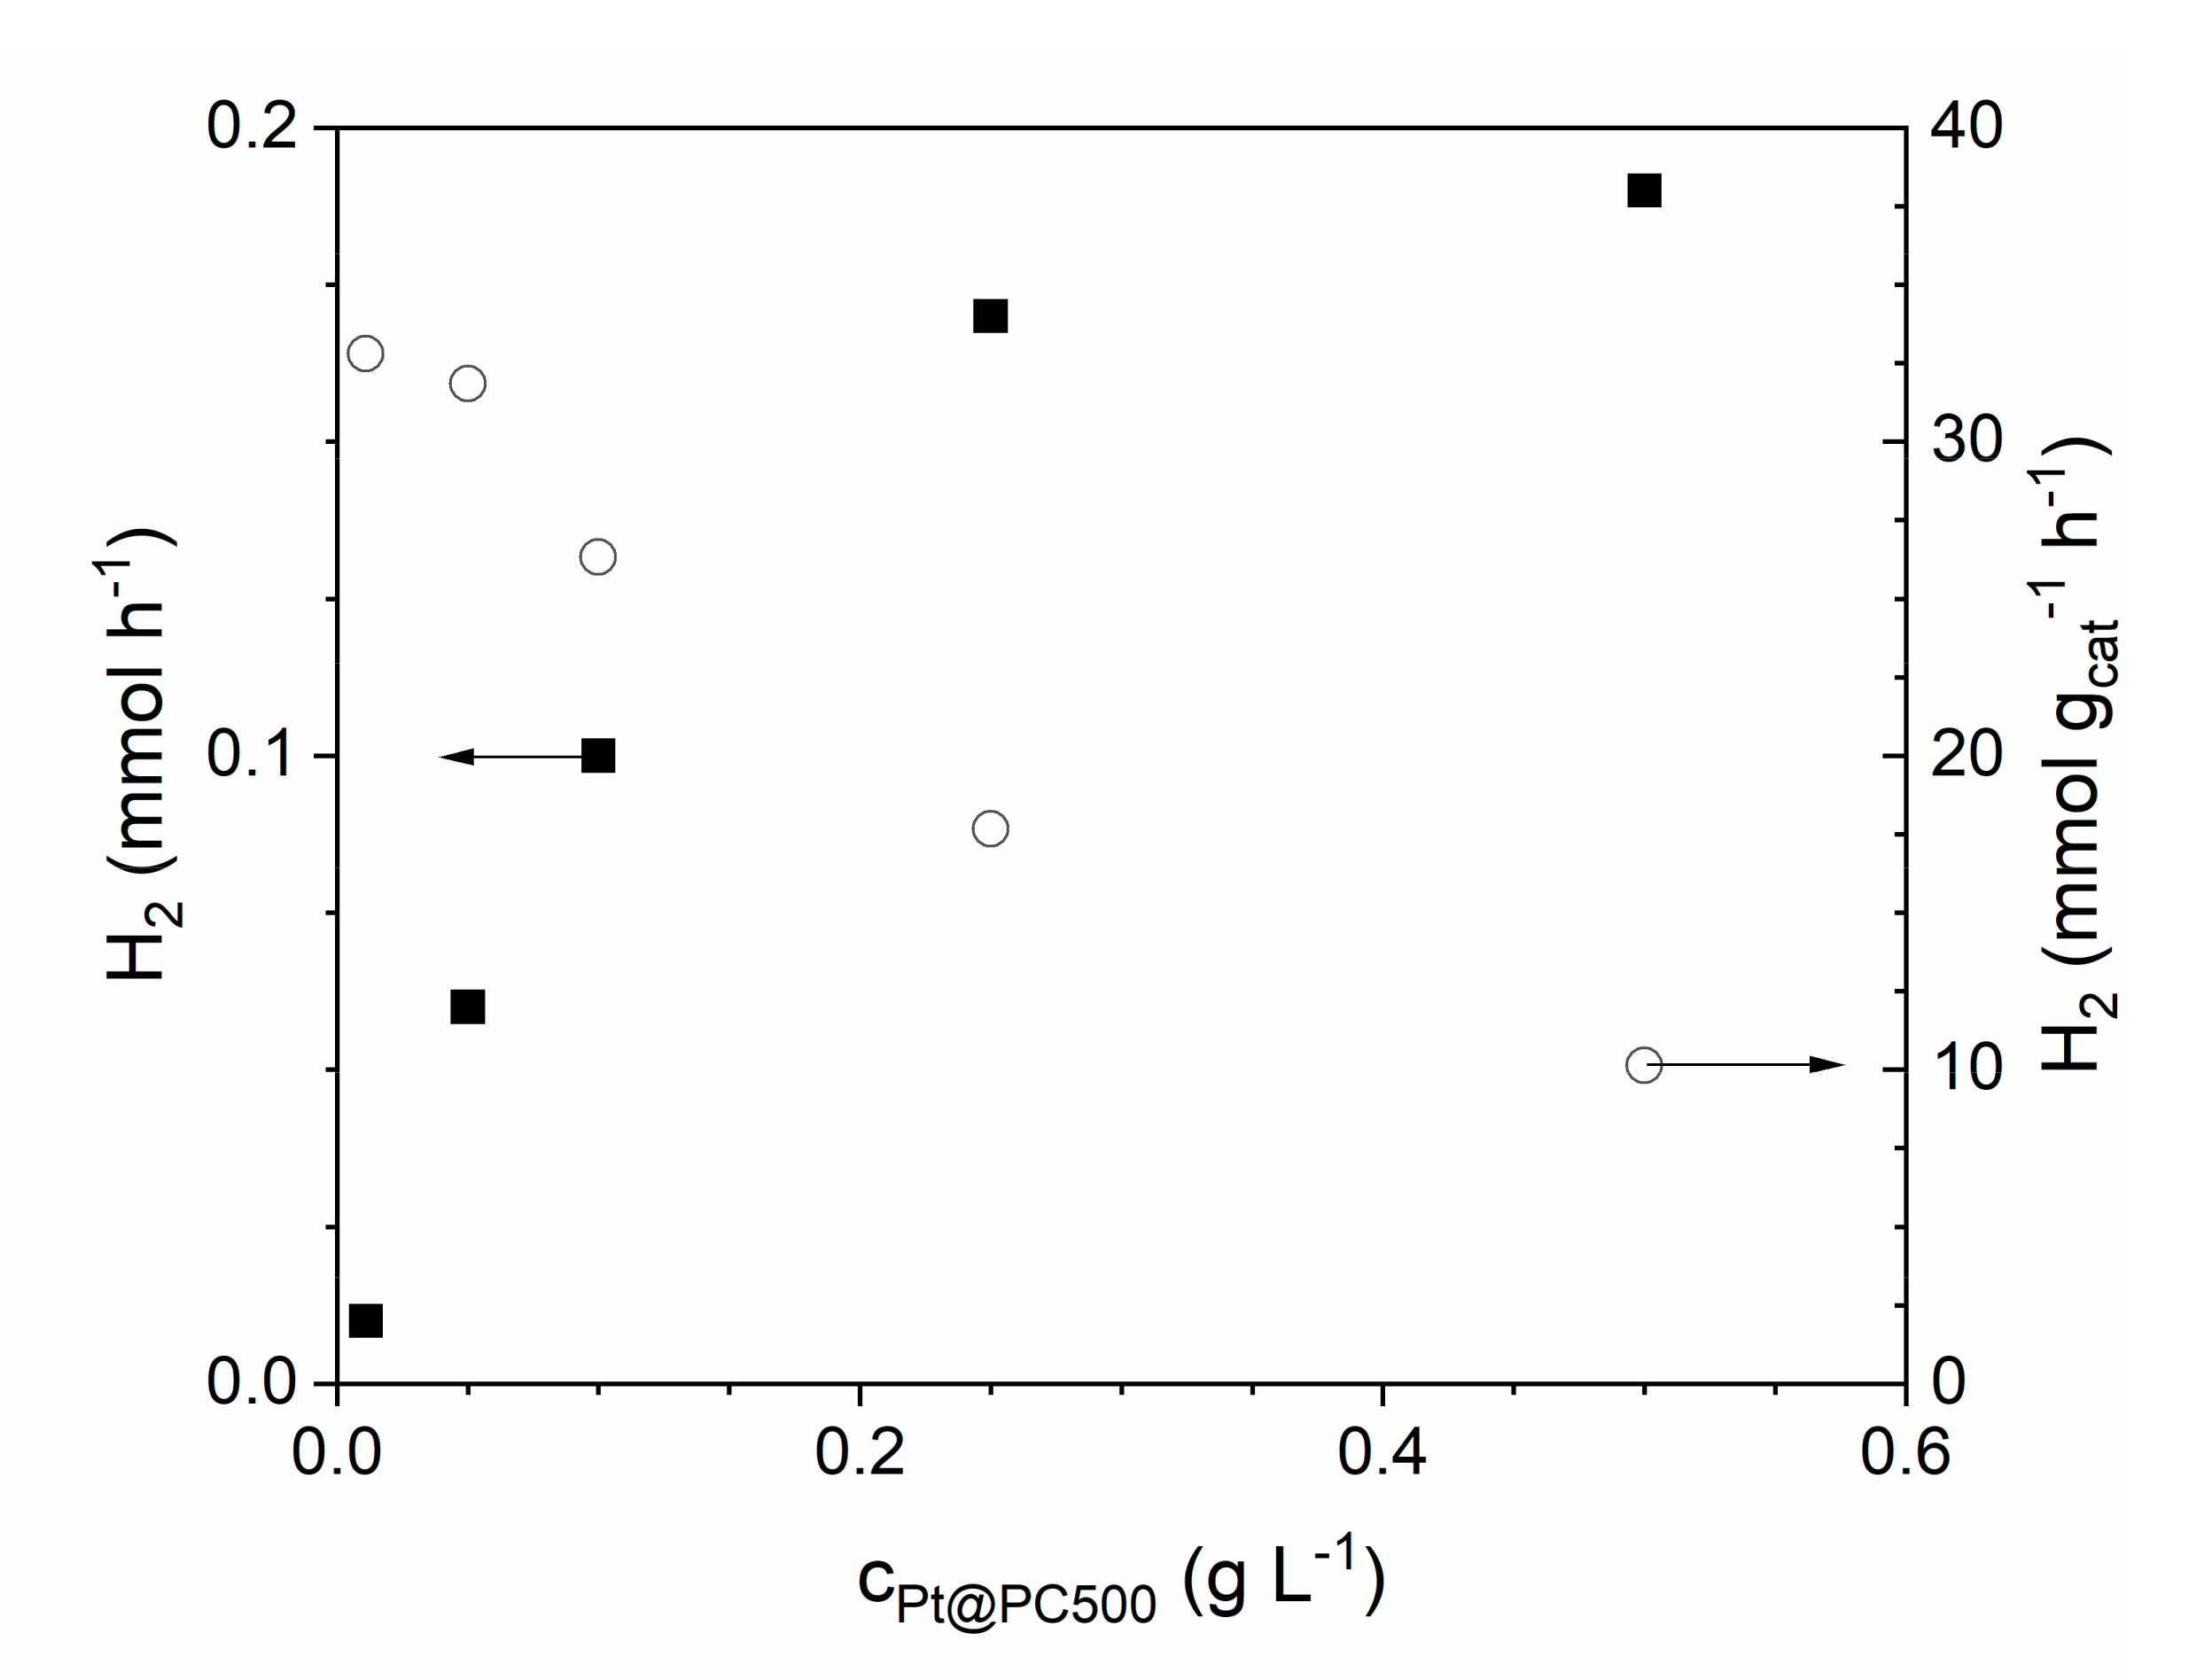
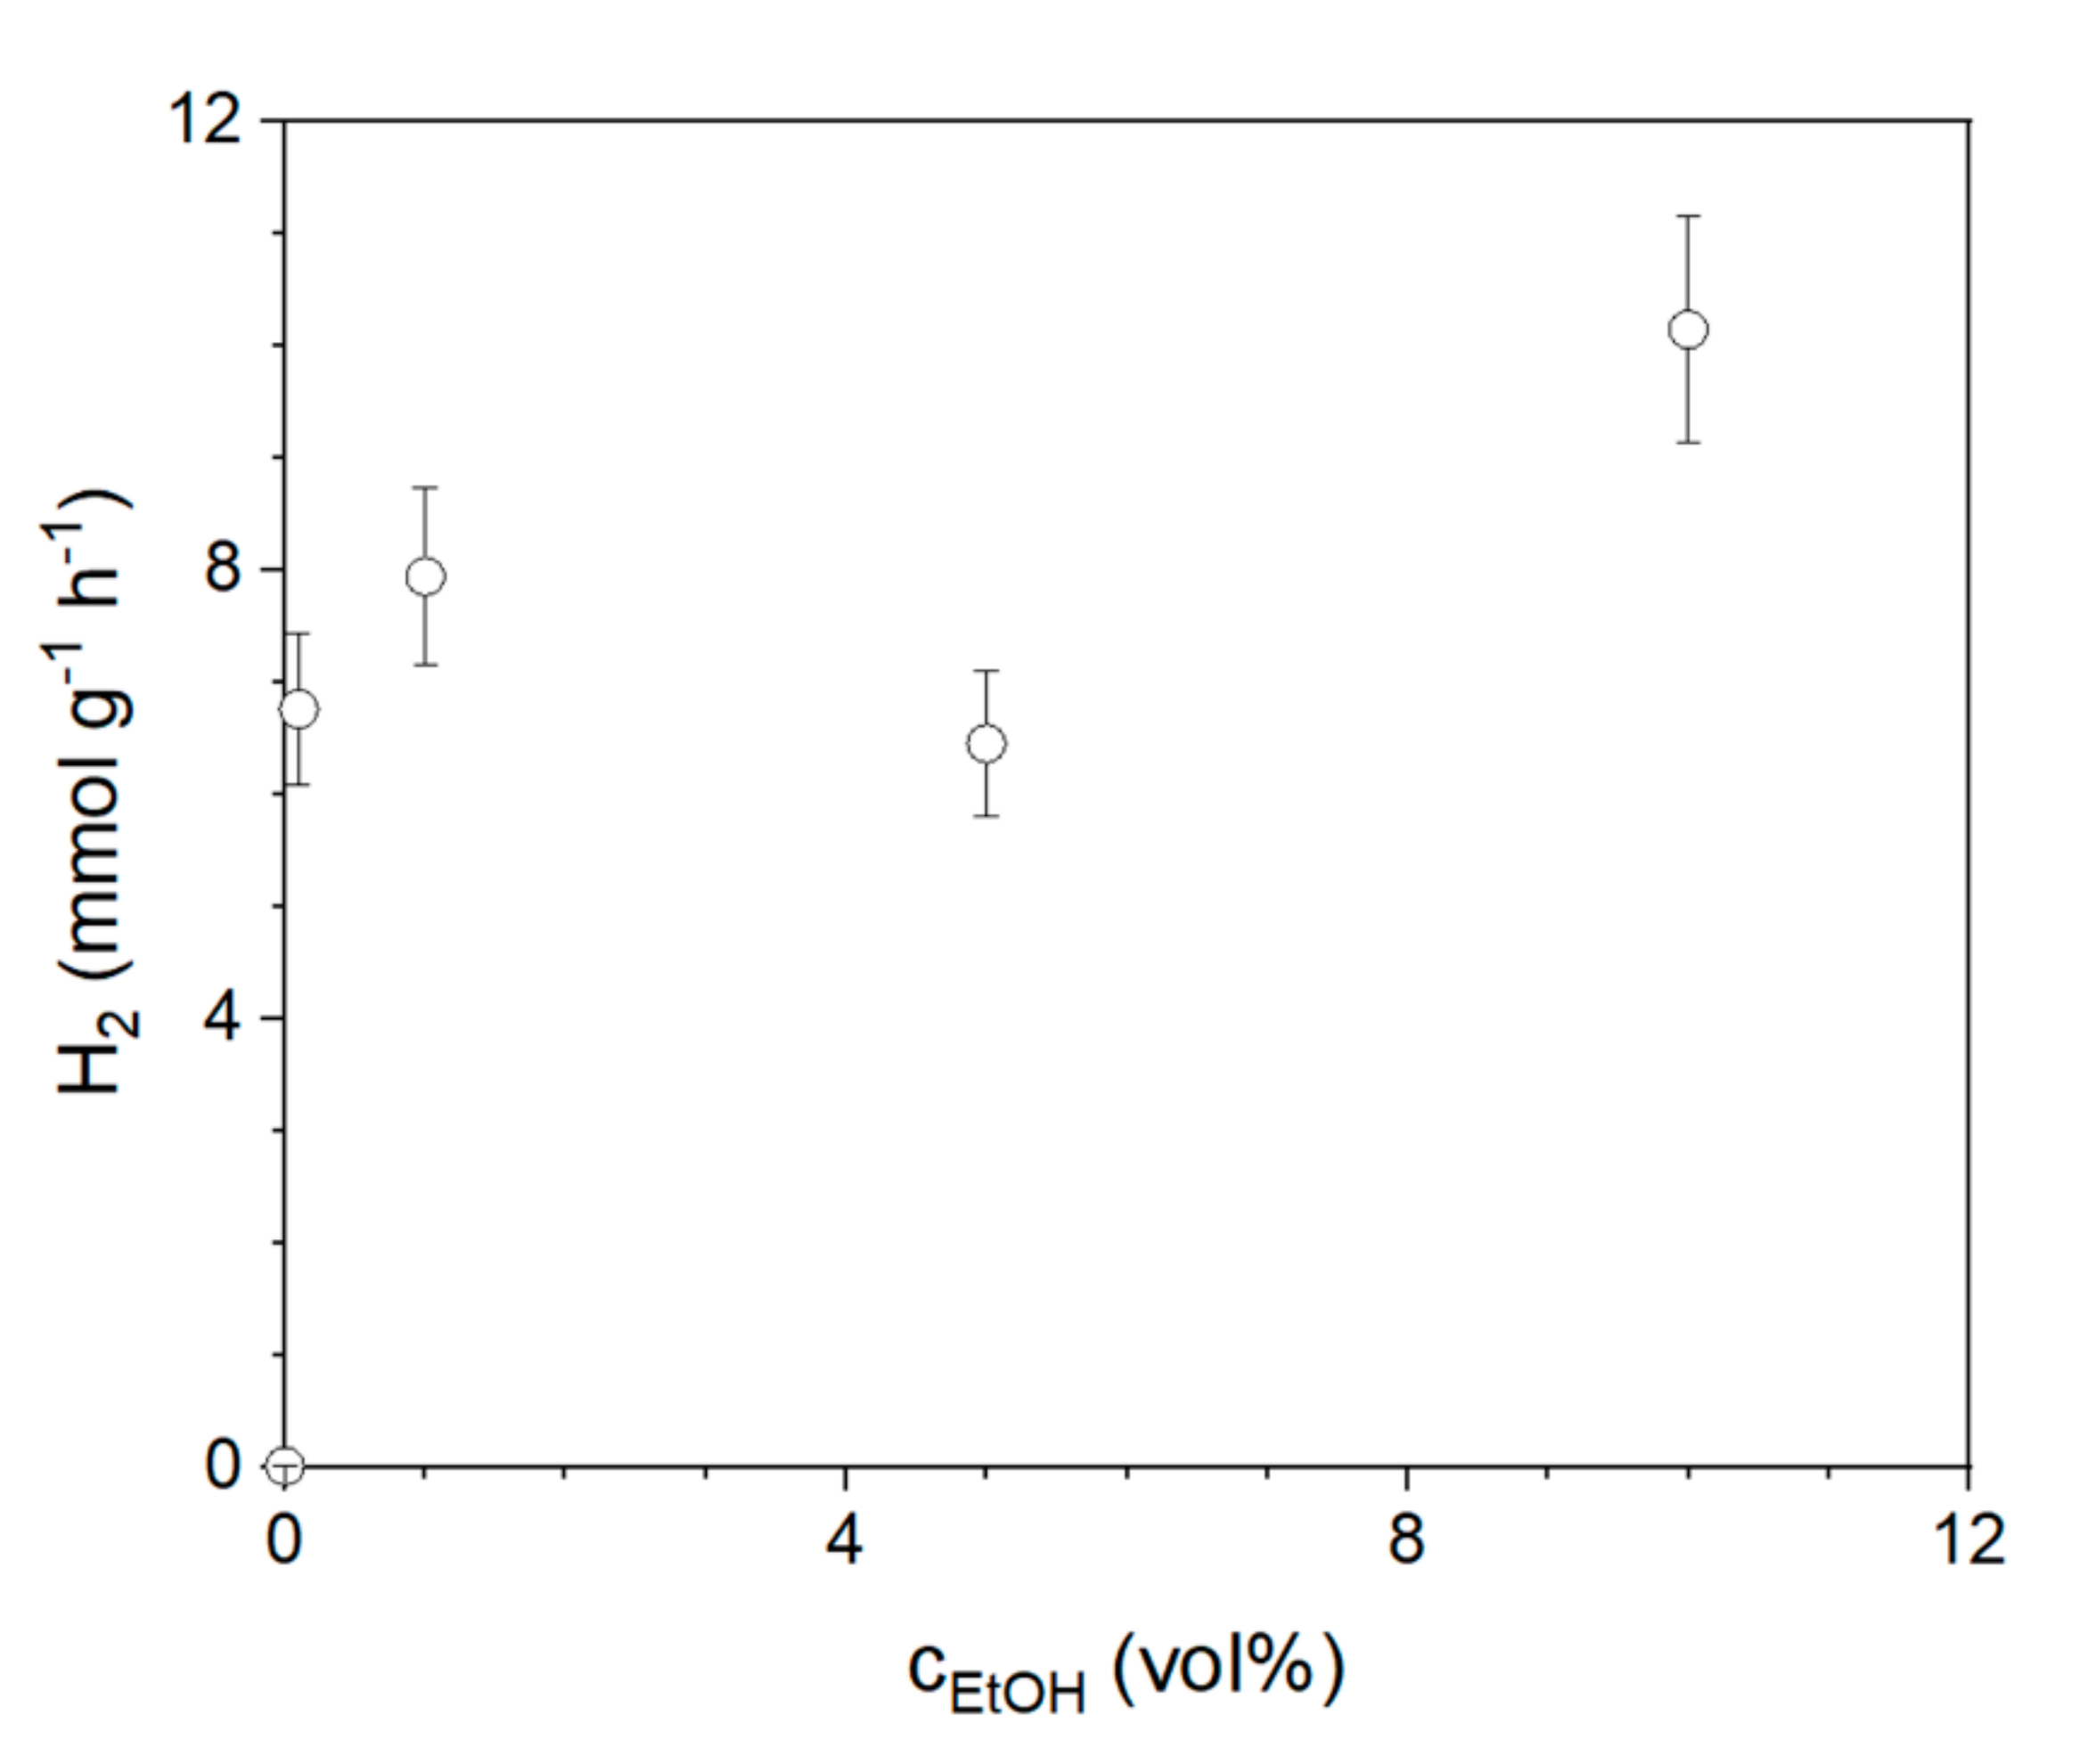
2.3. Variation of Reaction Conditions

As Pt@PC500 prepared by the colloidal approach with mangosteen as the reducing agent showed the best performance for hydrogen evolution, it was further investigated at varying reaction condition parameters, such as catalyst and ethanol concentration. Catalyst concentration was varied in the range of 0.1 to 0.5 g L−1, and hydrogen productivity is shown in Figure 4.
The photocatalyst utilizes the photons to produce electron–hole pairs, and with increasing catalyst concentration, more hydrogen should be produced. As it is shown in Figure 4, the amount of hydrogen (mol h−1) increases by enhancing the catalyst concentration. However, the hydrogen production approaches a plateau at about 0.2 mmol h−1. If the amount of hydrogen is related to the amount of catalyst (mmol g−1 h−1), a decreasing trend is observed with increasing catalyst concentration. In detail, both curves in Figure 4 show that at higher catalyst concentrations, the catalyst is not used sufficiently anymore. The reason for this behavior is that in a suspension, additional effects, such as light scattering, play an important role. These effects dominate at higher concentrations and lower the catalyst’s performance. This also means that a higher amount of the catalyst is wasted, because it is not used for hydrogen production. As the catalyst has to utilize the photons to produce hydrogen, the catalyst concentration must be adjusted in such a way that the light is completely adsorbed by the photocatalyst suspension. To determine the optimal catalyst concentration for full light adsorption, catalyst suspensions having different concentrations were measured by a UV/Vis spectrometer. The degree of transmission indicating the light that passes the suspension is shown in Figure 5.
The light is mainly adsorbed in the UV range, and the degree of transmission decreases with the increasing catalyst concentration. The visual behavior of the suspensions is shown in Figure 5 (inset). The low concentrated suspensions are transparent, and the higher ones become cloudy. Light adsorption, considering the Lambert–Beer law, is also a function of the path length. The experiments in the UV/vis spectrometer were performed in a cuvette of 1 cm path length, and more than 90% of light was absorbed for a catalyst concentration of 0.25 g L−1. In a photoreactor, the path length is often much higher, and already, low catalyst concentrations are sufficient to absorb the photons. The path length of the used photoreactor was 3.5 cm; therefore, a catalyst concentration of 0.1 g L−1 is already high enough for complete light adsorption.
There are many sacrificial agents that can be used for photocatalytic hydrogen evolution. An overview is provided by Christoforidis and Fornasiero [54]. In this contribution, ethanol was used as the sacrificial agent, because it can be directly produced from renewables. The ethanol concentration was varied in the range from 0.1 to 10 vol.%, and hydrogen productivity is shown in Figure 6.
A slight increase in the hydrogen productivity, from 6.8 mmol g−1 h−1 for 0.1 vol.% to 10.1 mmol g−1 h−1 for 10 vol.%, was observed. At the lowest ethanol concentration (0.1 vol.%, 0.66 mmol), 0.26 mmol of H2 was produced. For the highest ethanol concentration (10 vol.%, 66 mmol), the total amount of hydrogen was 0.38 mmol. The comparison of ethanol concentration and H2 production can be used to estimate the time when a new sacrificial agent has to be added. During the initial screening of the TiO2 powders, we also investigated glucose (c = 3 mM) as a sacrificial agent. Glucose was selected because it can be produced from renewables much like ethanol, and additionally, it is cheaper than some of the reported sacrificial agents, e.g., triethanolamine. The same trend for the TiO2 powders was obtained with the highest activity for PC500, but this activity was about 75% lower compared to ethanol.
When performing H2 production with EtOH as the sacrificial agent, during irradiation with the full spectrum of the 300 W Xe lamp, besides hydrogen, other products such as CO, CO2, CH4, and C2H4, C2H6 can also be produced. For most of the experiments, the amount of hydrogen in the gas phase (in relation to all detected products) was about 90% or higher.

3. Experimental

3.1. Chemicals

The following chemicals/materials were used as purchased: Hexachloroplatinic(IV) acid hydrate (H2PtCl6·H2O, 8 wt% in H2O, Sigma-Aldrich, Hamburg, Germany) as a Pt precursor, ethanol (99%, SupraSolv, Sigma-Aldrich, Hamburg, Germany) as a sacrificial agent, platinum ICP standard (1000 mg/L, Sigma-Aldrich, Hamburg, Germany) for calibration of the ICP-OES instrument, P25 (Evonik Degussa, Munich, Germany), P90 (Evonik Degussa, Munich, Germany), PC105 (Millennium/CristalACTivTM, Cristal Global, France), and PC500 (Millennium/CristalACTivTM Cristal Global, France) as photocatalysts, and clove (CL, Supa Sidoarjo, Indonesia), mangosteen (MS, Mastin Borobudur, Indonesia), grape seed (GS, Glory Feel, Hamburg, Germany), and ascorbic acid (AA, >98%, Sigma-Aldrich, Hamburg, Germany) as reducing agents. All aqueous solutions were prepared from distilled water.

3.2. Colloidal Deposition

Platinum was deposited onto PC500 by a colloidal method, as described by Parapat et al. [23]. One solution (microemulsion 1) containing 7.5 g of cyclohexane, 17.5 g of butanol, 17.5 g of TX-100, and 7.5 g of the Pt precursor H2PtCl6·H2O was placed into a double-walled glass reactor and stirred at 25 °C. A second solution (microemulsion 2) containing 7.5 g of cyclohexane, 17.5 g of butanol, 17.5 g of TX-100, and 7.5 g of the reducing agent solution was slowly added. In case of AA, 1 g of AA was dissolved in 30 mL of water and 7.5 g of as-prepared aqueous solution was used to prepare the microemulsion. The other natural reductants (CL, MS, and GS) were obtained as powders and the active compounds had to be first extracted. For this, 1 g of CL, MS, or GS was added to 30 mL of water and heated up to 70 °C. The residual powder was removed by centrifugation and 7.5 g of the aqueous phase was used to prepare the microemulsion. After mixing both microemulsions, the solution was stirred for two hours to reduce the Pt precursor. Then, 2 g of PC500 was added. The reaction mixture was heated up to 55 °C and stirred for a further two hours. The reactor was then cooled down to 25 °C. The catalyst was separated by centrifugation (Biofuge stratus, Heraeus, Hanau, Germany, 8500 rpm, 15 min) and washed with distilled water and acetone. Finally, the catalyst was calcined for two hours at 300 °C. The as-prepared catalyst was labeled as PtX@PC500 (x = AA, CL, MS, or GR).

3.3. Photodeposition

For comparison, platinum nanoparticles as the co-catalyst was deposited onto PC500 by a photodeposition method: 525 mg of H2PtCl6·H2O solution was dissolved in 180 mL of distilled water and flushed with N2 for 10 min to remove the dissolved oxygen. Then, 2 g of PC500 powder was added under vigorous stirring. The suspension was irradiated using a 300 W Xenon lamp (L.O.T. Oriel Quantum Design. Germany) equipped with a 395 nm cut-off filter for two hours. Then, 20 mL of methanol was added to the suspension, and irradiation was continued for a further two hours. After irradiation, the catalyst was separated by centrifugation (Biofuge stratus, Heraeus, Hanau, Germany, 8500 rpm, 15 min) and washed with distilled water and acetone. Finally, the catalyst was calcined for two hours at 300 °C. The as-prepared catalyst was labeled as PtPD@PC500.

3.4. Catalyst Characterization

The indirect band-gap energies of the commercial TiO2 photocatalysts were obtained from diffuse reflectance UV/Vis absorption spectra, measured using a UV-vis spectrophotometer equipped with an integrating sphere (LAMBDA 650 UV/Vis with 150 mm integrating sphere, Perkin Elmer, USA). The Brunauer–Emmett–Teller (BET) surface area of the TiO2 photocatalysts was calculated from the nitrogen adsorption–desorption isotherms at 77 K, using the quadrasorb chemisorption system (Quantachrome, Boynton Beach, FL, USA). STEM analysis was performed on a probe-corrected JEM-ARM300F2 with a cold FEG emitter, from JEOL Ltd., Japan, operated at 300 kV and a camera length of 10 cm. The acquired and evaluated HAADF images represent a detection angle of 54–220 mrad. The image contrasts are mainly formed by Rutherford scattering and are correlated to the atomic number. The specimen was dispersed in ethanol and sonicated for 5 min. Finally, 3 µL of the dispersion was drop-casted onto a holey-carbon Cu-grid (300 mesh), and air-dried at room temperature. To dissolve the platinum nanoparticles, a microwave method (Discover SPeD, CEM, USA) was used. Calibration of the setup was performed with diluted solutions of a commercial standard platinum solution (1000 mg L−1, Sigma-Aldrich, Hamburg, Germany). To measure the transmission of TiO2 suspensions, a UV/Vis spectrometer (Lambda 35, Perkin Elmer, Akron, OH, USA) was used. Transmission was recorded between 200 and 800 nm using quartz glass cuvettes (d = 1 cm, V = 3 mL).

3.5. Photocatalytic Experiments

Screening experiments were performed in a double-walled glass reactor (V0 = 146 mL) connected to a thermostat that was set to 19 °C (Supplementary Figure S1): 40 mg of TiO2 was dispersed in 72 mL of distilled water and 8 mL of ethanol. The dispersion was flushed with N2 for 10 min before the irradiation. The irradiation was carried out with a 300 W Xe arc lamp (full spectrum) as the artificial light source. Irradiation was performed for three hours, and a sample of the head space was taken after the reaction and analyzed for hydrogen via gas chromatography (7890A, Agilent Technologies, Santa Clara, CA, USA, Carboxen-1000 column).
Further photocatalytic experiments were performed in a reactor with a defined irradiation area (Supplementary Figure S2), as shown by Schwarze et al. [55]. The catalyst (ccat = 0.1–0.5 g L−1) was placed into the reaction chamber (V0 = 51.3 mL), and the reactor was closed with the quartz glass window. The reactor was evacuated and flushed with argon three times, and 38 mL of the aqueous solution containing ethanol as the sacrificial agent (0–10 vol.%) was added under argon flow via an opening at the top. After turning the light source on, the pressure increase due to the formation of reaction gases was monitored. The reaction was performed at 30 °C. After the reaction, a sample of the headspace was taken and analyzed via gas chromatography. The hydrogen production ( H 2 ) was calculated from the volume percentage obtained from gas chromatography as follows:
H 2 = ( V 0 V L ) H 2   G C m C a t t R V m
In Equation (1), V 0 is the total volume of the reactor, V L is the volume of the liquid phase, H 2 ( G C ) is the concentration of H 2 in the gas phase measured by GC, m c a t is the mass of catalyst, t R is the reaction time, and V m is the molar volume of hydrogen at given temperature.

4. Conclusions

TiO2 is a cheap and stable photocatalyst that is available with different modifications. From the commercially available TiO2 catalysts that were investigated in this contribution for photocatalytic hydrogen production, PC500 showed the best photocatalytic performance. All materials were characterized in detail and the bandgap energy of the photocatalysts was about 3.2 eV in all cases, showing that the difference in photocatalytic activity is not due to the bandgap. From nitrogen adsorption–desorption measurements, a much higher surface area (about five times compared to P25) was measured for PC500 that can explain the higher photocatalytic activity. To improve hydrogen production with PC500, Pt nanoparticles were immobilized on its surface vie two different methods. When the Pt nanoparticles were prepared using a colloidal approach in combination with a green reducing agent, the activity of the Pt@PC500 photocatalyst was higher due to the smaller size of the nanoparticles. The best result was obtained using mangosteen as the reducing agent. To complete the investigations, the PtMS@PC500 photocatalyst was studied under different operating conditions. Ethanol concentration and catalyst concentration were varied. Finally, it can be concluded that for a sustainable use of the photocatalyst, its optimal concentration is required. When the catalyst concentration is too high, the impact of side effects such as light scattering or catalyst agglomeration will increase, which lowers the photocatalytic performance of the catalyst.

Supplementary Materials

Supplementary materials can be found at https://www.mdpi.com/article/10.3390/catal11091027/s1, Figure S1: Setup for the screening of TiO2 photocatalysts (1: photoreactor, 2: stirrer, 3: 300 W Xe lamp (no filter), and 4: thermostat), Figure S2: Setup for defined photocatalytic experiments (A) with used Teflon inlet (B) and photoreactor front view (C) (1: photoreactor with quartz glass window, 2: 300 W Xe lamp with filter holder, 3: stirrer, 4: pressure indicator, 5: pressure sensor, 6: gas sampling valve, 7: thermostat, and 8: temperature sensor), Figure S3: XRD pattern of investigated commercial TiO2 photocatalysts (A: anatase phase, R: rutile phase), Figure S4: STEM HAADF image of Pt@PC500 that was prepared by simple photoreduction. It was not possible to get a mean particle size and distribution because of strong PtNP agglomeration, Figure S5: STEM HAADF images (A, B) and particle size distribution (C) of Pt@PC500 prepared by the colloidal method with ascorbic acid as the reducing agent, Figure S6: STEM HAADF image (A) and particle size distribution (B) of Pt@PC500 prepared by the colloidal method with clove as the reducing agent, Figure S7: STEM HAADF images (A, B) and particle size distribution (C) of Pt@PC500 prepared by the colloidal method with grape seed as the reducing agent, Figure S8: STEM HAADF images (A, B) and particle size distribution (C) of Pt@PC500 prepared by the colloidal method with mangosteen seed as the reducing agent, Figure S9: Chemical structures of active compounds in used reducing agents.

Author Contributions

Conceptualization, M.S., R.Y.P. and M.T.; methodology, M.S.; validation, M.S. and M.T.; formal analysis, E.M.K.; investigation, C.K., H.U.D. and E.M.K.; writing—original draft preparation, C.K. and H.U.D.; writing—review and editing, M.S. and M.T.; visualization, M.S. and M.T.; supervision, M.S., R.Y.P. and M.T.; project administration, M.S., R.Y.P. and M.T. All authors have read and agreed to the published version of the manuscript.

Funding

This reserach was funded by the Federal Ministry of Education and Research of Germany, grant number 033RC003, by the Deutsche Forschungsgemeinschaft (DFG, German Research Foun-dation), grant number 390540038, the European Structural and Investment Funds, grant number CZ.02.2.69/0.0/0.0/20_079/0017899 (E.M. Kutorglo) and the Deutsche Forschungsgemeinschaft (DFG, German Research Foundation), grant number INST 131/789-1 FUGG (JEM-ARM300F2).

Acknowledgments

We acknowledge support by the German Research Foundation and the Open Access Publication Fund of TU Berlin.

Conflicts of Interest

The authors declare no conflict of interest.

References

  1. El-Shafie, M.; Kambara, S.; Hayakawa, Y. Hydrogen Production Technologies Overview. J. Power Energy Eng. 2019, 7, 107–154. [Google Scholar] [CrossRef] [Green Version]
  2. Nikolaidis, P.; Poullikkas, A. A comparative overview of hydrogen production processes. Renew. Sustain. Energy Rev. 2017, 67, 597–611. [Google Scholar] [CrossRef]
  3. Tee, S.Y.; Win, K.Y.; Teo, W.S.; Koh, L.-D.; Liu, S.; Teng, C.P.; Han, M.-Y. Recent Progress in Energy-Driven Water Splitting. Adv. Sci. 2017, 4, 1600337. [Google Scholar] [CrossRef] [PubMed] [Green Version]
  4. Wang, Y.; Vogel, A.; Sachs, M.; Sprick, R.S.; Wilbraham, L.; Moniz, S.J.A.; Godin, R.; Zwijnenburg, M.A.; Durrant, J.R.; Cooper, A.I.; et al. Current understanding and challenges of solar-driven hydrogen generation using polymeric photocatalysts. Nat. Energy 2019, 4, 746–760. [Google Scholar] [CrossRef]
  5. Hossain, A.; Sakthipandi, K.; Atique Ullah, A.K.M.; Roy, S. Recent Progress and Approaches on Carbon-Free Energy from Water Splitting. Nano-Micro Lett. 2019, 11, 103. [Google Scholar] [CrossRef] [Green Version]
  6. Tentu, R.D.; Basu, S. Photocatalytic water splitting for hydrogen production. Curr. Opin. Electrochem. 2017, 5, 56–62. [Google Scholar] [CrossRef]
  7. Fujishima, A.; Honda, K. Electrochemical photolysis of water at a semiconductor electrode. Nature 1972, 238, 37–38. [Google Scholar] [CrossRef]
  8. Liu, G.; Wang, L.; Sun, C.; Yan, X.; Wang, X.; Chen, Z.; Smith, S.C.; Cheng, H.M.; Lu, G.Q. Band-to-band visible-light photon excitation and photoactivity induced by homogeneous nitrogen doping in layered titanates. Chem. Mater. 2009, 21, 1266–1274. [Google Scholar] [CrossRef]
  9. Di Valentin, C.; Finazzi, E.; Pacchioni, G.; Selloni, A.; Livraghi, S.; Paganini, M.C.; Giamello, E. N-doped TiO2: Theory and experiment. Chem. Phys. 2007, 339, 44–56. [Google Scholar] [CrossRef]
  10. Ilie, M.; Cojocaru, B.; Parvulescu, V.I.; Garcia, H. Improving TiO2 activity in photo-production of hydrogen from sugar industry wastewaters. Int. J. Hydrogen Energy 2011, 36, 15509–15518. [Google Scholar] [CrossRef]
  11. Leung, D.Y.C.; Fu, X.; Wang, C.; Ni, M.; Leung, M.K.H.; Wang, X.; Fu, X. Hydrogen production over titania-based photocatalysts. ChemSusChem 2010, 3, 681–694. [Google Scholar] [CrossRef]
  12. Maeda, K.; Masuda, H.; Domen, K. Effect of electrolyte addition on activity of (Ga1−xZnx)(N1−xOx) photocatalyst for overall water splitting under visible light. Catal. Today 2009, 147, 173–178. [Google Scholar] [CrossRef]
  13. Hirai, T.; Maeda, K.; Yoshida, M.; Kubota, J.; Ikeda, S.; Matsumura, M.; Domen, K. Origin of Visible Light Absorption in GaN-Rich (Ga1−xZnx)(N1−xOx) Photocatalysts. J. Phys. Chem. C 2007, 111, 18853–18855. [Google Scholar] [CrossRef]
  14. Maeda, K.; Hashiguchi, H.; Masuda, H.; Abe, R.; Domen, K. Photocatalytic Activity of (Ga1−xZnx)(N1−xOx) for Visible-Light-Driven H2 and O2 Evolution in the Presence of Sacrificial Reagents. J. Phys. Chem. C 2008, 112, 3447–3452. [Google Scholar] [CrossRef]
  15. Maeda, K.; Teramura, K.; Lu, D.; Takata, T.; Saito, N.; Inoue, Y.; Domen, K. Photocatalyst releasing hydrogen from water. Nature 2006, 440, 295. [Google Scholar] [CrossRef]
  16. Khan, S.U.M.; Al-Shahry, M.; Ingler, W.B. Efficient photochemical water splitting by a chemically modified n-TiO2. Science 2002, 297, 2243–2245. [Google Scholar] [CrossRef] [PubMed]
  17. Patsoura, A.; Kondarides, D.I.; Verykios, X.E. Photocatalytic degradation of organic pollutants with simultaneous production of hydrogen. Catal. Today 2007, 124, 94–102. [Google Scholar] [CrossRef]
  18. Pattanaik, P.; Sahoo, M.K. TiO2 photocatalysis: Progress from fundamentals to modification technology. Desalin. Water Treat. 2013, 52, 6567–6590. [Google Scholar] [CrossRef]
  19. Maeda, K.; Domen, K. Photocatalytic water splitting: Recent progress and future challenges. J. Phys. Chem. Lett. 2010, 1, 2655–2661. [Google Scholar] [CrossRef]
  20. Kudo, A.; Miseki, Y. Heterogeneous photocatalyst materials for water splitting. Chem. Soc. Rev. 2009, 38, 253–278. [Google Scholar] [CrossRef]
  21. Pelaez, M.; Nolan, N.T.; Pillai, S.C.; Seery, M.K.; Falaras, P.; Kontos, A.G.; Dunlop, P.S.M.; Hamilton, J.W.J.; Byrne, J.A.; Shea, K.O.; et al. A review on the visible light active titanium dioxide photocatalysts for environmental applications. Appl. Catal. B Environ. 2012, 125, 331–349. [Google Scholar] [CrossRef] [Green Version]
  22. Mital, G.S.; Manoj, T. A review of TiO2 nanoparticles. Chin. Sci. Bull. 2011, 56, 1639–1657. [Google Scholar] [CrossRef] [Green Version]
  23. Parapat, R.Y.; Parwoto, V.; Schwarze, M.; Zhang, B.; Su, D.S.; Schomäcker, R. A new method to synthesize very active and stable supported metal Pt catalysts: Thermo-destabilization of microemulsions. J. Mater. Chem. 2012, 22, 11605. [Google Scholar] [CrossRef] [Green Version]
  24. Parapat, R.Y.; Wijaya, M.; Schwarze, M.; Selve, S.; Willinger, M.; Schomäcker, R. Particle shape optimization by changing from an isotropic to an anisotropic nanostructure: Preparation of highly active and stable supported Pt catalysts in microemulsions. Nanoscale 2013, 5, 796–805. [Google Scholar] [CrossRef] [Green Version]
  25. Parapat, R.Y.; Saputra, O.H.I.; Ang, A.P.; Schwarze, M.; Schomäcker, R. Support effect in the preparation of supported metal catalysts via microemulsion. RSC Adv. 2014, 4, 50955–50963. [Google Scholar] [CrossRef] [Green Version]
  26. Wenderich, K.; Mul, G. Methods, Mechanism, and Applications of Photodeposition in Photocatalysis: A Review. Chem. Rev. 2016, 116, 14587. [Google Scholar] [CrossRef]
  27. Xu, L.; Zhang, J.; Xu, L.; Yang, J. Immobilizing Ultrafine PtNi Nanoparticles within Graphitic Carbon Nanosheets toward High-Performance Hydrogenation Reaction. ACS Omega 2018, 3, 16436–16442. [Google Scholar] [CrossRef] [PubMed]
  28. Huang, K.; Wang, R.; Wu, H.; Wang, H.; He, X.; Wei, H.; Wang, S.; Zhang, R.; Lei, M.; Guo, W.; et al. Direct immobilization of an atomically dispersed Pt catalyst by suppressing heterogeneous nucleation at −40 °C. J. Mater. Chem. A 2019, 7, 25779–25784. [Google Scholar] [CrossRef]
  29. Yin, X.; Xie, X.; Wu, X.; An, X. Catalytic performance of nickel immobilized on organically modified montmorillonite in the steam reforming of ethanol for hydrogen production. J. Fuel Chem. Technol. 2016, 44, 689–697. [Google Scholar] [CrossRef]
  30. Yang, T.; Du, M.; Zhu, H.; Zhang, M.; Zou, M. Immobilization of Pt Nanoparticles in Carbon Nanofibers: Bifunctional Catalyst for Hydrogen Evolution and Electrochemical Sensor. Electrochim. Acta 2015, 167, 48–54. [Google Scholar] [CrossRef]
  31. Mizukoshi, Y.; Makise, Y.; Shuto, T.; Hu, J.; Tominaga, A.; Shironita, S.; Tanabe, S. Immobilization of noble metal nanoparticles on the surface of TiO2 by the sonochemical method: Photocatalytic production of hydrogen from an aqueous solution of ethanol. Ultrason. Sonochem. 2007, 14, 387–392. [Google Scholar] [CrossRef]
  32. Schröder, M.; Kailasam, K.; Rudi, S.; Fündling, K.; Rieß, J.; Lublow, M.; Thomas, A.; Schomäcker, R.; Schwarze, M. Applying thermo-destabilization of microemulsions as a new method for co-catalyst loading on mesoporous polymeric carbon nitride—Towards large scale applications. RSC Adv. 2014, 4, 50017–50026. [Google Scholar] [CrossRef] [Green Version]
  33. Parapat, R.Y.; Yudatama, F.A.; Musadi, M.R.; Schwarze, M.; Schomäcker, R. Antioxidant as Structure Directing Agent in Nanocatalyst Preparation. Case Study: Catalytic Activity of Supported Pt Nanocatalyst in Levulinic Acid Hydrogenation. Ind. Eng. Chem. Res. 2019, 58, 2460–2470. [Google Scholar] [CrossRef]
  34. Rajeshwar, K.; Thomas, A.; Janaky, C. Photocatalytic activity of inorganic semiconductor surfaces: Myths, hype, and reality. J. Phys. Chem. Lett. 2015, 6, 139–147. [Google Scholar] [CrossRef]
  35. Kete, M.; Pavlica, E.; Fresno, F.; Bratina, G.; Štangar, U.L. Highly active photocatalytic coatings prepared by a low-temperature method. Environ. Sci. Pollut. Res. 2014, 21, 11238–11249. [Google Scholar] [CrossRef]
  36. Amano, F.; Nogami, K.; Tanaka, M.; Ohtani, B. Correlation between Surface Area and Photocatalytic Activity for Acetaldehyde Decomposition over Bismuth Tungstate Particles with a Hierarchical Structure. Langmuir 2010, 26, 7174–7180. [Google Scholar] [CrossRef]
  37. Cheng, H.; Wang, J.; Zhao, Y.; Han, X. Effect of phase composition, morphology, and specific surface area on the photocatalytic activity of TiO2 nanomaterials. RSC Adv. 2014, 4, 47031–47038. [Google Scholar] [CrossRef]
  38. Kailasam, K.; Epping, J.D.; Thomas, A.; Losse, S.; Junge, H. Mesoporous carbon nitride-silica composites by a combined sol-gel/thermal condensation approach and their application as photocatalysts. Energy Environ. Sci. 2011, 4, 4668. [Google Scholar] [CrossRef] [Green Version]
  39. Tasbihi, M.; Kocí, K.; Edelmannová, M.; Troppová, I.; Reli, M.; Schomäcker, R. Pt/TiO2 photocatalysts deposited on commercial support for photocatalytic reduction of CO2. J. Photochem. Photobiol. A Chem. 2018, 366, 72–80. [Google Scholar] [CrossRef]
  40. Alghamdi, H.; Idriss, H. Study of the modes of adsorption and electronic structure of hydrogen peroxide and ethanol over TiO2 rutile (110) surface within the context of water splitting. Surf. Sci. 2018, 669, 103–113. [Google Scholar] [CrossRef]
  41. Jiang, Z.; Isaacs, M.A.; Huang, Z.W.; Shangguan, W.; Deng, Y.; Lee, A.F. Active Site Elucidation and Optimization in Pt Co-catalysts for Photocatalytic Hydrogen Production over Titania. ChemCatChem 2017, 9, 4268–4274. [Google Scholar] [CrossRef]
  42. Shearer, C.; Alvino, J.; Batmunkh, M.; Metha, G. Pt Nanocluster Co-Catalysts for Photocatalytic Water Splitting. C 2018, 4, 64. [Google Scholar] [CrossRef] [Green Version]
  43. Ping, Y.; Zhang, J.; Xing, T.; Chen, G.; Tao, R.; Choo, K.-H. Green synthesis of silver nanoparticles using grape seed extract and their application for reductive catalysis of Direct Orange 26. J. Ind. Eng. Chem. 2018, 58, 74–79. [Google Scholar] [CrossRef]
  44. Malassis, L.; Dreyfus, R.; Murphy, R.J.; Hough, L.A.; Donnio, B.; Murray, C.B. One-step green synthesis of gold and silver nanoparticles with ascorbic acid and their versatile surface post-functionalization. RSC Adv. 2016, 6, 33092–33100. [Google Scholar] [CrossRef]
  45. Liu, Q.-m.; Yasunami, T.; Kuruda, K.; Okidom, M. Preparation of Cu nanoparticles with ascorbic acid by aqueous solution reduction method. T. Nonferr. Met. Soc. 2012, 22, 2198–2203. [Google Scholar] [CrossRef]
  46. Parlinska-Wojtan, M.; Depciuch, J.; Fryc, B.; Kus-Liskiewicz, M. Green synthesis and antibacterial effects of aqueous colloidal solutions of silver nanoparticles using clove eugenol. Appl. Organomet. Chem. 2018, 32, e4276. [Google Scholar] [CrossRef]
  47. Tekin, V.; Kozgus Guldu, O.; Dervis, E.; Yurt Kilcar, A.; Uygur, E.; Biber Muftuler, F.Z. Green synthesis of silver nanoparticles by using eugenol and evaluation of antimicrobial potential. Appl. Organomet. Chem. 2019, 33, e4969. [Google Scholar] [CrossRef]
  48. Fahmy, S.A.; Fawzy, I.M.; Saleh, B.M.; Issa, M.Y.; Bakowsky, U.; Azzazy, H.M.E.-S. Green Synthesis of Platinum and Palladium Nanoparticles Using Peganum harmala L. Seed Alkaloids: Biological and Computational Studies. Nanomaterials 2021, 11, 965. [Google Scholar] [CrossRef] [PubMed]
  49. Morazzoni, P.; Vanzani, P.; Santinello, S.; Gucciardi, A.; Zennaro, L.; Miotto, G.; Ursini, F. Grape seeds proanthocyanidins: Advanced technological preparation and analytical characterization. Antioxidants 2021, 10, 418. [Google Scholar] [CrossRef]
  50. Ismail, E.H.; Khalil, M.M.H.; Al Seif, F.A.; El-Magdoub, F. Biosynthesis of Gold Nanoparticles Using Extract of Grape (Vitis Vinifera) Leaves and Seeds. Progr. Nanotechn. Nanomat. 2014, 3, 1–12. [Google Scholar]
  51. Shan, Y.; Zhang, W. Preparative separation of major xanthones from mangosteen pericarp using high-performance centrifugal partition chromatography. J. Sep. Sci. 2010, 33, 1274–1278. [Google Scholar] [CrossRef] [PubMed]
  52. Nishanthi, R.; Malathi, S.; John Paul, S.; Palani, P. Green synthesis and characterization of bioinspired silver, gold and platinum nanoparticles and evaluation of their synergistic antibacterial activity after combining with different classes of antibiotics. Mater. Sci. Eng. C 2019, 96, 693–707. [Google Scholar] [CrossRef]
  53. Tasbihi, M.; Schwarze, M.; Edelmannová, M.; Spöri, C.; Strasser, P.; Schomäcker, R. Photocatalytic reduction of CO2 to hydrocarbons by using photodeposited Pt nanoparticles on carbon-doped titania. Catal. Today 2019, 328, 8–14. [Google Scholar] [CrossRef]
  54. Christoforidis, K.C.; Fornasiero, P. Photocatalytic Hydrogen Production: A Rift into the Future Energy Supply. ChemCatChem 2017, 9, 1523–1544. [Google Scholar] [CrossRef] [Green Version]
  55. Schwarze, M.; Stellmach, D.; Schröder, M.; Kailasam, K.; Reske, R.; Thomas, A.; Schomäcker, R. Quantification of photocatalytic hydrogen evolution. Phys. Chem. Chem. Phys. 2013, 15, 3466–3472. [Google Scholar] [CrossRef] [PubMed] [Green Version]
Figure 1. Hydrogen productivity as a function of the BET surface area for different commercial TiO2 catalysts (cTiO2 = 0.56 g L−1, 300 W Xe lamp (full spectrum), and 10 vol.% ethanol).
Catalysts 11 01027 g001
Figure 2. Hydrogen productivity with Pt@PC500 (T = 30 °C, cPt@PC500 = 0.5 g L−1) prepared by photodeposition (PD), and the colloidal approach with different reductants (AA: ascorbic acid, GS: grape seed, CL: clove, MS: mangosteen) measured with a 300 W Xe lamp (full spectrum) and ethanol (10 vol.%) as the sacrificial agent.
Catalysts 11 01027 g002
Figure 3. STEM HAADF images of prepared Pt@PC500 photocatalysts through different reducing methods: photoreduction (A,B) and microemulsion with ascorbic acid (C), clove (D), grape seed (E), and mangosteen (F).
Catalysts 11 01027 g003
Figure 4. Hydrogen productivity with PtMS@PC500 (0.37 wt% Pt, T = 30 °C, t = 2 h, 300 W Xe lamp (full spectrum), and 10 vol.% ethanol).
Catalysts 11 01027 g004
Figure 5. Degree of transmission for Pt@PC500 suspensions measured by UV/vis spectrometer (dcuvette = 1 cm).
Catalysts 11 01027 g005
Figure 6. Hydrogen productivity with PtMS@PC500 (cPt@PC500 = 0.5 g L−1, 0.37 wt.% Pt, T = 30 °C, t = 2 h, 300 W Xe lamp (full spectrum)) for different ethanol concentrations (±10%).
Catalysts 11 01027 g006
Table 1. Characteristic values of commercial TiO2 catalysts (CS: crystallite size, SA: surface area, BGE: indirect bandgap energy), and H2 productivity (cTiO2 = 0.56 g·L−1, 300 W Xe full spectrum, 10 vol% ethanol).
TiO2CS
(nm)
%AnataseBGE
(eV)
SA
(m2 g−1)
H2
(μmol g−1 h−1)
H2/SA
(μmol m−2 h−1)
P2521.3823.1956480.86
P9012.6873.201041181.13
PC10520.91003.33801231.54
PC5006.01003.2827012224.52
Table 2. Hydrogen productivity (±10%) for as-prepared Pt@PC500 photocatalysts (T = 30 °C, cPt@PC500 = 0.5 g L−1, 300 W Xe lamp (full spectrum), and 10 vol.% ethanol).
EntryMethodNominal Loading
(wt.%)
ICP-OES Loading
(wt.%)
SA
(m2 g−1)
H2
( mmol   g cat 1   h 1 )
H2
( mol   g Pt 1   h 1 )
1without Pt--2701.4-
2PD1.00.492755.01.0
3AA1.00.312393.81.2
4CL1.00.373056.91.9
5GS1.00.362475.61.5
6MS1.00.3730910.12.7
Table 3. Mean particle size (d) and deviation (σ) obtained from raw data (index: 1) and gauss fit (index: 2).
EntryMethodNPtNPs
(-)
d 1
(nm)
σ1
(nm)
d 2
(nm)
σ2
(nm)
1PD *2212.5 ± 1.310--
2AA628.8 ± 0.32.59.3 ± 0.52.6
3CL625.4 ± 0.11.15.88 ± 0.021.1
4GS624.2 ± 0.32.63.1 ± 0.60.4
5MS625.1 ± 0.32.24.81 ± 0.111.5
* Size of agglomerates.
Table 4. Overview of active compounds in reducing agents and literature examples for application of active compounds in NP synthesis.
EntryReducing AgentActive CompundActive Compound in NP Synthesis
1AAAAAg [43], Ag, Au [44], Cu [45]
2CLEugenol [46,47]Ag [46,47], Pt, Pd [48]
3GSOligomeric proanthocyanidin complexes (OCP) [49]Ag, Pd, Pt, Ru [33], Ag [43], Au [50]
4MSAlpha-mangostin [51]Ag, Au, Pt [52]
Publisher’s Note: MDPI stays neutral with regard to jurisdictional claims in published maps and institutional affiliations.

