Article

Solochrome Dark Blue Azo Dye Removal by Sonophotocatalysis Using Mn2+ Doped ZnS Quantum Dots

1
Department of Chemistry, Govt. V. Y. T. PG Autonomous College, Durg 491001, Chhattisgarh, India
2
LAQV-REQUIMTE, Department of Chemistry, NOVA School of Science and Technology, Universidade NOVA de Lisboa, 2829-516 Caparica, Portugal
3
Department of Chemistry, University of Dhaka, Dhaka 1000, Bangladesh
*
Author to whom correspondence should be addressed.
Catalysts 2021, 11(9), 1025; https://doi.org/10.3390/catal11091025
Submission received: 27 July 2021 / Revised: 20 August 2021 / Accepted: 20 August 2021 / Published: 24 August 2021

Abstract

:
This work investigates the degradation of the azo dye solochrome dark blue (SDB) by measurement of the photocatalytic, sonocatalytic and sonophotocatalytic activities, under low ultrasonic frequency (40 kHz) and UV-C (254 nm) light, using Mn-doped ZnS semiconductor quantum dots (Mn2+:ZnS Qds) as catalysts, prepared by a simple chemical precipitation procedure. In order to study the different morphological and optical crystal properties, various characterization techniques were used, such as high resolution transmission electron microscopy, scanning electron microscopy, energy dispersive X-ray analysis, X-ray diffraction, N2 adsorption-desorption at −196 °C and ultraviolet-visible spectroscopy. The average particle size of the semiconductor Qds was in the range of 3–4 nm. The optimal parameters affecting dye degradation, such as the catalyst loading, solution pH, time of irradiation, initial concentration of dye, dopant concentration, ultrasonic power and frequency effect were evaluated. The synthesized catalytic material exhibited a high activity for sonophotocatalytic degradation of SDB (89%), larger than that observed for sonocatalysis (69.7%) or photocatalysis (55.2%) alone, which was due to the improved electron-holes separation, formation of more reactive radicals and enhancement of the active surface area. Qds showed good stability and reusability after five repeated cycles. Finally, the degradation products were identified by liquid chromatography-mass spectrometry (LC-MS).

1. Introduction

From the viewpoint of environmental sustainability, textile processing and production release a huge quantity of polluted wastewaters, which enter the environment with unknown effects on health. Those wastewaters contain various synthetic dyes used in coloring of textile fabrics [1]. These textile dyes are a matter of concern, due to their high stability and low degradation capacity in wastewater treatment plants. A variety of techniques can be used for the degradation of such dyes [2].
Solochrome dark blue (SDB) is an essential azo dye used for dyeing nylon, wool, silk and other fibers. Solochrome dark blue (SDB) is mainly used as an indicator in complexometric titrations for the determination of total hardness of water due to elements such as calcium, zinc, magnesium, and to a lesser extent for other metal ions, including manganese. These metal ions readily undergo oxidation in alkaline media to form products of uncertain stoichiometry. It is a hazardous dye, and its degradation intermediates may be carcinogenic. Therefore, it is highly desirable to develop an effective method for removal of such dye pollutants from wastewater effluents, even at trace levels.
In recent years, quantum dots (Qds) gained substantial interest due to their exceptional properties [3]. Their dimension is comparable to the excitonic Bohr radius and they are well-known for their tunable size, broad absorption and narrow emission spectra, high photo-stability and strong signal intensity [4]. In recent years, much interest was shown towards semiconductor-based photocatalytic degradation of hazardous organic pollutants [5,6]. To enlarge the light absorption of these nanomaterials, modifications were made using semiconductor coupling, dye sensitization, impurity doping, and metal deposition, using coordination metal complexes, etc. [7,8]. Efforts to improve the efficiency of photocatalysis by combination with other methods were also made [9]. Among these, sonochemical oxidation was successfully applied for the degradation of several recalcitrant pollutants in water treatment methodologies [10,11]. By introducing ultrasonic waves of defined frequencies (20–1000 kHz), bubbles can be generated, followed by subsequent collapse action [12], generating very high temperatures up to ~4700 °C inside the core of bubbles [13,14], producing free radicals, such as H and HO, due to homolytic cleavage of H2O. The generated free radicals and the pyrolysis in cavitation bubbles lead to the degradation of organic compounds into a range of short-chain by-products.
In sonophotocatalysis, a photocatalyst is used, together with ultrasonic waves and UV irradiation. It is considered a useful method for enhancing the efficiency of photocatalysis, as hydrophilic components are degraded by photocatalysis and hydrophobic components by sonolysis [15]. It is also considered as a more effective procedure than photocatalysis or sonolysis alone [16,17,18,19,20]. Due to the extended processes taking place during the adsorption of pollutants on the catalyst surface, the photocatalytic efficiency is reduced, thus blocking the active sites. The use of ultrasound avoids the build-up of contaminants and intermediates formed during degradation, by cleaning the catalyst surface and generating effective radicals for degradation. Moreover, there is an improvement in the mass transportation of contaminants over the surface of the catalyst [21] and the H2O2 sonochemically produced is more stable, at low pollutant levels [22], being cleaved to HO radicals during photolysis.
A wide variety of semiconductor materials can act as photocatalysts [23,24,25]. Among these, zinc sulfide (ZnS) Qds, having a low dimension, i.e., 1–10 nm, are well known wide band gap II-VI semiconductor materials, extensively used in photocatalytic decomposition of organic dyes and water purification, due to the high photocatalytic activity, high photochemical stability, non-toxicity and low cost [26]. Moreover, zinc based Qds have no toxic elements, show higher surface area than their bulk counterparts, have wider gap energy, and are excellent hosts for the doping of a huge variety of metals [27].
Doping or using intentional impurity atoms in Qds gives rise to further discrete energy levels in the intrinsic dots controlling the behavior of materials and enhancing the energy dynamics of excitons. It is an efficient technique to tune the energy levels and surface states, in addition to tuning optical, structural, electrical, and the magnetic behavior of the semiconducting nanocrystals [28,29,30]. This leads to extensive applications of Qds to light emitting devices [31,32,33], spintronics [34,35], solar cells [36,37], bioimaging [38,39,40] and sensing [41,42]. Doping allows an efficient transfer of energy from absorbed photons to the impurity, rapidly confining the excitation by restraining unwanted reactions at the crystal surface [43]. ZnS incorporated with transition elements such as chromium, manganese, iron, nickel and copper show a positive impact on their structural, magnetic and optical property [44]. ZnS nanoparticles doped with nickel, manganese, cobalt [45,46,47], copper [45] and iron [47,48,49], can be successfully prepared by simple and efficient methods, even at room temperature.
For Qds to become useful for clinical purposes, it is essential to obtain them without toxic elements. Thus, it is necessary to reduce the cytotoxicity of Qds [50,51]. Pyridine is a very good capping agent with significant photoluminescence properties. In the present work, we used nicotinic acid, which belongs to the group of the pyridine carboxylic acids, as a capping agent. It is an organic compound and a form of vitamin B3. These Qds offer a good candidate system for evading toxic elements in traditional ones. Thus, good quality and noxious-element free aqueous Qds will generate materials able to be used for in vivo bio-applications.
The aim of this study was to prepare Mn2+:ZnS Qds and to explore their sonophotocatalytic activity in SDB degradation. The goal was to improve the efficiency of the ultrasonic-based process for low-cost degradation of organic pollutants. This combination of ultrasound with a Mn2+:ZnS Qds photocatalyst was rarely investigated. In fact, this work is the first report on sonophotocatalysis of Mn2+:ZnS Qds for SDB dye removal from wastewater. The results show that the photocatalytic activity of Qds remarkably improved with the use of ultrasound, compared to another study dealing with sonophotocatalysis, as well as the other conventional methods for the removal of SDB molecules from an aqueous solution [52,53,54,55,56,57].

2. Results and Discussion

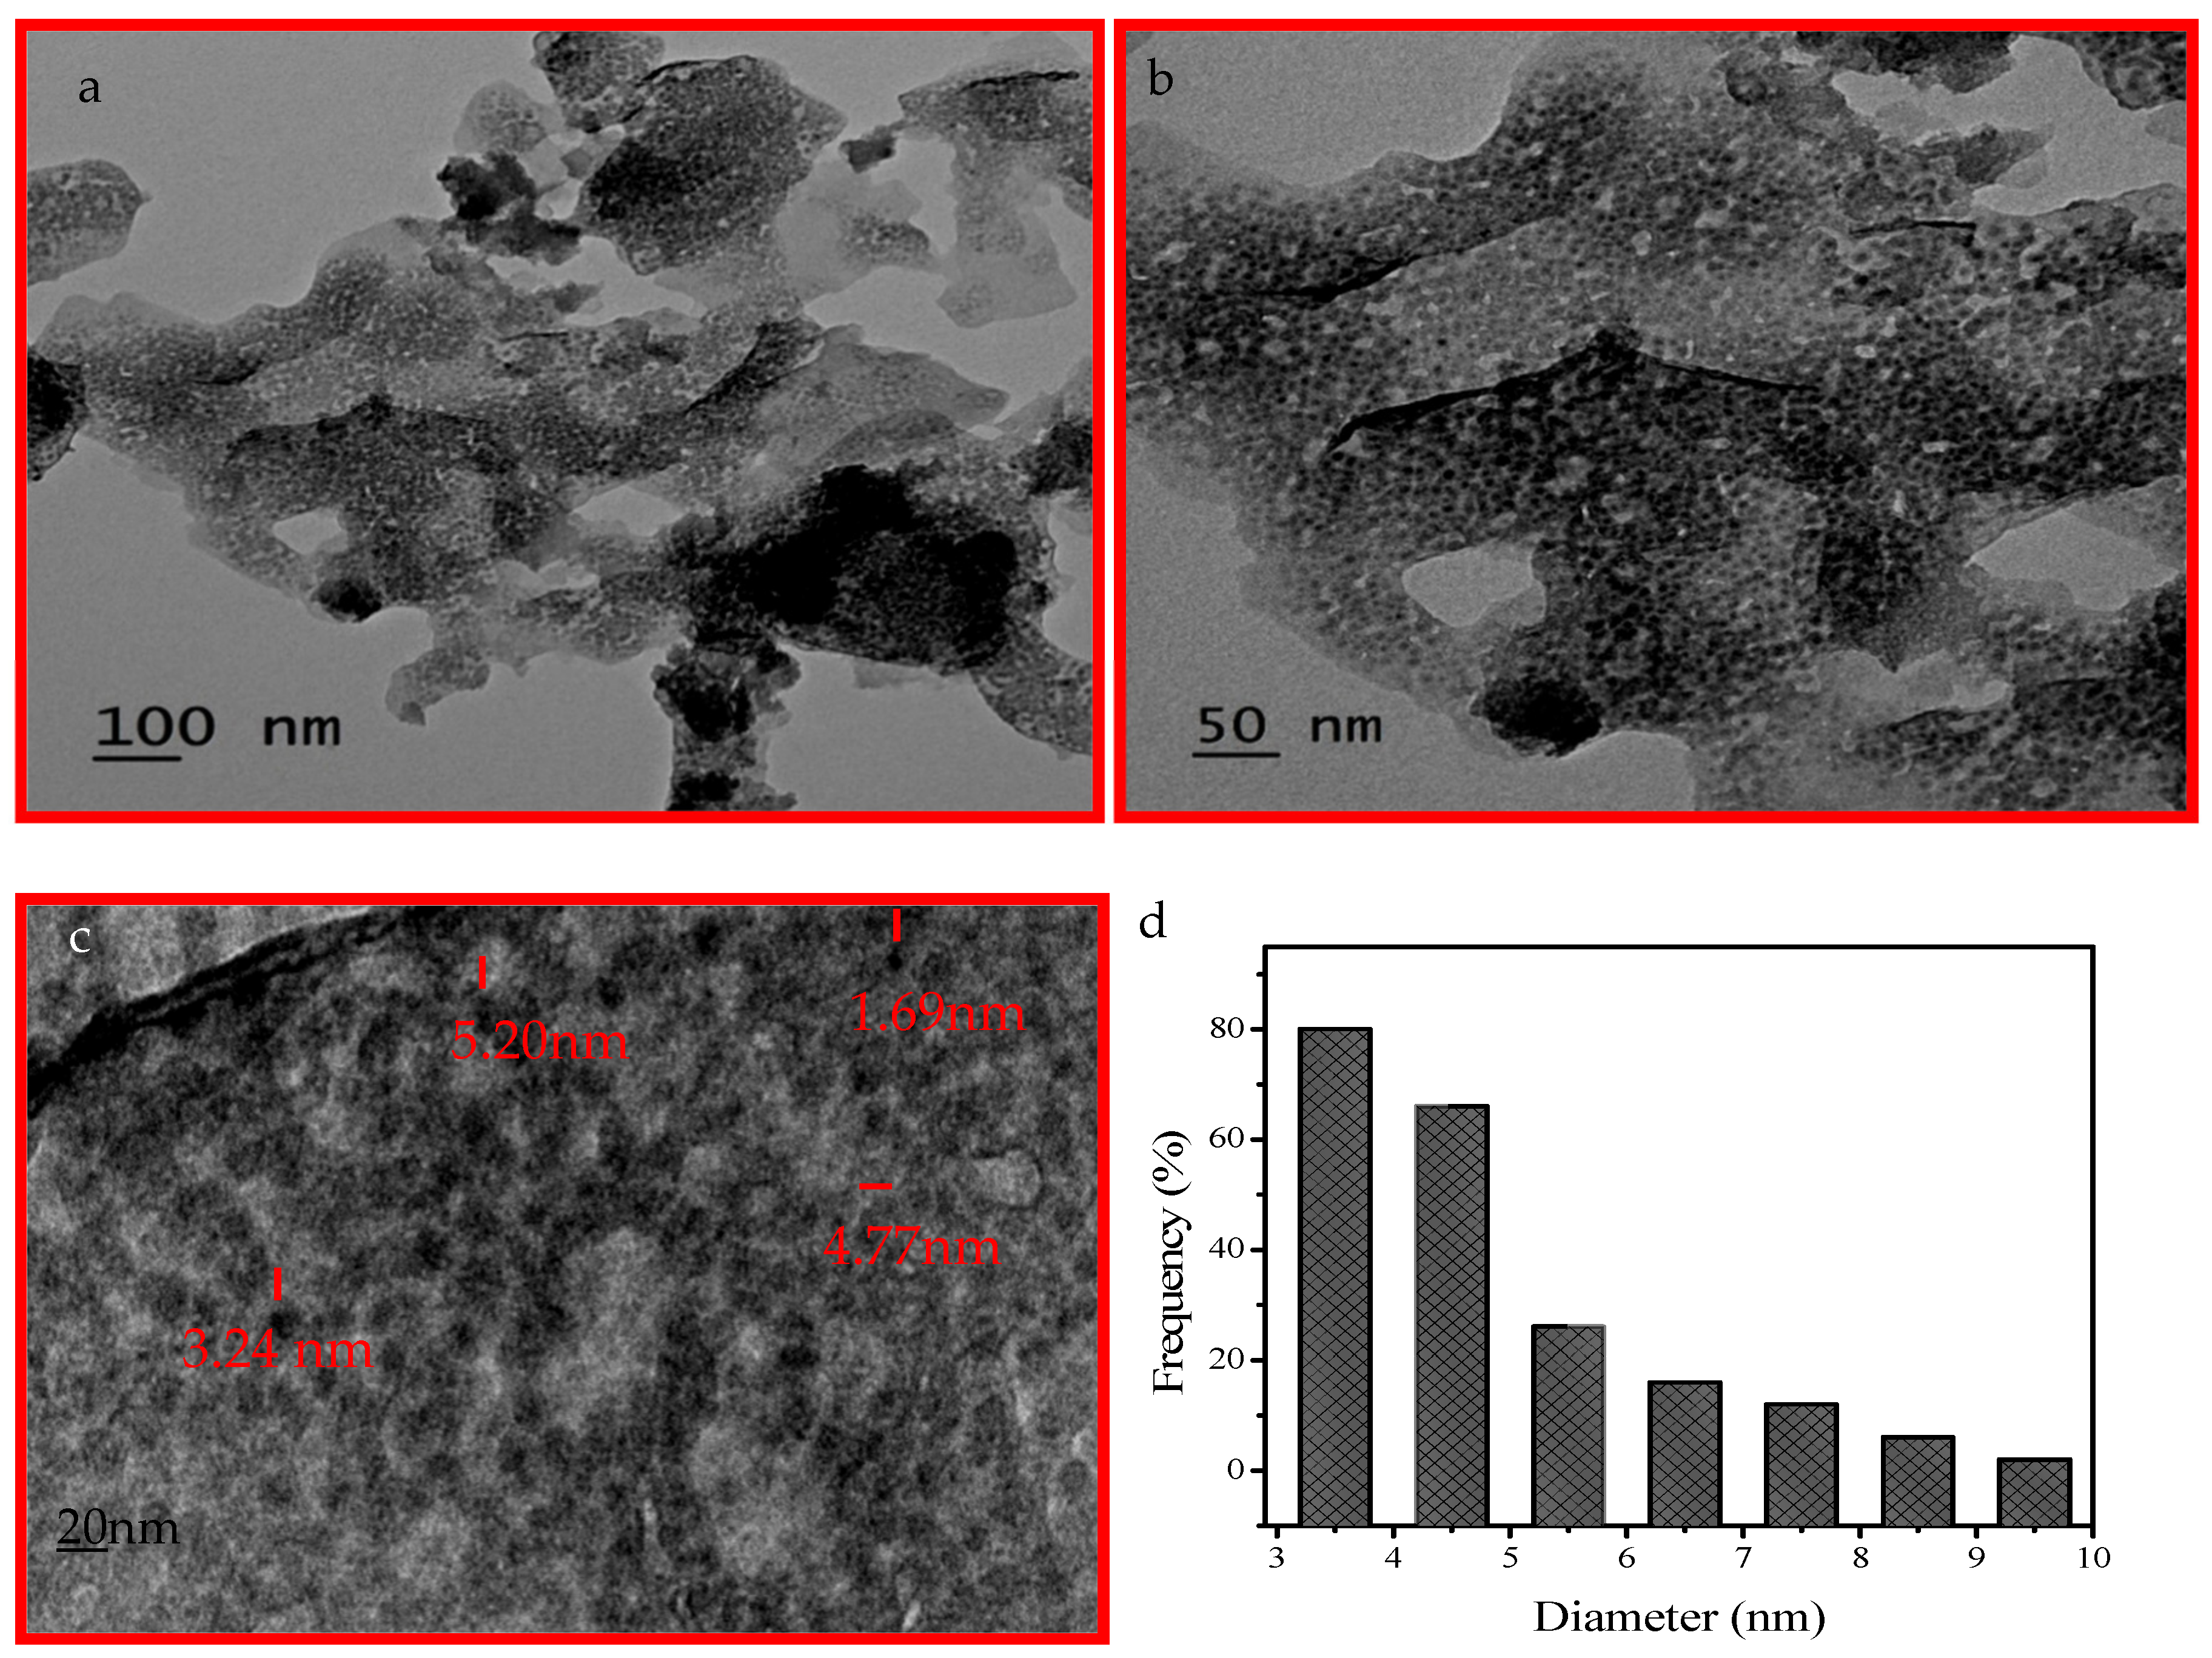
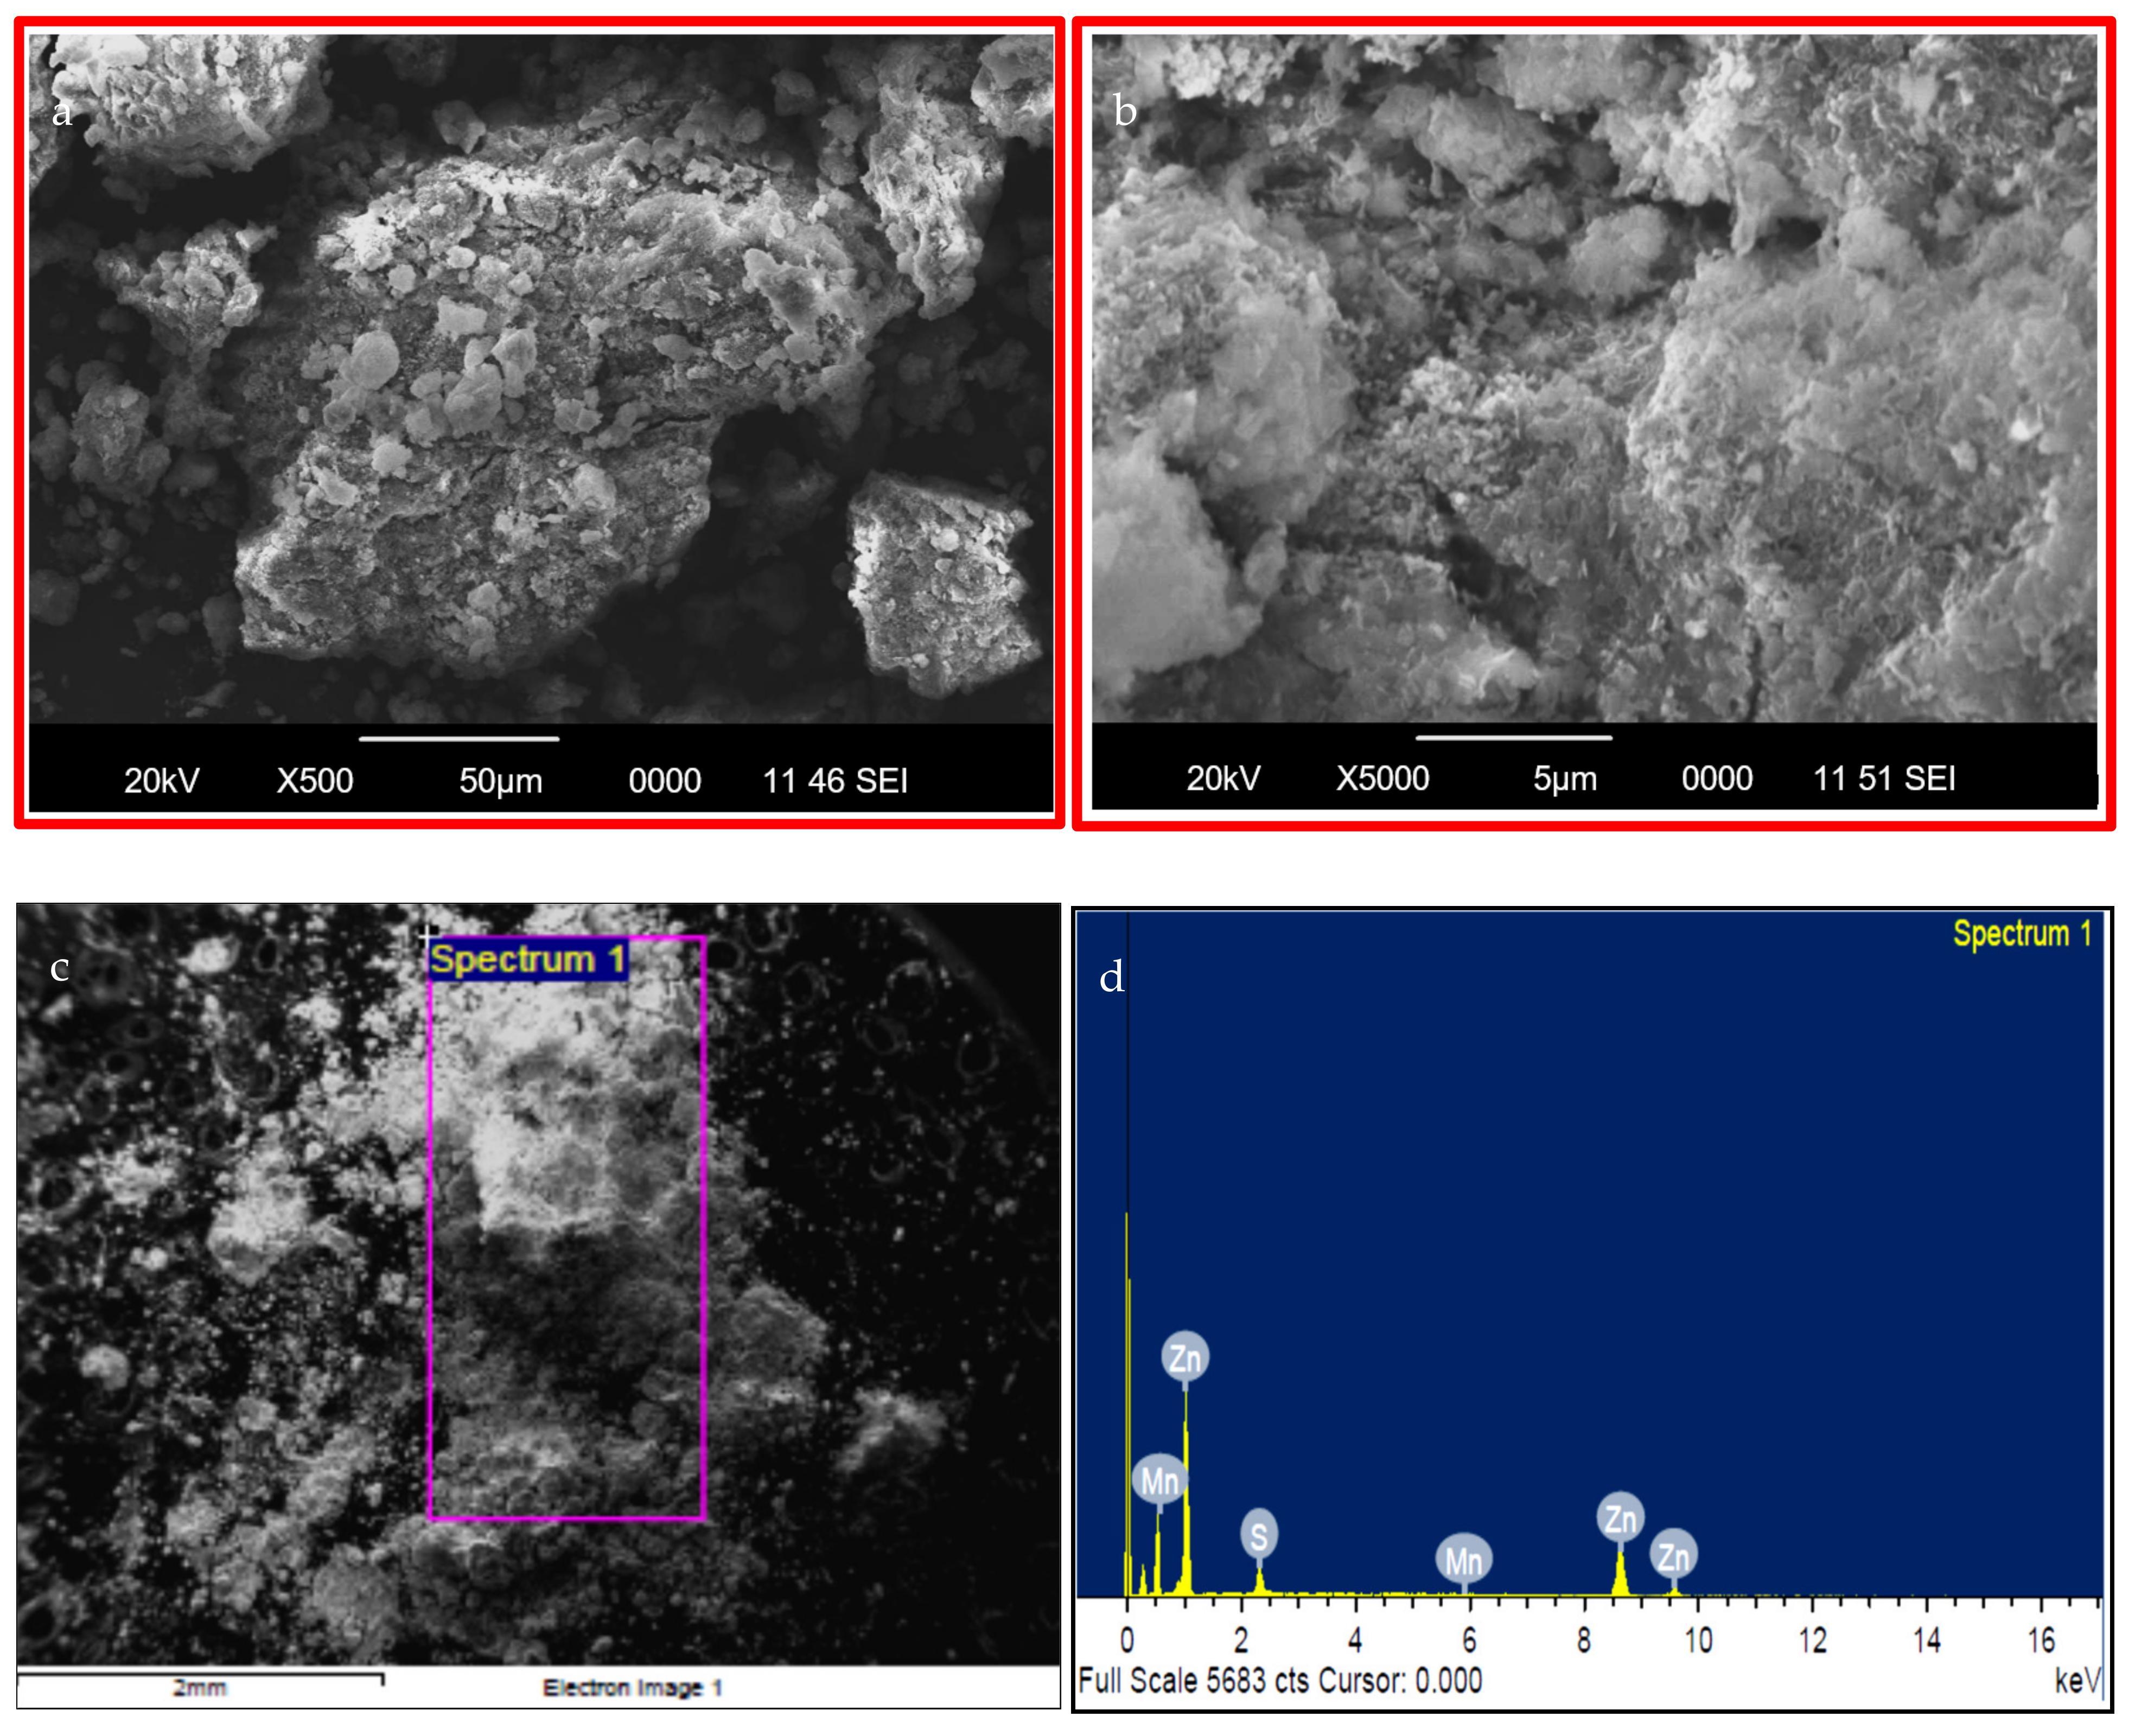
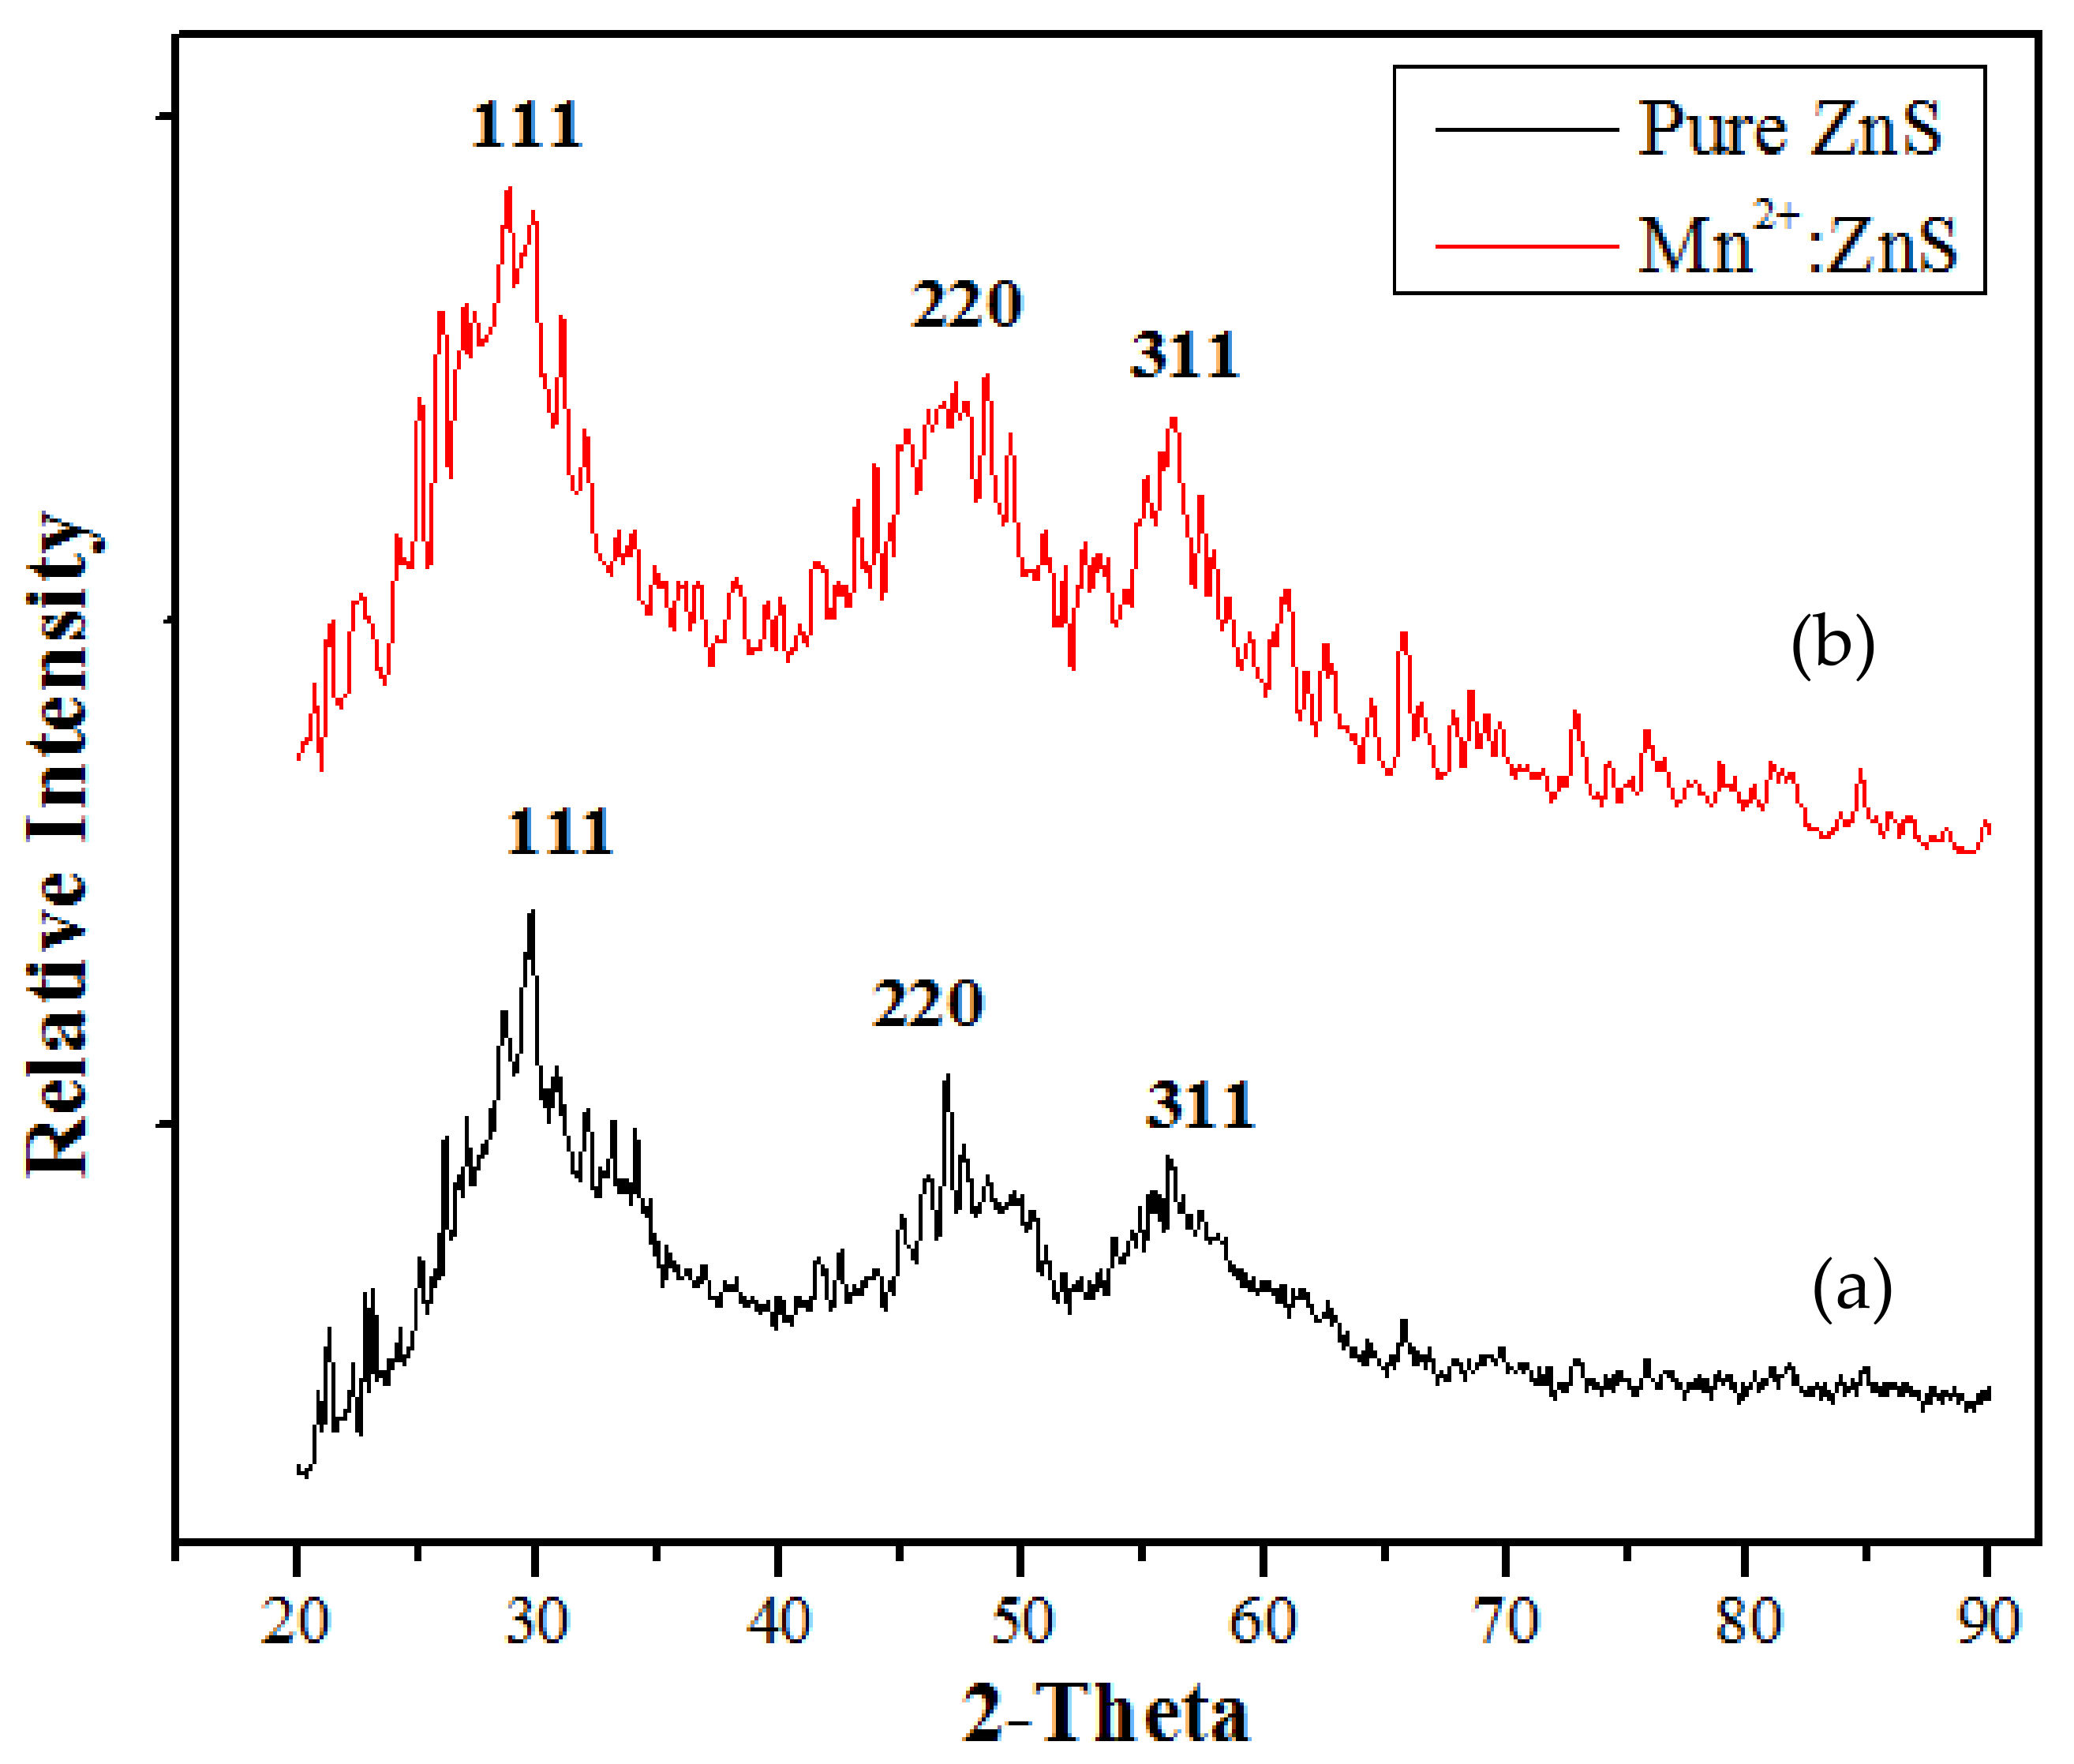
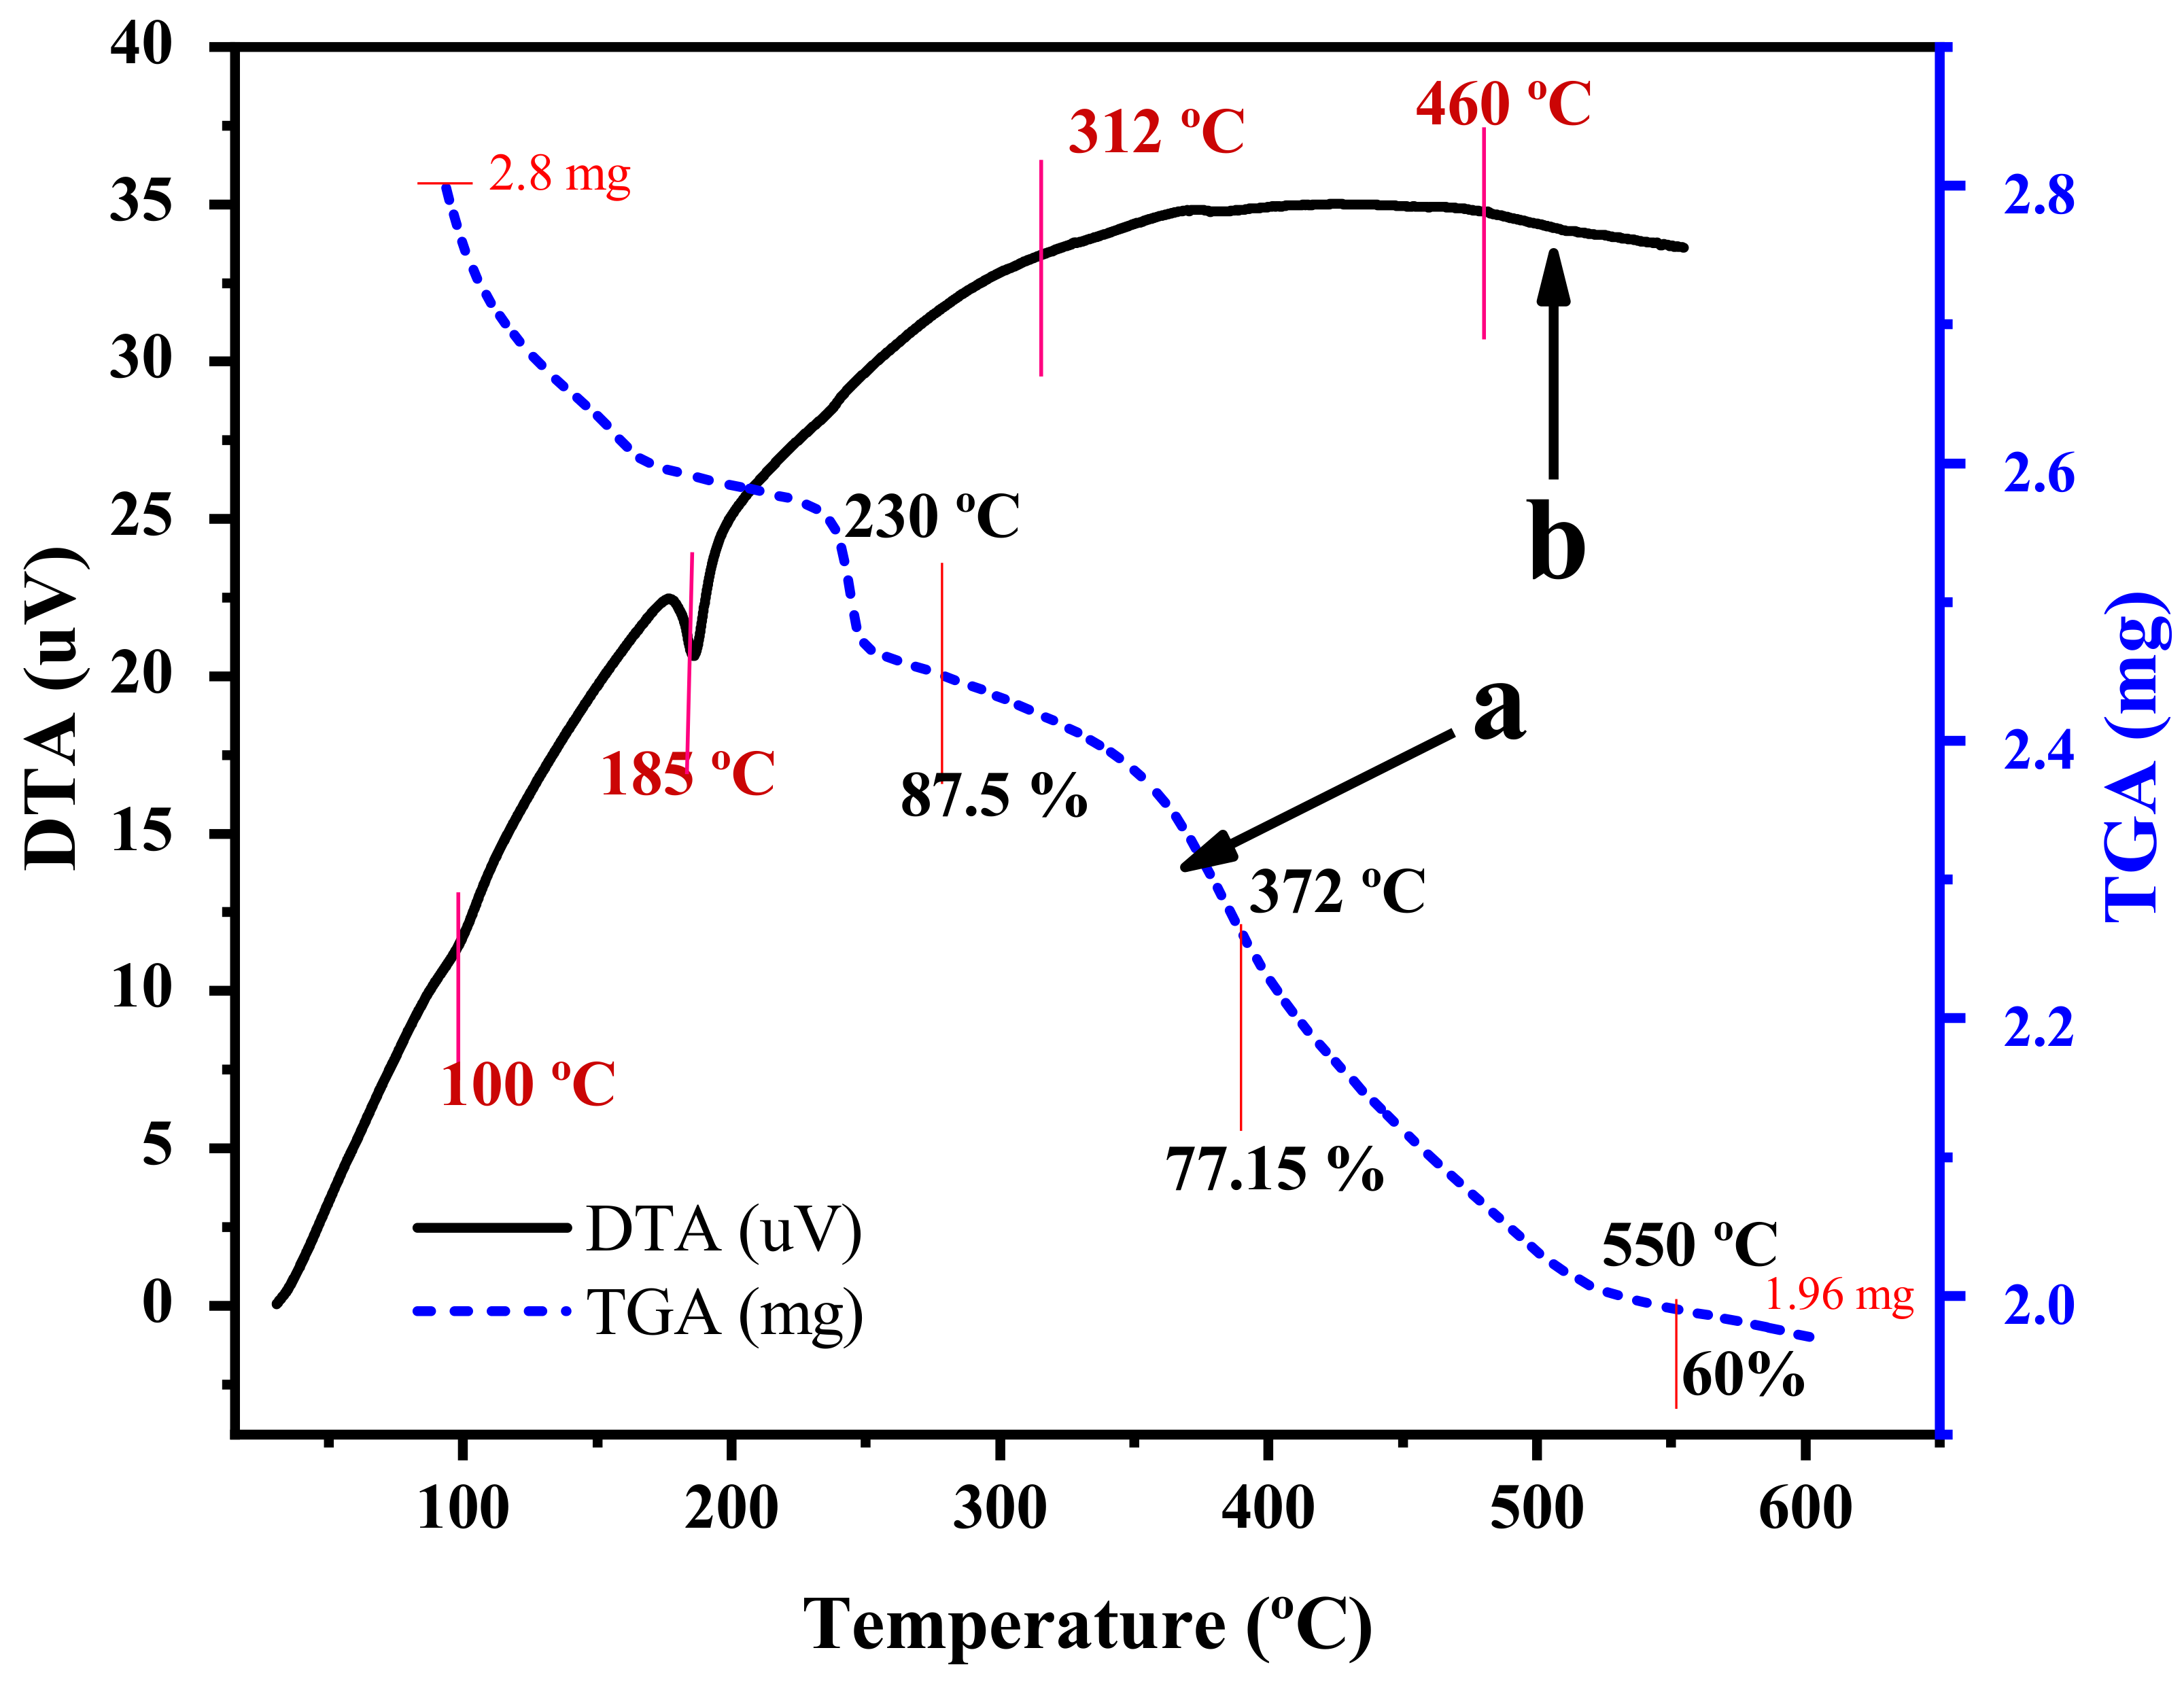
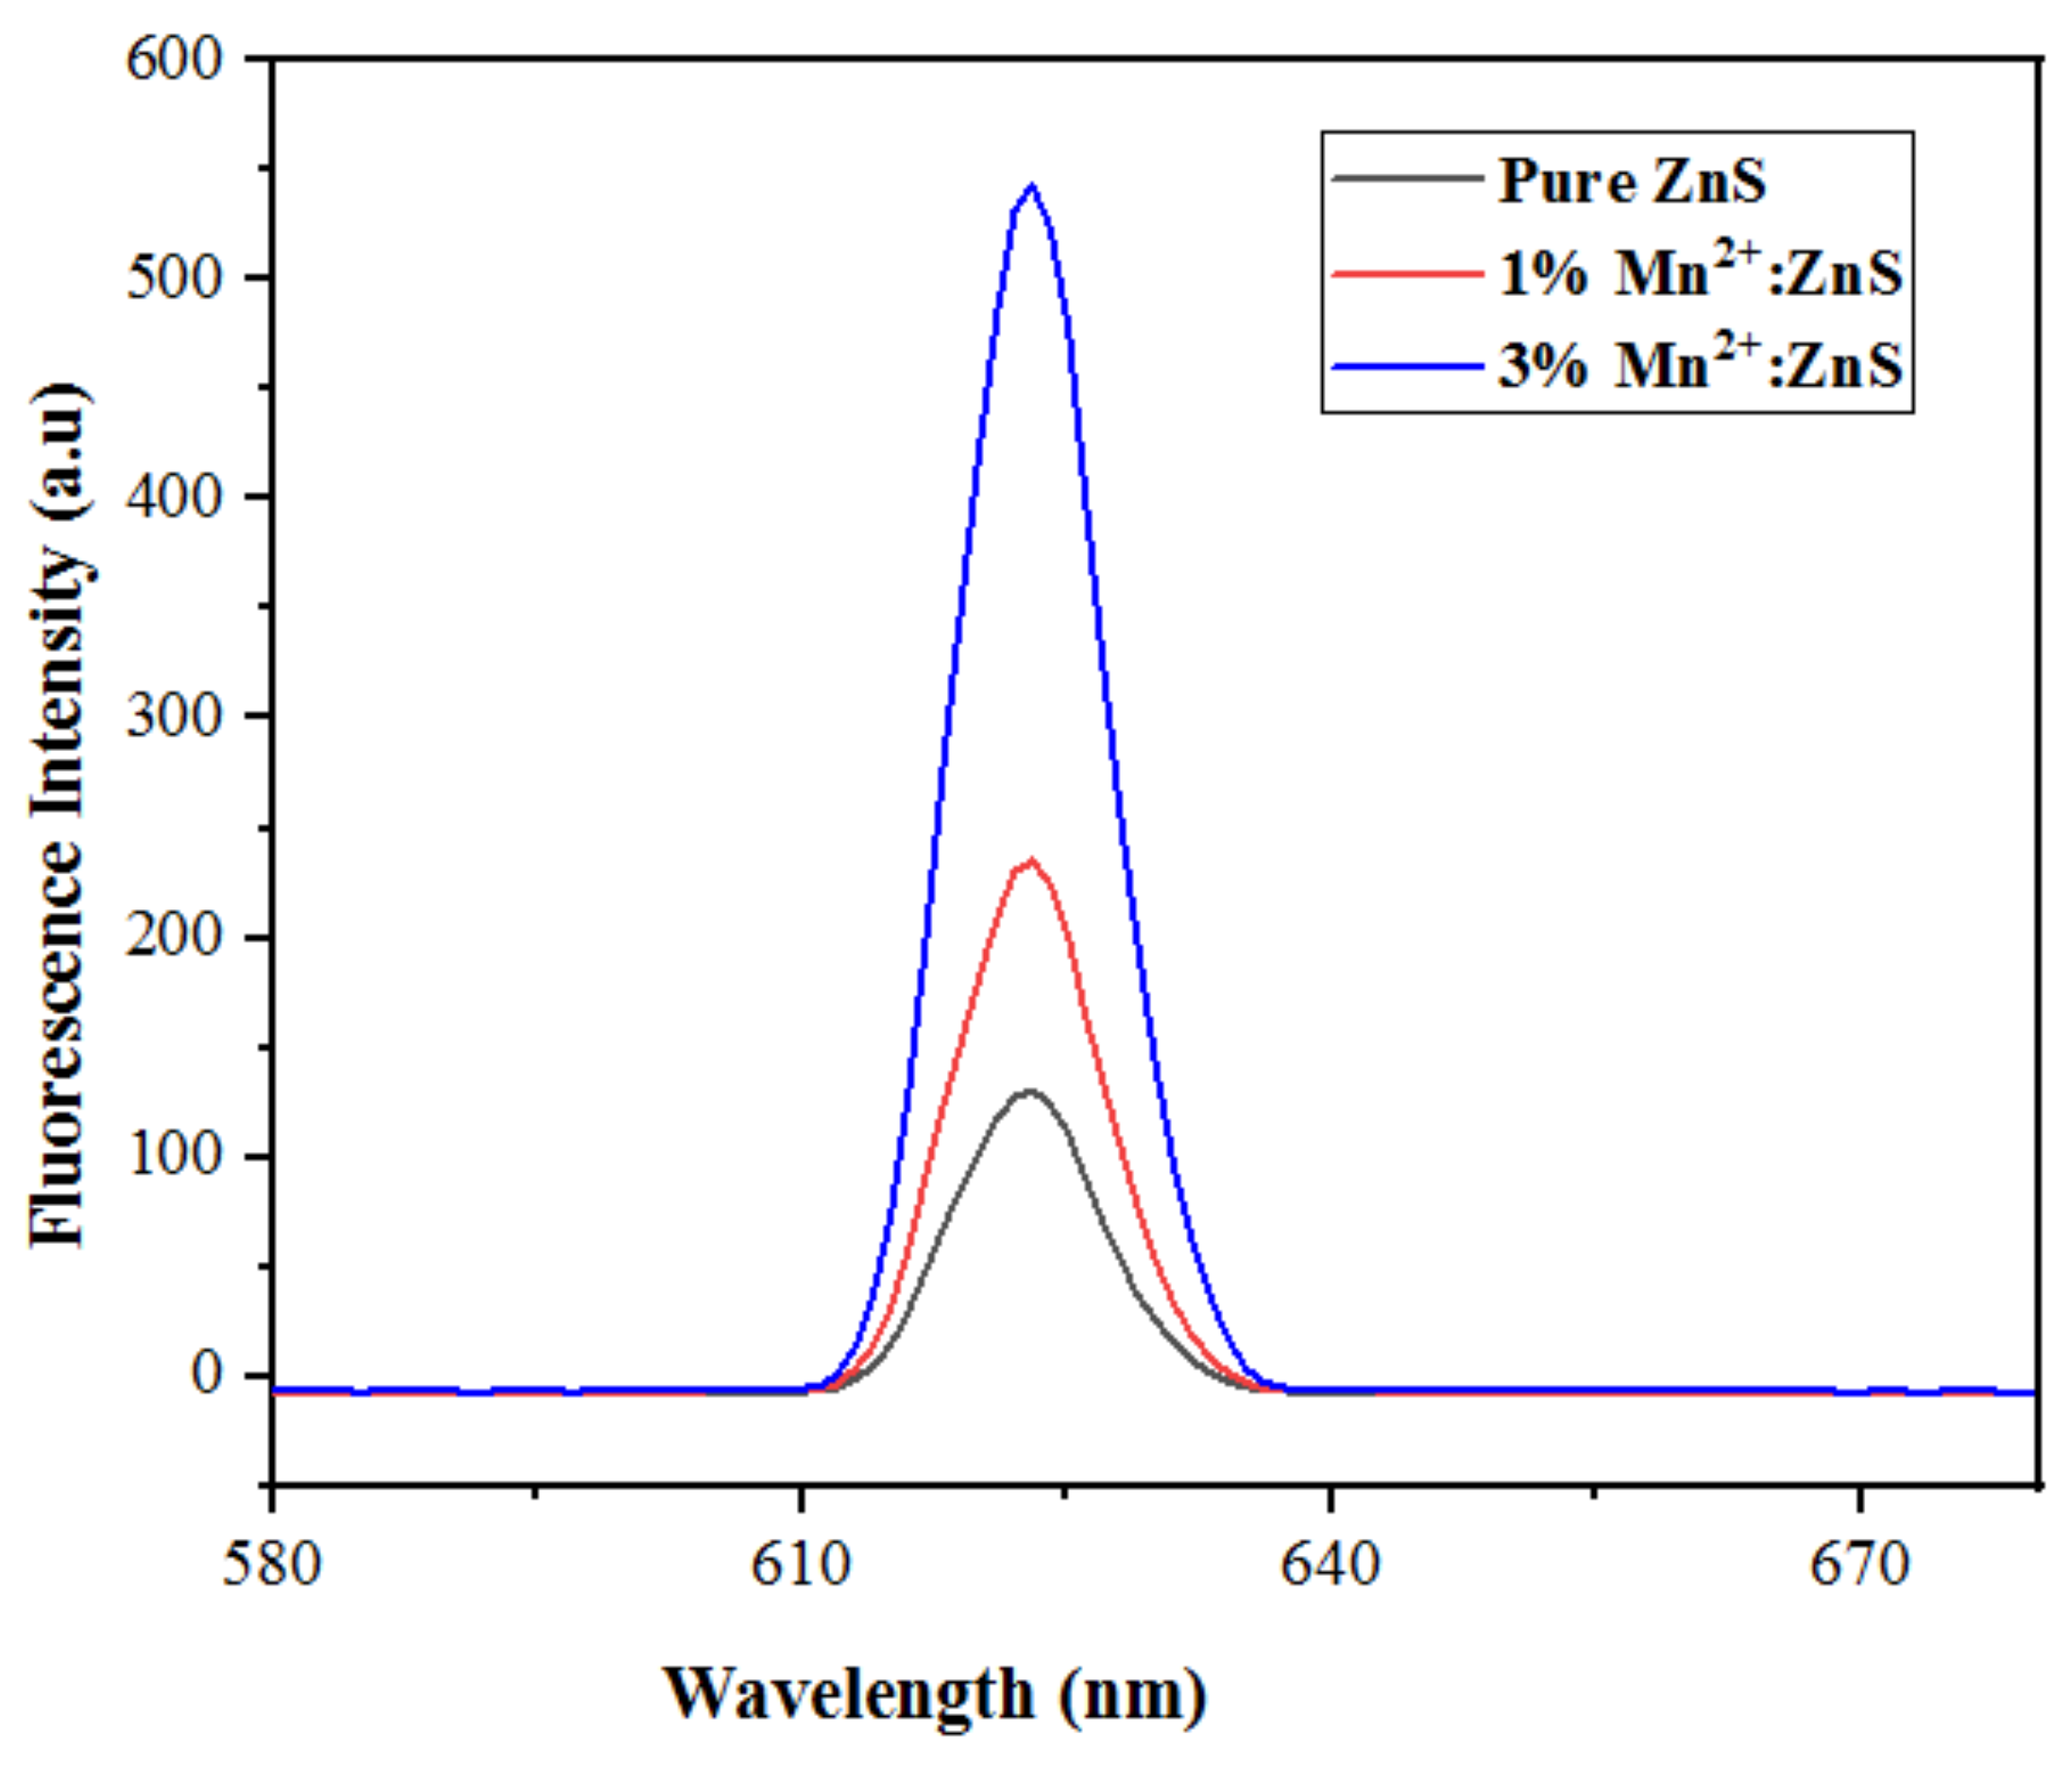
2.1. Catalyst Characterization

The pure and doped Qds were characterized by different techniques. To study the sample morphology, detailed imaging investigations were carried out. Figure 1a–c show TEM images of Mn2+:ZnS Qds. Figure 1c shows some particle sizes of the Qds sample. The micrographs reveal monodispersion of particles, with an average size of 3–4 nm (Figure 1d). Larger aggregates of small particles could also be identified.
The morphology of the Qds was also studied by SEM, as shown in Figure 2. The images illustrate the formation of agglomerated nanoparticles with a smooth surface. The morphology shows that aggregates of Qds are formed by primary units of varied orientations. Arbitrary aggregations among the small particles occur, directing the development of disordered crystallites [58]. The micrographs (Figure 2a) at lower magnification illustrate inhomogeneities about the size distribution of the crystallites. However, an image at higher magnification (Figure 2b) shows that the smaller sized particles agglomerate, originating larger ones.
The elemental composition was studied by energy dispersive X-ray analysis (EDX). Figure 2c shows the synthesized Qds and Figure 2d displays the respective EDX image of the marked area (spectrum 1). The percentages of various elements present in the material are 91.19 wt.% Zn, 8.05 wt.% S and 0.77 wt.% Mn; molar: 70.78% Zn, 28.37% S and 0.85% Mn.
A small amount of S was used for the synthesis. It is known that the presence of large amounts of S during synthesis causes accumulation of S atoms at the Qds surface. These S atoms are easily oxidized and may cause quenching of luminescence intensity [29,59]. Nevertheless, the expected molar ratio Zn:S in the catalyst should be 1:1, but the amount of Zn found is larger. It is possible that, along with ZnS, Zn(OH)2 is also formed, in alkaline conditions, as also shown by other authors [60]. We also used a small amount of Mn2+, as we found that for higher concentrations a reduction in the luminescence intensity was observed. This phenomenon is ascribed to the fact that a larger Mn2+ concentration causes a larger number of Mn2+ emission centers per nanocrystal, and the interaction between the Mn2+-Mn2+ pairs intensifies the non-radiative decay of the Mn2+ excited state, thus causing a decrease in Mn2+ emission intensity [59]. The EDX image (Figure 2d) shows the Mn2+ doped ZnS crystals. A theoretical value of 1% Mn was expected, but a smaller amount was found by EDX. It is possible that the prepared sample was not totally homogeneous and the small part analyzed contained a little less Mn than the bulk. Additionally, the prepared sample was washed with distilled water, which could also lead to some loss of Mn ions.
Ultraviolet-visible (UV-Vis) spectroscopy was used to evaluate the usefulness of the capping agent in stabilizing the growth of the Qds in aqueous solution. The UV-Vis spectra and curve of the band gap of ZnS and Mn2+:ZnS Qds are shown in Figure 3a,b. As found in Figure 3a, the absorption shoulders of the Qds are placed between 290 to 310 nm, while for bulk ZnS, a band is noted near 350 nm, having a band gap energy (Eg) value of 3.6 eV [61,62,63]. The blue shift in the absorption edge with doping is due to the decrease in the particle size. The absorption spectra are steadily blue shifted with increasing Mn content; this shift in the absorption edge can be attributed to the reduction of particle size through the doping process, which is due to the quantum confinement of the excitons, ensuing a more discrete energy spectrum of the discrete nanoparticles. Figure 3b shows the band gap energy curve of pure ZnS and Mn2+:ZnS QDs calculated from the Tauc’s relation [63], as: αhυ = αo (hυ-Eg)1/2; where hυ is photon energy, Eg is optical bandgap of the nanoparticles, and αo, a constant. The Eg values for pure and Mn2+:ZnS Qds samples were found between 3.87 and 3.96 eV. The increment in the Eg value along with the shifting of the curve may be due to the decrease in the nanoparticle size, attributed to the quantum size confinement effect [61,64]. Thus, transformations in the optical and electronic properties of nanoparticles occur when their dimensions are reduced below threshold values.
The shift in the band gap can be explained by the effective mass approximation model with the particle in a box approach. Based on the first order approximation of Brus equation, the relationship between the particle radius (r) and band gap (Eg) in ZnS nanocrystal [59,65,66,67] is given by:
r E g = 0.32 2.9 E g 3.49 2 3.50 E g
Using Equation (1), the size of the pure and doped ZnS nanocrystal (considering Eg = 3.87–3.96 eV) was calculated to be 3.62–3.96 nm, which is in agreement with the size obtained from TEM measurements.
The crystal structure and phase composition of the pure ZnS and Mn2+:ZnS Qds were also studied by XRD, as shown in Figure 4. Crystalline Qds were obtained. The peaks at 29.7°, 48.4° and 56.16° for Mn2+:ZnS Qds correspond to the (111), (220), and (311) crystallographic planes of cubic crystalline ZnS, respectively [27,68,69,70]. The dopants are well inserted in the ZnS structure and Mn2+ ions did not alter the phase [27,70,71]. A slight shift for the peak corresponding to the 220 plane is observed, which indicates the inclusion of Mn in the crystal lattice. The average size was calculated by the Debye Scherrer equation using the full width at half maximum of the XRD peaks. The average crystallite size for pure ZnS and Mn2+:ZnS Qds were found to be 1.32 and 1.13 nm, respectively.
Figure 5 shows the FTIR scan of Mn2+:ZnS Qds. Several features can be found in the range of 500–4000 cm−1, characteristic of various functional groups [5,71]. The absorption peaks above 3000 cm−1 are due to the Ar-H or =C-H stretching. The bands between 1600–1200 cm−1 are ascribed to the ring stretching vibrations [5,72]. The broad band at 3335.4 cm−1 is attributed to the O-H stretching, whereas the band at 930.4 cm−1 is due to the O-H out of plane bending. The peaks between 1630–1540 cm−1 and around 1410 cm−1 are due to the C=C stretching, while the peaks between 1330–1240 cm−1 are ascribed to C=N stretching. This may be attributed to the coordinate bond formed between Zn2+ ions and the N atoms of the pyridine moiety in nicotinic acid [73,74]. Thus, the FTIR study strongly supports the formation of nicotinic acid capped Mn2+:ZnS Qds. The band at 1036 cm−1 is attributed to the Zn-OH vibrations [60]. As explained above, the formation of Zn(OH)2 is possible under alkaline conditions, as reported by other authors [60].
For determining the specific surface area and pore size distribution of solid and porous materials, gas adsorption is a prevailing analysis technique. BJH calculation is a pore size distribution determination method, typically applied to N2 adsorption data. Evaluation of the adsorption and desorption isotherm branches reveals information about the pore volume and pores size distribution. BET is mainly used for the surface area analysis of the prepared nanomaterials. The surface area can be calculated from the quantity of gas required to form a monolayer. In order to confirm the porous structure of Qds, N2 adsorption–desorption experiments were performed at −196 °C. Figure S1a shows a type IV adsorption–desorption isotherm with a hysteresis loop, while Figure S1b displays distribution of the pore size. The pores are likely to show a very narrow slit or bottle shaped configuration or a distribution of randomly-shaped micro and mesopores. The Qds surface area value was 10 m2/g, determined using the BET equation. The pores have an average diameter of 1.5 nm (determined by the BJH adsorption procedure), whereas the total pore volume was 0.01 cm3/g.
Thermal analysis was carried out for studying the disintegration, strength and temperatures of phase development of the nanoparticles. To determine the thermal activity of the prepared materials, differential thermal analysis (DTA) and thermogravimetric analysis (TGA) were performed under N2 atmosphere, as shown in Figure 6a,b. The data were recorded with a heating rate of 10 °C/min, up to 650 °C. Owing to the loss of absorbed water, the endothermic peak occurred near 185 °C. Different steps of weight loss are noted in the TGA plot. The initial weight loss shown by the sample up to 230 °C (12.5%) is connected to the water molecules physically adsorbed at the surface. The next peak, located at 240–370 °C (10.35%), is correlated to the disintegration of organic moieties from the precursors. The next loss of weight (11.43%) is due to the discharge of Mn ions from the sample. Further decrease (5.72%) is attributed to the loss of the S ions, as also reported by other authors [75,76,77]. Figure 6a indicates that the thermal study started at about 2.8 mg sample weight, which after heating to 600 °C remained at a weight of 1.96 mg. Thus, the sample loses 40% of its weight up to 700 °C. Figure 6b shows an exothermic progression up to about 460 °C, which may possibly be attributed to a shift in phase or crystallinity of the sample.
The fluorescence spectra of pure ZnS QDs and Mn:ZnS QDs (doped with various concentrations) were measured, using 320 nm as the excitation wavelength optimal for the ZnS QDs [59]. The integrated fluorescence intensities of the emission peak versus absorbances are plotted in Figure 7. With the increase in Mn2+ concentration from 0 to 3%, the florescence intensity of Mn2+ (4T1-6A1) is found to increase steadily.

2.2. Efficiencies of Various Methods for SDB Degradation

Various types of nanostructures [46,47,78,79,80,81,82,83,84,85], carbon nanotubes [54], nanocubes [55], semiconductors [56], microorganisms [86,87], electric discharge methods [88], as well as conventional sorbents [57,89,90,91] have been utilized for the removal of SDB dye molecules from aqueous solutions. These findings are summarized in Table 1, together with our data. When comparing the contact time for degradation, and the initial concentration of dye and dosage of catalyst, the results indicate that the results obtained with Mn2+:ZnS Qds and sonophotocatalysis are better than those reported in other works for different nanostructures and adsorbents, as shown in Table 1.
The efficiency of the Qds catalyst, UV irradiation and ultrasonication in the SDB degradation process was studied by performing some preliminary tests. A very small dye removal rate was observed with photolysis (4%), sonolysis (5%) and ultrasound with UV (7%) without any catalysts after 75 min as shown in Figure S2. For the sonophotocatalytic experiments, the Qds solution was stirred in the dark for 20 min, to reach the adsorption–desorption equilibrium in the presence of catalysts with different Mn doping concentrations.
With UV light and Qds catalyst, the degradation was higher (47%) compared to the sole photolysis. An improvement in the photodegradation rate was found up to 3% doping with Mn and a maximum degradation of 55.2% was accomplished within 75 min of irradiation. As shown in Figure 8, the photocatalytic activity of Mn2+:ZnS Qds was larger than that of pure ZnS. The photocatalytic absorption under UV light increased from 0 to 3% doping as the energy-gap of Qds increased due to a decrease of the particle sizes (from 1.32 to 1.13 nm, for pure ZnS and Mn2+:ZnS Qds, respectively, as confirmed by XRD).
During sonocatalytic degradation of pollutants, the ultrasonic frequency is a significant factor which greatly influences size and duration of cavitation bubbles, affecting the production of HO [92]. Sonication produces a kind of turbulence causing a mass transfer from the solution to the surface of the catalyst [93].
The SDB degradation in aqueous solutions was investigated at two different frequencies (40 and 80 kHz). Figure 9 shows the decline in SDB concentration with irradiation time. The degradation efficiency is directly related to the H2O2 generation, depending on the applied ultrasound frequencies [94]. From Figure 9, it was found that the differences in the degradation rates at two different frequencies were minor; still, the decrease in SDB concentration was larger at 40 kHz (62.9%) compared to 80 kHz (53%) due to the higher production of H2O2, which caused more HO generation, leading to more degradation at this frequency [95]. Thus, 40 kHz was chosen for further study.
With ultrasound and catalyst, the degradation obtained was 62.3%, which was higher, compared to sonolysis. The SDB removal rate increased with Mn concentration, accomplishing maximum degradation of 69.7%, after 75 min of ultrasonication. Figure 10a,b show the higher sonocatalytic removal rate of Mn2+:ZnS Qds compared to that of pure ZnS.
To enhance the degradation efficiency of the system, UV radiation assisted photocatalysis was coupled with ultrasound; with the combined process, sonophotocatalysis significantly enhanced the degradation rate of the system. The UV light source enhanced the process of photoexcitation, consequently after 60 min ultrasonicating, 80% degradation occurred in the presence of UV light. On further irradiation, 89% degradation was achieved after 75 min, as shown in Figure 10c,d. Thus, the sonophotocatalysis experiments established the semiconducting Mn2+:ZnS Qds to be a prominent sonophotocatalyst for the degradation of SDB through the combined effect of ultrasound and UV light. Therefore, it was used for further studies.

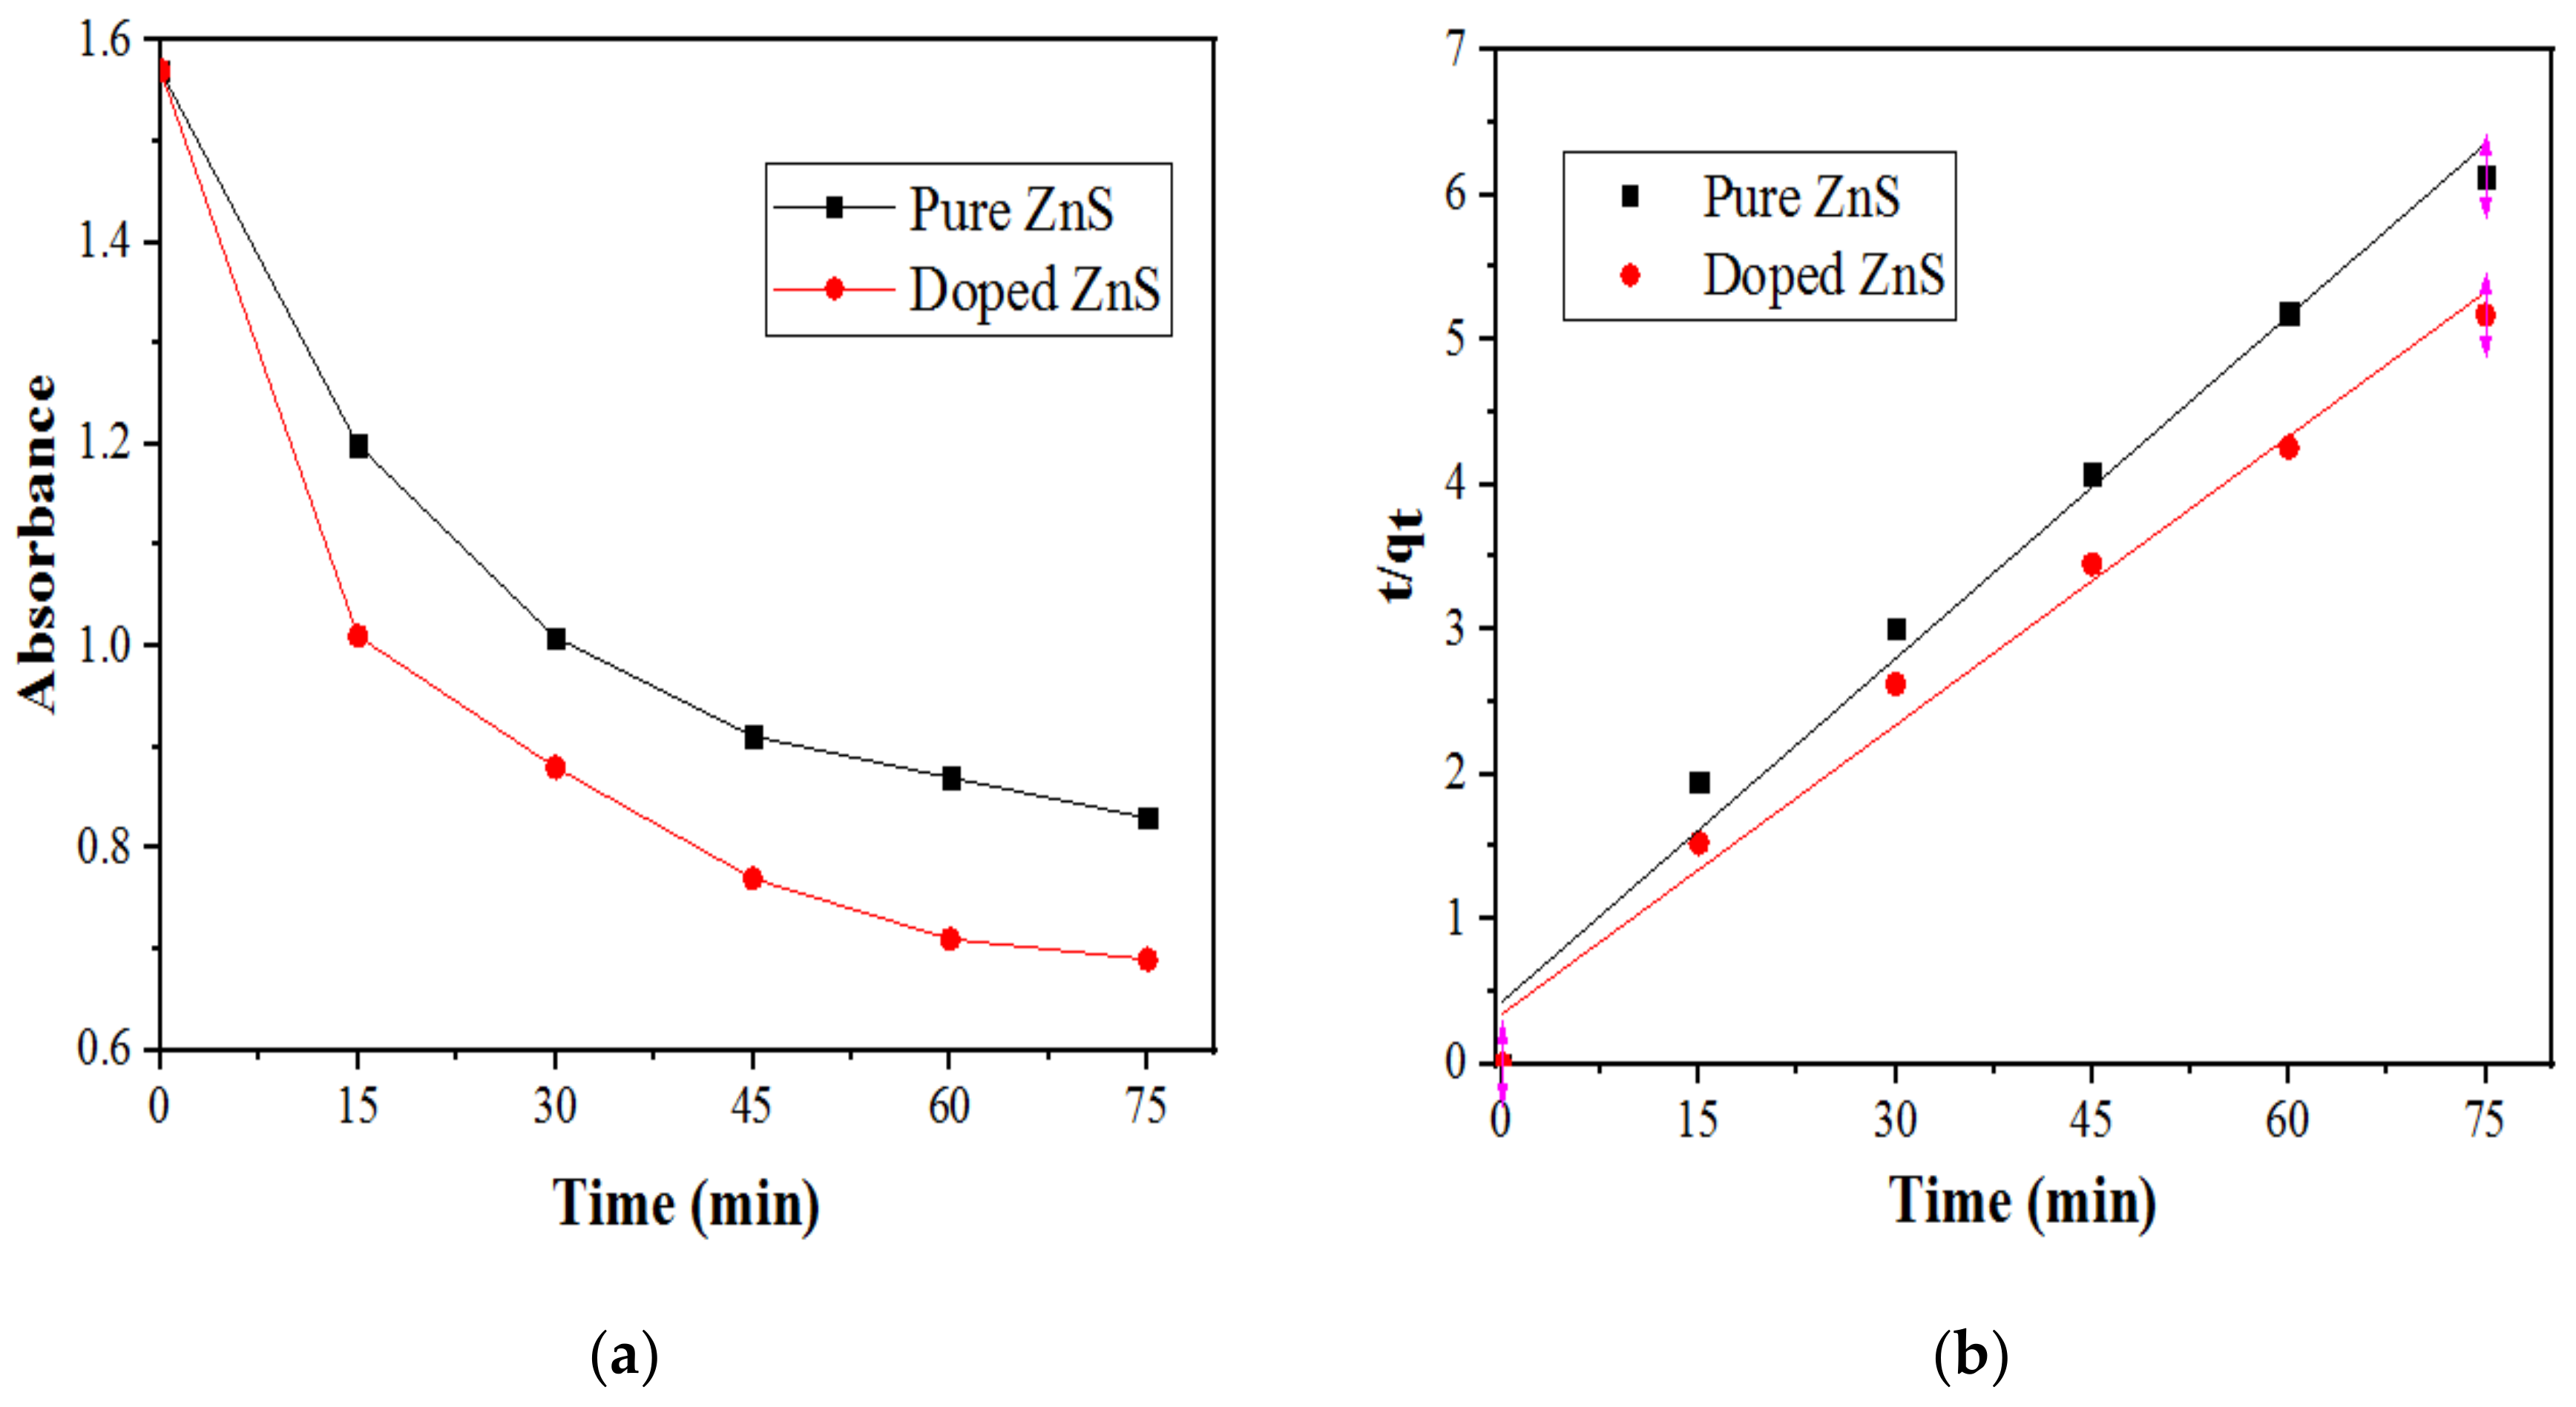
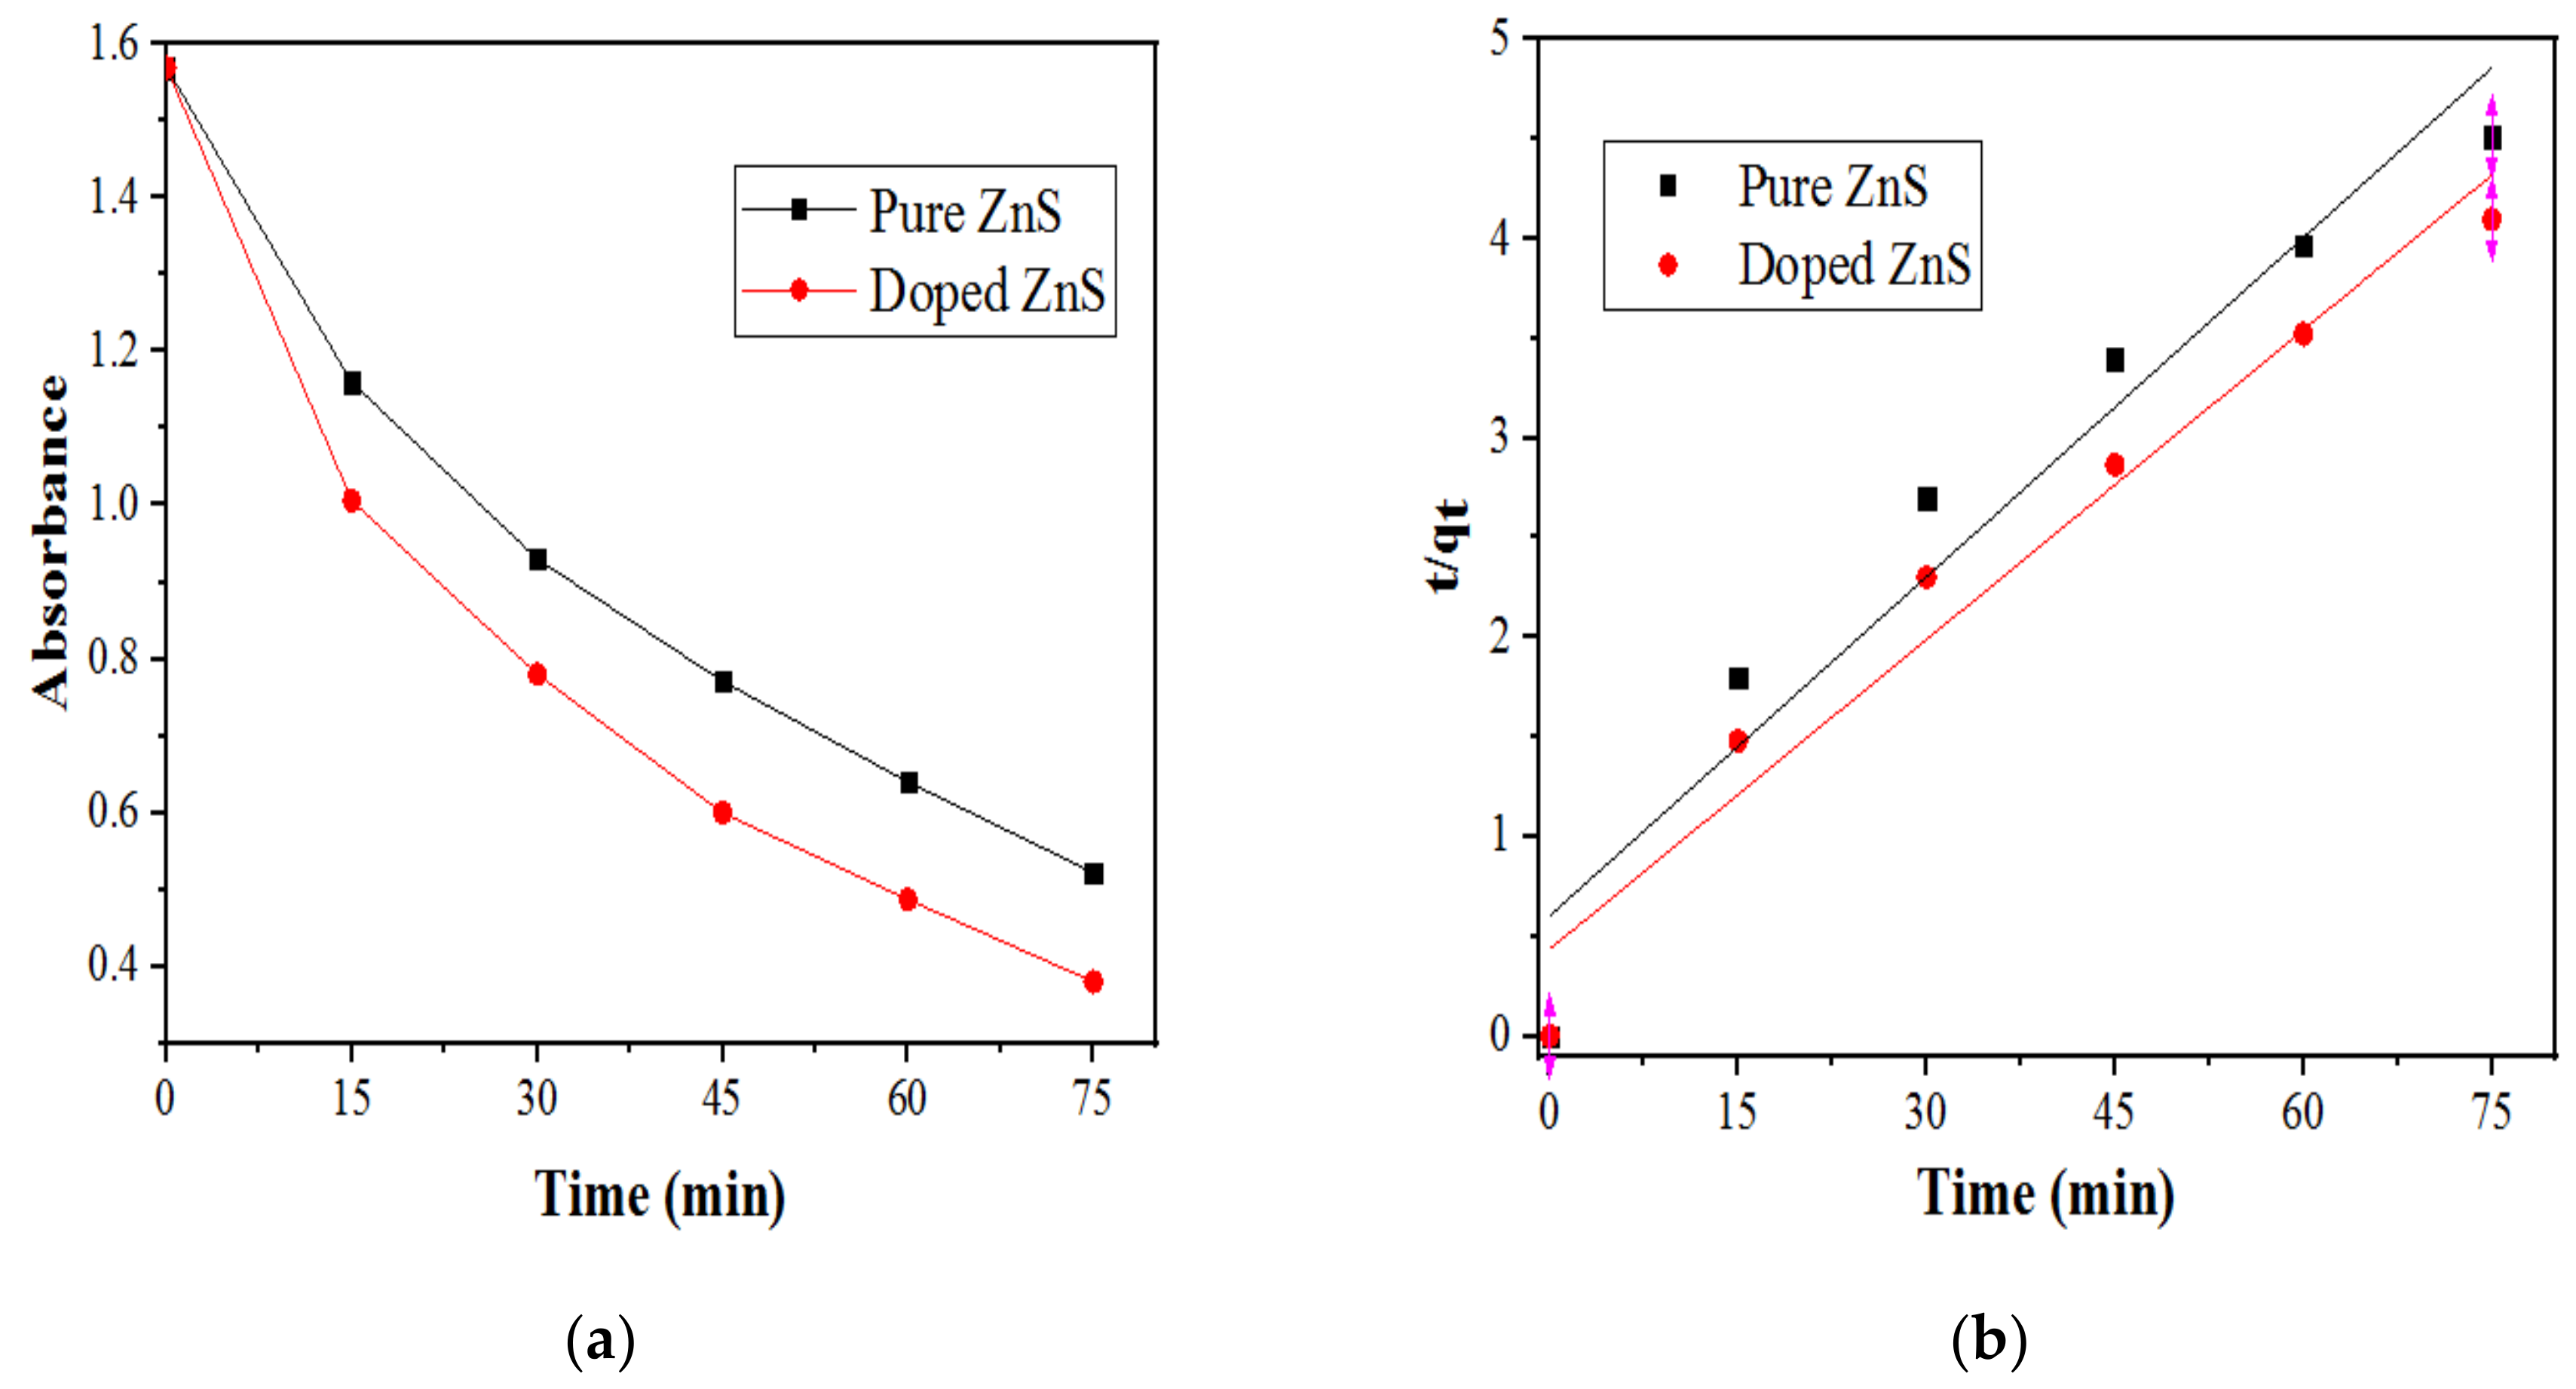
2.2.1. Kinetic Study

Kinetics can provide information about the efficiency and mechanism of a photocatalytic process. These experiments were performed at optimum experimental conditions for the SDB dye solution. The pseudo second order kinetic model given in Equation (2) [27,61] was relevant, applying a linear fitting of qt versus t, where k is the rate constant (g mg−1 min−1), and qe and qt are the equilibrium adsorption capacity and adsorption capacity at time t, respectively [96].
t / q t = 1 / ( k   q e 2 ) +   t / q e
The SDB degradation rates under sonophotocatalysis, sonocatalysis and photocatalysis were calculated from the slopes of Figure 11a plots. Figure 11b shows UV–Vis absorption spectra of the SDB suspension under sonophotocatalytic conditions, with Mn2+:ZnS Qds nanocatalyst, for 75 min. As the time for sonophotocatalysis progresses, the absorption band steadily decreased, showing the decomposition of the SDB chromophoric structure. The values of R2 indicate that pseudo second order model fits the experimental data. The values for the kinetic data, rate constants (k), correlation coefficients (R2) and decolorization efficiency (DE) for pure and Mn2+:ZnS Qds under different conditions of sono and/or photocatalysis are depicted in Table S1.

2.2.2. Effect of the Initial SDB Concentration

The influence of the initial SDB concentration was investigated with four different concentrations (30, 50, 70 and 90 ppm) as shown in Figure 12. The amount of dye degraded diminishes with an increase in SDB concentration, displaying a higher degradation rate for a low initial concentration. As the initial SDB concentration increases, the degradation rate also decreases, as more SDB molecules are adsorbed on the surface of Qds, but degradation is not successful. Since intensity and catalyst dose are constant, higher SDB concentration results in a smaller light penetration depth. Additionally, a maximum number of active sites may be available at that concentration. On further increasing the concentration, the active sites present get blocked-up, thus the dye degradation rate decreases [27,31].

2.2.3. Effect of Catalyst Loading

The reactions were carried out by varying the quantity of catalyst (ranging from 10 to 50 mgs). The decomposition of SDB increased from 68% to 89% with the increase in the quantity of the nanocatalysts from 10 to 40 mg/15 mL and dropped to 87% for 50 mg catalyst loading. The initial enhancement in SDB decolorization might be due to an excess availability of active sites, as the amount of catalyst increases [97]. However, a further increase in the catalyst amount leads to an increase in the turbidity and reduces the light penetration depth, thus, the quantity of the photoactive suspension decreases [98,99]. Figure 13 shows that the nanocatalysts amount of 40 mg/15 mL is optimum for maximal SDB removal. Therefore, the remaining experiments were carried out with 40 mg of catalyst loading.

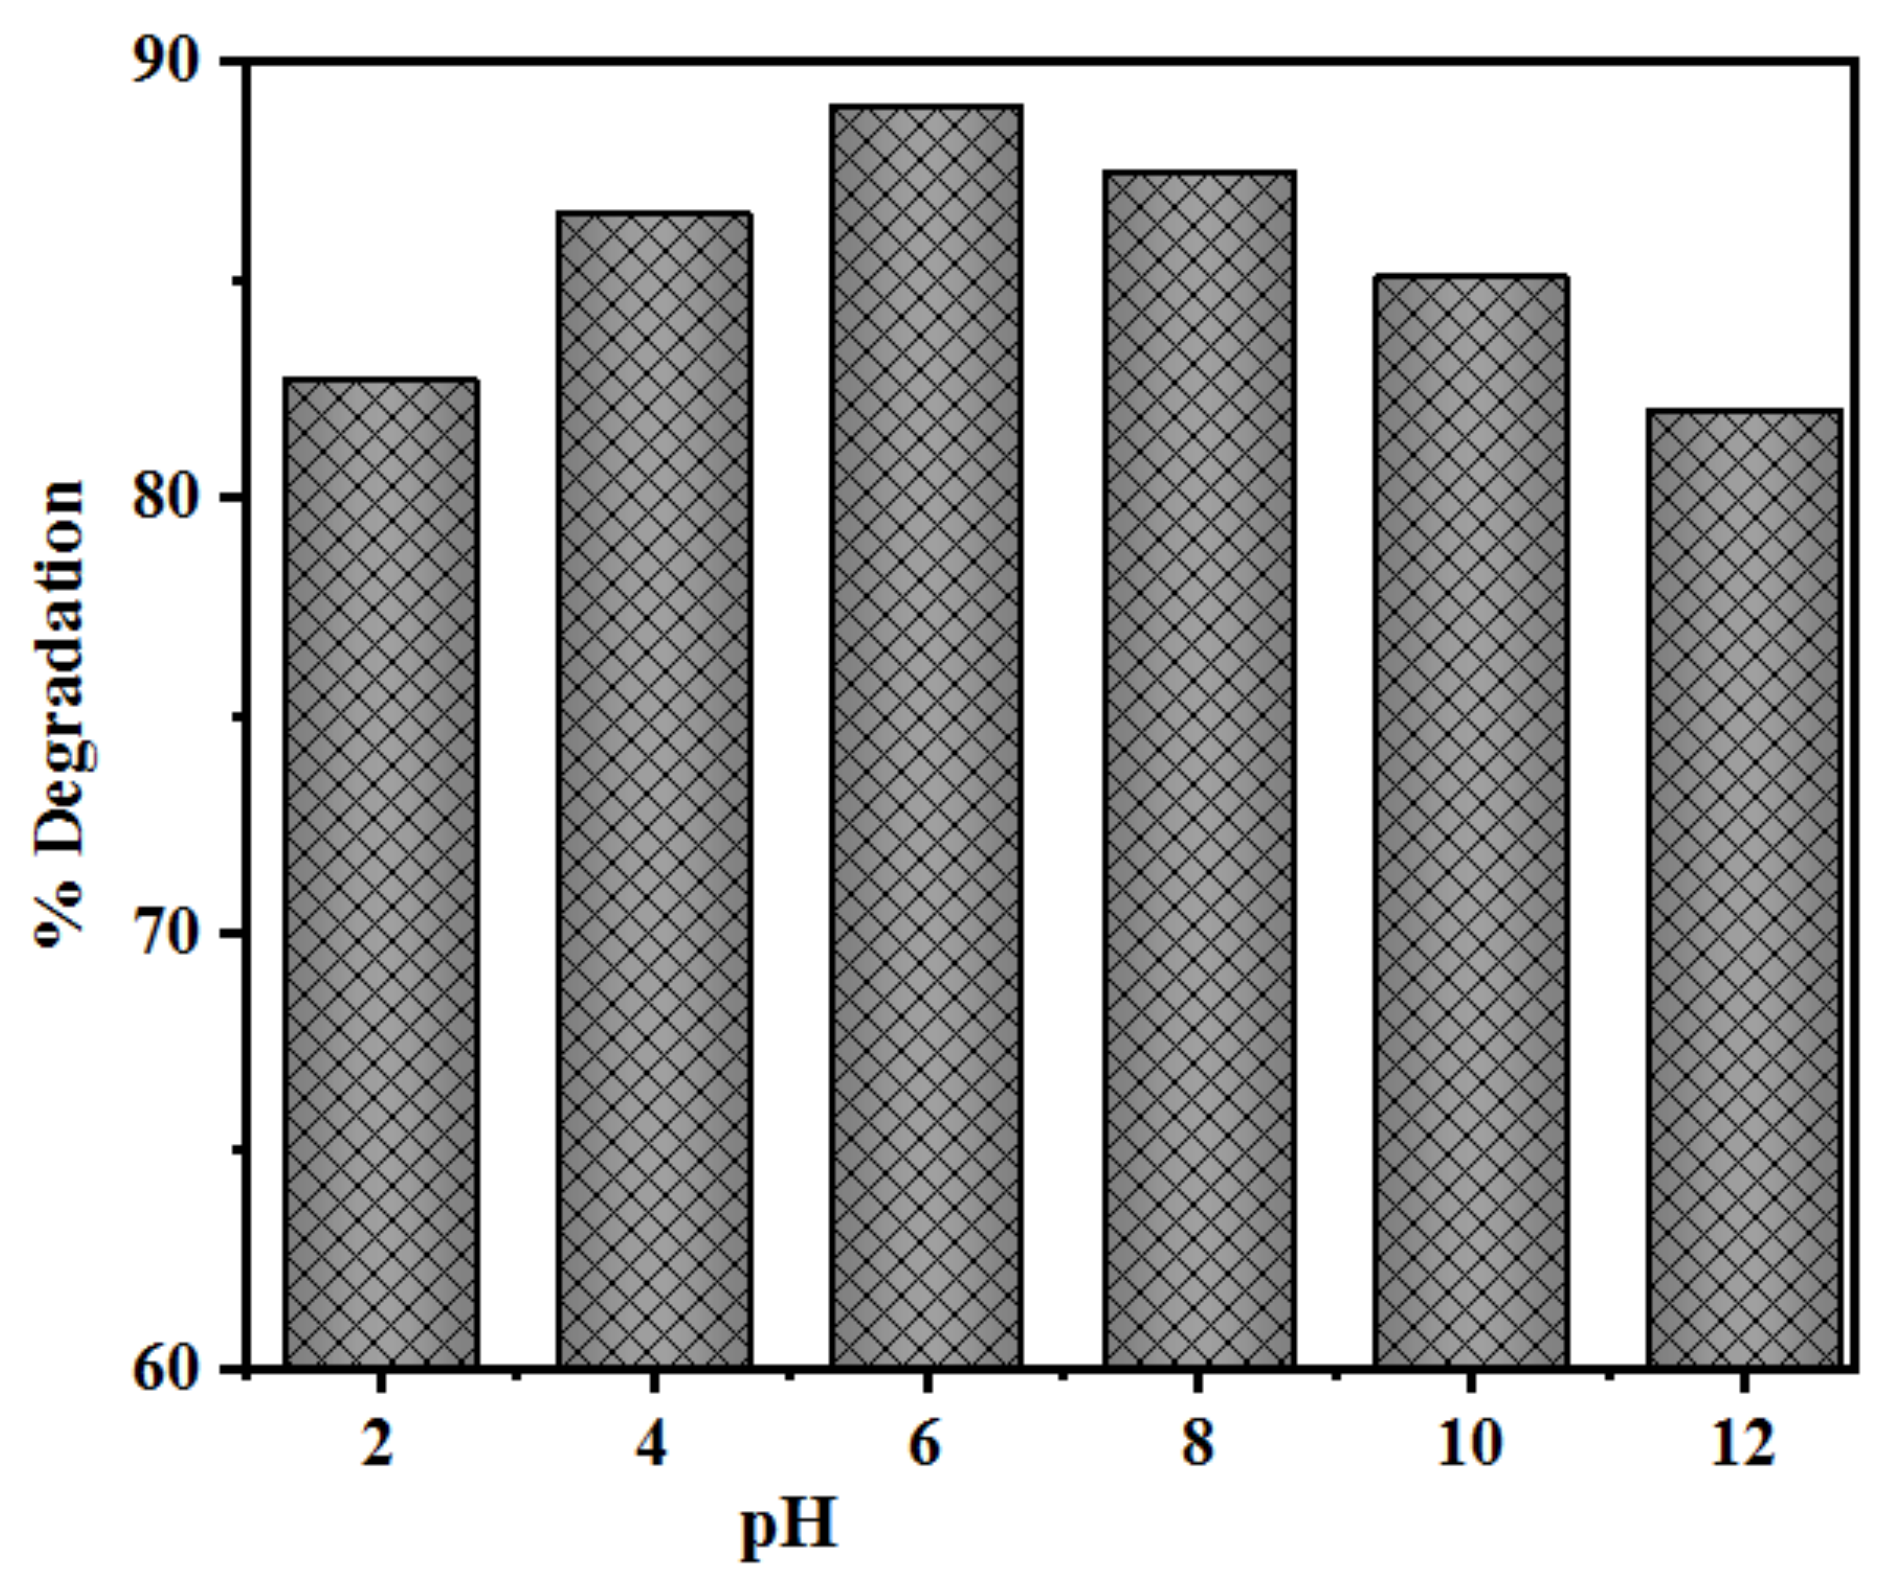
2.2.4. Effect of Initial pH

The pH of the solution is one of the significant parameters that affect the sonochemical and photocatalytic oxidation of various organic compounds. To study the pH effect on the SDB degradation, the experiments were done at various pH values (2.0–12.0), with 15 mL of 70 ppm initial SDB concentration and 40 mg Qds, for 75 min.
The sonocatalytic and photocatalytic degradation of SDB was higher at pH 6 (Figure 14) than at higher values of pH, as also observed in the previous results obtained with SDB [55,78]. The sonophotocatalytic degradation improved with pH increase, but maximum adsorption and degradation were obtained at pH 5–6. Higher values of pH caused lower levels of adsorption and decolorization of the dye.
The zero-point charge (pHzpc) of ZnS is 7–7.5, therefore, the surface of Qds is negatively charged above a pH of 7, whereas it is positively charged below pH 7 [100]. As an anionic dye, SDB is absorbed by Qds without any trouble at acidic range. However, at pH values higher than the isoelectric point, the quantity of positively charged surface adsorbent sites decreases, while the negative site increases, which does not favor the adsorption of negatively charged dye anions [27]. Therefore, pH 6 was chosen as the optimum pH value for the subsequent experiments.

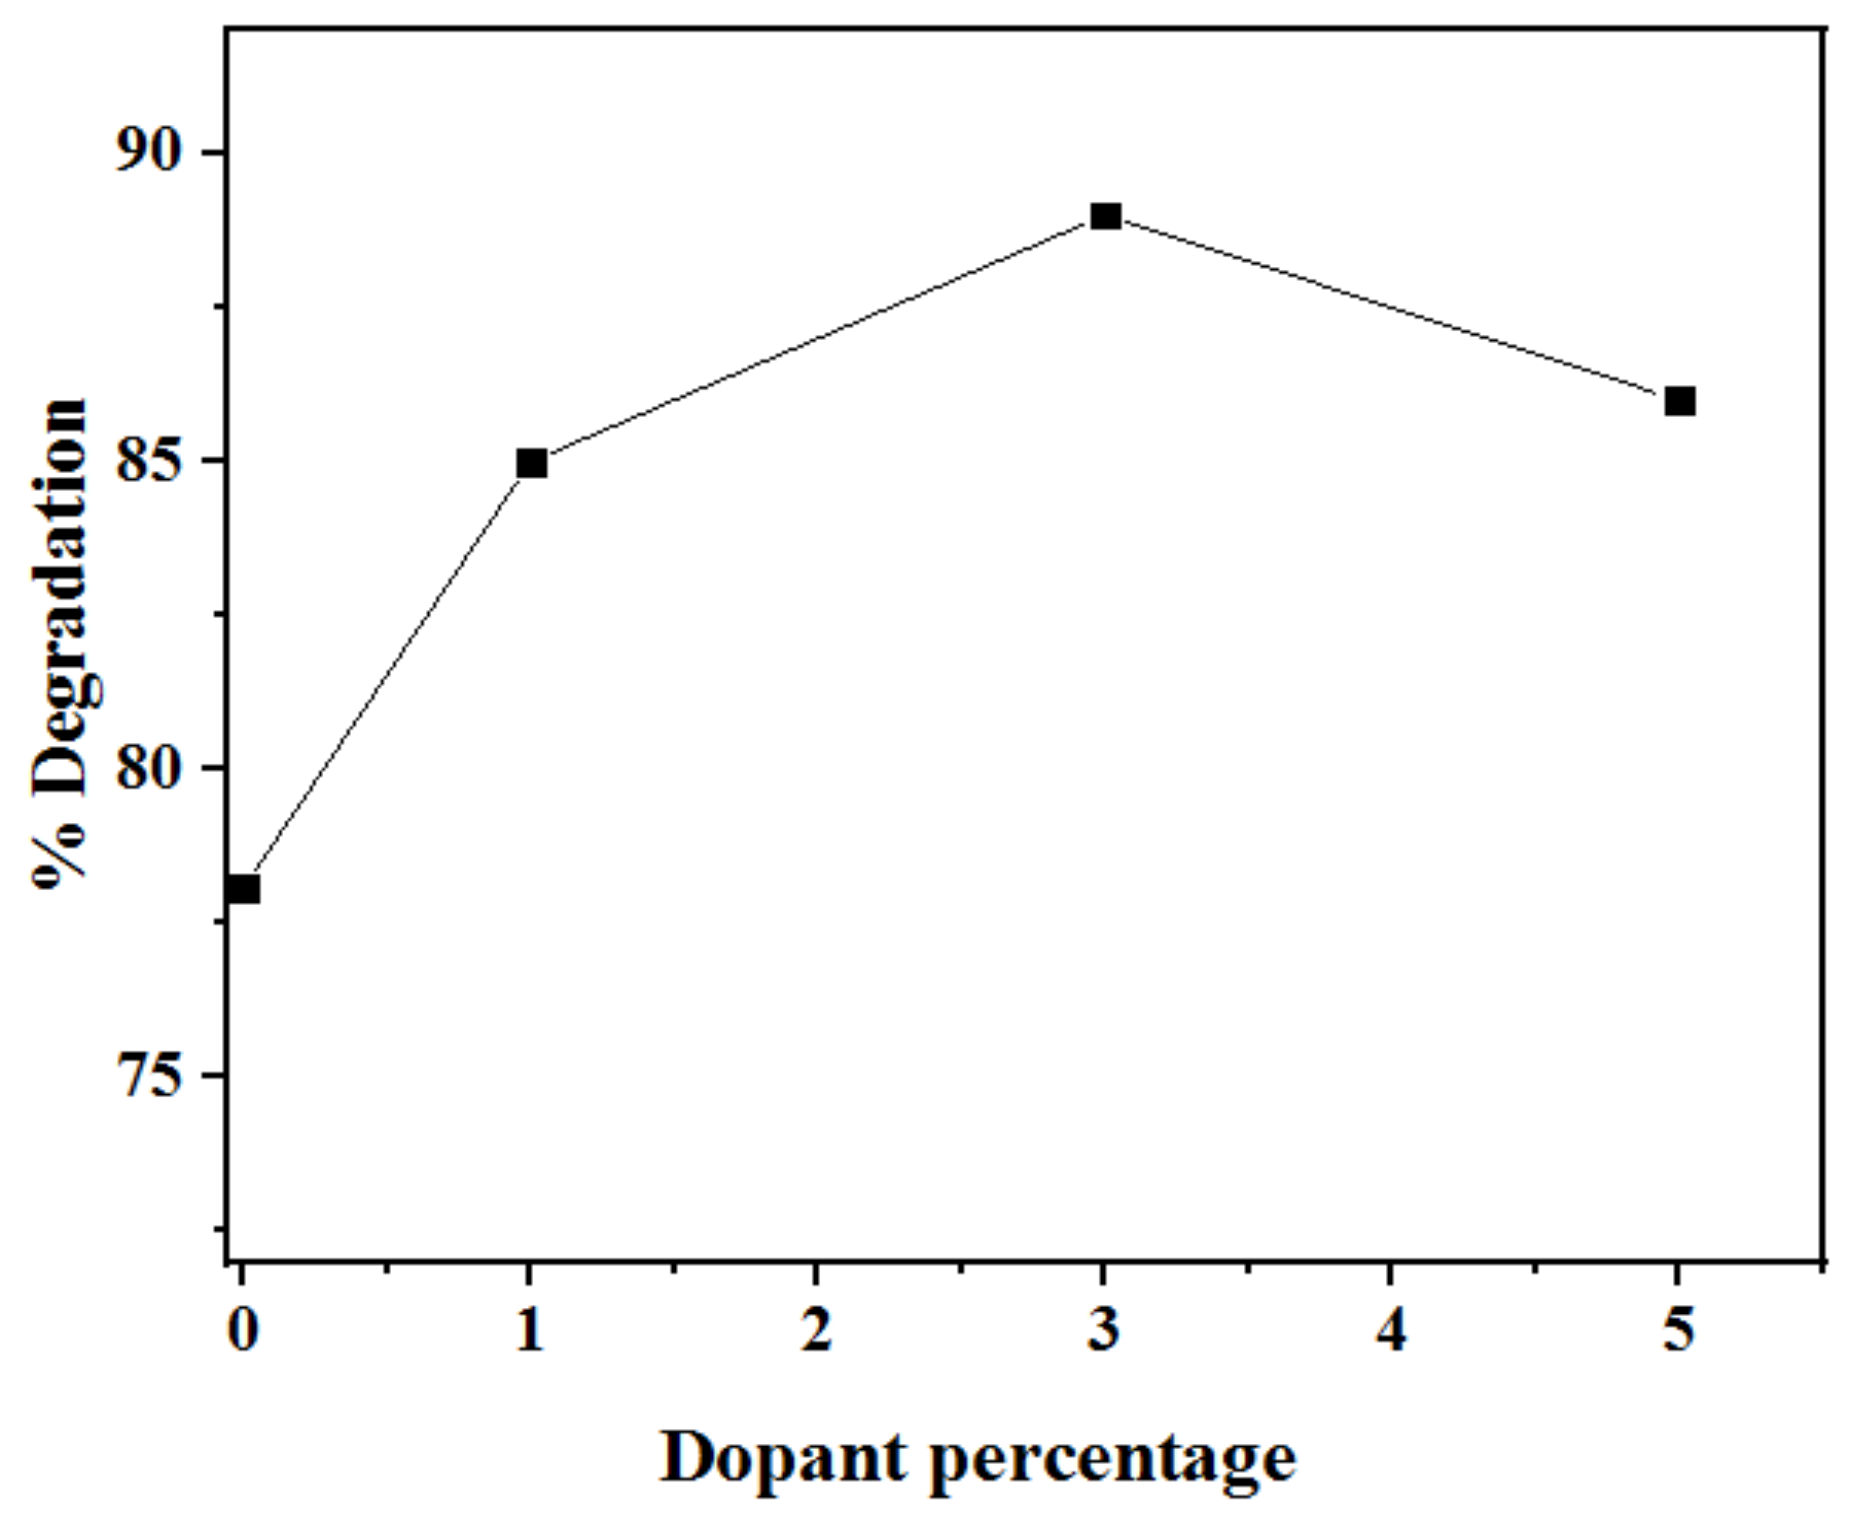
2.2.5. Effect of Mn2+ Dopant Concentration

The doping of ZnS with Mn significantly influenced the photodegradation efficiency of the Qds. To study the doping effect, experiments were done under optimum conditions by varying the amount of dopant (1–5.0% w/w). On evaluating the SDB degradation efficiencies, with pure and doped ZnS Qds, it was observed that doping enhanced the efficiency of the catalyst through sonophotocatalysis, even though a negative effect was found at high concentrations. Figure 15 shows that the sonophotocatalytic degradation efficacies of the Qds increase from 0 to 3% and decrease above 3%, indicating potential activity at 3% Mn2+ doping. The variations in the degradation efficiency may be attributed to differences in the size of the nanoparticles, as well as the recombination rates of the e and h+ upon doping, which affects their catalytic behavior [101]. Also, at high dopant concentration, Mn2+ entraps both the charge carriers, which consequently recombine by quantum tunneling as the distance between the trapping sites reduces. At low dopant concentration, only the h+ are trapped, which move to the surface and combine with the hydroxide ions present there, generating hydroxyl radicals (HO), which are the primary oxidizing radicals for the dyes [102,103,104].

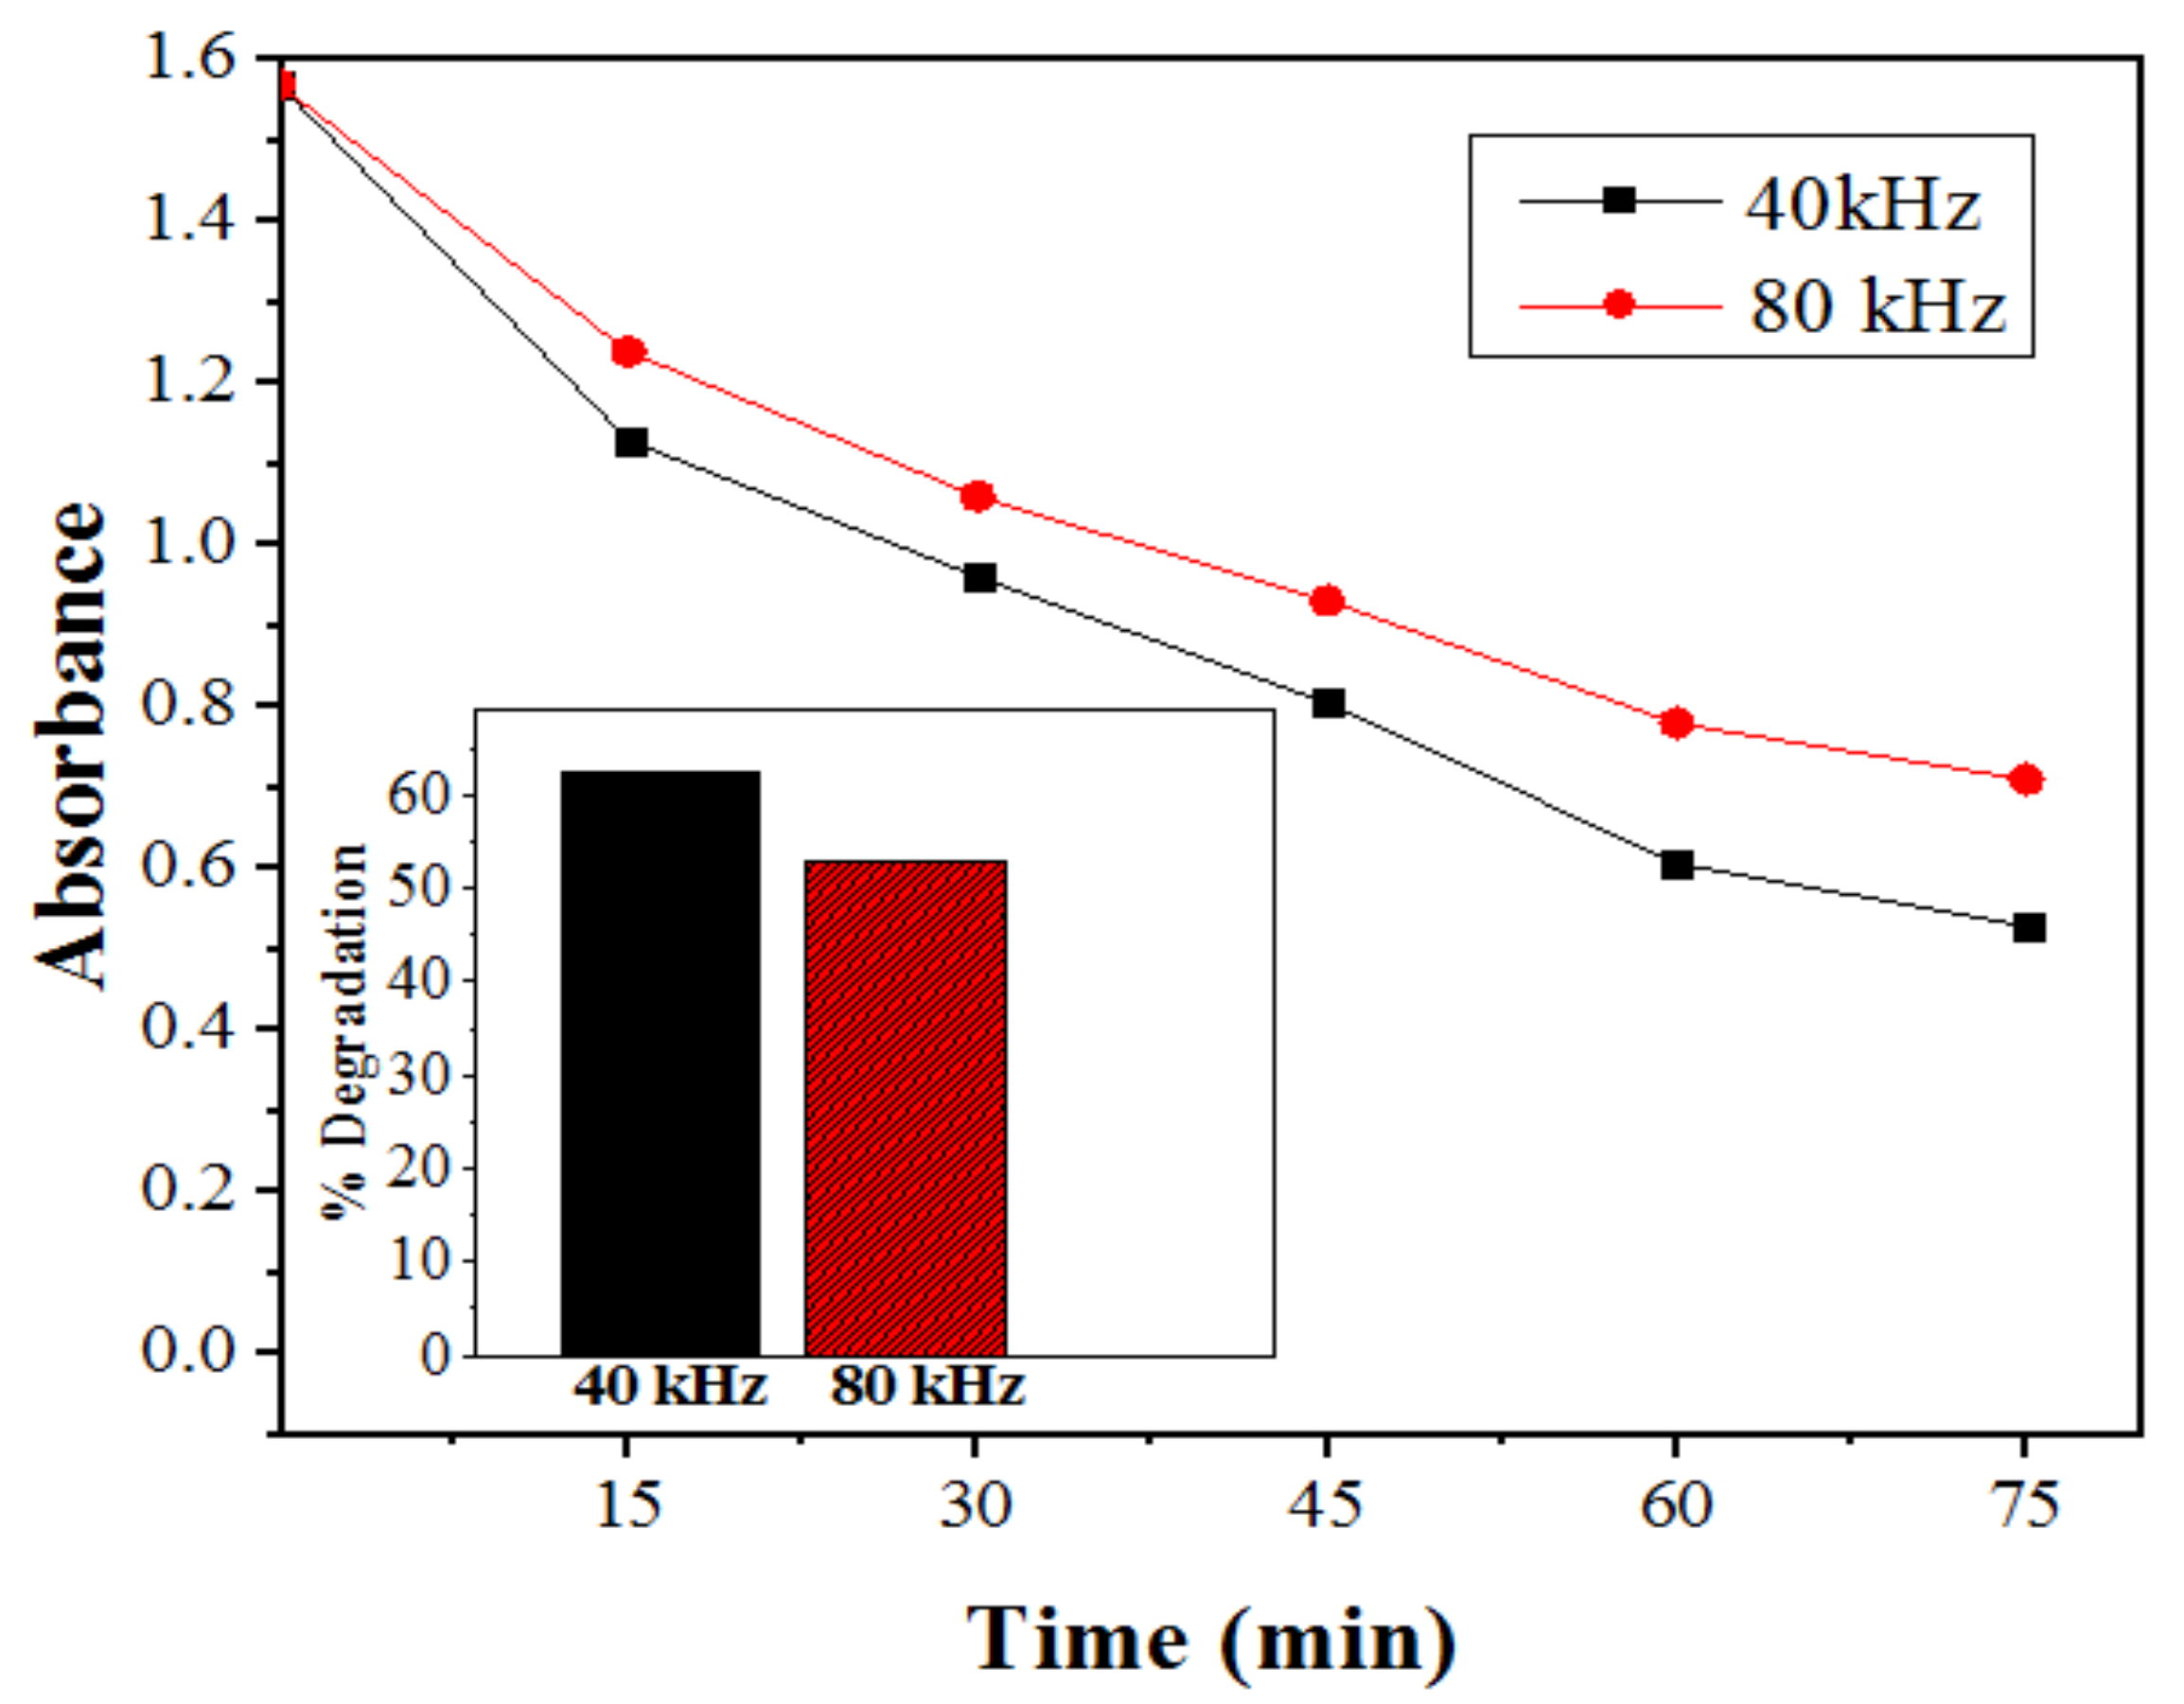
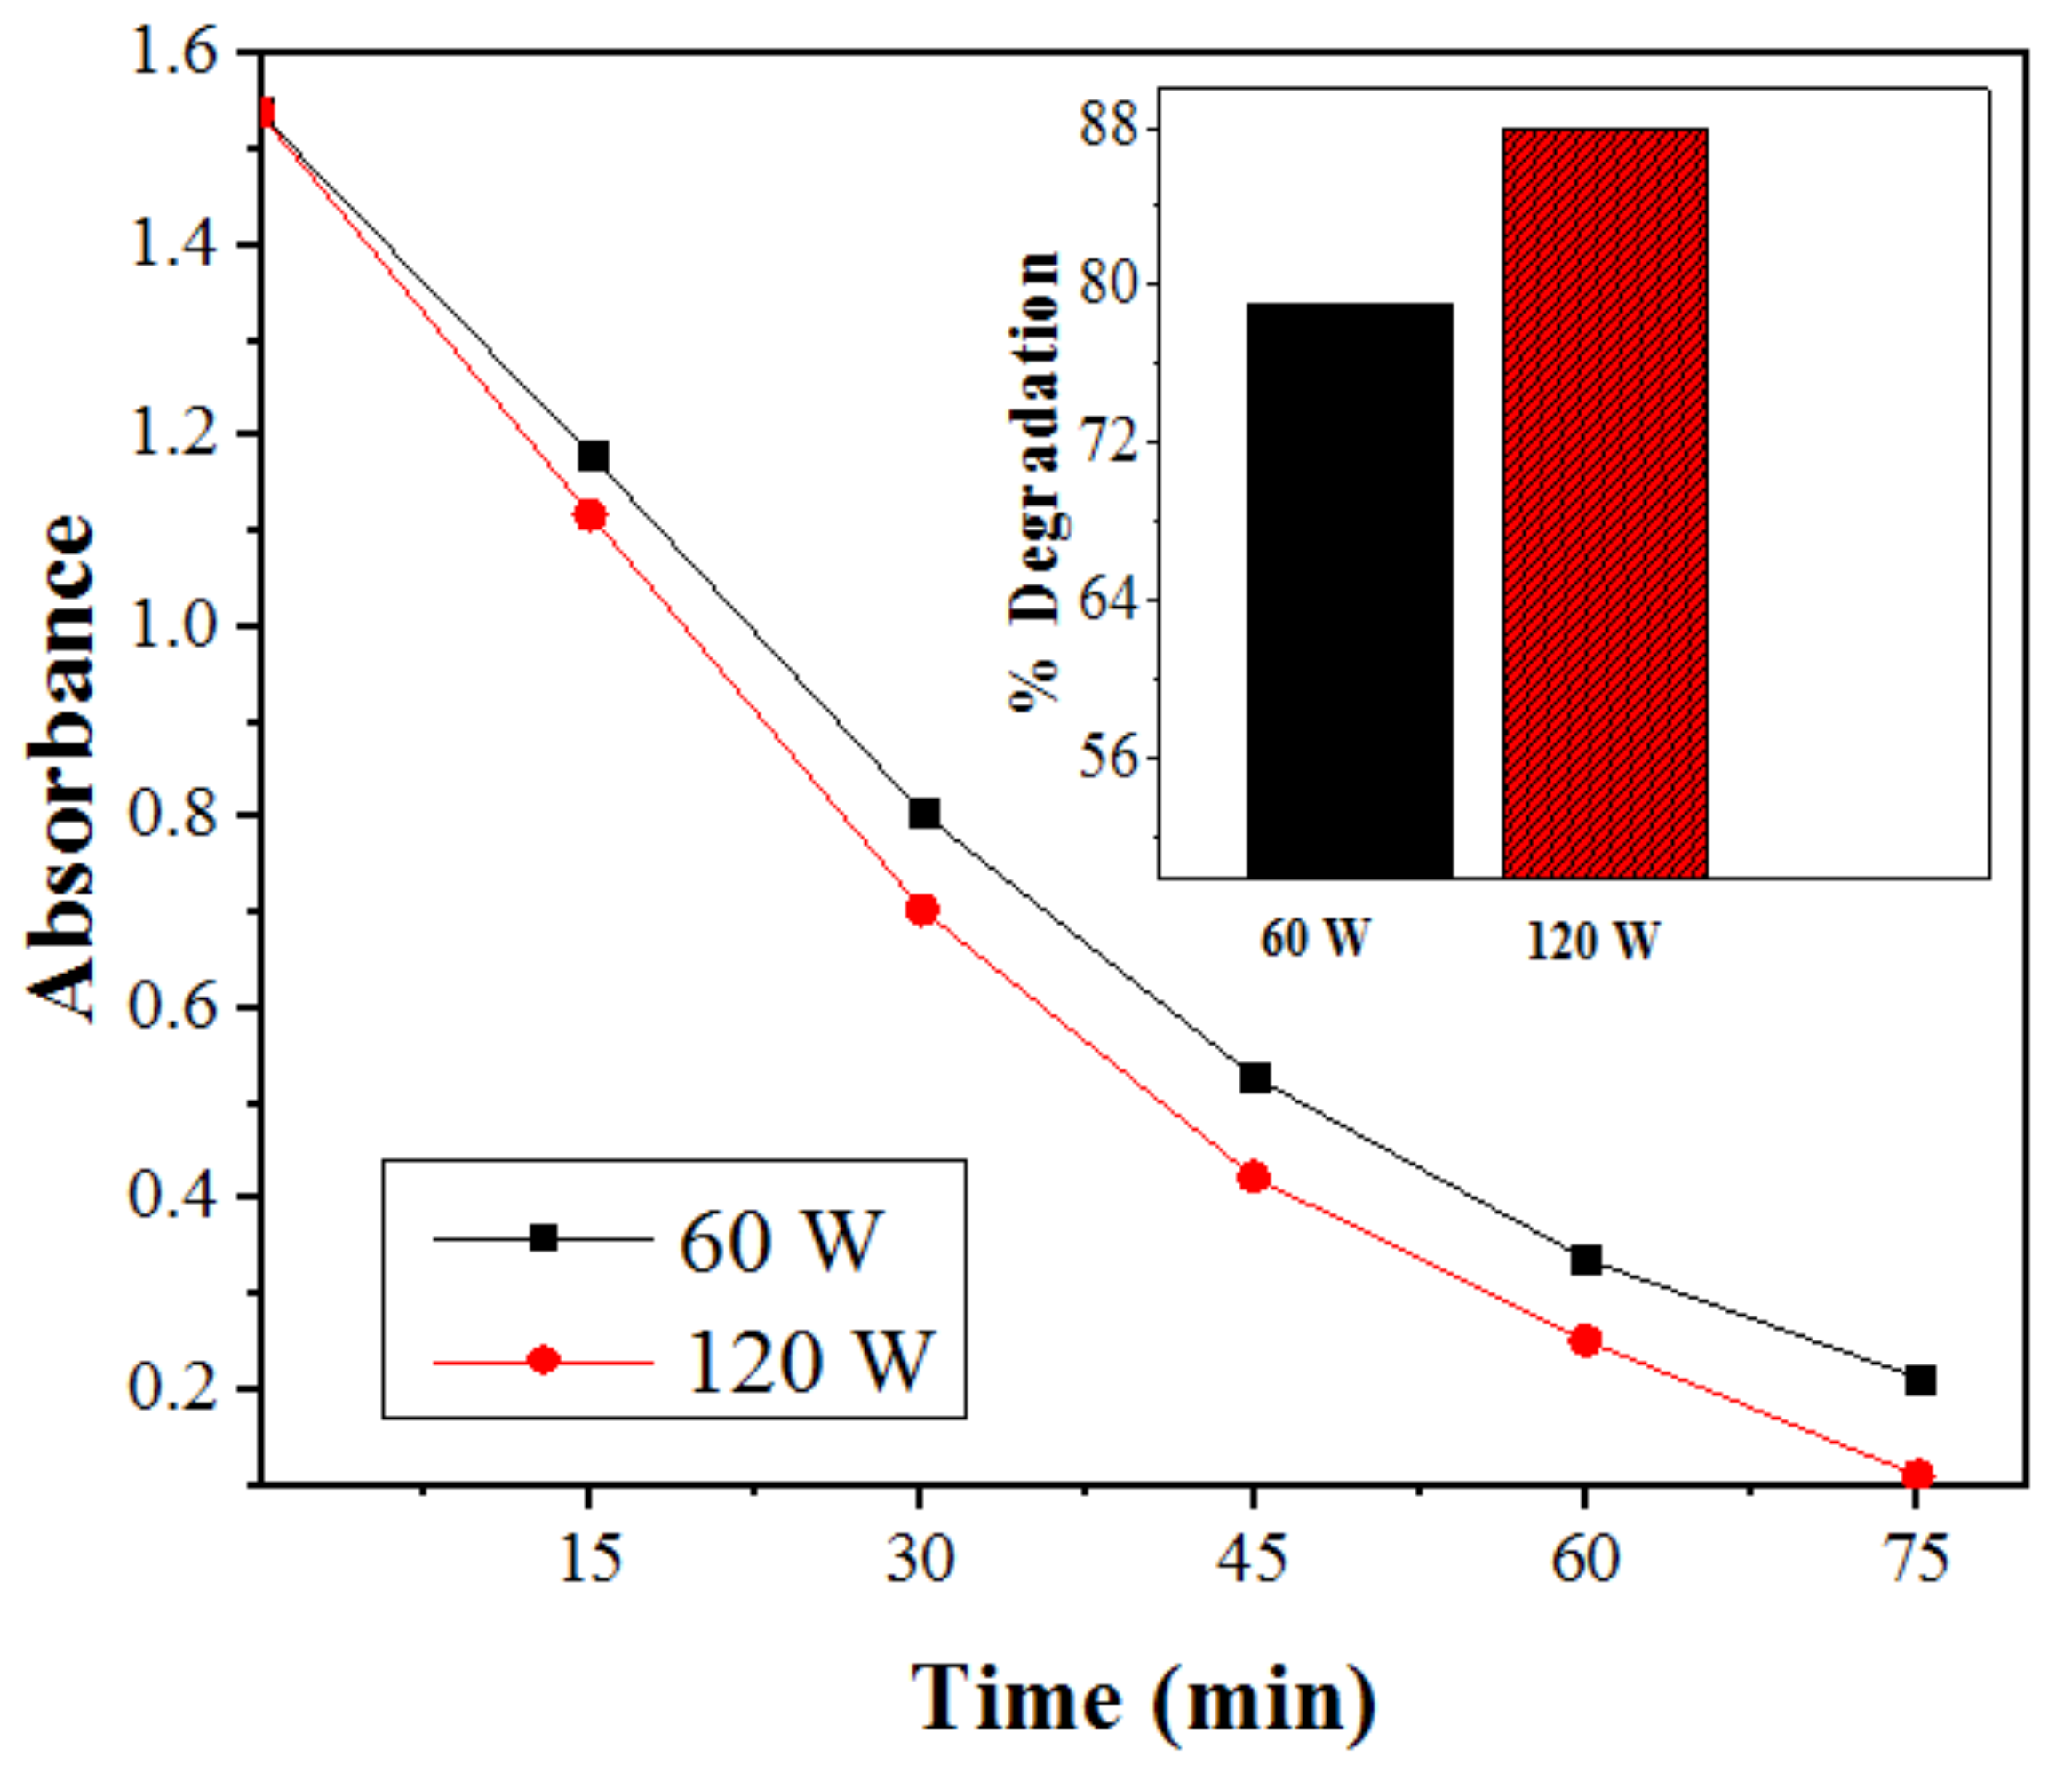
2.2.6. Effect of Ultrasonic Power on Degradation of SDB

To study the influence of power dissipation, experiments were carried out at two different power values (60 and 120 W). Figure 16 shows that an enhancement in the degradation rate was observed with an increase in power from 60 to 120 W. With the increase in power dissipation, the cavitational effects also increase, in turn producing additional turbulence and greater generation of free radicals, causing an enhancement in the degradation rate of SDB from 79 to 88%. Though the difference is minor, this may possibly be due to the cushioning effects, resulting from combination of a huge quantity of bubbles ensuing unproductive collapse action [105]. Thus, smaller energy gets used up for the free radical generation despite higher power dissipation [106,107]. Thus, 120 W was selected as the optimum power supply. The cavitational yield obtained for the system is 3.74 × 10⁻¹² mol/J.

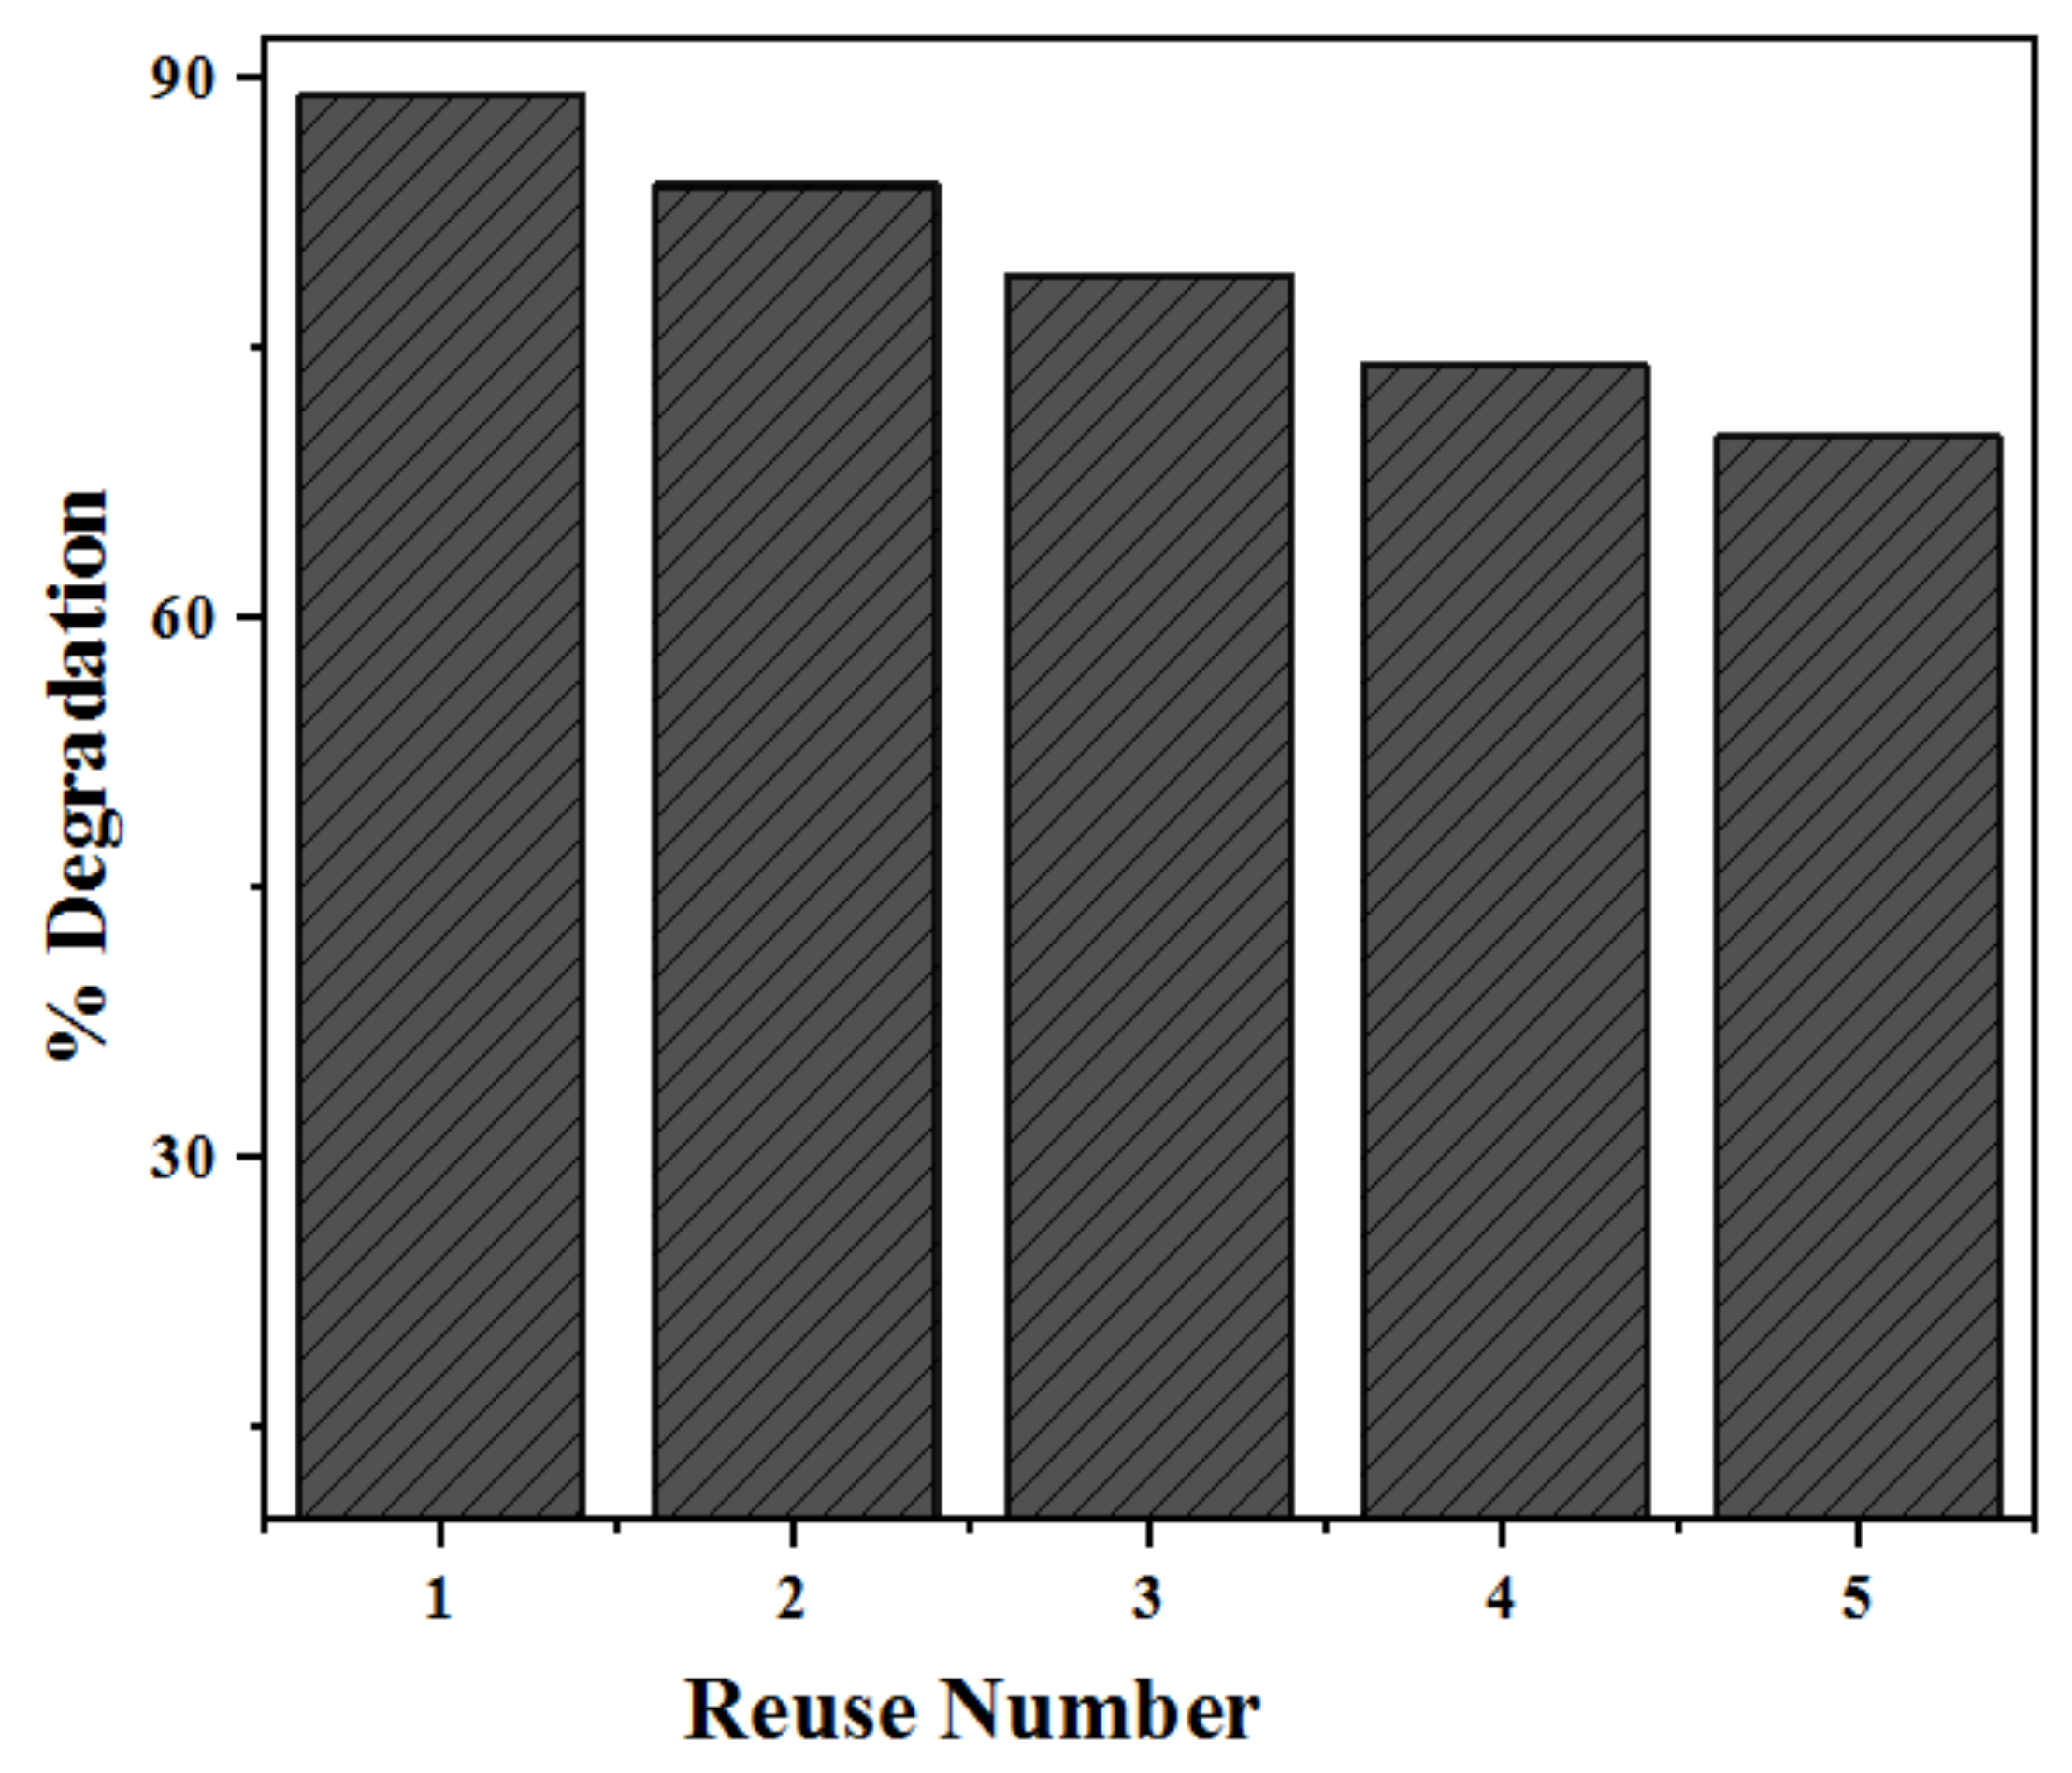
2.3. Re-Usability and Stability of Photocatalysts

Sustainability and reusability are important parameters of photocatalysts. In order to study the stability and durability of the as-prepared ZnS Qds, recycling experiments were performed for the removal of SDB. In the end of each cycle, the photocatalyst was removed, washed, dried and re-used [100]. During the washing process, loss of some catalyst amounts occurred, causing reduction in activity after the consecutive cycles [5,108]. Figure 17 shows that there is no significant loss of degradation efficiency after 5 consecutive cycles. Therefore, the doped ZnS Qds may be considered as a re-usable and photostable nanocatalyst during the degradation process.
The stability of the photocatalyst was also ascertained by XRD analysis. The XRD analysis of Mn2+:ZnS Qds was performed before and after degradation of the SDB dye molecule (Figure 17). After sonophotocatalytic degradation, small transformations occurred and the peaks shifted to lower 2θ values, as observed in Figure 18. This is attributed to the ultrahigh strain rates generated by sonication [109].

2.4. Mechanism of the Sonophotocatalytic Degradation

Sonication of water is known to generate active radicals such as OH and H by cavitation, which degrades the organic compounds present in water [110]. The presence of the nanocatalyst augment this phenomenon since the small bubbles present in water have a tendency to break into smaller ones, causing an increase in the total area of high pressure and temperature [111]. The oxygen molecules present in water act as a source for nucleus cavitation, while the HO radicals degrade the SDB dye species [112].
Moreover, the agglomerated molecules get dispersed by sonication. This deagglomeration enhances the surface area of the nanocatalyst, increasing the active sites for adsorption of the dye molecules as well as for the absorption of light producing more reactive species. Sonication also avoids catalyst deactivation, attributed to the upsurge of microstreaming and microbubbles which eliminates the molecules adsorbed at the surface of the nanocatalyst [113]. This causes cleaning of the catalyst surface, further enhancing the reaction.
During photocatalysis, the irradiation of ZnS with UV light photons, results in HO radical generation, due to oxidation of water by valence band holes. The active species electrons (e), holes (h+), hydroxyl radicals (HO) and superoxide radicals (O2•−) are generally produced subsequent to UV irradiation. The h+ with high oxidative potential allow direct oxidation of pollutants to highly reactive intermediates; also they could react with chemisorbed H2O, generating reactive species, such as the hydroxyl (HO) radicals [114].
Qds + hv → Qds (e + h+)
h+ + SDB → oxidation of SDB
h+ + OH → HO
h+ + H2O → H+ + HO
The generated electrons react with the dissolved oxygen molecules, originating several radicals [101]. Transition metals at the surface of ZnS and oxygen atoms work as an electron sink and increase the electron hole separation. The electrons of the conduction band reduce the molecular oxygen, originating a superoxide anion at the catalyst surface, which then reacts with H2O, forming H2O2, which originates HO radicals [115]. The dye molecules can be degraded or oxidized by the hydroxyl radicals (HO), causing the dye to dissociate into smaller and not so toxic species.
e + O2 → O2•−
O2•− + H2O → H2O2
H2O2 + e → 2HO
The application of ultrasound in water causes acoustic cavitation. This comprises the formation, growth and collapse of cavity bubbles, entrapped gases or vapors surrounding water. During the sonolysis of water, it is well known that acoustic cavitation generates highly reactive primary radicals such as OH and H, due to the thermal decomposition of water, as shown in reaction (10) [116,117]. A number of recombinations and other reactions (namely, reactions (11)–(14)) occur within the bubble following primary radical generation [118].
From a thermodynamic view, bubble collapse is significant, as it causes a large change in bubble volume. As the bubble collapse occurs quickly (<1 μs), the associated “work done” (PdV) leads to “near” adiabatic heating of the bubble contents, which results in the generation of very high temperatures and pressures within the bubble. As a result, numerous local hot spots with extremely high temperature and pressure are generated, consequently inducing the dissociation of water [116,118].
Thus, primary radical generation takes place due to various recombination and other reactions within the bubble. Among these radicals, HO is a powerful nonselective oxidant that has a high redox potential value (2.8 V) and can oxidize most of the organic pollutants.
H 2 O   ) ) ) ) ) )   HO + H
H + H2O → HO+ H2
H + O2 → HO2
HO + H → H2O
HO + HO → H2O2
2HO2 → H2O2 + O2
H2O2 + e → OH + HO
where )))))) refers to sonication.
Active HO radicals+ SDB molecules → Degradation of SDB
Thus, in both methods, the HO acts as a primary oxidizing radical, but other degradation processes can occur, since solutes have varying capacities to adsorb on the catalyst surface, as compared to the bubbles surface. Volatile solutes can be thermally degraded by entering the core of a collapsing bubble, but direct oxidation by the hole is also possible on the photocatalyst surface. Those extra processes can have improved effects when combined treatments are used, especially when the intermediates of the degradation process have different chemical properties than the parent molecules.

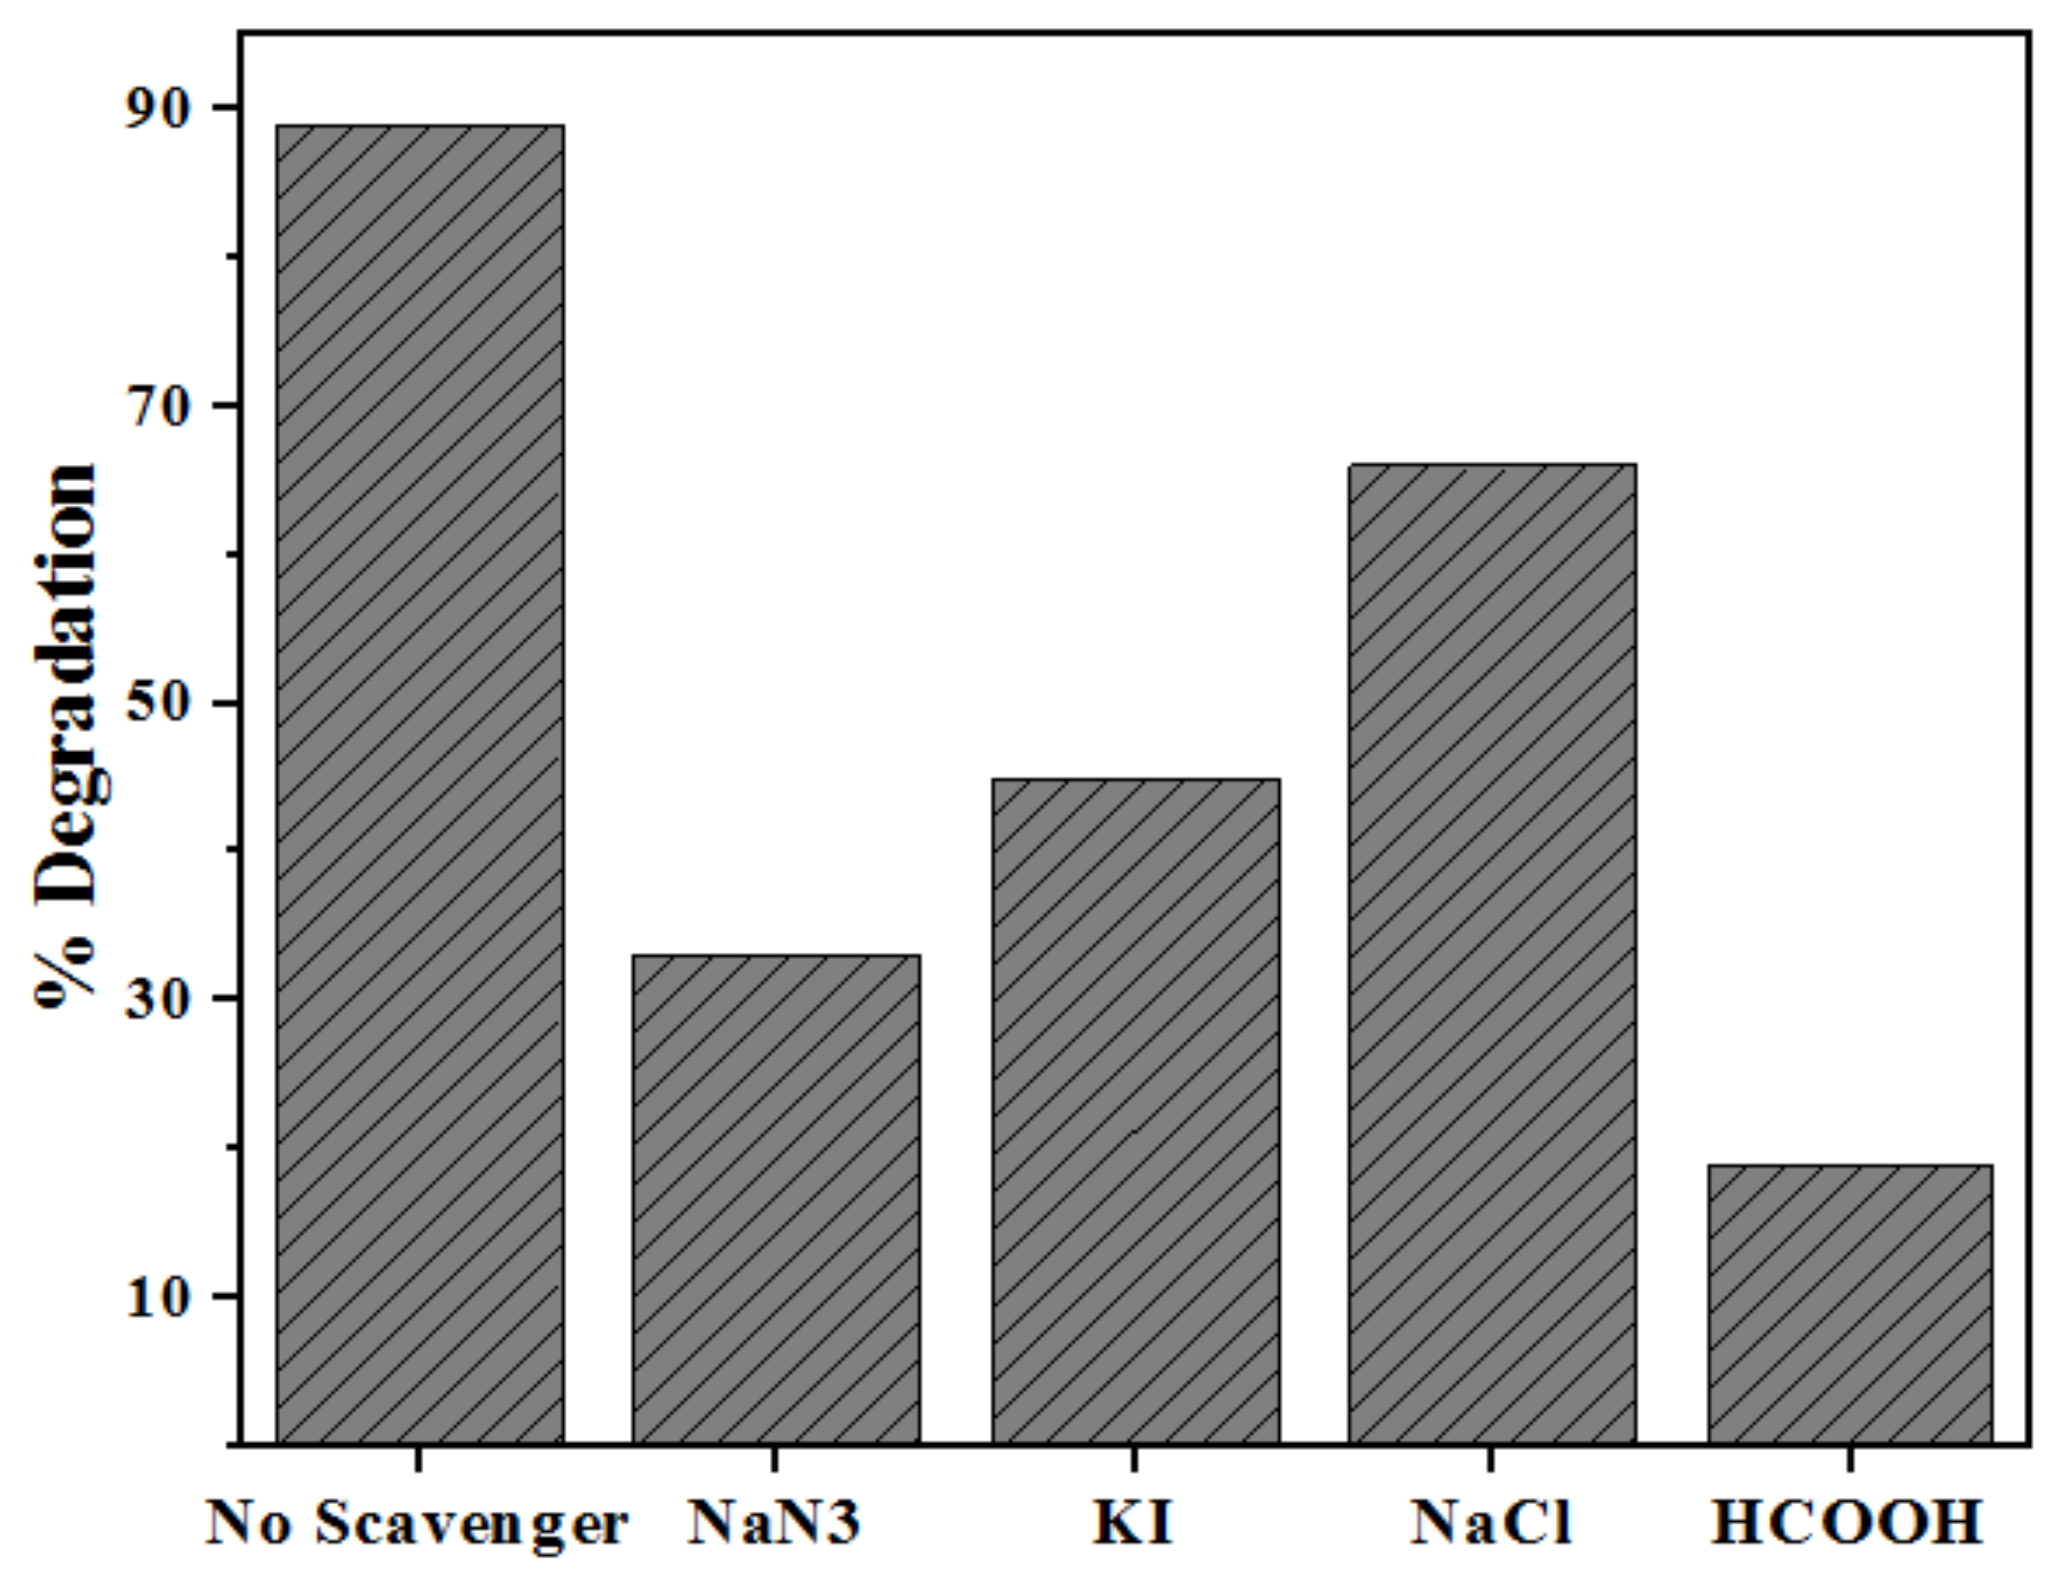
2.5. Role of Radical Trapping Agents

To elucidate the main contributors in the photodegradation reaction, the degradation rates of SDB in the presence of different scavengers were obtained. For this, the reactive species capture studies were carried out similar to the approach used for photocatalytic experiments. The experiments were performed by adding 0.01 M of different scavengers, for example, sodium azide (NaN3), potassium iodide (KI), sodium chloride (NaCl) and formic acid (HCOOH). The scavengers were added prior to the addition of the photocatalyst into the dye solution.
Figure 19 shows various control experiments for the photodegradation of SDB. HCOOH was added as the HO scavenger, NaCl as the h+ scavenger and NaN3 for scavenging 1O2 and HO [119]. Additionally, KI works for scavenging h+ and HOs at the catalyst surface [119,120]. The experiments were carried out by adding 0.01 M of different scavengers prior to the addition of photocatalyst into the dye solution. The maximum degradation (89%) of SDB was found without any scavenger. A small change in SDB photodegradation was found with the addition of NaCl, indicating that the photoexcited h+ also contributes in photodegradation as a minor factor. With the addition of NaCl the rate of photodegradation of SDB slightly declined to 66%, signifying that h+ were not the main active species. Further, the inhibition effect in photocatalytic efficiency was observed with a degradation of 19%, when HCOOH was added as the quencher, confirming the role of HO and H in the photocatalytic process [121,122,123]. Meanwhile, the addition of NaN3 resulted in a significant decrease, with a degradation of 33%, indicating the important roles of 1O2 and HO in the photocatalytic process. The formation of O2•− is directly influenced by the reduction of O2, as it determines the production of HO by its multistep reduction. Also, the photodegradation activity of SDB declined to 45% after the addition of KI, indicating the important roles of h+ and HOs in the photodegradation process.
Furthermore, to confirm the formation of HO radicals, a terephthalic acid test was conducted. The highest intensity peak in the fluorescence spectra of the terephthalic acid test represents the larger generation of HO radicals. Figure 20 confirms the generation of a higher amount of HO radicals during the sonophotocatalytic degradation of SDB with highest fluorescence intensity, as compared to the sonocatalytic and photocatalytic processes [124,125].

2.6. Degradation Products of Mn2+:ZnS Assisted Photodegradation of SDB

The mechanism for the Mn2+:ZnS assisted photodegradation of SDB was established using LC–MS. The results obtained for entirely degraded SDB are given in Figure S3. The SDB solution before photodegradation is shown in the inset. The main possible products from the SDB transformation are shown in Figure S4. The structure of those probable transformation products was proposed based only on LC-MS fragmentation. The peaks of SDB were observed at 461 m/z. Only the parent dye was present before irradiation, as expected [126]. Afterwards, quite a few fragments were obtained at m/z 124, 182, 240, 307.8 and 558, indicating subsequent photodegradation of SDB. Possible structures with those m/z values are depicted in Figure S4.

3. Experimental

3.1. Materials

Analytical grade chemicals, which did not require further purification, were used for the syntheses. Manganese carbonate, zinc acetate, sodium sulfide and nicotinic acid were purchased from Merck India Ltd., and used to prepare Mn2+:ZnS Qds. The SDB dye (laboratory reagent grade) was also supplied by Merck India Ltd. Table S2 shows the formula and other data of this dye. In order to adjust the pH values of the suspensions, NaOH and HCl solutions were used (Merck India Ltd., Mumbai). Using double distilled water, varying concentrations of SDB solutions were made by diluting the prepared stock solution.

3.2. Apparatus

The surface morphology of the nanoparticles was studied using a scanning electron microscope JEOL JSM—6390LV, Tokyo, Japan. A small piece of extrudate of 10 mm diameter was mounted on specimen stubs using carbon tape and was over coated with gold using the JFC 1600. This ion sputtering device performs rapid and efficient gold coating on microscopic specimens, allowing surface visualization. The SEM measurements were performed at 15 kV accelerating voltage. Different voltages and magnifications were used as indicated in the SEM images.
The transmission electron microscopy was performed using a JEOL Model JM 2100 TEM device. An extremely small amount of material was suspended in water/ethanol (just enough to obtain slightly turbid solution). The solution was ultrasonicated to disperse the particles. A drop of the solution was then pipetted out and the drop was placed on a carbon-coated grid of 200 mesh. The measurements of particles observed in the TEM images were carried out using ImageJ software.
The absorption spectrum was used to find the optical properties of the as-prepared material, adopting a Cary Win UV spectrophotometer. The Belsorp mini II (BEL Japan Inc., Osaka, Japan) was used for N2 gas adsorption–desorption analysis at −196 °C (with liquid nitrogen as coolant). The Brunauer–Emmett–Teller (BET) method was used to measure the surface areas, whereas the pore size distribution and volume were determined by the Barrett–Joyner–Halenda (BJH) model. The thermo gravimetric analysis (TGA) was conducted with a Perkin Elmer STA 6000 TG/DT model at 10 °C/min, from 30 to 650 °C, in N2 atmosphere. For tuning the pH, a Systronic pH-meter was used. The ultrasound assistance in the dye degradation experiment was accomplished in an Aczet ultrasonic bath reactor with operating frequency of 40 kHz, a power rating of 120 W, and a 2.5 L capacity with dimensions of 235 × 135 × 100 mm. The UV irradiations were provided using a 40 W mercury lamp (Osram), at 254 nm emission, with incident light intensity of 221.23 W/m2. Finally, product analysis was done by mass spectrometry by the Agilent 1290 Infinity UHPLC system (Agilent Technologies, Santa Clara, CA, USA).

3.3. Preparation of Quantum Dots

The synthesis of the Mn2+:ZnS Qds sample was done in our lab by the chemical precipitation method following the procedure reported earlier [5,59,71]. In brief, all the aqueous solutions of precursors were prepared first, i.e., manganese carbonate, sodium sulfide and zinc acetate. For 1% manganese doping, we added 29.75 mL of 0.01 mol/L of manganese carbonate solution to 49.5 mL of a solution of 0.5 mol/L zinc acetate. Then, nicotinic acid (1.0 At. wt%) was mixed for the capping action. The pH was adjusted to 10 using a solution of NaOH 1 M. Then a Na2S solution was added, dropwise, with continuous stirring to obtain a white precipitate. The solution was then refluxed at 60 °C and centrifuged to obtain the precipitate. Finally, the precipitate was filtered, washed 3–4 times to eliminate impurities and dried.

3.4. Quantum Dot Based Catalytic Experiments

After characterization, the synthesized Qds were used in the sonophotocatalytic degradation experiments of SDB dye. A 100-ppm stock solution of SDB was prepared for the studies. In order to optimize the amount of catalyst, various concentrations of dye solutions were prepared, then the desired pH value was adjusted initially, and the appropriate amount of Qds catalyst was added to each suspension. The mixtures were stirred for 20 min in the dark before irradiation/ultrasound to ascertain an adsorption–desorption state of equilibrium. Then the sonicator and/or lamp were connected and the reaction started.
The solutions were irradiated by adopting a UV-C (λ = 254 nm) light mounted above as the driving energy source, as shown in Figure S5. A distance of 12 cm between the light source and the solution was set for overall degradation experiments. An ultrasonic bath (40 kHz, 120 W) was used as the ultrasound source for the sonocatalytic and sonophotocatalytic experiments. The sonicator water was continuously replaced by circulation, in order to maintain the desired temperature (29 ± 1 °C, unless otherwise mentioned). The reactor position in the ultrasonic bath was the same.
The experimental conditions employed for photocatalysis, sonocatalysis and sonophotocatalysis were similar. After certain time intervals, sample aliquots were removed, centrifuged and analyzed for the remaining dye by recording the absorbance in spectrophotometer. The absorbance decrease (at λmax = 560 nm) for SDB samples after irradiation and/or sonication for a certain time showed the decolorization rate, that is, efficiency of decolorization of SDB, and therefore sonophotocatalytic activity of Qds.

4. Conclusions

In the present study, Mn2+:ZnS Qds were synthesized by a simple and fast precipitation method. The photocatalytic, sonocatalytic and sonophotocatalytic degradation of SDB was investigated. Optimal parameters involved in the degradation such as the initial dye concentration, catalyst loading, pH, power dissipation and ultrasonic frequency were determined. The prepared nanocatalysts showed an improved efficiency for the sonophotocatalytic degradation of SDB in comparison to sonocatalysis or photocatalysis alone. An explanation can be found in the enhanced electron-holes separation at the heterointerface, by generation of highly reactive radicals and improved active surface area. The sonophotocatalytic dye removal process follows pseudo second-order kinetics. Therefore, Mn2+:ZnS Qds provided effective removal of SDB, the process being straightforward and potentially useful for removal of organic pollutants from wastewater.

Supplementary Materials

The following are available online at https://www.mdpi.com/article/10.3390/catal11091025/s1, Figure S1: (a) N2 adsorption-desorption isotherms of Mn2+:ZnS Qds. (b) Pore size distribution obtained by BJH-adsorption, Figure S2: SDB absorbance changes at absorption maximum (λmax = 560 nm) for the ultrasound and UV light assisted degradation in the absence of pure and doped Mn2+:ZnS Qds at optimum conditions (15 mL of 70 ppm SDB, pH 6, 75 min ultrasound and/or UV light irradiation), Figure S3: LC–MS of Mn2+ doped ZnS assisted photodegraded SDB solution. Inset: SDB solution before and after degradation (after 75 mins), Figure S4: Degradation products of SDB photodegradation catalyzed byMn2+:ZnS Qds, Figure S5: Schematic diagram of sonophotocatalytic experimental setup, Table S1: Kinetic parameters: rate constants (k), correlation coefficients (R2) and decolorization efficiency (DE) for the removal of Solochrome dark blue dye by Mn2+:ZnS Qds, Table S2: Data for Solochrome dark blue dye.

Author Contributions

Conceptualization: J.P. and B.J.; methodology: J.P., B.J. and S.Y.; software: J.P., A.K.S., S.Y. and S.A.C.C.; validation: S.A.C.C. and A.K.S.; formal analysis: J.P.; investigation: J.P., B.J., S.Y. and A.K.S.; resources: A.K.S. and M.A.B.H.S.; data curation: J.P. and B.J.; writing—original draft preparation: J.P.; writing—review and editing: M.A.B.H.S. and S.A.C.C.; visualization: A.K.S.; supervision: A.K.S.; project administration: J.P., A.K.S., M.A.B.H.S. and S.A.C.C.; funding acquisition: J.P., A.K.S., M.A.B.H.S. and S.A.C.C. All authors have read and agreed to the published version of the manuscript.

Funding

J.P. is thankful to DST, New Delhi, India for Research fellowship under Women Scientist Scheme (SR/WOS-A/CS-82/2018). This work has also been supported by FCT—Fundação para a Ciência e a Tecnologia, I.P., under the Scientific Employment Stimulus-Institutional Call (CEECINST/00102/2018) and the Associate Laboratory for Green Chemistry-LAQV which is financed by national funds from FCT/MCTES (UIDB/50006/2020 and UIDP/50006/2020).

Institutional Review Board Statement

Not applicable.

Informed Consent Statement

Not applicable.

Data Availability Statement

Data will be made available upon request.

Acknowledgments

Authors are also thankful to SAIF centers: STIC Kochi, IIT Madras, MNIT Jaipur, NIT Raipur and Center for Basic Sciences, Pt. RSSU Raipur for providing instrumental analysis facilities, and to the Department of Chemistry, Govt. V.Y.T.PG. Autonomous College, Durg (C.G.) for providing basic instruments for the kinetic study.

Conflicts of Interest

Authors declare no conflict of interest.

References

  1. Sugumar, S.; Thangam, B. BiodEnz: A database of biodegrading enzymes. Biomed. Inform. 2012, 8, 40–42. [Google Scholar]
  2. Munter, R. Advanced oxidation processes—Current status and prospects. Proc. Estonian Acad. Sci. Chem. 2001, 50, 59–80. [Google Scholar]
  3. Chen, D.; Chen, X. Luminescent perovskite quantum dots: Synthesis, microstructures, optical properties and applications. J. Mater. Chem. C 2019, 7, 1413–1416. [Google Scholar] [CrossRef]
  4. Kumar, H.; Kumari, A.; Singh, R.R. Tunable narrow emission in ZnS/CdS/ZnS quantum well structures prepared by aqueous route. Opt. Mater. 2017, 69, 23–29. [Google Scholar] [CrossRef]
  5. Patel, J.; Singh, A.K.; Carabineiro, S. Carabineiro, Assessing the photocatalytic degradation of fluoroquinolone norfloxacin by Mn:ZnS quantum dots: Kinetic study, degradation pathway and influencing factors. Nanomaterials 2020, 10, 964. [Google Scholar] [CrossRef] [PubMed]
  6. Xiong, C.R.; Balkus, K.J. Mesoporous molecular sieve derived TiO2 Nanofibers doped with SnO2. J. Phys. Chem. C 2007, 111, 10359. [Google Scholar] [CrossRef]
  7. Ji, P.; Takeuchi, M.; Cuong, T.M.; Zhang, J.; Matsuoka, M.; Anpo, M. Recent advances in visible light responsive Titanium Oxide-based photocatalysis. Res. Chem. Intermed. 2010, 36, 327–347. [Google Scholar] [CrossRef]
  8. Wu, C.G.; Chao, C.C.; Kuo, F.T. Enhancement of the photocatalytic performance of TiO2 catalysts via transition metal modification. Catal. Today 2004, 97, 103–112. [Google Scholar] [CrossRef]
  9. Panda, D.; Manickam, S. Recent advancements in the sonophotocatalysis (SPC) and doped-sonophotocatalysis (DSPC) for the treatment of recalcitrant hazardous organic water pollutants. Ultrason. Sonochem. 2017, 36, 481–496. [Google Scholar] [CrossRef]
  10. Neppolian, B.; Park, J.S.; Choi, H. Effect of fenton-like oxidation on enhanced oxidative degradation of para-chlorobenzoic acid by ultrasonic Irradiation. Ultrason. Sonochem. 2004, 11, 273. [Google Scholar] [CrossRef]
  11. Guillard, C.; Theron, P.; Pichat, P.; Petrier, C. Evaluation of 1-Octanol degradation by photocatalysis and ultrasound using SPME. Water Res. 2002, 36, 4263. [Google Scholar] [CrossRef]
  12. Brennen, C.E. Cavitation and Bubble Dynamics; New York Oxford Univ. Press: New York, NY, USA, 1995. [Google Scholar]
  13. Suslick, K.S.; Flannigan, D.J. Inside a collapsing bubble: Sonoluminescence and the conditions during cavitation. Ann. Rev. Phys. Chem. 2008, 59, 659–683. [Google Scholar] [CrossRef] [Green Version]
  14. Ciawi, E.; Rae, J.; Kumar, M.A.; Grieser, F. Determination of temperatures within acoustically generated bubbles in aqueous solutions at different ultrasound frequencies. J. Phys. Chem. B 2006, 110, 13656–13660. [Google Scholar] [CrossRef]
  15. Jagannathan, M.; Grieser, F.; Kumar, M.A. Sonophotocatalytic degradation of Paracetamol using TiO2 and Fe3+. Sep. Purif. Technol. 2013, 103, 114–118. [Google Scholar] [CrossRef]
  16. Selli, E.; Bianchi, C.L.; Pirola, C.; Bertelli, M. Degradation of Methyl tert-butyl ether in water: Effects of the combined use of sonolysis and photocatalysis. Ultrason. Sonochem. 2005, 12, 395–400. [Google Scholar] [CrossRef] [PubMed]
  17. Sathishkumar, P.; Mangalaraja, R.V.; Rozas, O.; Vergara, C.; Mansilla, H.D.; Gracia-Pinilla, M.A.; Anandan, S. Sonophotocatalytic mineralization of norflurazon in aqueous environment. Chemosphere 2016, 146, 216–225. [Google Scholar] [CrossRef] [PubMed] [Green Version]
  18. Babu, S.G.; Vinoth, R.; Neppoliana, B.; Dionysiou, D.D.; Kumar, M.A. Diffused sunlight driven highly synergistic pathway for complete mineralization of organic contaminants using reduced graphene oxide supported photocatalyst. J. Hazard. Mater. 2015, 291, 83–92. [Google Scholar] [CrossRef] [PubMed]
  19. Babu, S.G.; Karthik, P.; John, M.C.; Lakhera, S.K.; Kumar, M.A.; Khim, J. Neppolian, synergistic effect of sono-photocatalytic process for the degradation of organic pollutants using CuO-TiO2/rGO. Ultrason. Sonochem. 2019, 50, 218–223. [Google Scholar] [CrossRef]
  20. Sathishkumar, P.; Mangalaraja, R.V.; Rozas, O.; Mansilla, H.D.; Gracia-Pinilla, M.A.; Anandan, S. Low frequency ultrasound (42 kHz) assisted degradation of Acid Blue 113 in the presence of visible light driven rare earth nanoclusters loaded TiO2 nanophotocatalysts. Ultrason. Sonochem. 2014, 21, 1675–1681. [Google Scholar] [CrossRef]
  21. Kaur, S.; Singh, V. Visible light induced sonophotocatalytic degradation of reactive red dye 198 using dye sensitized TiO2. Ultrason. Sonochem. 2007, 14, 531. [Google Scholar] [CrossRef]
  22. Neppolian, B.; Doronila, A.; Grieser, F.; Kumar, M.A. Simple and efficient sonochemical method for the oxidation of Arsenic (III) to Arsenic (V). Environ. Sci. Technol. 2009, 43, 6793–6798. [Google Scholar] [CrossRef] [PubMed]
  23. Fouad, O.A.; Ismail, A.A.; Zaki, Z.I.; Mohamed, R.M. Zinc oxide thin films prepared by thermal evaporation deposition and its photocatalytic activity. Appl. Catal. B Environ. 2006, 62, 144–149. [Google Scholar] [CrossRef]
  24. Abhilash, M.R.; Akshatha, G.; Srikantaswamy, S. Photocatalytic dye degradation and biological activities of Fe2O3/Cu2O nanocomposite. RSC Adv. 2019, 9, 8557–8568. [Google Scholar] [CrossRef] [Green Version]
  25. Samadi, M.; Zirak, M.; Naseri, A.; Kheirabadi, M.; Ebrahimi, M.; Moshfegh, A.Z. Design and tailoring of one-dimensional ZnO nanomaterials for photocatalytic degradation of organic dyes: A review. Res. Chem. Intermediat. 2019, 45, 2197–2254. [Google Scholar] [CrossRef]
  26. Shamsipur, M.; Rajabi, H.R. Study of photocatalytic activity of ZnS quantum dots as efficient nanoparticles for removal of methyl violet: Effect of ferric ion doping. Spectrochim. Acta Mol. Biomol. Spectrosc. 2014, 122, 260–267. [Google Scholar] [CrossRef]
  27. Rajabi, H.R.; Farsi, M. Effect of transition metal ion doping on the photocatalytic activity of ZnS quantum dots: Synthesis, characterization and application for dye decolorization. J. Mol. Catal. A Chem. 2015, 399, 53–61. [Google Scholar] [CrossRef]
  28. Chen, Z.; Li, D.; Zhang, W.; Shao, Y.; Chen, T.; Sun, M.; Fu, X. Photocatalytic degradation of dyes by ZnIn2S4 microspheres under visible light irradiation. J. Phys. Chem. C 2009, 113, 4433–4440. [Google Scholar] [CrossRef]
  29. Wang, C.; Gao, X.; Ma, Q.; Su, X. Aqueous synthesis of mercaptopropionic acid capped Mn2+-doped ZnSe quantum dots. J. Mater. Chem. 2009, 19, 7016–7022. [Google Scholar] [CrossRef]
  30. Jia, Y.; Shen, S.; Wang, D.; Wang, X.; Shi, J.; Zhang, F.; Han, H.; Li, C. CompositeSr2TiO4/SrTiO3(La,Cr) heterojunction based photocatalyst for hydrogen production under visible light irradiation. J. Mater. Chem. A 2013, 1, 7905–7912. [Google Scholar] [CrossRef]
  31. Bhargava, R.N.; Gallagher, D.; Hong, X.; Nurmikko, A. Optical properties of manganese-doped nanocrystals of ZnS. Phys. Rev. Lett. 1994, 72, 416–419. [Google Scholar] [CrossRef]
  32. Colvin, V.L.; Schlamp, M.C.; Alivisatos, A.P. Light-emitting diodes made from cadmium selenide nanocrystals and a semiconducting polymer. Nature 1994, 370, 354–357. [Google Scholar] [CrossRef]
  33. Klimov, V.I.; Ivanov, S.A.; Nanda, J.; Achermann, M.; Bezel, I.; McGuire, J.A. Piryatinski, single-exciton optical gain in semiconductor nanocrystals. Nature 2007, 447, 441–446. [Google Scholar] [CrossRef]
  34. Radovanovic, P.V.; Gamelin, D.R. High-temperature ferromagnetism in Ni2+-doped ZnO aggregates prepared from colloidal diluted magnetic semiconductor quantum dots. Phys. Rev. Lett. 2003, 91, 1572021–1572024. [Google Scholar] [CrossRef] [Green Version]
  35. Hanif, K.M.; Meulenberg, R.W.; Strouse, G.F. Magnetic ordering in doped Cd (1−x) Co(x)Se diluted magnetic quantum dots. J. Am. Chem.Soc. 2002, 124, 11495–11502. [Google Scholar] [CrossRef]
  36. Greenham, N.C.; Peng, X.; Alivisatos, A.P. Charge separation and transport in conjugated-polymer/semiconductor-nanocrystal composites studied by photoluminescence quenching and photoconductivity. Phys. Rev. B Condens. Matter 1996, 54, 17628–17637. [Google Scholar] [CrossRef]
  37. Rao, S.S.; Durga, I.K.; Varma, C.V.T.; Punnoose, D.; Kim, S.K.; Kim, H.J. Enhance the performance of quantum dot-sensitized solar cell by manganese-doped ZnS films as a passivation layer. Org. Electron. 2015, 26, 200–207. [Google Scholar]
  38. Chang, L.; Wu, H.; He, X.; Chen, L.; Zhang, Y. A highly sensitive fluorescent turn-on biosensor for glycoproteins based on boronic acid functional polymer capped Mn-doped ZnS quantum dots. Anal. Chim. Acta 2017, 995, 91–98. [Google Scholar] [CrossRef] [PubMed]
  39. Diestra, D.D.; Huarac, J.B.; Rincon, D.P.; Gonzalez-Feliciano, J.A.; Gonzalez, C.I.; Weiner, B.R.; Morell, G. Biocompatible ZnS:Mn quantum dots for reactive oxygen generation and detection in aqueous media. J. Nanopart. Res. 2015, 17, 46101–46114. [Google Scholar] [CrossRef] [PubMed] [Green Version]
  40. Chan, W.C.; Nie, S. Quantum dot bioconjugates for ultrasensitive non isotopic detection. Science 1998, 281, 2016–2018. [Google Scholar] [CrossRef] [Green Version]
  41. Patel, J.; Jain, B.; Singh, A.K.; Susan, M.A.B.H.; Paul, L.J. Mn-doped ZnS quantum dots–an effective nanoscale sensor. Microchem. J. 2020, 155, 104755. [Google Scholar] [CrossRef]
  42. Geng, Y.; Guo, M.; Tan, J.; Huang, S.; Tang, Y.; Tan, L.; Liang, Y. The fabrication of highly ordered fluorescent molecularly imprinted mesoporous microspheres for the selective sensing of sparfloxacinin biological samples. Sens. Actuators B Chem. 2019, 281, 821–829. [Google Scholar] [CrossRef]
  43. Pradhan, N.; Goorskey, D.; Thessing, J.; Peng, X.G. An alternative of CdSe nanocrystal emitters: Pure and tunable impurity emissions in ZnSe nanocrystals. J. Am. Chem. Soc. 2005, 127, 17586–17587. [Google Scholar] [CrossRef] [PubMed]
  44. Gurung, G.; Ekanayaka, T.K.; Yost, A.J.; Paudel, T.R. Absorption enhancement by transition metal doping in ZnS. Mater. Res. Express 2019, 6, 126550. [Google Scholar] [CrossRef]
  45. Ramasamy, V.; Praba, K.; Murugadoss, G. Synthesis and study of optical properties of transition metals doped ZnS nanoparticles. Spectrochim. Acta A Mol. Biomol. Spectrosc. 2012, 96, 963–971. [Google Scholar] [CrossRef]
  46. Sridevi, D.; Rajendran, K.V. Enhanced photoluminescence of ZnS nanoparticles doped with transition and rare earth metallic ions. Chalcogenide Lett. 2010, 7, 397–401. [Google Scholar]
  47. Chen, H.; Shi, D.; Qi, J. Comparative studies on the magnetic properties of ZnS nanowires doped with transition metal atoms. J. Appl. Phys. 2011, 109, 084338. [Google Scholar] [CrossRef]
  48. Chen, H.; Shi, D.; Qi, J.; Wang, B. First-principles study on the magnetic properties of transition-metal atoms doped (ZnS)12 cluster. J. Magn. Magn. Mater. 2011, 323, 781–788. [Google Scholar] [CrossRef]
  49. Akhtar, M.S.; Malik, M.A.; Alghamdi, Y.G.; Ahmad, K.S.; Riaz, S.; Naseem, S. Chemical bath deposition of Fe-doped ZnS thin films: Investigations of their ferromagnetic and half-metallic properties. Mater. Sci. Semicond. Process. 2015, 39, 283–291. [Google Scholar] [CrossRef]
  50. Lovric, J.; Bazzi, H.S.; Cuie, Y.; Fortin, G.R.A.; Winnik, F.M. Maysinger, differences in subcellular distribution and toxicity of green and red emitting CdTe quantum dots. J. Mol. Med. 2005, 83, 377–385. [Google Scholar] [CrossRef] [PubMed]
  51. Kirchner, C.; Liedl, T.; Kudera, S.; Pellegrino, T.; Javier, A.M.; Gaub, H.E.; Stolzle, S.; Fertig, N.; Parak, W.J. Cytotoxicity of colloidal CdSe and CdSe/ZnS nanoparticles. Nano Lett. 2005, 5, 331–338. [Google Scholar] [CrossRef]
  52. Gobara, H.M.; Elsalamony, R.A.; Hassan, S.A. Sonophotocatalytic degradation of eriochrome black-T dye in water using Ti grafted SBA-15. J. Porous Mater. 2016, 23, 1311–1318. [Google Scholar] [CrossRef]
  53. Gautam, A.; Kshirsagar, A.; Biswas, R.; Banerjee, S.; Khanna, P.K. Photodegradation of organic dyes based on anatase and rutile TiO2 nano-particles. RSC Adv. 2016, 6, 2746–2759. [Google Scholar] [CrossRef]
  54. Mamba, G.; Mbianda, X.Y.; Mishra, A.K. Enhanced visible light photocatalytic degradation of eriochrome black T and eosin blue shade in water using tridoped titania decorated on SWCNTs and MWCNTs: Effect of the type of carbon nanotube incorporated. Mater. Chem. Phys. 2015, 149–150, 734–742. [Google Scholar] [CrossRef]
  55. Jassal, V.; Shanker, U.; Kaith, B.S.; Shankar, S. Green synthesis of potassium zinc hexacyanoferrate nanocubes and their potential application in photocatalytic degradation of organic dyes. RSC Adv. 2015, 5, 26141–26149. [Google Scholar] [CrossRef]
  56. Sharma, S.; Chaturvedi, N.; Chaturvedi, R.K.; Sharma, M.K. Photocatalytic degradation of eriochrome black t using ammonium phosphomolybdate semiconductor. Int. J. Chem. Sci. 2010, 8, 1580–1590. [Google Scholar]
  57. Kazeminezhad, I.; Sadollahkhani, A. Photocatalytic degradation of Eriochrome black-T dye using ZnO nanoparticles. Mater. Lett. 2014, 120, 267–270. [Google Scholar] [CrossRef]
  58. La Porta, F.A.; Ferrer, M.M.; Santana, Y.V.B.; Raubach, C.W.; Longo, V.M.; Sambrano, J.R.; Longo, E.; Andres, J.; Li, M.S.; Varela, J.A. Synthesis of wurtzite ZnS nanoparticles using the microwave assisted solvothermal method. J. Alloys. Compds. 2013, 556, 153–159. [Google Scholar] [CrossRef]
  59. Zhou, C.; Song, J.; Zhou, L.; Zhong, L.; Liu, J.; Qi, Y. Greener synthesis and optimization of highly photoluminescence Mn2+-Doped ZnS quantum dots. J. Lumin. 2015, 158, 176–180. [Google Scholar] [CrossRef]
  60. Yu, F.P.; Ou, S.L.; Yao, P.C.; Wu, B.R.; Wu, D.S. Structural, surface morphology and optical properties of ZnS Films by chemical bath deposition at various Zn/S molar ratios. J. Nanomater. 2014, 2014, 594952. [Google Scholar] [CrossRef]
  61. Rajabi, H.R.; Farsi, M. Quantum dot based photocatalytic decolorization as an efficient and green strategy for the removal of anionic dye. Mater. Sci. Semicond. Process. 2015, 31, 478–486. [Google Scholar] [CrossRef]
  62. Shah, S.I.; Li, W.; Huang, C.P.; Jung, O.; Ni, C. Study of Nd3+, Pd2+, Pt4+, and Fe3+ dopant effect on photoreactivity of TiO2 nanoparticle. Proc. Natl. Acad. Sci. USA 2002, 99, 6482–6486. [Google Scholar] [CrossRef] [Green Version]
  63. Tauc, J. Optical Properties of Solids; Academic Press Inc.: New York, NY, USA, 1966. [Google Scholar]
  64. Pouretedal, H.R.; Keshavarz, M.H.; Yosefi, M.H.; Shokrollahi, A.; Zali, A. Photodegradation of HMX and RDX in the presence of nanocatalyst of zinc sulfide doped with copper. Iran. J. Chem. Chem. Eng. 2009, 28, 13–19. [Google Scholar]
  65. Mall, M.; Kumar, L. Optical studies of Cd2+ and Mn2+ Co-doped ZnS nanocrystals. J. Lumin. 2010, 130, 660–665. [Google Scholar] [CrossRef]
  66. Lippens, P.E.; Lannoo, M. Calculation of the band gap for small CdS and ZnS crystallites. Phys. Rev. B 1989, 39, 10935–10942. [Google Scholar] [CrossRef] [PubMed]
  67. Brus, L. Electronic wave functions in semiconductor clusters: Experiment and theory. J. Phys. Chem. 1986, 90, 2555–2560. [Google Scholar] [CrossRef]
  68. Dong, B.; Cao, L.; Sua, G.; Liu, W. Synthesis and characterization of Mn doped ZnS d-dots with controllable dual-color emissions. J. Coll. Interf. Sci. 2012, 367, 178–182. [Google Scholar] [CrossRef] [PubMed]
  69. Gong, Y.; Fan, Z. Melamine modulated mercaptopropionic acid capped manganese doped zinc sulphide quantum dots as a room-temperature phosphorescence sensor for detecting clenbuterol in biological fluids. Sens. Actuators B 2014, 202, 638–644. [Google Scholar] [CrossRef]
  70. Wang, Y.; Liang, X.; Ma, X.; Hu, Y.; Hu, X.; Li, X.; Fan, J. Simple and greener synthesis of highly photoluminescence Mn2+-doped ZnS quantum dots and its surface passivation mechanism. Appl. Surf. Sci. 2014, 316, 54–61. [Google Scholar] [CrossRef]
  71. Singhal, M.; Sharma, J.K.; Jeon, H.C.; Kang, T.W.; Kumar, S. Effect of pyridine capping on morphological and optical properties of Zns:Mn2+ core–shell quantum dots. J. Mater. Sci. Mater. Electron. 2016, 27, 3003–3010. [Google Scholar] [CrossRef]
  72. Singhal, M.; Sharma, J.K.; Kumar, S. Morphological and optical behaviour of pyridine capped bio-compatible ZnS quantum dots. Adv. Sci. Eng. Med. 2012, 4, 133–139. [Google Scholar] [CrossRef]
  73. Taylor, L.D. The infrared spectrum of nicotinic acid. J. Org. Chem. 1962, 27, 4064–4065. [Google Scholar] [CrossRef]
  74. Trivedi, M.K.; Branton, A.; Trivedi, D.; Nayak, G.; Bairwa, K.; Jana, S. Spectroscopic characterization of disulfiram and nicotinic acid after biofield treatment. J. Anal. Bioanal. Tech. 2015, 6, 1000265. [Google Scholar]
  75. Basha, S.J.; Khidhirbrahmendra, V.; Madhavi, J.; Thampy, U.U.; Reddy, C.V.; Ravikumar, R.V.S.S.N. Structural, optical, magnetic and thermal investigations on Cr3+ ions doped ZnS nanocrystals by co-precipitation method. J. Sci. Adv. Mater. Devices 2019, 4, 260–266. [Google Scholar] [CrossRef]
  76. Basha, S.J.; Khidhirbrahmendra, V.; Avinash, M.; Reddy, N.B.; Zyryanov, G.V.; Ravikumar, R.V.S.S.N. Structural, magnetic and thermal propertiesof Mn2+ doped ZnS nanocrystals for device applications. AIP Conf. Proc. 2019, 2063, 040006. [Google Scholar]
  77. Shanmugam, N.; Cholan, S.; Viruthagiri, G.; Gobi, R.; Kannadasan, N. Synthesis and characterization of Ce3+-doped flowerlike ZnS nanorods. Appl. Nanosci. 2014, 4, 359–365. [Google Scholar] [CrossRef] [Green Version]
  78. Saha, B.; Das, S.; Saikia, J.; Das, G. Preferential and enhanced adsorption of different dyes on iron oxide nanoparticles: A comparative study. J. Phys. Chem. C 2011, 115, 8024–8033. [Google Scholar] [CrossRef]
  79. Kansal, S.K.; Sood, S.; Umar, A.; Mehta, S.K. Photocatalytic degradation of Eriochrome Black T dye using well-crystalline anatase TiO2 nanoparticles. J. Alloys Compd. 2013, 581, 392–397. [Google Scholar] [CrossRef]
  80. Singla, P.; Sharma, M.; Singh, K.; Pandey, O.P. Synthesis and characterization of Zinc doped nano TiO2 for efficient photocatalytic degradation of Eriochrome Black T. AIP Conf. Proc. 2013, 1536, 103–104. [Google Scholar]
  81. Derazkola, S.M.; Ajabshir, S.Z.; Niasari, M.S. Facile hydrothermal and novel preparation of nanostructured Ho2O3 for photodegradation of eriochrome black T dye as water pollutant. Adv. Powder Technol. 2017, 28, 747–754. [Google Scholar] [CrossRef] [Green Version]
  82. Ajabshir, S.Z.; Derazkola, S.M.; Niasari, M.S. Schiff-base hydrothermal synthesis and characterization of Nd2O3 nanostructures for effective photocatalytic degradation of eriochrome black T dye as water contaminant. J. Mater. Sci. Mater. Electron. 2017, 28, 17849–17859. [Google Scholar] [CrossRef]
  83. Kaur, J.; Singhal, S. Highly robust light driven ZnO catalyst for the degradation of eriochrome black T at room temperature. Superlattice Microst. 2015, 83, 9–21. [Google Scholar] [CrossRef]
  84. Saritha, B.; Chockalingam, M.P. Photodegradation of eriochrome black-t dye from aqueous medium by photocatalysis. IJPAMS 2017, 116, 183–187. [Google Scholar]
  85. Preethi, M.E.L.; Priya, A.; Thiriveni, S. Solar light driven degradation of Eriochrome Black T by photocatalysis. IOSR-JAC 2015, 8, 55–62. [Google Scholar]
  86. Siddhi, I.; Disha, D. Bioremediation of azo dye: Eriochrome black t by the novel organism Bacillus lentus. Bio. Disc. 2017, 8, 771. [Google Scholar]
  87. Deepa, K.P.; Panneerselvam, A.; Thajuddin, N. A Study on the waning effect of oil spill isolated miocroalga Coelastrella Sp. on a synthetic dye, eriochrome black t. Asian J. Microbiol. Biotechnol. Environ. Sci. 2019, 21, 205. [Google Scholar]
  88. Abdelmalek, F.; Ghezzar, M.R.; Belhadj, M.; Addou, A. Bleaching and degradation of textile dyes by nonthermal plasma process at atmospheric pressure jean-louis brisset. Ind. Eng. Chem. Res. 2006, 45, 23–29. [Google Scholar] [CrossRef]
  89. Dave, P.N.; Kaur, S.; Khosla, E. Removal of erichrome black t by adsorption on to eucalyptus bark using green technology. Ind. J. Chem. Technol. 2011, 18, 53–60. [Google Scholar]
  90. Wen, H.; Zhang, D.; Gu, L.; Yu, H.; Pan, M.; Huang, Y. Preparation of sludge-derived activated carbon by fenton activation and the adsorption of eriochrome black t. Materials 2019, 12, 882. [Google Scholar] [CrossRef] [Green Version]
  91. Almeida, J.M.F.; Oliveira, E.S.; Silva, I.N.; de Souza, S.P.M.C.; Fernandes, N.S. Adsorption of Erichrome Black T from aqueous solution onto expanded perlite modified with orthophenanthroline. Rev. Virtual Quim. 2017, 9, 502–513. [Google Scholar] [CrossRef]
  92. Rao, Y.; Yang, H.; Xue, D.; Guo, Y.; Qi, F.; Ma, J. Sonolytic and sonophotolytic degradation of carbamazepine: Kinetic and mechanism. Ultrason. Sonochem. 2016, 32, 371–379. [Google Scholar] [CrossRef]
  93. Geng, N.; Chen, W.; Xu, H.; Ding, M.; Liu, Z.; Shen, Z. A sono-photocatalyst for humic acid removal from water: Operational parameters, kinetics and mechanism. Ultrason. Sonochem. 2019, 57, 242–252. [Google Scholar] [CrossRef]
  94. Hartmann, J.; Bartels, P.; Mau, U.; Witter, M.; Tumpling, W.V.; Hofmann, J.; Nietzschmann, E. Degradation of the drug diclofenac in water by sonolysisin presence of catalysts. Chemosphere 2008, 70, 453–461. [Google Scholar] [CrossRef]
  95. Ince, N.H.; Tezcanli-Guyer, G.; Belen, R.K.; Apikyan, I.G. Ultrasound as a catalyzer of aqueous reaction systems: The state of the art and environmental applications. Appl. Catal. B Environ. 2001, 29, 167–176. [Google Scholar] [CrossRef]
  96. Yadav, S.; Asthana, A.; Chakraborty, R.; Jain, B.; Singh, A.K.; Carabineiro, S.A.C.; Susan, M.A.B.H. Cationic dye removal using novel magnetic/activated charcoal/β-cyclodextrin/alginate polymer nanocomposite. Nanomaterials 2020, 10, 170. [Google Scholar] [CrossRef] [PubMed] [Green Version]
  97. Shrivastava, V.S. Photocatalytic degradation of methylene blue dye and chromium metal from wastewater using nanocrystalline TiO2 semiconductor. Arch. Appl. Mech. 2012, 4, 1244–1254. [Google Scholar]
  98. Daneshvar, N.; Khataee, A.R. Removal of azo dye C.I. acid red from contaminated water using Fenton, UV/H2O2, UV/H2O2/Fe(II), UV/H2O2/Fe(III) and UV/H2O2/Fe(III)/oxalate processes: A comparative study. J. Environ. Sci. Health A 2006, 41, 315–328. [Google Scholar] [CrossRef] [PubMed]
  99. So, C.M.; Cheng, M.Y.; Yu, J.C.; Wong, P.K. Degradation of azo dye procion red MX-5B by photocatalytic oxidation. Chemosphere 2002, 46, 905–912. [Google Scholar] [CrossRef]
  100. Rajabi, H.R.; Karimi, F.; Kazemdehdashti, H.; Kavoshic, L. Fast sonochemically-assisted synthesis of pure and doped zinc sulfide quantum dots and their applicability in organic dye removal from aqueous media. J. Photochem. Photobiol. B Biol. 2018, 181, 98–105. [Google Scholar] [CrossRef]
  101. Rajabi, H.R.; Khani, O.; Shamsipur, M.; Vatanpour, V. High-performance pure and Fe3+-ion Doped ZnS quantum dots as green nanophotocatalysts for the removal of malachite green under UV-light irradiation. J. Hazard. Mater. 2013, 250, 370–378. [Google Scholar] [CrossRef]
  102. Yang, Q.; Liao, Y.; Mao, L. Kinetics of photocatalytic degradation of gaseous organic compounds on modified TiO2/AC composite photocatalyst. Chin. J. Chem. Eng. 2012, 20, 572–576. [Google Scholar] [CrossRef]
  103. Ullah, R.; Dutta, J. Photocatalytic degradation of organic dyes with manganese doped ZnO nanoparticles. J. Hazard. Mater. 2008, 156, 194–200. [Google Scholar] [CrossRef]
  104. Herrmann, J.M. Heterogeneous photocatalysis: Fundamentals and applications to the removal of various types of aqueous pollutants. Catal. Today 1999, 53, 115–129. [Google Scholar] [CrossRef]
  105. Daware, G.B.; Gogate, P.R. Sonochemical degradation of 3-methylpyridine (3MP) intensified using combination with various oxidants. Ultrason. Sonochem. 2020, 67, 105120. [Google Scholar] [CrossRef] [PubMed]
  106. Sivkumar, M.; Pandit, A.B. Ultrasound enhanced degradation of Rhodamine B: Optimization with power density. Ultrason. Sonochem. 2001, 8, 223–240. [Google Scholar] [CrossRef]
  107. Wang, S.; Wu, X.; Wang, Y.; Li, Q.; Tao, M. Removal of organic matter and ammonia nitrogen from landfill leachate by ultrasound. Ultrason. Sonochem. 2008, 15, 933–937. [Google Scholar] [CrossRef] [PubMed]
  108. Karimi, H.; Rajabi, H.R.; Kavoshi, L. Application of decorated magnetic nanophotocatalysts for efficient photodegradation of organic dye: A comparison study on photocatalytic activity of magnetic zinc sulfide and graphene quantum dots. J. Photochem. Photobiol. A Chem. 2020, 397, 112534. [Google Scholar] [CrossRef]
  109. Dai, H.; Li, H.; Li, Z.; Zhao, J.; Yu, X.; Sun, J.; An, Q. Sonication induced amorphisation in Ag nanowires. Sci. Rep. 2019, 9, 2114. [Google Scholar] [CrossRef]
  110. Kotronatou, A.; Mills, G.; Hoffmann, M.R. Ultrasonic irradiation of p-nitrophenol in aqueous solution. J. Phys. Chem. 1991, 95, 3630–3638. [Google Scholar] [CrossRef]
  111. Suslick, K.S.; Crum, L.A. Encyclopedia of Acoustics; Crocker, M.J., Ed.; Wiley Interscience: New York, NY, USA, 1997; Volume 1, pp. 271–282. [Google Scholar]
  112. Jyothi, K.P.; Yesodharan, S.; Yesodharan, E.P. Yesodharan ultrasound (US), ultraviolet light (UV) and combination (US + UV) assisted semiconductor catalysed degradation of organic pollutants in water: Oscillation in the concentration of hydrogen peroxide formed in situ. Ultrason. Sonochem. 2014, 21, 1787–1796. [Google Scholar] [CrossRef]
  113. Chen, Y.C.; Smirniotis, P. Enhancement of photocatalytic degradation of phenol and chlorophenols by ultrasound. Ind. Eng. Chem. Res. 2002, 41, 5958–5965. [Google Scholar] [CrossRef]
  114. Montazerozohori, M.; Nasr-Esfahani, M.; Joohari, S. Photocatalytic degradation of an organic dye in some aqueous buffer solutions using nano titanium dioxide: A kinetic study. Environ. Prot. Eng. 2012, 38, 45–55. [Google Scholar] [CrossRef]
  115. Kumar, K.; Chitkara, M.; Sandhu, I.S.; Mehta, D.; Kumar, S. Photocatalytic and magnetic properties of Zn1−xCrxO nanocomposites prepared by a co-precipitation method. Mater. Sci. Semicond. Process. 2015, 30, 142–151. [Google Scholar] [CrossRef]
  116. Kumar, M.A.; Grieser, F. Single bubble sonoluminescence- a chemist’s overview. Chem. Phys. Chem. 2004, 5, 439–448. [Google Scholar]
  117. Kumar, M.A.; Cozzoli, P.D. Advanced Wet-Chemical Synthetic Approaches to Inorganic Nanostructures; Transworld Research Network: Kerala, India, 2008; pp. 107–131. [Google Scholar]
  118. Neppolian, B.; Ciceri, L.; Bianchi, C.L.; Grieser, F.; Kumar, M.A. Sonophotocatalytic degradation of 4-chlorophenol using Bi2O3/TiZrO4 as a visible light responsive photocatalyst. Ultrason. Sonochem. 2011, 18, 135–139. [Google Scholar] [CrossRef]
  119. Zhang, L.S.; Wong, K.H.; Zhang, D.Q.; Hu, C.; Yu, J.C.; Chan, C.Y.; Wong, P.K. Zn:In(OH)ySz solid solution nanoplates: Synthesis, characterization, and photocatalytic mechanism. Environ. Sci. Technol. 2009, 43, 7883–7888. [Google Scholar] [CrossRef]
  120. Kaur, A.; Kansal, S.K. Bi2WO6 nanocuboids: An efficient visible light active photocatalyst for the degradation of levofloxacin drug in aqueous phase. Chem. Eng. J. 2016, 302, 194–203. [Google Scholar] [CrossRef]
  121. Leitner, N.K.V.; Dore, M. Hydroxyl radical induced decomposition of aliphatic acids in oxygenated and deoxygenated aqueous solutions. J. Photochem. Photobiol. A 1996, 99, 137–143. [Google Scholar] [CrossRef]
  122. Buxton, G.V.; Greenstock, C.L.; Helman, W.P.; Ross, A.B. Critical-review of rate constants for reactions of hydrated electrons, hydrogen-atoms and hydroxyl radicals (OH/O) in aqueous-solution. J. Phys. Chem. Ref. Data 1988, 17, 513–886. [Google Scholar] [CrossRef] [Green Version]
  123. Von Sonntag, C.; Schuchmann, H.P. Peroxyl Radicals in Aqueous Solutions; John Wiley & Sons: Chichester, UK, 1997. [Google Scholar]
  124. Acharya, L.; Nayak, S.; Pattnaik, S.P.; Acharya, R.; Parida, K. Resurrection of boron nitride in p-n type-II boron nitride/B-doped-g-C3N4 nanocomposite during solid-state Z-scheme charge transfer path for the degradation of tetracycline hydrochloride. J. Colloid Interface Sci. 2020, 566, 211–223. [Google Scholar] [CrossRef] [PubMed]
  125. Balu, S.; Chen, Y.L.; Juang, R.C.; Yang, T.C.K.; Juan, J.C. Morphology-controlled synthesis of aeFe2O3 nanocrystals impregnated on g-C3N4eSO3H with ultrafast charge separation for photoreduction of Cr (VI) under visible light. Environ. Pollut. 2020, 267, 115491. [Google Scholar] [CrossRef]
  126. Borhade, A.; Tope, D.; Kushare, S. Mercenaria shell powder as a cost-effective and eco-friendly photocatalyst for the degradation of eriochrome black t dye. Iran. J. Sci. Technol. Trans. Sci. 2020, 44, 75–83. [Google Scholar] [CrossRef]
Figure 1. (ac) TEM images, (d) distribution of particle sizes Mn2+:ZnS Qds.
Catalysts 11 01025 g001
Figure 2. (ac) SEM images of Mn2+:ZnS Qds; (d) EDX spectra of the marked area (spectrum 1).
Catalysts 11 01025 g002
Figure 3. (a) UV-Vis spectra and (b) optical band gap curve of Mn2+:ZnS Qds.
Catalysts 11 01025 g003
Figure 4. XRD patterns of (a) pure ZnS Qds and (b) Mn2+:ZnS Qds.
Catalysts 11 01025 g004
Figure 5. FTIR of Mn2+:ZnS Qds.
Catalysts 11 01025 g005
Figure 6. (a) Thermogravimetric analysis (TGA) and (b) differential thermal analysis (DTA) of Mn2+:ZnS Qds.
Catalysts 11 01025 g006
Figure 7. Fluorescence spectra of Mn2+:ZnS QDs with various percentages of Mn2+ ions (λex = 320 nm).
Catalysts 11 01025 g007
Figure 8. (a) SDB absorbance changes at the maximum wavelength (λmax = 560 nm) and (b) the kinetic model for the photodegradation in the presence of pure and Mn2+:ZnS Qds under optimum conditions (15 mL of 70 ppm SDB, pH 6, 75 min irradiation, 40 mg Qds).
Catalysts 11 01025 g008
Figure 9. Effect of ultrasound frequency on degradation of SDB at optimum conditions (15 mL of 70 ppm SDB, pH 6, 75 min irradiation, 40 mg Qds).
Catalysts 11 01025 g009
Figure 10. (a) SDB absorbance changes at maximum wavelength (λmax = 560 nm), (b) kinetic model for the ultrasound assisted degradation in the presence of pure and Mn2+:ZnS Qds, under optimum conditions (15 mL 70 ppm of SDB, pH 6, 75 min ultrasound irradiation, 40 mg Qds, 40 kHz), (c) SDB absorbance changes at absorption maximum (λmax = 560 nm) and (d) kinetic model for the ultrasound and UV light assisted degradation in the presence of pure and Mn2+:ZnS Qds at optimum conditions (15 mL of 70 ppm SDB, pH 6, 75 min ultrasound with UV light irradiation, 40 mg Qds, 40 kHz).
Catalysts 11 01025 g010aCatalysts 11 01025 g010b
Figure 11. (a) Second order kinetic model fitting to the Qds-based degradation of SDB data with pure and Mn2+:ZnS Qds and (b) absorption spectra of the SDB aqueous solution during sonophotocatalysis in the presence of Mn2+:ZnS Qds at optimum conditions (15 mL of SDB 70 ppm, pH 6, 75 min irradiation, 40 mg Qds).
Catalysts 11 01025 g011
Figure 12. Effect of variation of the initial concentration of SDB on the sonophotocatalytic degradation under optimum conditions (15 mL of SDB, pH 6, 75 min irradiation, 40 mg Qds).
Catalysts 11 01025 g012
Figure 13. Effect of variation of the amount of Mn2+:ZnS Qds catalyst on the sonophotocatalytic degradation of SDB under optimum conditions (15 mL of SDB 70 ppm, pH 6, 75 min irradiation, 40 kHz).
Catalysts 11 01025 g013
Figure 14. Influence of varying pH values on sonophotocatalytic degradation of SDB in the presence of Mn2+:ZnS Qds at optimum conditions (15 mL of SDB 70 ppm, 75 min irradiation, 40 mg Qds).
Catalysts 11 01025 g014
Figure 15. Effect of the variation of amount of Mn2+ dopant ions on the sonophotocatalytic degradation of SDB at optimum conditions (15 mL of 70 ppm SDB, pH 6, 75 min irradiation, 40 mg Qds).
Catalysts 11 01025 g015
Figure 16. Effect of power on degradation of SDB at optimum conditions (15 mL of SDB, pH 6, 75 min irradiation, 40 mg Qds).
Catalysts 11 01025 g016
Figure 17. Recycling performance of Mn2+:ZnS Qds over multiple cycles on sonophotocatalytic degradation of SDB.
Catalysts 11 01025 g017
Figure 18. XRD patterns of Mn2+:ZnS Qds before and after sonophotocatalytic degradation of SDB.
Catalysts 11 01025 g018
Figure 19. Mn2+:ZnS Qds based sonophotocatalytic degradation of SDB with different scavengers.
Catalysts 11 01025 g019
Figure 20. Trapping experiment: terephthalic acid tests for sonophotocatalytic, sonocatalytic and photocatalytic degradations of SDB.
Catalysts 11 01025 g020
Table 1. Comparison of the results obtained in the present work with literature studies of other researchers for the removal of Solochrome dark blue dye.
Catalyst% DegradationDye Conc., Catalyst Dose for Volume of Dye SolutionpHTimeRef.
Ti Grafted SBA-1588.7%Conc: 50 mg/L
Catalyst: 300 mg in 300 mL
-70 min[52]
TiO2 NanoparticlesAnatase 65%
Rutile 55.65%
Conc: 100 mg/L
Catalyst: 1000 mg
-150 min[53]
Iron Oxide Nanoparticles67%Conc: 200 mg/L
Catalyst: 2000 mg/L
5.020 min[78]
Anatase TiO2 Nanoparticles82%Conc: 25 mg/L
Catalyst: 25 mg in 100 mL
-90 min[79]
Undoped and Zn Doped Nano TiO2 NanoparticlesUndoped 88.73%
Doped 99.4%
Catalyst: 100 mg in 100 mL-6 h[80]
Nanostructured Ho2O380%Conc: 2 mg
Catalyst: 40 mg
-100 min[81]
Nanostructured Nd2O379%Conc: 2 mg
Catalyst: 80 mg
-100 min[82]
ZnO Nanoparticles90%Conc: 0.08 mM
Catalyst: 1000 mg/L in 100 mL
390 min[83]
TiO2 Nanoparticles92%Conc: 50 mg/L
Catalyst: 250 mg/L
5-[84]
TiO2 Nanoparticles100%Conc: 10−4 M
Catalyst: 300 mg in 100 mL
7240 min[85]
MWCNT/Nd, N, SeTiO2,
SWCNT/ Nd, N, SeTiO2
49.0%,
54.1%
Conc: 20 ppm
Catalyst:100 mg in 100 mL
-4 h[54]
Potassium Zinc Hexacyanoferratenanocubes76.13%Conc: 5 mg/L,
Catalyst: 15 mg in 10 mL
7120 min[55]
Ammonium Phosphomolybdate
Semiconductor
93.9%Conc: 10−3 M
Catalyst: 300 mg in 50 mL
11240 min[56]
Bacillus Lentus Bacteria SG-7 Strain98%Conc: 100 mg/L730 h[86]
Microalga Coellastrella85%Conc: 10 mg/L
Catalyst: 10% inoculum
820 days[87]
Non-Thermal Plasma Generated by Electric Discharges88.4%--60 min[88]
ZnO Nanoparticles75, 83, and 88% at pH 4, 8, 11Conc: 20 mg/L
Catalyst: 50 mg in 100 mL
4, 8, 11180 min[57]
Adsorption on Eucalyptus Bark77.33%Conc: 250 mg/L
Catalyst: 125 mg in 100 mL
8120 min[89]
Sludge-Derived Activated Carbon90.66%Conc: 500 mg/L,
Catalyst: 50 mL in 3000 mg/L
6720 min[90]
Perlite Modified with Orthophenanthroline63.74%Conc: 2 × 10⁻⁴ M
Catalyst: 50 mg in 20 mL
520 min[91]
Mn2+:ZnS Qds88%Conc: 70 mg/L
Catalyst: 40 mg in 15 mL
675 minThis Work
Publisher’s Note: MDPI stays neutral with regard to jurisdictional claims in published maps and institutional affiliations.

