Article

Synthesis, Characterization and Photoelectric Properties of Fe2O3 Incorporated TiO2 Photocatalyst Nanocomposites

1
Department of Physics, Faculty of Science, King Khalid University, Abha 61421, Saudi Arabia
2
Department of Physics, Faculty of Science, Assiut University, Assiut 71516, Egypt
3
Advanced Materials Department, Central Metallurgical R&D Institute (CMRDI), P.O. Box 87, Helwan 11421, Egypt
4
Department of Chemistry, Faculty of Science, Assiut University, Assiut 71516, Egypt
*
Authors to whom correspondence should be addressed.
Catalysts 2021, 11(9), 1062; https://doi.org/10.3390/catal11091062
Submission received: 6 August 2021 / Revised: 25 August 2021 / Accepted: 27 August 2021 / Published: 31 August 2021

Abstract

:
In the present work we report the sol-gel synthesis of pure TiO2 and (TiO2)1−x(Fe2O3)x nanocomposites with different Fe2O3 contents (x = 0, 0.1, 0.5, and 1.0 for pure TiO2, Fe2O3 incorporated 0.1, 0.5, and pure Fe2O3 which are denoted as PT, 0.1F, 0.5F, and PF, respectively). The structural, morphological, optical, and surface texture of the prepared nanocomposites were characterized using various techniques. The structural studies confirm the strong influence of Fe2O3 contents on the crystallite sizes and dislocation values. The size of the crystallites was increased by the increase in Fe2O3 contents. The bandgap values elucidated from DRS analysis were decreased from 3.15 eV to 1.91 eV with increasing Fe2O3 contents. The N2-Physorption analysis has confirmed the mesoporous nature of the samples with a comparable specific surface area of 35 m2/g. The photoelectrochemical measurements (CV, CA and EIS) were performed to assess the photoelectric properties of the prepared materials. It was found that the PT samples have the highest catalytic activity and photocurrent response compared to other composites. The reduction in current density was as follows: 2.8, 1.65, 1.5 and 0.9 mA/cm2, while the photocurrent response was ca. 800, 450, 45, 35 µA/cm2 for PT, 0.1F, 0.5F and PF samples, respectively. The EIS results showed that the (TiO2)1−x(Fe2O3)x nanocomposites exhibit lower charge transfer resistance than pure titania and hematite samples.

1. Introduction

Titanium dioxide (TiO2) nanoparticles (NPs) exhibit interesting potential applications in various fields such as sensors, catalysts, optical filters, anti-reflection coatings, etc. [1]. These TiO2 NPs are widely used in personal care products such as cosmetics, toothpaste, and sunscreen lotions [2,3,4]. The properties such as stability and non-toxicity make them available for a wide range of applications [5]. In addition to the properties mentioned above, TiO2 is also widely studied due to its electronic, optical, and photocatalytic activity [6,7]. Incorporating with metal ions such as iron, copper, zinc, nickel, chromium has been well addressed, altering the structure, chemical composition, and optical properties of TiO2 [8,9]. Amongst all, iron is the favorable ion to replace Ti in TiO2 as it has the ionic radius of Fe3+ (0.64 Å) which is comparable with Ti4+ (0.68 Å). Thus, Fe3+ can replace Ti4+ comfortably in the crystal structure of TiO2 with some defects.
Moreover, Fe3+ incorporating in TiO2 improves the photocatalytic activity under visible light [10] and reduces the optical bandgap [11]. Moreover, Fe-doped TiO2 has applications in spintronic and magneto-optic devices [12]. Application of Fe-doped TiO2 in gas sensor and photocatalytic degradation prepared from ball milling method was successfully presented by Sunil et al. [13]. Hussain et al. has studied the electrical, optical, and magnetic properties of Fe-doped TiO2 nanotubes [14]. In the literature, there are a variety of approaches for synthesizing Fe-doped TiO2 NPs such as the hydrothermal method [10], thermal hydrolysis [15], wet-chemical synthesis [16], and sol-gel method [17]. The influence of annealing at different temperatures was also studied by Gareso et al. [18] using the co-precipitation method. Rodriguez and co-workers [19] used the sol-gel technique for the synthesis of Fe-incorporated TiO2 and observed a decrease in the optical bandgap from 3.3 eV to 2.9 eV with enhanced absorption in the visible region as the incorporating concentration of Fe increases. Fe-doped TiO2 NPs prepared by the hydrothermal method were applied as an efficient electron mediator for the fabrication of hydrazine chemical sensor using glassy carbon electrode [20] which proves to be a sensitive sensor. The sol-gel routed spin coating technique was employed to synthesize Fe-doped TiO2 NPs and observed that the optical transmittance is was decreased with increasing Fe dopant concentrations [21]. Here, we chose the sol-gel method to synthesize Fe2O3-doped TiO2 NPs in the presence of diethanolamine. This method is easy and cost-effective and can obtain a high degree of purity, homogeneity and small particle size at low temperatures. Despite TiO2 is considered one of the most extensively investigated photocatalysts due to its chemical and photostability, low cost and availability [22,23]. Still, it suffers from a high recombination rate of photogenerated charge carriers and low activity in visible light due to its wide bandgap (Eg). One of the strategies that can overcome this problem is the fabrication of heterostructure with another narrower Eg visible active semiconductor [24]. Band alignment (CB and VB) between semiconductor photocatalysts is crucial. Therefore, we chose hematite Fe2O3 as a visible active photocatalyst (Eg = ca. 2 eV) and combined it with TiO2 to form the composite and investigated. Formation of internal electric field upon light irradiation and Fermi energy level alignment between TiO2 and Fe2O3 will promote the separation of photogenerated electron-hole pairs. Therefore, TiO2–Fe2O3 heterostructures were applied in different photocatalytic-based applications for instance as an effective photoanode for water oxidation in photoelectrochemical cells (PEC) [25], photoreduction of Cr(VI) [26], and dye degradation [27]. Some of the applications use external bias to reduce the recombination rate, as in the case of PEC applications. In view of these important and potential applications, it is worthwhile to study the different properties of Fe-doped TiO2. Hence, in the present work, pure and doped TiO2 with different Fe2O3 contents were prepared by the sol-gel technique. The prepared samples were denoted as PT, 0.1F, 0.5F, and PF for pure TiO2 and Fe doped 0.1, 0.5, and pure Fe2O3, respectively. These materials were subjected to characterize for structural, morphological, optical, and photoelectrochemical properties.

2. Results and Discussion

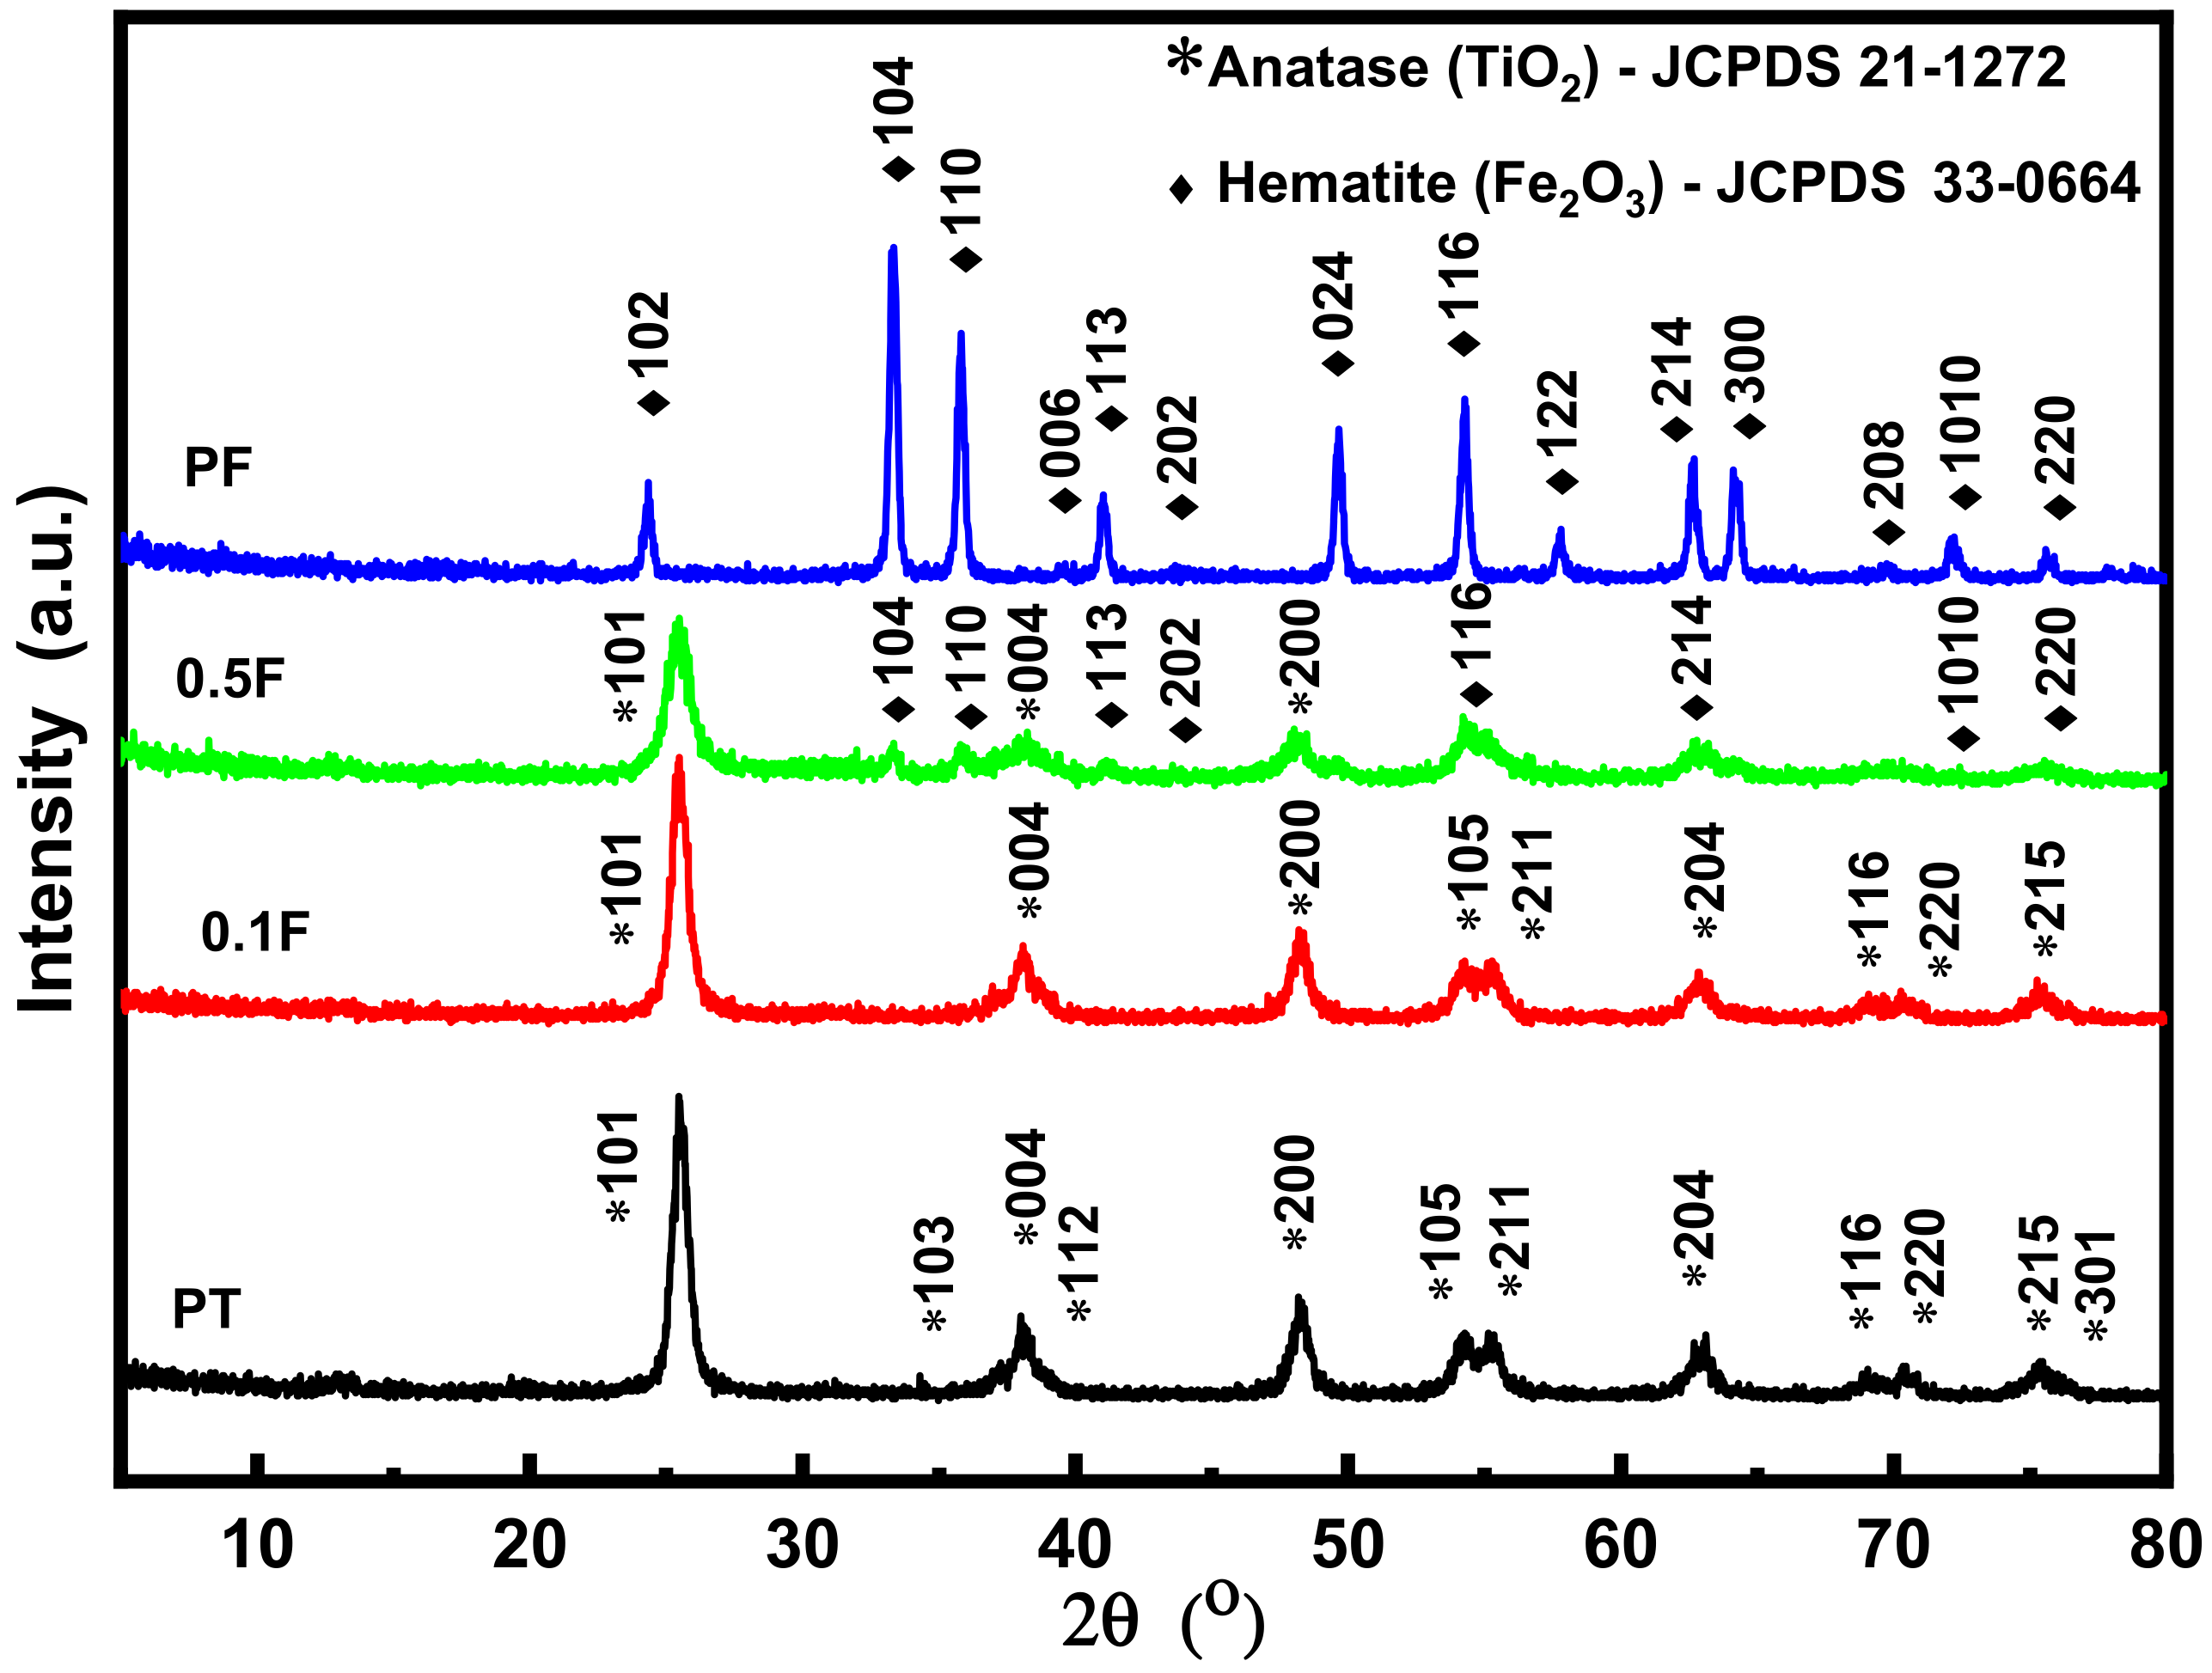
2.1. Structural Analysis

X-ray diffraction (XRD) studies were carried out to determine the structural and crystallite size information of the (TiO2)1−x(Fe2O3)x nanoparticles. Figure 1 displays the typical XRD pattern of Fe2O3–TiO2 nanocomposites, for different concentrations of Fe2O3 (TiO2)1−x(Fe2O3)x, where x = 0, 0.1, 0.5, and 1.0 for pure TiO2 and Fe2O3 contents 0.1, 0.5, and pure Fe2O3 which are denoted as PT, 0.1F, 0.5F, and PF, respectively). Pure TiO2 is found in three dominant crystal structures, anatase, rutile, and brookite in nature [28]. Among them, anatase form is the most common polymorph due to its lower surface energy, especially at the nanoscale [29]. From Figure 1, it is evident that the pure TiO2 is formed in the polycrystalline tetragonal anatase phase with multiple peaks marked with the asterisk (*) symbol and the planes are marked as (101), (103), (004), (112), (200), (105), (211), (204), (116), (220), (215) and (301) in Figure 1. The peaks are matching well with the ICDD pattern 21-1272. Similarly, the pure Fe2O3 is formed in the rhombohedral hematite structure matching well with the ICDD pattern# 33-0664. Figure 1 also displays the intermediate structures showing systematic changes with the Fe2O3 incorporating on TiO2 lattice, which is clearly evident from the changes in the peak intensities, emergence of new peaks and peak shifts happening with different dopant levels.
Scherrer’s formula was employed to calculate the mean crystal size (D) of the NPs from the XRD peaks using the following relation [30],
D = 0.9 λ β   cos θ
where λ is the X-ray wavelength, and β is the peak width at half maximum. The micro-strain (ε) and dislocation density (δ) values were also calculated using the relations.
ε = β   c o s θ 4
and
δ = 1 D 2
The obtained values are tabulated in Table 1. The results clearly show that the Fe2O3 concentration strongly influences the crystallite sizes and so the dislocation values. Microstrain values are almost the same. It can be inferred from the table that the crystallite size increases in general with the Fe2O3 content. The results are matched well with the results obtained by Zhao et al. [30]. Zhao et al. [31] synthesized a set of Fe2O3, TiO2 and TiO2/Fe2O3 multilayered thin films and found that the mean crystalline size increases with the Fe2O3, which is in accord with the present results. Tang et al. [32] report that the formation of Fe2O3 and TiO2 particles which are significantly affected by the concentration of hydrolysis liquid. The intensities of the characteristic peaks of both anatase and rutile phases increased with the hydrolysis liquid concentration.
The surface morphology studies and distribution of particles of the nanostructured material provide useful information about the utilization of the sample in various technological important applications. Figure 2 shows the scanning electron microscope (SEM) images of PT, 0.1F, 0.5F, and PF samples. It is quite evident that the Fe content has altered the surface morphology of the samples, notably. The pure TiO2 sample shows an irregular distribution of spherical and rectangular-shaped particles. When Fe is added to TiO2, the size of the particles reduces, and there are small particles observed throughout the surface of the sample. Apart from this, in the case of the pure Fe sample, a group of nanoparticles of larger size was observed. From morphology studies, it is clear that the decrease in grain size results in an increase in the surface area of the synthesized material and produces more active sites for adsorption of target contaminant and thus attacked by reactive oxygen species, which will be discussed later in this study. A similar type of decreasing particles size with an increasing percentage of incorporating was observed by Gareso et al. [18]. Moreover, it is also observed that the decrease in particle size with Fe dopant can make the synthesized catalyst a potential candidate for various photocatalysis and sensing applications.
Figure 3 shows the Raman spectra of PT, 0.1F, 0.5F, and PF samples. In Raman spectra, four main peaks were observed at 145 cm−1, 396 cm−1, 514 cm−1, and 637 cm−1, which belong to Eg, B1g, A1g + B1g, Eg mode, respectively. The main peaks observed in Raman spectra were well correlated to earlier reports confirms the phase of the prepared samples [20,33]. The position of the main peak at 145 cm−1 is slightly shifted towards a higher wavenumber when Fe was doped in TiO2. The shift in Raman bands is attributed to the incorporation of Fe that causes changes in defect structure and particle size. Moreover, a continuous decrease in the intensity of the Raman band (145 cm−1) was also observed at higher concentrations, suggesting a decrease in the particle size of synthesized photocatalysts with Fe2O3 incorporating. The vibrational properties of materials are significantly affected when the grain size decreases to the nanometer scale. Due to the size-induced radial strain, a volume contraction occurs primarily within the nanoparticles, which leads to an increase in force constants due to the decrease in interactor pressure. In the case of pure Fe material, the new peak at 1310 cm−1 reveals the hematite group of α-Fe2O3.
Figure 4 shows the Fourier-transform infrared spectroscopy (FT-IR) spectra of PT, 0.1F, 0.5F, and PF samples. From Figure 4, the band observed at around 3412 cm−1 was attributed to the presence of the stretching vibrations of the O-H groups of H2O molecules physically adsorbed on the surface of TiO2. This band is gradually shifted to a lower wavelength due to incorporating concentration, suggesting the crystal structure of Fe2O3 was distorted [34]. It is also observed that at higher incorporating concentration and in pure Fe material, the intensity of band is increased. Some weak bands are also observed at around 2919 cm−1 attributed to different vibrational modes of TiO2. Zhang et al. [34] observed peaks at 2928 cm−1, 2845 cm−1, 1502 cm−1, 1421 cm−1 and 1364 cm−1. These peaks are assigned to sp3 and sp2 C-H, C=O, unsaturated C-H and C-OH bonds, indicating the existence of carbon quantum dots (CQDs) in the composites [34]. In pure Fe, this band disappears, clearly suggesting the other vibration modes of TiO2. The stretching vibrations of the O-H groups were also observed at around 1645 cm−1. Wu et al. also observed the same peaks close to 1630 cm−1 [35]. The first one is attributed to the stretching vibration of the corresponding –OH derived from the hydroxyl radical or the adsorbed water on the TiO2 surface. The second peak close to 1630 cm−1 corresponds to the bending vibration of the H–O–H bond of the adsorbed water on the TiO2 surface. These results are a common feature of semiconductor oxides and a basic condition for photocatalysis. There are some other bands such as 1033, 1439, 557, 469 cm−1 also observed in the case of pure Fe and incorporating are attributed to vibration modes of Fe2O3 and can indicate the iron oxide formation at the structure of Fe2O3–TiO2 nanocomposites [36].

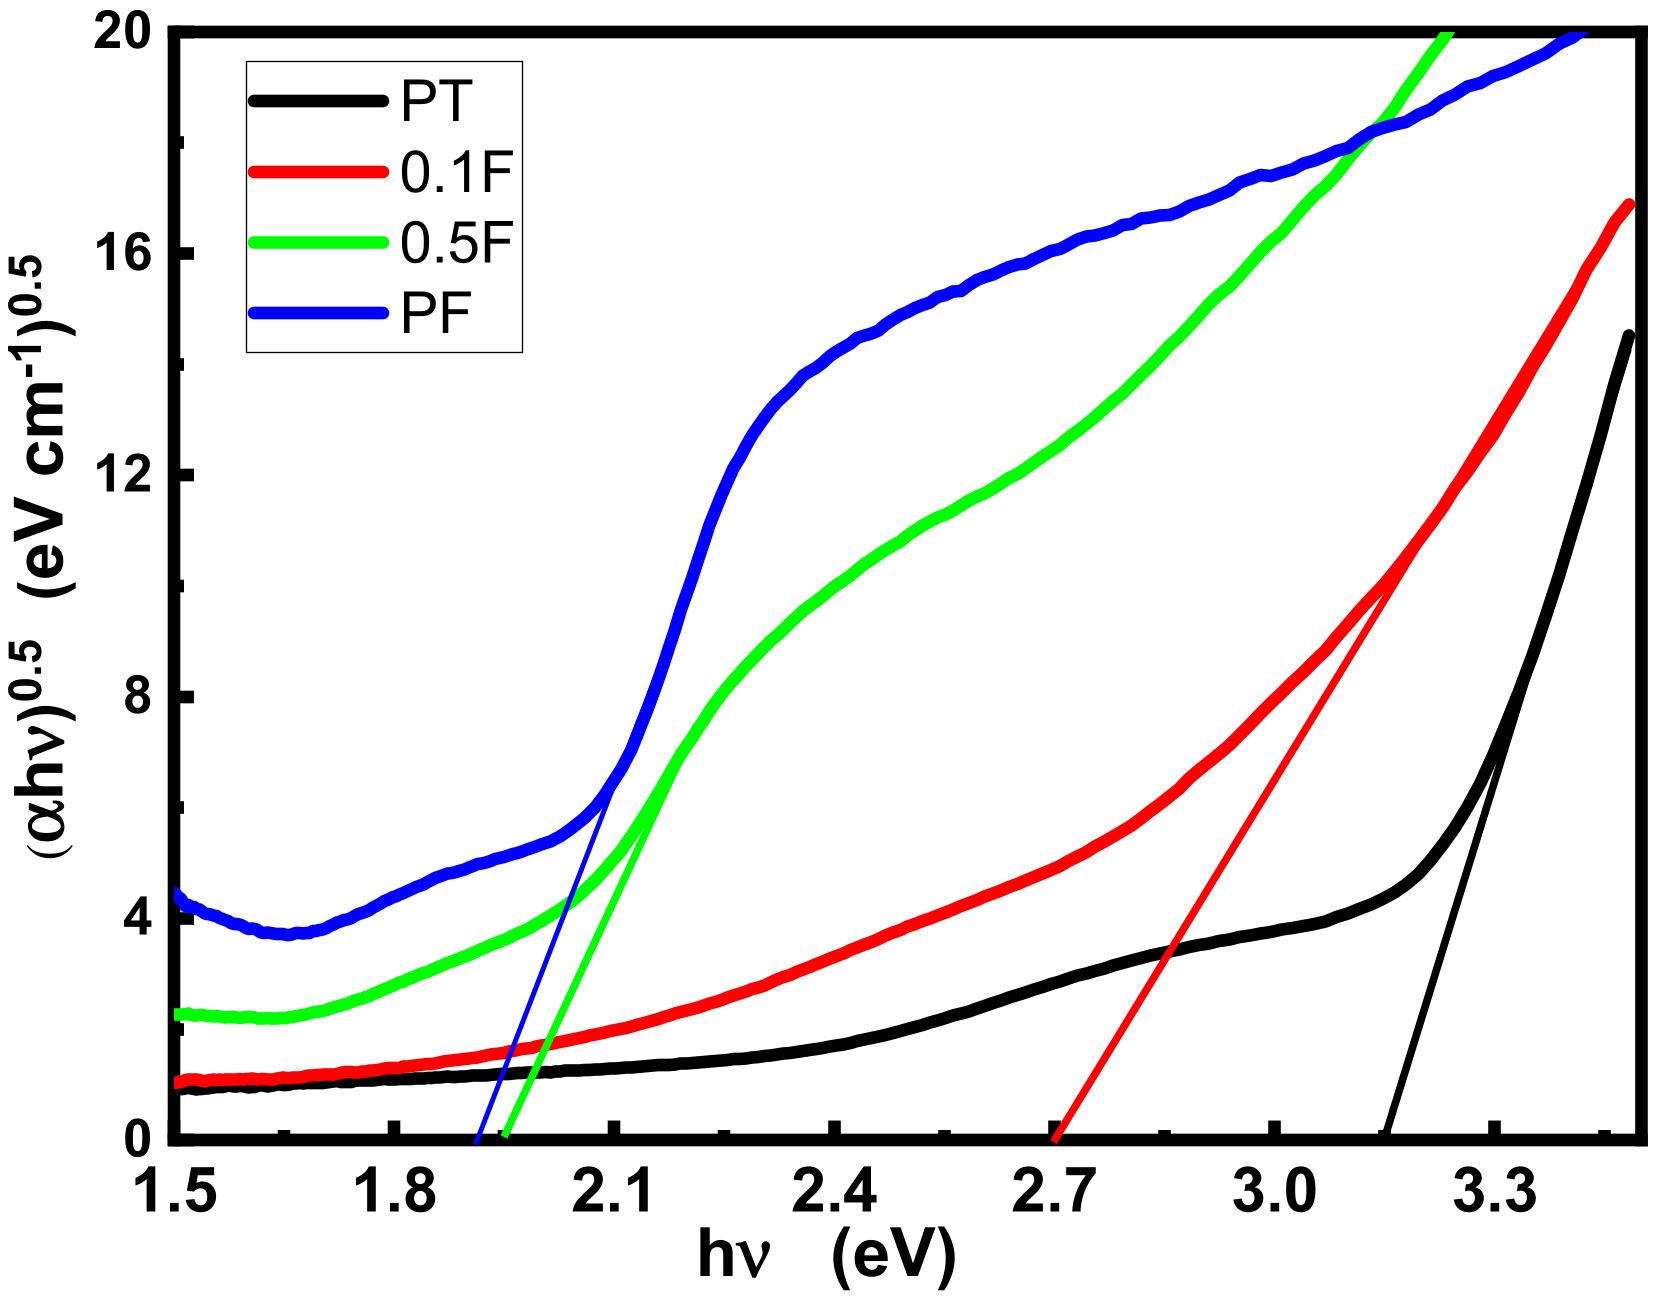
2.2. Optical Properties

Diffuse reflectance spectroscopy (DRS) is a unique technique to study the electronic structure of nanostructured materials. The non-destructive method of this technique allows us to measure exact values of the bandgap of powdered materials by a mirror-like reflection from the loaded samples by diffuse illumination. In literature, this method is well studied by the incident light is partially absorbed and scattered [37]. In the present case, pure TiO2, pure Fe2O3, and different concentrations of Fe2O3 doped TiO2 were subjected to DRS analysis and the corresponding spectra are shown in Figure 5. The optical bandgap of the present nanostructured material was determined from the following Kubelka–Munk model equations [38]:
F R = 1 R 2 2 R
F(R) is the Kubelka–Munk function, and R is the absolute reflectance. For calculating the (α), the Equation (4) is modified in terms of F(R) as [39,40]:
α   = absorbance t = F R t
where t is the height of the sample holder, which is equal to 2 mm, and the optical bandgap is calculated from Equation (6)
α h υ = F R h υ t n = A h υ E g     n
where α   absorption coefficient, E g   is bandgap, hν is the absorbed energy, A is the parameter that is related to the effective mass associated with the valence and conduction bands, and n (n = 1 2 for direct bandgap) is an optical transition. From Figure 6, with increasing the Fe2O3 incorporating concentration, the bandgap values are decreasing from 3.15 eV to 1.91 eV (see Table 2) as a result of incorporating Fe2O3 into the TiO2 lattice. The decreasing band gap with increasing incorporating concentration indicates that the present samples found huge applications in optoelectronic devices.

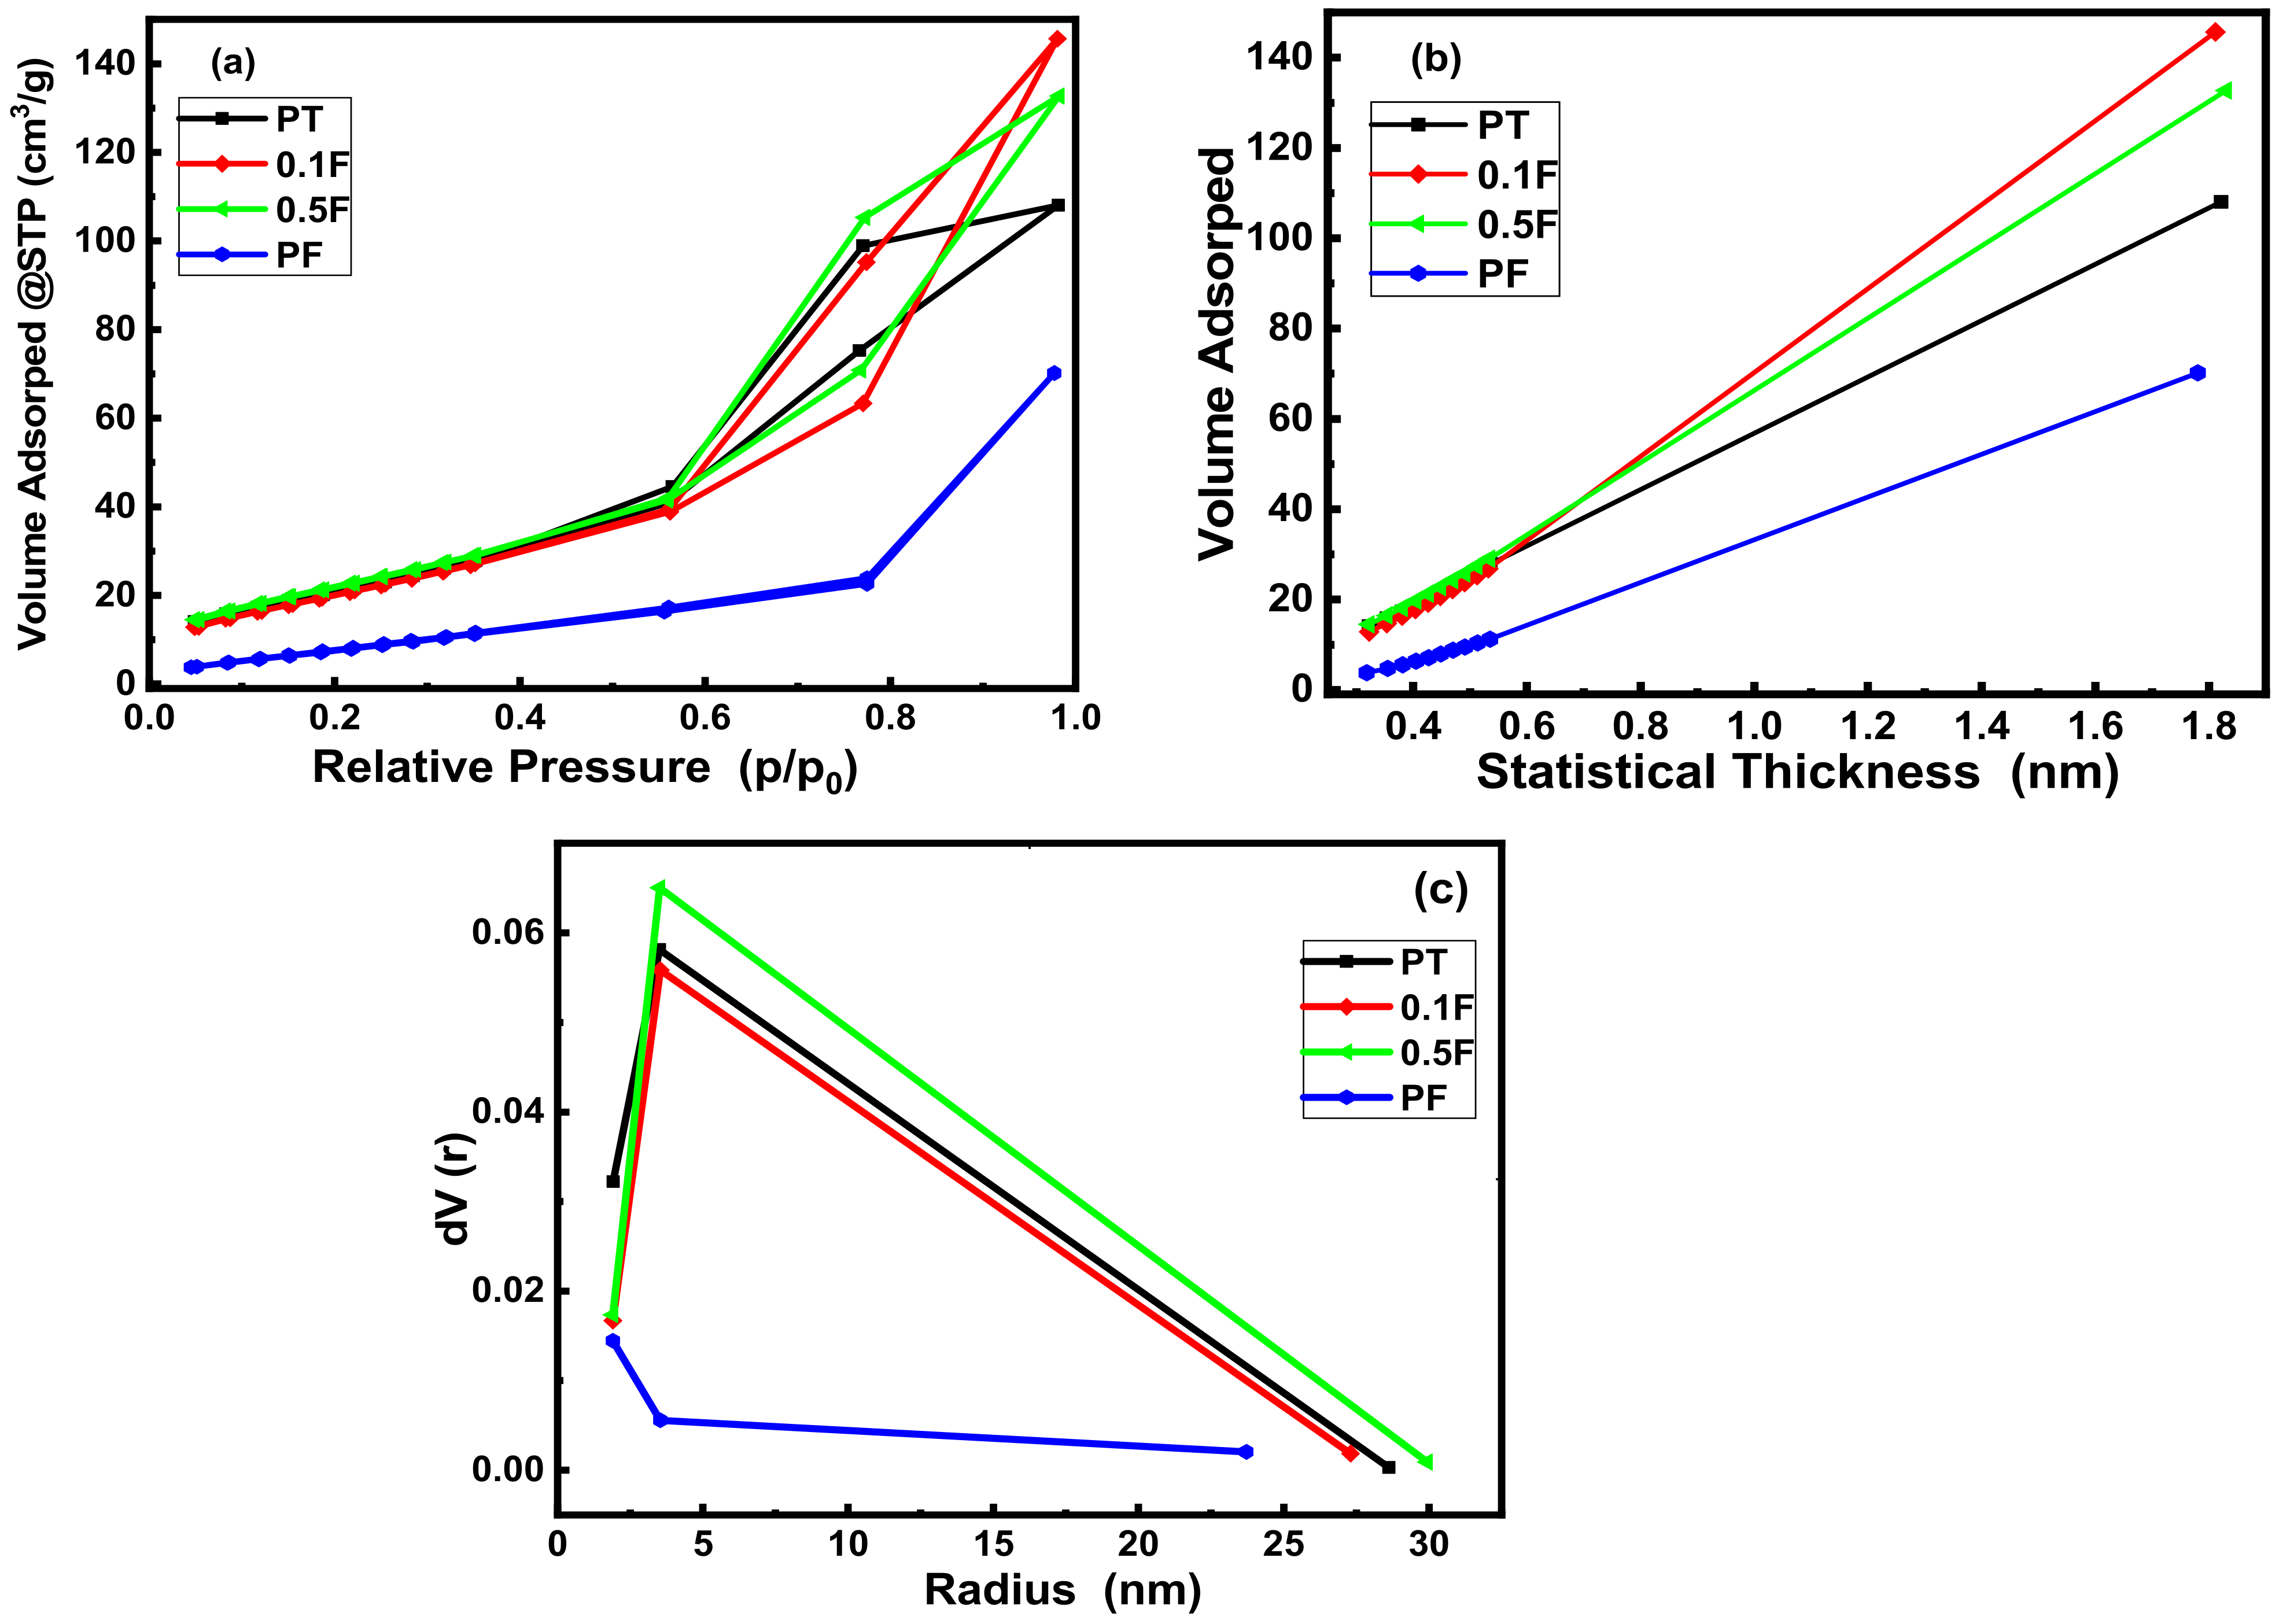
2.3. N2-Physorption Analysis

Specific surface area, surface texture, and pore size distribution were acquired via the N2-physisorption technique. N2 adsorption–desorption isotherms, Barrett, Joyner, and Halenda method (BJH) for calculating pore size distribution, and t-plot of the prepared composites are shown in Figure 7. As it can be seen, all the obtained isotherms are of Type III. The reversible Type III isotherm is represented as a convex to the x-axis over its entire range. It also reveals the multilayer formation process. It forms because of strong lateral interactions between adsorbed molecules in comparison to interactions between adsorbate and the adsorbent surface.
The BJH pore size distribution indicates that all samples are mesoporous in nature with an average pore radius of ca. 5 nm as shown in Table 3. Moreover, the t-plot method is a widely used procedure to estimate the total surface area and the external surface area of materials. For mesoporous materials, the adsorbed volume (V) varies linearly with the film thickness (t) and passes through the origin. The total surface area (Stot) is directly given by the slope of the first linear fit at low pressure. Once all pores are filled, adsorption occurs only on the external surface of the material and leads to a second linear fit at high pressure, the slope of which allows the determination of the external surface (Sext). The external surface area obtained for our samples was similar to the value of the BET surface area because of the mesoporous nature of the prepared composites. The values of BET-specific surface area, total pore volume and average pore radius are given in Table 3.

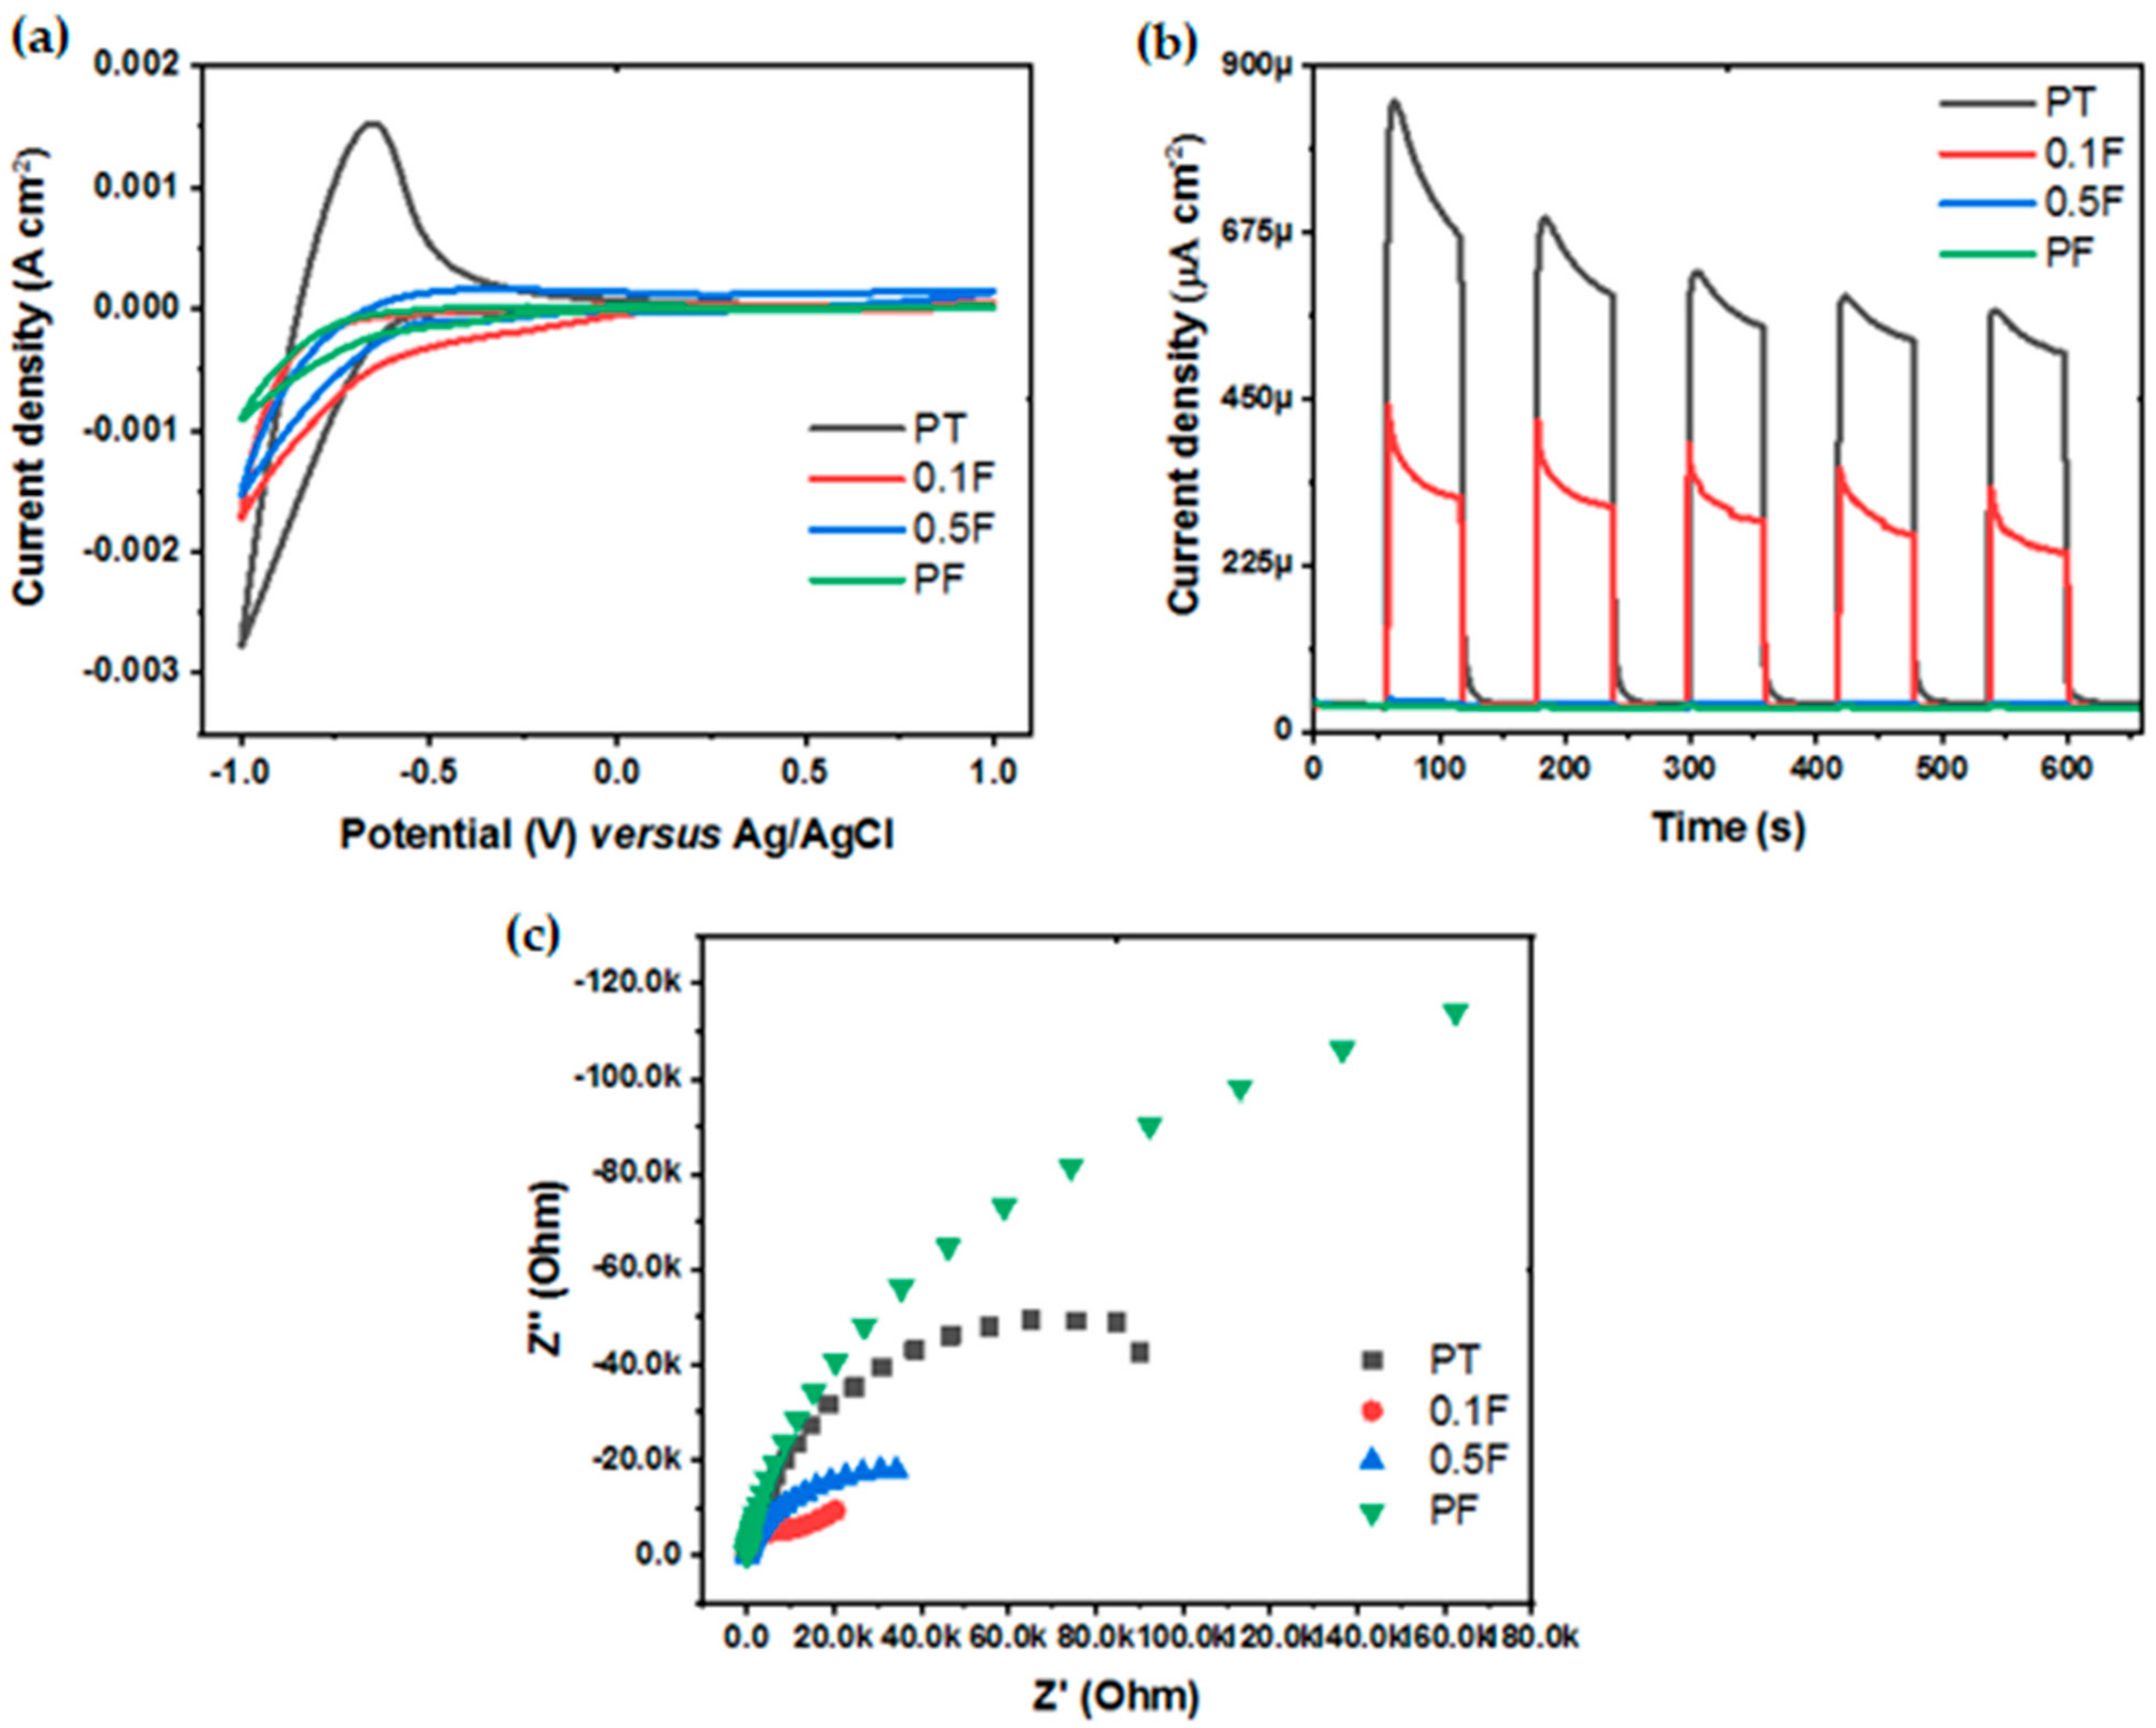
2.4. Photoelectrochemical Properties

In order to evaluate the photocatalytic performance of the pure titania (PT), pure hematite (PF) and the prepared hematite incorporated titania nanocomposites, we conducted photoelectrochemical measurements as indicated in Figure 8. Cyclic voltammetry, chronoamperometry and EIS were performed in a three-electrode cell configuration where dissolved air free 0.1 M Na2SO4 electrolyte was employed. The working electrode was prepared from the powder materials via a drop-casting technique using isopropanol solvent and fluorine-doped tin oxide (FTO) substrate without any post-treatment of the electrodes. The oxidation and reduction current values displayed in the cyclic voltammetry measurement can be used to judge the catalytic activity of the prepared materials. All samples exhibited only reduction current, except the PT sample exhibited both oxidation and reduction current. The reduction current density of the electrodes was 2.8, 1.65, 1.5 and 0.9 mA for PT, 0.1F, 0.5F and PF samples, respectively, while the oxidation current of PT samples was 1.5 mA. Therefore, the pure titania sample has the highest catalytic activity, while incorporating it with hematite its catalytic activity decreases. Moreover, to investigate the effective separation of the photogenerated charge carriers, we examined the photocurrent response under fixed potential (0.6 V versus Ag/AgCl) using the chronoamperometry technique. The photoresponse under light illumination demonstrates the rate of electrons transport as the majority charge carriers of n-type semiconductor from the sample to FTO as the collecting electrode. It was found that the PT sample shows the highest photocurrent magnitude reached ca. 800 µA/cm2 while 0.1F sample reached almost half this value and, 0.5F and PF samples give negligible photocurrent response. This could be explained based on the low bandgap value of the hematite, which increases the recombination rate of the photogenerated electron/hole pair and the existence of a high density of surface electron traps. Furthermore, an EIS test was performed to assess the charge transfer resistance under dark conditions of the prepared samples. Since the semicircle radius shown in the Nyquist plots of the EIS data indicates the conductivity at the interface between the electrode/electrolyte and electrode/FTO substrate. Thus, the smaller semicircle radius suggests improvement of the charge transfer of the prepared composite. Accordingly, the conductivity of the prepared samples was found to be in the following order: 0.1F > 0.5F > PT > PF.

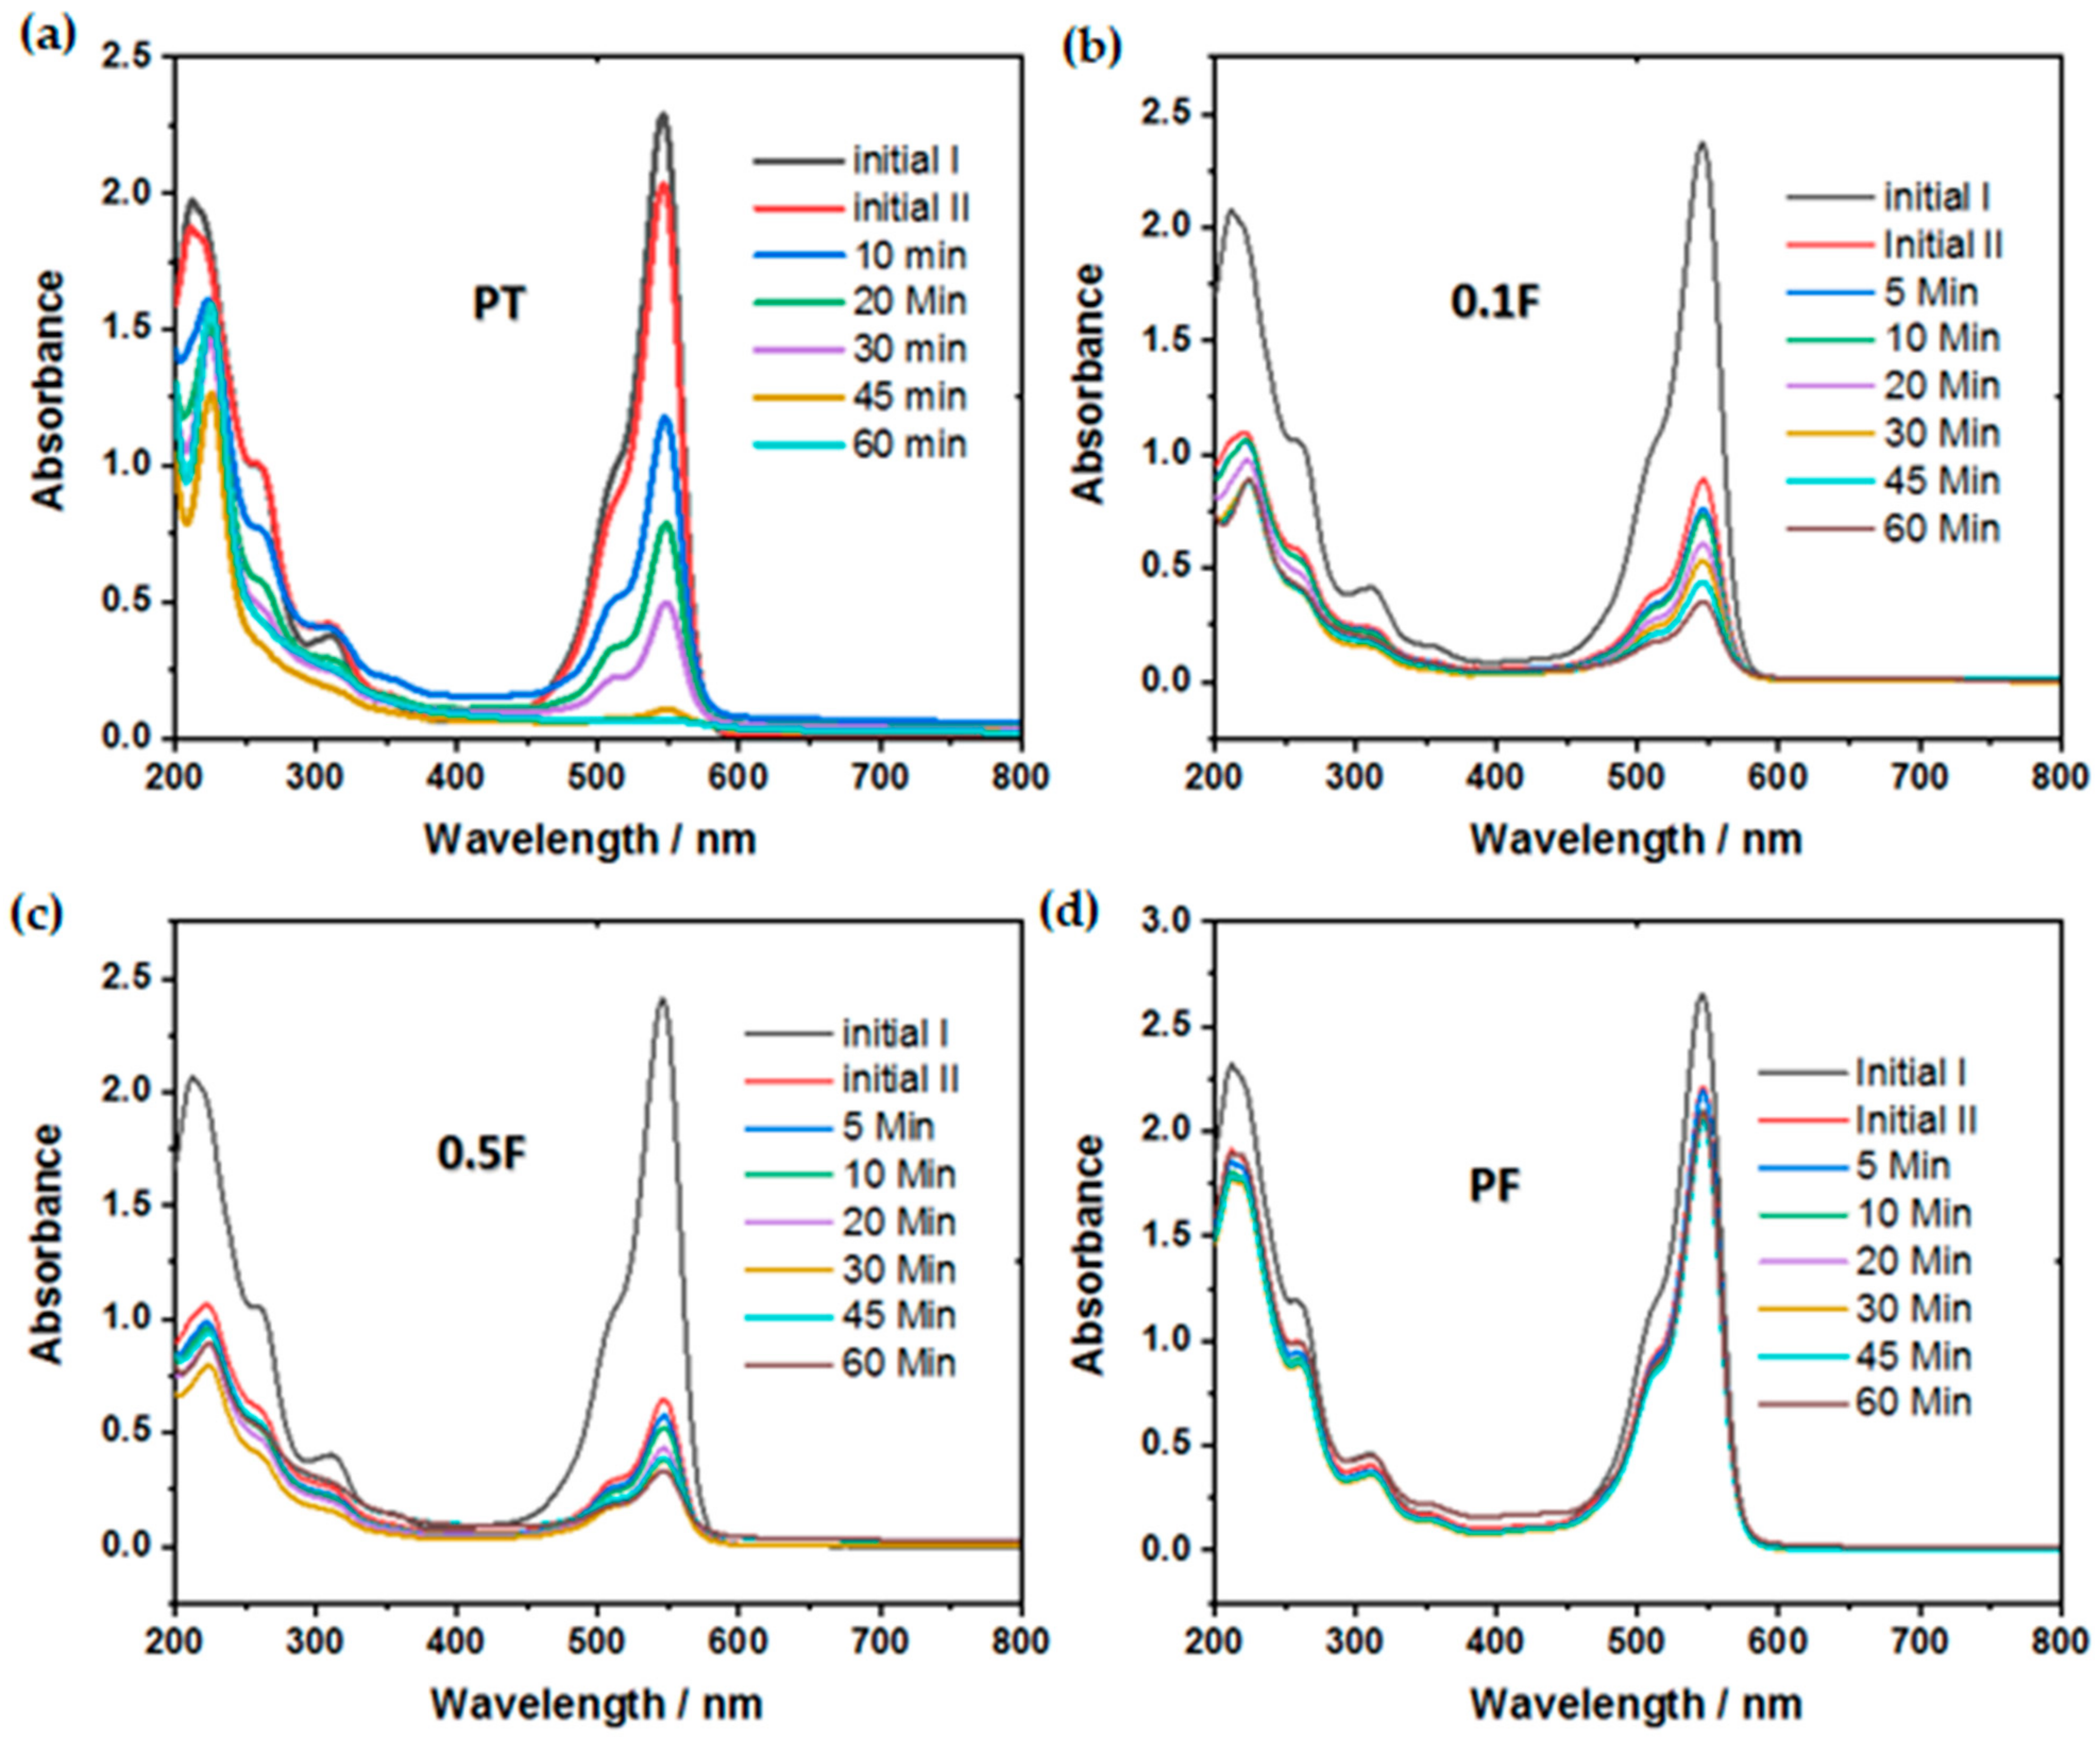
2.5. Photocatalytic Degradation of Rose Bengal Dye

The photocatalytic degradation of RB dye at different time intervals for 60 min is measured in the presence of Fe2O3 incorporated TiO2 photocatalysts nanocomposites, (TiO2)1−x(Fe2O3)x, where x = 0, 0.1, 0.5, and 1.0) as shown in Figure 9. In this work, 100 ppm aqueous solution of RB dye is taken without pH adjustment, and 150 mg of catalyst was added in 150 mL of dye solution to test photocatalytic activity. The as-prepared nanocomposites were suspended in dye solution (this refers to all the photocatalysts set that were prepared) via ultrasonication for 5 min, then was stirred in the dark for 1 h to reach adsorption–desorption equilibrium. Then the solution was irradiated with UV light (25 W, UV-LED, 365 nm) to perform the experiments. The concentration of RB dye solution was continuously monitored via UV-Vis spectrophotometer at stipulated time intervals. The absorbance of RB dye decreased with time during the photocatalytic degradation, clearly observable at 546 nm.
Based on previous reports, the conduction band position of TiO2 and Fe2O3 was estimated to be −0.22 and +0.30 V (versus NHE at pH = 0) [25]. While the valence band position could be calculated based on the bandgap values estimated from the DRS measurements (3.15 eV for TiO2 and 1.91 eV for Fe2O3). Formation of the internal electric field upon light irradiation and Fermi energy level alignment between TiO2 and Fe2O3 has promoted the separation of photogenerated electron-hole pairs. Therefore, as the UV light falls on the suspended photocatalyst on the dye solution, photogenerated electron/hole pairs are formed on the conduction and valence bands. The photogenerated electrons are known for their ability to react with the dissolved oxygen forming O2•− radicals while the holes react with OH groups forming OH radicals. Those oxidation species react efficiently with dye resulting in the degradation of the dye molecules. The following equations could explain the possible degradation mechanism using our photocatalyst composite:
((TiO2)-(Fe2O3) photocatalyst + UV irritation → (TiO2)-(Fe2O3) × (hVB++ eCB)
OH + hVB+ → OH
O2 + eCB → O2•−
O2•− + H+ → HO2
HO2 + H+ + eCB → H2O2
H2O2 + eCB → OH + OH
H2O2 → H+ + HO2
H2O2 + UV irritation → 2[OH]
OH and hVB+ + RB dye → CO2 + H2O
The maximum photocatalytic degradation of the RB dye reaches 97% in the PT sample, which is pure TiO2 NPs. Pure TiO2 is widely known for its high oxidation potential compared to other photocatalysts under UV irradiation. In contrast, the photocatalytic activity of the other samples decreased with increasing the iron oxide content. Interestingly, the RB dye removal via adsorption increased remarkably with increasing the iron oxide content to almost 80% with the 0.5F catalyst. However, both adsorption and photocatalytic removal activity decreased to the minimum in the case of the pure iron oxide sample PF as shown in Table 4 and Figure 9. The enhanced adsorption capacity of the samples can be explained based on the surface texture analysis (surface area and pore size distribution). The terms related to degradation were calculated using the following formulae and briefed in Table 4:
% Removal efficiency= [Co − C] × 100/C
−ln (C/Co) = kt
where Co and C are the initial and final concentration of RB dye, respectively, k is the 1st order rate constant, and t is the irradiation time. All the RB dye degradation parameters are briefed in Table 4.

3. Experimental Details

3.1. Synthesis of (TiO2)1−x (Fe2O3)x Nanoparticles (NPs)

(TiO2)1−x (Fe2O3)x NPs were prepared by the sol-gel process. In brief, 150 mL of ethanol, 3 mL of acetic acid, 5.26 mL of diethanolamine, 10.9 mL of titanium tetrachloride were mixed with vigorously stirring for 15 min, followed by adding 1.8 mL of deionized water. The desired amount of iron (III) acetate hydroxide was gradually added at X = 0.0, 0.1, 0.5, and 1.0 to obtain (TiO2)1−x(Fe2O3)x nanocomposites. The solution was magnetically stirred for 4 h, and the pH value was adjusted at~8. The obtained wet powder was washed three times by water and ethanol, respectively. The wet (TiO2)1−x(Fe2O3)x NPs were dried for 24 h at 100 °C, and then it was annealed for 3 h at 450 °C. All chemicals applied were purchased from Sigma-Aldrich, Burlington, MA, USA and used without further purification.

3.2. Characterization of (TiO2)1−x(Fe2O3)x Nanocomposites

The crystal structures and phases of the samples were recorded on Bruker D8 advance equipped with Cu Kα radiation (40 kV,40 mA) at a wavelength of 1.5406 Å. JEOL 6360 LA Japan SEM was employed to analyze the surface topography. DXR FT-Raman system from Fisher-Scientific was operated for vibrational study under 532 nm excitation unit at 5 mW power. The UV-Visible diffuse reflectance spectroscopy (DRS) analysis of powder samples was acquired from 200–800 nm using Evolution 220 spectrophotometer coupled with ISA-220 integrating sphere (Thermo Scientific, Waltham, MA, USA). The specific surface areas were determined by N2 adsorption–desorption isotherm (Quantachrom Instrument Corporation, NOVATOUCH LX4, Boynton Beach, FL, USA) using Brunauer–Emmett-Teller (BET) calculations, whereas the samples were pretreated at 150 °C for 2 h, and the pore size distributions were recorded by desorption branch using BJH method. FTIR spectra of the samples were acquired from NICOLET IS 10 (Thermo Scientific, USA).

3.3. Photoelectrochemical Measurements

Various electrochemical techniques such as cyclic voltammetry (CV), chronoamperometry (CAM) and electrochemical impedance spectroscopy (EIS) were performed to evaluate the photoelectric properties of the prepared composites. Electrodes of the prepared powder materials were first prepared over fluorine-doped tin oxide (FTO) substrate using the drop-casting technique. A slurry of the powder materials and isopropanol solvent was prepared via ultrasonication. 50 µL was withdrawn and uniformly deposited over FTO substrate, and this step is repeated three times while the amount of the powder was controlled to be 4 mg over an area of ca. 1 cm2. Then the electrodes were dried naturally at room temperature without any posttreatment. A rectangular quartz cell (50 mL capacity) with a three-electrode cell configuration was employed in the measurements, where a platinum wire was used as the counter electrode, sat. Ag/AgCl electrode was used as reference electrode and FTO act as the working electrode. All three electrodes were immersed in a dissolved air-free electrolyte of 0.1M Na2SO4 (purge with Ar gas) then connected to the electrochemical workstation (CS350, CorrTest Instruments, Wuhan, China). UV-LED (25 W, 365 nm, NVMUR020A, NICHIA, Japan) was used as a light source in the chronoamperometry test. Multiple cyclic voltammetry was measured with a scan rate of 50 mV/s and potential window from −1.0 to 1.0 V. Chronoamperometry was performed for 660 s at a fixed potential of 0.6 V. Electrochemical impedance spectroscopy (EIS) measurement was conducted at 20 mV amplitude with a frequency range from 105 to 0.01 Hz under dark conditions.

3.4. Photocatalytic Dye Degradation

The photocatalytic activity of the as-prepared samples was evaluated toward RB degradation. 100 ppm of RB dye (4,5,6,7-tetrachloro-2′,4′,5′,7′-tetraiodofluorescein, 973.67 g/mol) was employed, while the reaction conditions were 1 g/L, 20 °C, 6.5 for catalyst concentration, reaction temperature, and pH (without adjustment), respectively. UV-LED (25 W, 365 nm, NVMUR020A, NICHIA, Tokushima, Japan) was used as the light source. First, the catalyst was suspended in 150 mL of dye aqueous solution inside irradiation made of Pyrex glass via ultrasonication and stirred in the dark for 1h to establish the adsorption–desorption equilibrium. Then the sample was irradiated with UV-LED for another 1 h while the concentration of the dye was monitored via UV-Vis. spectrophotometer (Perkin Elmer, Lamda-40, Waltham, MA, USA). Dye samples were withdrawn, and catalysts were separated via centrifugation prior to absorption measurement.

4. Conclusions

Highly oriented nanostructures of pure and TiO2 incorporated with different Fe2O3 contents (TiO2)1−x(Fe2O3)x, where x = 0, 0.1, 0.5, and 1.0 for pure TiO2 and Fe2O3 incorporated 0.1, 0.5, and pure Fe2O3 which are denoted as PT, 0.1F, 0.5F, and PF, respectively) were prepared by a sol-gel approach. X-ray diffraction studies revealed the polycrystalline tetragonal anatase phase, and the pure Fe2O3 is formed in the rhombohedral hematite structure. From SEM images, all the individual particles are uniformly distributed throughout the surface of the sample. FT-IR studies revealed that at higher incorporating concentration and in pure Fe incorporating, the intensity of band is increased. The decreasing bandgap with increasing incorporating concentration indicates that the present samples have huge applications in optoelectronic devices. The BET surface areas are high because of the mesoporous nature of the prepared composites. The synthesized TiO2 NPs in the present work are very active under UV irradiation with high photonic efficiency. We continue our efforts to examine the synthesized photocatalysts under visible light irradiation employing different pollutants. All the promising results of the prepared samples clearly indicate their huge applications in the field of wastewater treatment.

Author Contributions

Methodology, M.A.S. and A.M.A.; investigation, A.M.A., M.A.S. and H.M.E.-B.; writing—original draft preparation, V.G., M.A. and A.M.A.; writing—review and editing, A.M.A., H.A., H.M.E.-B. and A.A.I.; supervision, A.M.A. and H.A. All authors have read and agreed to the published version of the manuscript.

Funding

This research was funded by the Deputyship for Research and Innovation, Ministry of Education, Saudi Arabia (Research Capability-Project number 412).

Data Availability Statement

Data are contained within the article.

Acknowledgments

The authors extend their appreciation to the Deputyship for Research and Innovation, Ministry of Education in Saudi Arabia, for funding this research work through project number 412.

Conflicts of Interest

The authors declare no conflict of interest.

References

  1. Reddy, B.M.; Ganesh, I.; Khan, A. Stabilization of nanosized titania-anatase for high temperature catalytic applications. J. Mol. Catal. A Chem. 2004, 223, 295–304. [Google Scholar] [CrossRef]
  2. Heringa, M.B.; Geraets, L.; van Eijkeren, J.C.; Vandebriel, R.J.; de Jong, W.H.; Oomen, A.G. Risk assessment of titanium dioxide nanoparticles via oral exposure, including toxicokinetic considerations. Nanotoxicology 2016, 10, 1515–1525. [Google Scholar] [CrossRef] [Green Version]
  3. Chang, X.; Zhang, Y.; Tang, M.; Wang, B. Health effects of exposure to nano-TiO2: A meta-analysis of experimental studies. Nanoscale Res. Lett. 2013, 8, 1–10. [Google Scholar] [CrossRef] [Green Version]
  4. Buzea, C.; Pacheco, I.I.; Robbie, K. Nanomaterials and nanoparticles: Sources and toxicity. Biointerphases 2007, 2, MR17–MR71. [Google Scholar] [CrossRef] [PubMed] [Green Version]
  5. Ismail, A.A.; Bahnemann, D.W. Mesoporous titania photocatalysts: Preparation, characterization and reaction mechanisms. J. Mater. Chem. 2011, 21, 11686–11707. [Google Scholar] [CrossRef] [Green Version]
  6. Ismail, A.A.; Ibrahim, I.A. Impact of supercritical drying and heat treatment on physical properties of titania/silica aerogel monolithic and its applications. Appl. Catal. A Gen. 2008, 346, 200–205. [Google Scholar] [CrossRef]
  7. Fujishima, A.; Rao, T.N.; Tryk, D.A. Titanium dioxide photocatalysis. J. Photochem. Photobiol. C Photochem. Rev. 2000, 1, 1–21. [Google Scholar] [CrossRef]
  8. Nasralla, N.; Yeganeh, M.; Astuti, Y.; Piticharoenphun, S.; Shahtahmasebi, N.; Kompany, A.; Karimipour, M.; Mendis, B.G.; Poolton, N.R.; Šiller, L. Structural and spectroscopic study of Fe-doped TiO2 nanoparticles prepared by sol-gel method. Sci. Iran. 2013, 20, 1018–1022. [Google Scholar]
  9. Assadi, M.H.N.; Hanaor, D.A.H. The effects of copper doping on the photocatalytic activity at (101) planes of anatase TiO2: A theoretical study. Appl. Surf. Sci. 2016, 387, 682–689. [Google Scholar] [CrossRef] [Green Version]
  10. Zhu, J.; Zheng, W.; He, B.; Zhang, J.; Anpo, M. Characterization of Fe-TiO2 photocatalysts synthesized by hydrothermal method and their photocatalytic reactivity for photodegradation of XRG dye diluted in water. J. Mol. Catal. A Chem. 2004, 216, 35–43. [Google Scholar] [CrossRef]
  11. Zhou, M.; Yu, J.; Cheng, B. Effects of Fe-doping on the photocatalytic activity of mesoporous TiO2 powders prepared by an ultrasonic method. J. Hazard. Mater. 2006, 137, 1838–1847. [Google Scholar] [CrossRef] [PubMed]
  12. Calle, A.M.; Sanchez, L.C.; Arboleda, J.D.; Beltran, J.J.; Barrero, C.A.; Osorio, J.; Nomura, K. Mixtures of iron and anatase TiO2 by mechanical alloying. Microelectron. J. 2008, 39, 1322–1323. [Google Scholar] [CrossRef]
  13. Eadi, S.B.; Kim, S.; Jeong, S.W.; Jeon, H.W. Novel preparation of Fe doped TiO2 nanoparticles and their application for gas sensor and photocatalytic degradation. Adv. Mater. Sci. Eng. 2017, 2017, 2191659. [Google Scholar] [CrossRef] [Green Version]
  14. Hussain, S.T.; Siddiqa, A.; Siddiq, M.; Ali, S. Iron-doped titanium dioxide nanotubes: A study of electrical, optical, and magnetic properties. J. Nanopart. Res. 2011, 13, 6517–6525. [Google Scholar] [CrossRef]
  15. Hirano, M.; Joji, T.; Inagaki, M.; Iwata, H. Direct Formation of Iron (III)-Doped Titanium Oxide (Anatase) by Thermal Hydrolysis and Its Structural Property. J. Am. Ceram. Soc. 2004, 87, 35–41. [Google Scholar] [CrossRef]
  16. Wang, C.Y.; Böttcher, C.; Bahnemann, D.W.; Dohrmann, J.K. A comparative study of nanometer sized Fe (III)-doped TiO2 photocatalysts: Synthesis, characterization and activity. J. Mater. Chem. 2003, 13, 2322–2329. [Google Scholar] [CrossRef]
  17. Mohamed, R.M.; Kadi, M.W.; Ismail, A.A. A Facile synthesis of mesoporous α-Fe2O3/TiO2 nanocomposites for hydrogen evolution under visible light. Ceram. Int. 2020, 46, 15604–15612. [Google Scholar] [CrossRef]
  18. Gareso, P.L.; Sampe, N.; Palentek, V.; Taba, P. Influence of annealing on Fe-doped TiO2 powders using co-precipitation technique. AIP Conf. Proc. 2017, 1801, 020002. [Google Scholar] [CrossRef] [Green Version]
  19. Rodríguez, P.A.; Pecchi, G.A.; Casuscelli, S.G.; Elías, V.R.; Eimer, G.A. A simple synthesis way to obtain iron-doped TiO2 nanoparticles as photocatalytic surfaces. Chem. Phys. Lett. 2019, 732, 136643. [Google Scholar] [CrossRef]
  20. Umar, A.; Harraz, F.A.; Ibrahim, A.A.; Almas, T.; Kumar, R.; Al-Assiri, M.S.; Baskoutas, S. Iron-doped titanium dioxide nanoparticles as potential scaffold for hydrazine chemical sensor applications. Coatings 2020, 10, 182. [Google Scholar] [CrossRef] [Green Version]
  21. Lourduraj, S.; Williams, R.V. Effect of iron doping on structural and optical properties of TiO2 thin film by sol-gel routed spin coating technique. J. Adv. Dielectr. 2017, 7, 1750024. [Google Scholar] [CrossRef] [Green Version]
  22. El-Bery, H.M.; Salah, M.R.; Ahmed, S.M.; Soliman, S.A. Efficient non-metal based conducting polymers for photocatalytic hydrogen production: Comparative study between polyaniline, polypyrrole and PEDOT. RSC Adv. 2021, 11, 13229–13244. [Google Scholar] [CrossRef]
  23. Nabil, S.; Hammad, A.S.; El-Bery, H.M.; Shalaby, E.A.; El-Shazly, A.H. The CO2 photoconversion over reduced graphene oxide based on Ag/TiO2 photocatalyst in an advanced meso-scale continuous-flow photochemical reactor. Environ. Sci. Pollut. Res. 2021, 28, 36157–36173. [Google Scholar] [CrossRef]
  24. El-Bery, H.M.; Abdelhamid, H.N. Photocatalytic hydrogen generation via water splitting using ZIF-67 derived Co3O4@C/TiO2. J. Environ. Chem. Eng. 2021, 9, 105702. [Google Scholar] [CrossRef]
  25. Singh, A.P.; Wang, R.B.; Tossi, C.; Tittonen, I.; Wickman, B.; Hellman, A. Hydrogen induced interface engineering in Fe2O3–TiO2 heterostructures for efficient charge separation for solar-driven water oxidation in photoelectrochemical cells. RSC Adv. 2021, 11, 4297–4307. [Google Scholar] [CrossRef]
  26. Mei, Q.; Zhang, F.; Wang, N.; Yang, Y.; Wu, R.; Wang, W. TiO2/Fe2O3 heterostructures with enhanced photocatalytic reduction of Cr(VI) under visible light irradiation. RSC Adv. 2019, 9, 22764–22771. [Google Scholar] [CrossRef] [Green Version]
  27. Cao, Y.Q.; Zi, T.Q.; Zhao, X.R.; Liu, C.; Ren, Q.; Fang, J.P.; Li, W.M.; Li, A.D. Enhanced visible light photocatalytic activity of Fe2O3 modified TiO2 prepared by atomic layer deposition. Sci. Rep. 2020, 10, 13437. [Google Scholar] [CrossRef]
  28. Hanaor, D.A.; Sorrell, C.C. Review of the anatase to rutile phase transformation. J. Mater. Sci. 2011, 46, 855–874. [Google Scholar] [CrossRef] [Green Version]
  29. Da Silva, A.L.; Hotza, D.; Castro, R.H. Surface energy effects on the stability of anatase and rutile nanocrystals: A predictive diagram for Nb2O5-doped-TiO2. Appl. Surf. Sci. 2017, 393, 103–109. [Google Scholar] [CrossRef]
  30. Aslam, M.M.; Ali, S.M.; Fatehmulla, A.; Farooq, W.A.; Atif, M.; Al-Dhafiri, A.M.; Shar, M.A. Growth and characterization of layer by layer CdS–ZnS QDs on dandelion like TiO2 microspheres for QDSSC application. Mater. Sci. Semicond. Process. 2015, 36, 57–64. [Google Scholar] [CrossRef]
  31. Mahadik, M.A.; Shinde, S.S.; Mohite, V.S.; Kumbhar, S.S.; Moholkar, A.V.; Rajpure, K.Y.; Ganesan, V.; Nayak, J.; Barman, S.R.; Bhosale, S.H. Visible light catalysis of rhodamine B using nanostructured Fe2O3, TiO2 and TiO2/Fe2O3 thin films. J. Photochem. Photobiol. B Biol. 2014, 133, 90–98. [Google Scholar] [CrossRef] [PubMed]
  32. Tang, W.; Zhang, Y.; Chen, X.; Zeng, X. Fe2O3/TiO2 film electrodes prepared by the forced hydrolysis method and their photoelectrocatalytic performance. Mater. Lett. 2018, 217, 109–112. [Google Scholar] [CrossRef]
  33. Barkhade, T.; Mishra, S.; Chander, H.; Mahapatra, S.K.; Banerjee, I. Effect of TiO2 and Fe doped TiO2 nanoparticles on mitochondrial membrane potential in HBL-100 cells. Biointerphases 2019, 14, 041003. [Google Scholar] [CrossRef] [PubMed]
  34. Zhang, J.; Kuang, M.; Wang, J.; Liu, R.; Xie, S.; Ji, Z. Fabrication of carbon quantum dots/TiO2/Fe2O3 composites and enhancement of photocatalytic activity under visible light. Chem. Phys. Lett. 2019, 730, 391–398. [Google Scholar] [CrossRef]
  35. Wu, L.; Yan, H.; Xiaoc, J.; Li, X.; Wang, X.; Zhao, T. Characterization and photocatalytic properties of nano-Fe2O3–TiO2 composites prepared through the gaseous detonation method. Ceram. Int. 2017, 43, 14334–14339. [Google Scholar] [CrossRef]
  36. Abbas, N.; Shao, G.N.; Haider, M.S.; Imran, S.M.; Park, S.S.; Kim, H.T. Sol-gel synthesis of TiO2-Fe2O3 systems: Effects of Fe2O3 content and their photocatalytic properties. J. Ind. Eng. Chem. 2016, 39, 112–120. [Google Scholar] [CrossRef]
  37. Morales, A.E.; Mora, E.S.; Pal, U. Use of diffuse reflectance spectroscopy for optical characterization of un-supported nanostructures. Rev. Mex. Fís. 2007, 53, 18–22. [Google Scholar]
  38. Barton, D.G.; Shtein, M.; Wilson, R.D.; Soled, S.L.; Iglesia, E. Structure and electronic properties of solid acids based on tungsten oxide nanostructures. J. Phys. Chem. B 1999, 103, 630–640. [Google Scholar] [CrossRef]
  39. Shkir, M.; AlFaify, S.; Yahia, I.S.; Ganesh, V.; Shoukry, H. Microwave-assisted synthesis of Gd3+ doped PbI2 hierarchical nanostructures for optoelectronic and radiation detection applications. Phys. B Condens. Matter 2017, 508, 41–46. [Google Scholar] [CrossRef]
  40. Shkir, M.; Yahia, I.S.; Ganesh, V.; Algarni, H.; AlFaify, S. Facile hydrothermal-assisted synthesis of Gd3+ doped PbI2 nanostructures and their characterization. Mater. Lett. 2016, 176, 135–138. [Google Scholar] [CrossRef]
Figure 1. XRD analysis of (TiO2)1−x(Fe2O3)x nanoparticles.
Catalysts 11 01062 g001
Figure 2. SEM images of (TiO2)1−x(Fe2O3)x nanoparticles.
Catalysts 11 01062 g002
Figure 3. Raman spectra for (TiO2)1−x(Fe2O3)x nanoparticles.
Catalysts 11 01062 g003
Figure 4. IR transmittance spectra for (TiO2)1−x(Fe2O3)x nanoparticles.
Catalysts 11 01062 g004
Figure 5. Diffuse reflectance UV–visible spectra of (TiO2)1−x(Fe2O3)x nanoparticles.
Catalysts 11 01062 g005
Figure 6. A plot of transferred Kubelka–Munk versus the energy of the light absorbed of (TiO2)1−x(Fe2O3)x nanoparticles.
Catalysts 11 01062 g006
Figure 7. (a) N2 adsorption–desorption isotherm, (b) t-plot of the as-prepared samples, and (c) BJH pore size.
Catalysts 11 01062 g007
Figure 8. (a) Cyclic voltammetry profiles; (b) Transient photocurrent response (I-t) curves and (c) Nyquist plots of Electrochemical Impedance Spectroscopy (EIS) data for PT, 0.1F, 0.5F, and PF samples.
Catalysts 11 01062 g008
Figure 9. UV-Vis absorbance of the photocatalytic degradation of 100 ppm of Rose Bengal dye (60 min) over 1 g L−1 of (a) PT, (b) 0.1F, (c) 0.5F and (d) PF samples.
Catalysts 11 01062 g009
Table 1. Crystallite size (D), dislocation density (δ) and microstrain (ε).
Sample Name Crystallite Size (D)
(nm)
Dislocation
Density (δ)
Microstrain (ε)
PT15.60.0060.002
0.1F21.60.0040.002
0.5F34.40.0060.002
PF33.70.0010.001
Table 2. The bandgap values of (TiO2)1−x(Fe2O3)x nanoparticles.
Sample NameThe Bandgap (eV)
PT3.15
0.1F2.71
0.5F1.95
PF1.91
Table 3. N2-Physorption analysis results.
Sample/ParameterSBET
m2/g
Total Pore Volume
cm3/g
Average Pore Radius
nm
PT820.16754.1
0.1 F80.30.22585.6
0.5 F860.20584.8
PF35.60.10886.1
Table 4. Photocatalytic degradation parameters.
Parameter/Sample * Removal Efficiency % (Dark Adsorption)* Removal Efficiency % (Photocatalysis)Rate Constant K /min−1 ** R2
PT11.2970.0580.97
0.1F62.5610.0160.98
0.5F79530.0140.94
PF16.37.30.00140.98
* Both dark adsorption and photocatalytic reaction were conducted for 60 min where the Photocatalytic degradation (removal efficiency) was calculated based on the initial concentration of the Rose Bengal dye after the adsorption step (Initial II). ** R2 is a correlation coefficient.
Publisher’s Note: MDPI stays neutral with regard to jurisdictional claims in published maps and institutional affiliations.

