
Photocatalytic-Fenton Process under Simulated Solar Radiation Promoted by a Suitable Catalyst Selection


Abstract
:1. Introduction
2. Results
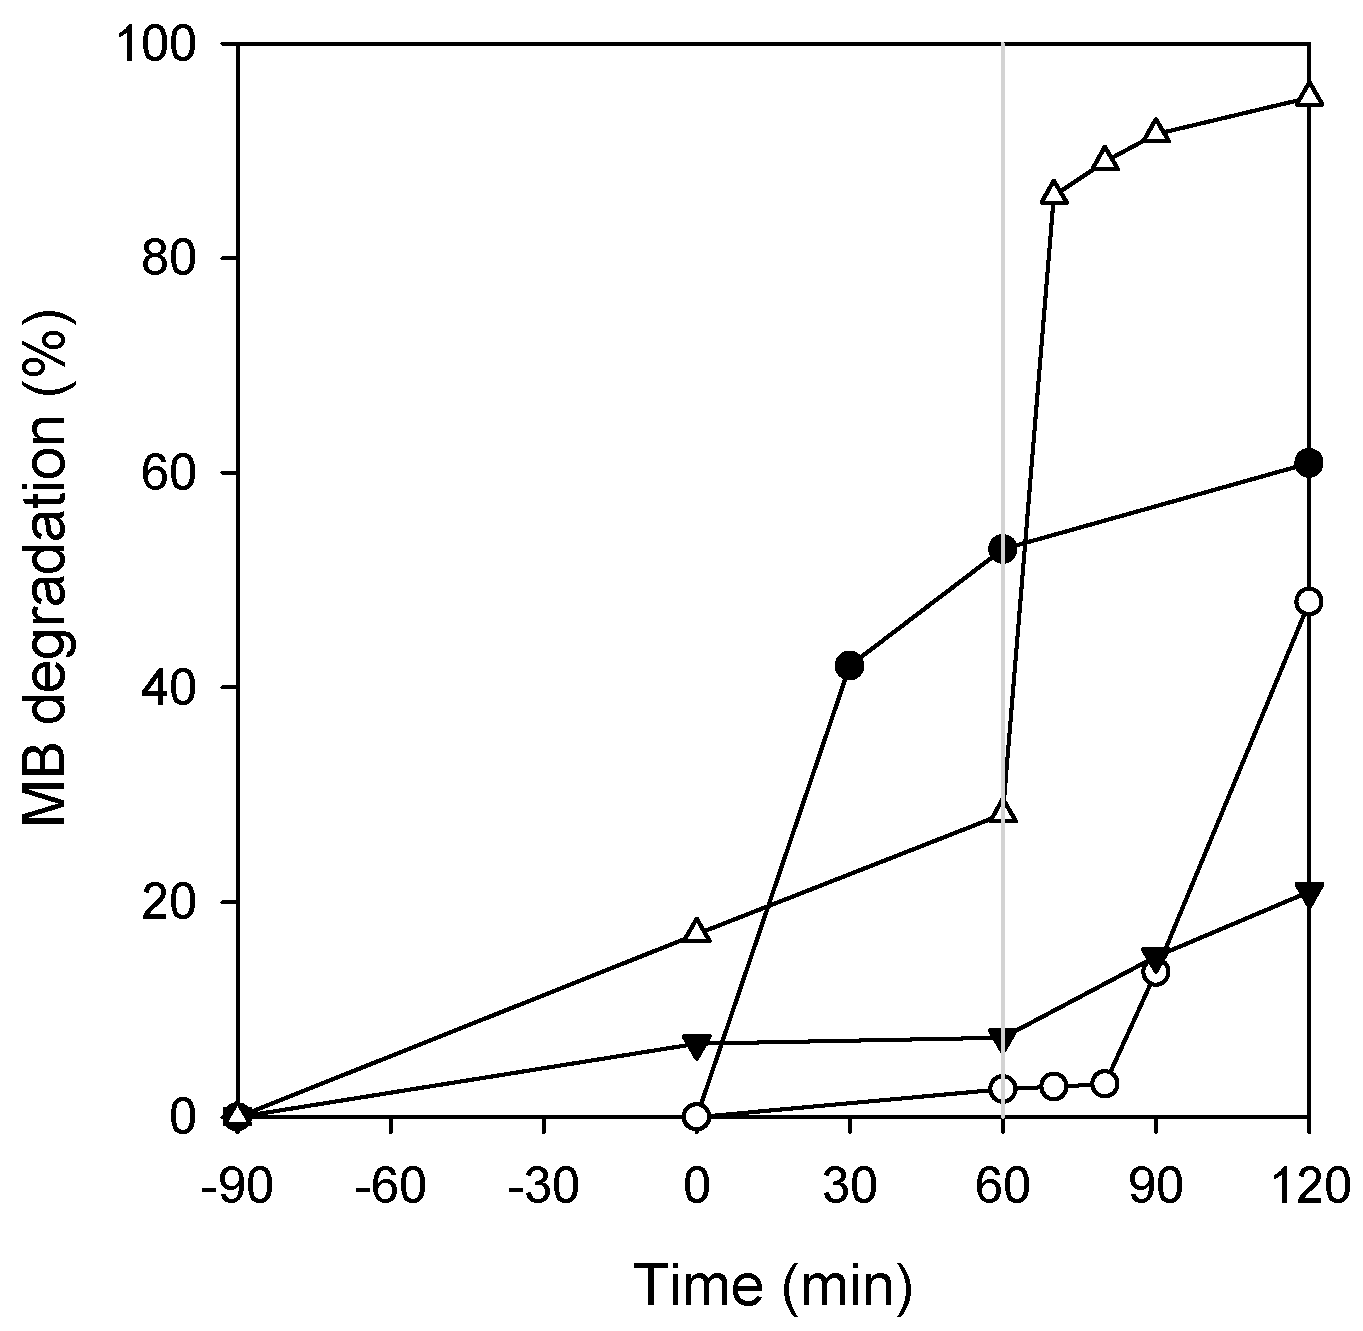
2.1. Catalyst Performance
2.2. Catalyst Characterization
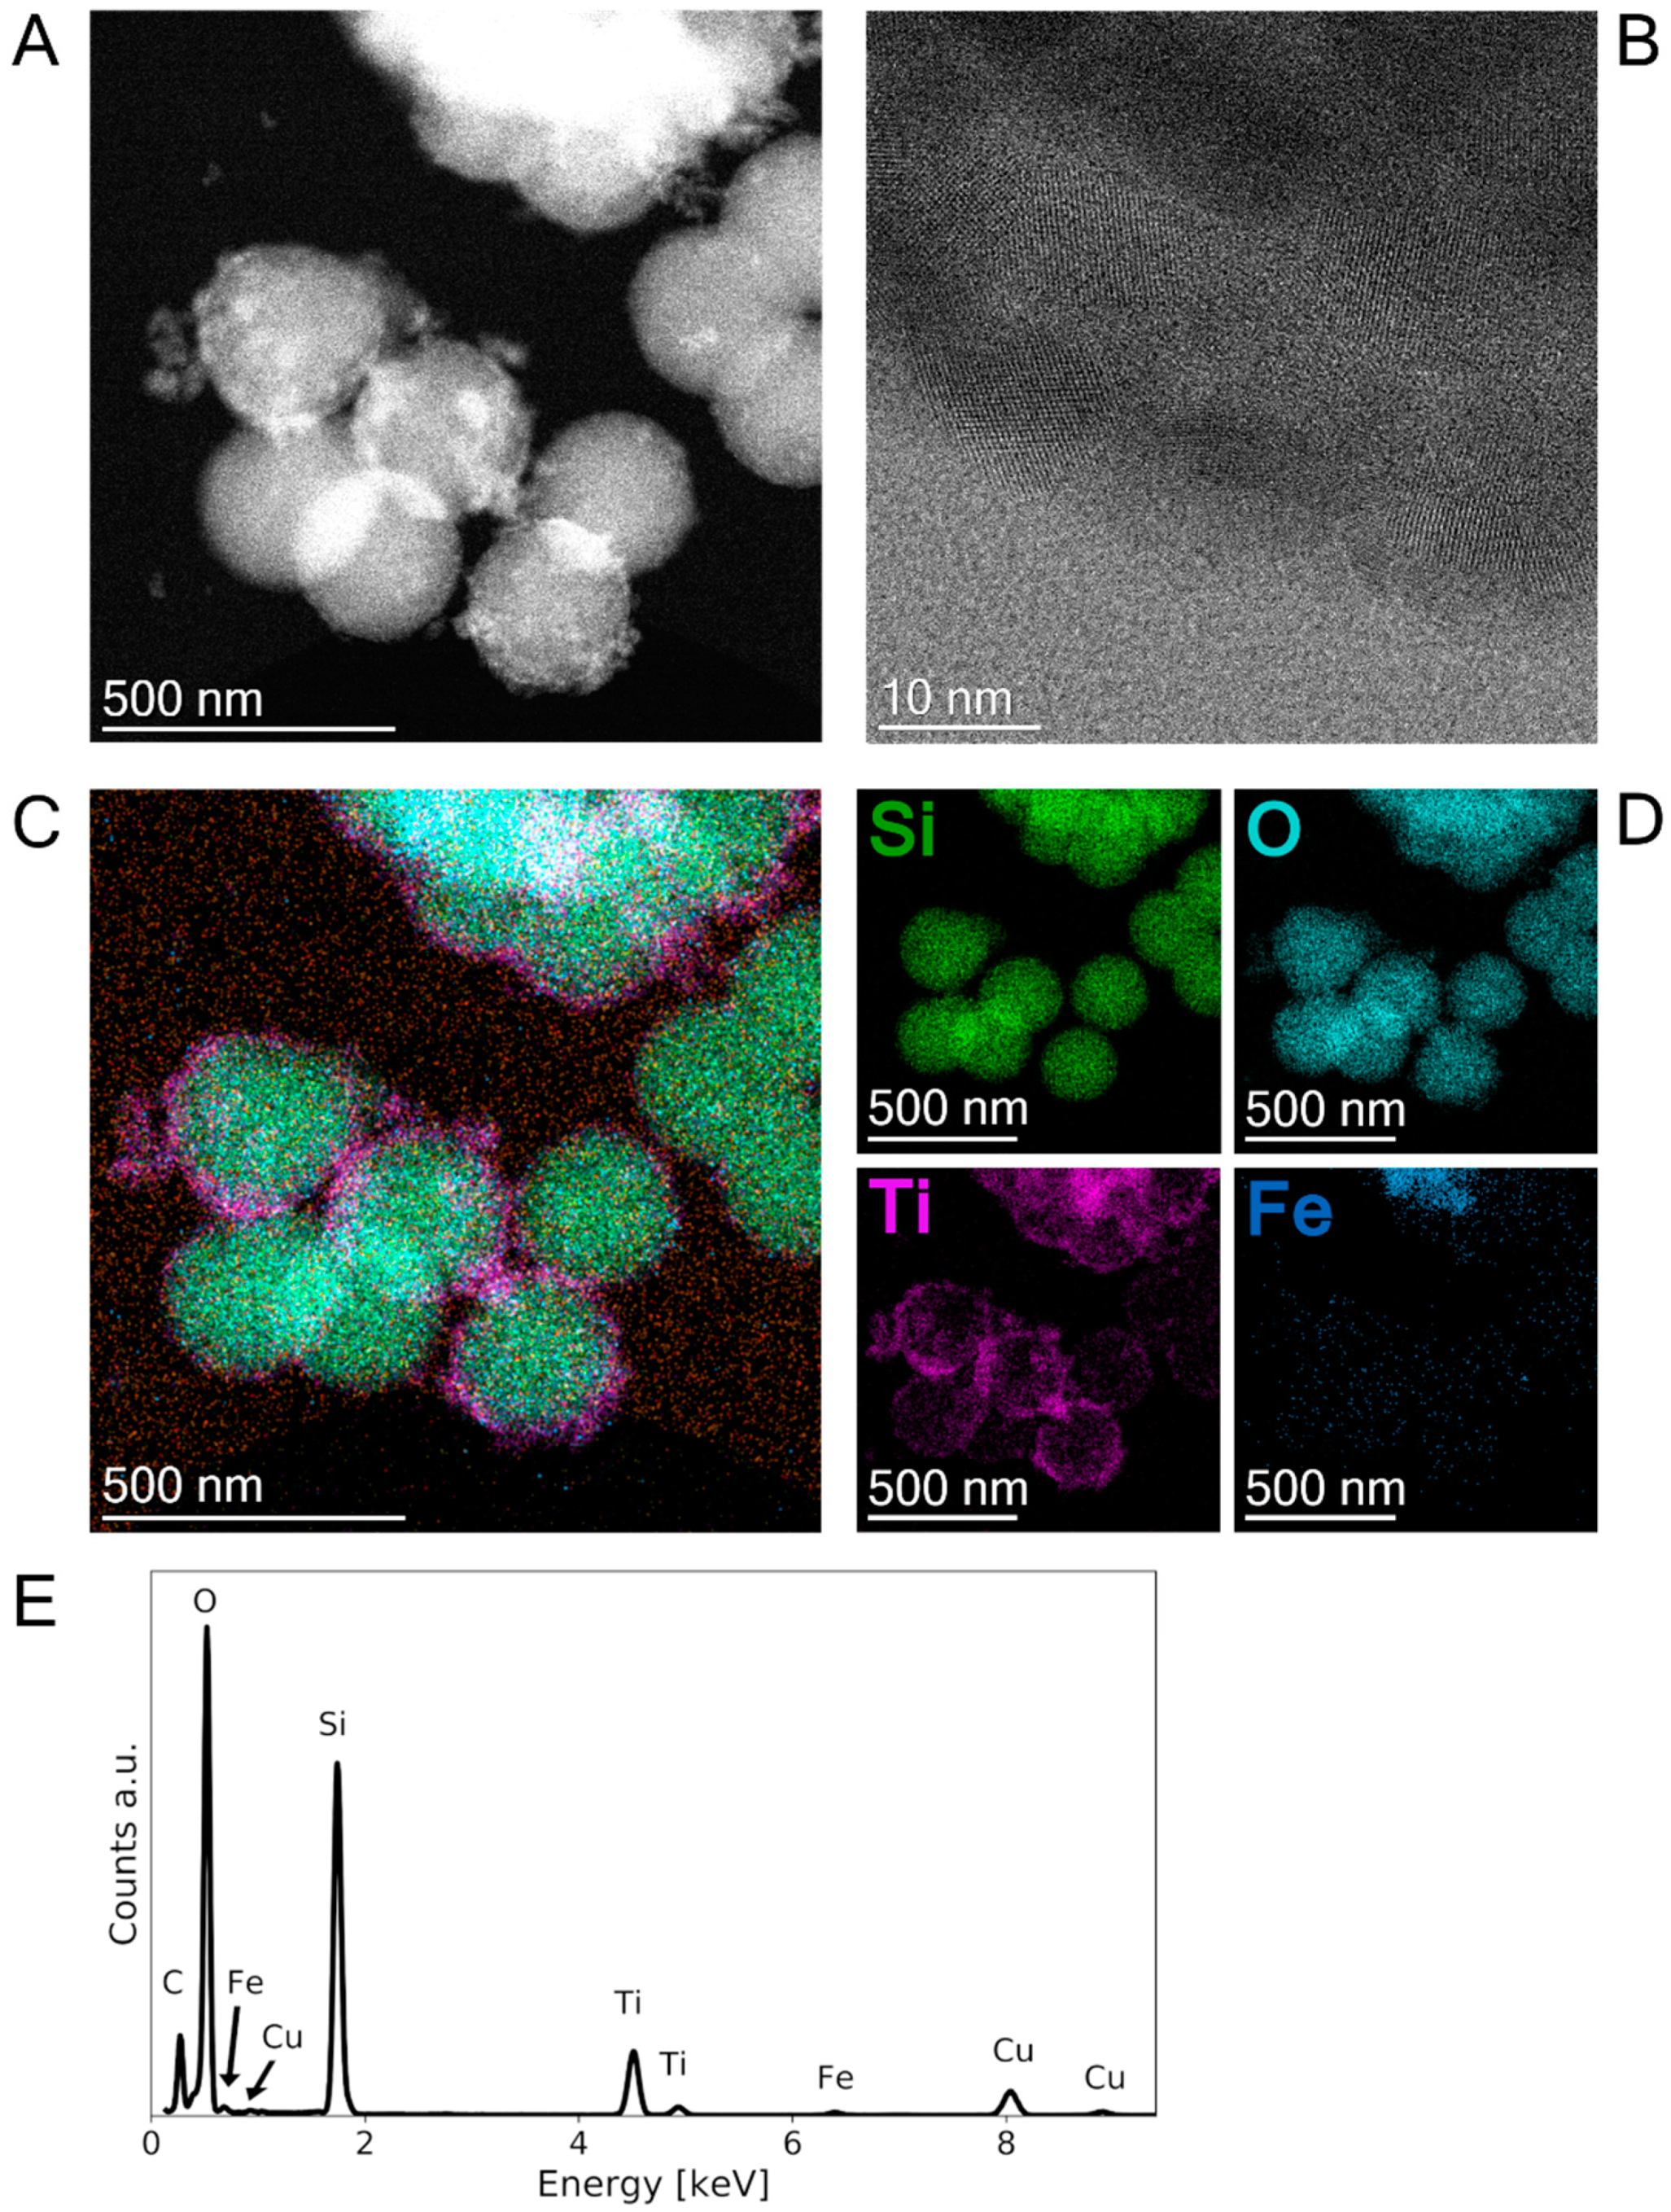
2.2.1. TEM
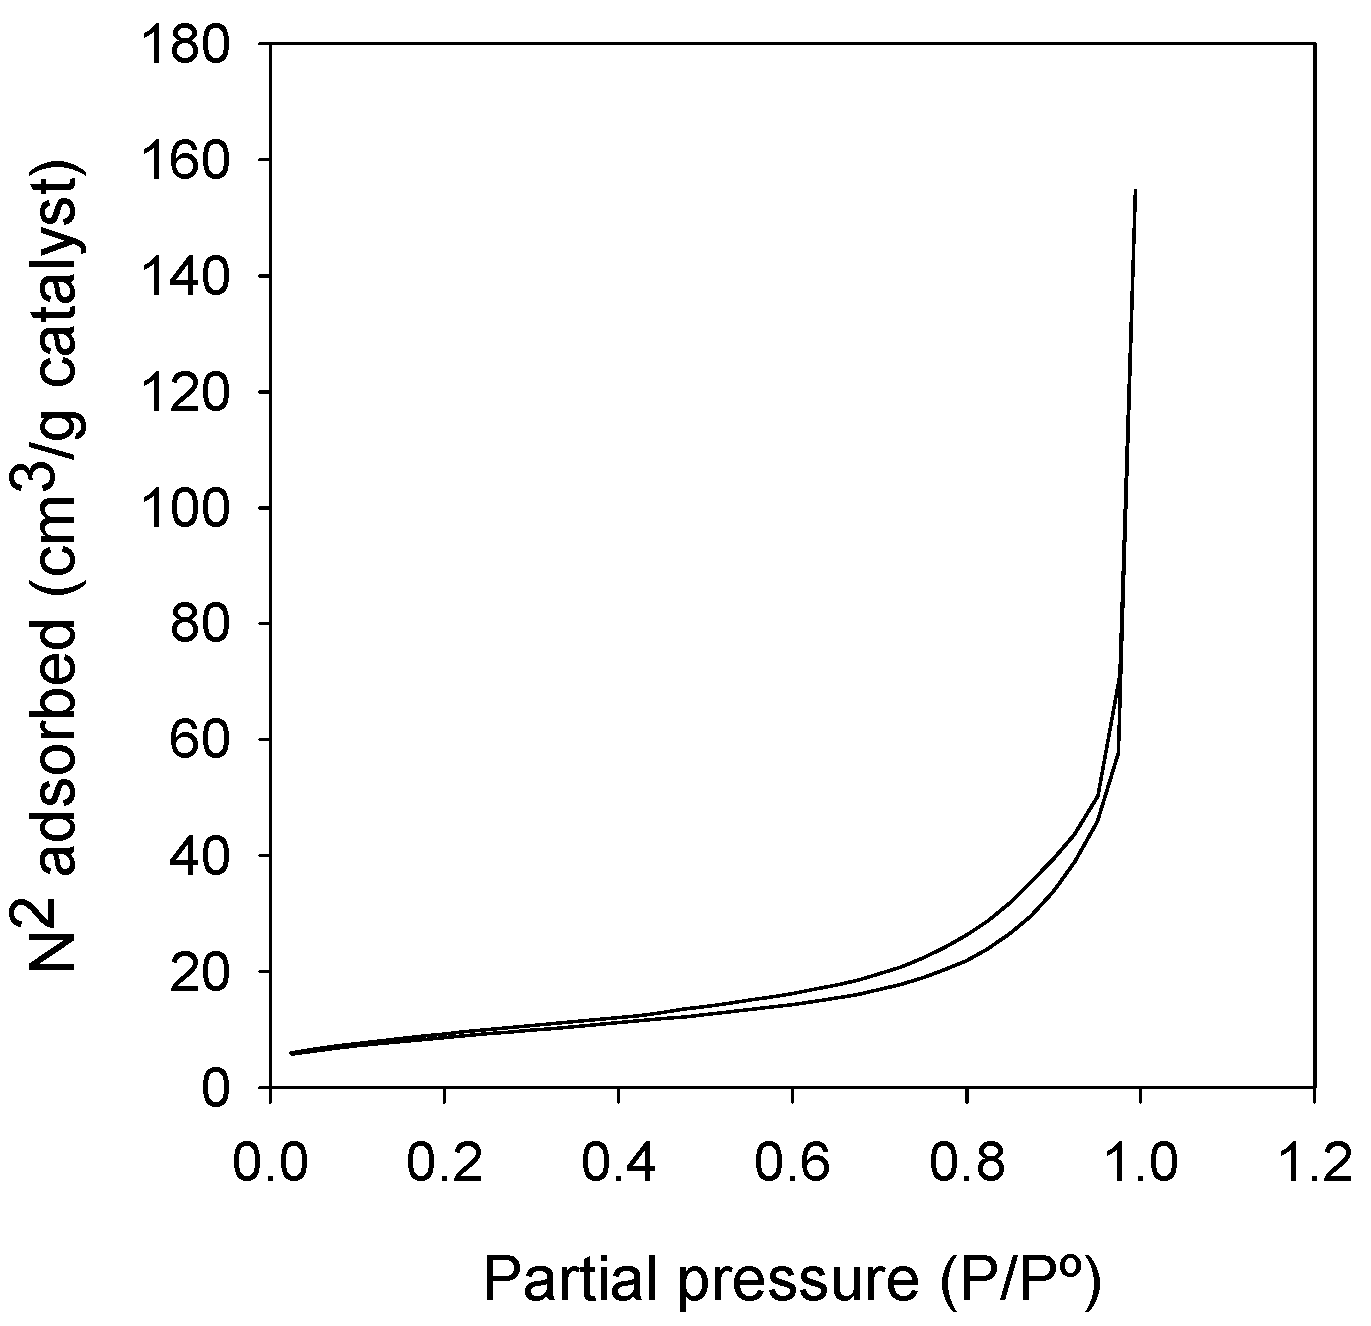
2.2.2. Surface Area
2.2.3. X-ray Diffraction
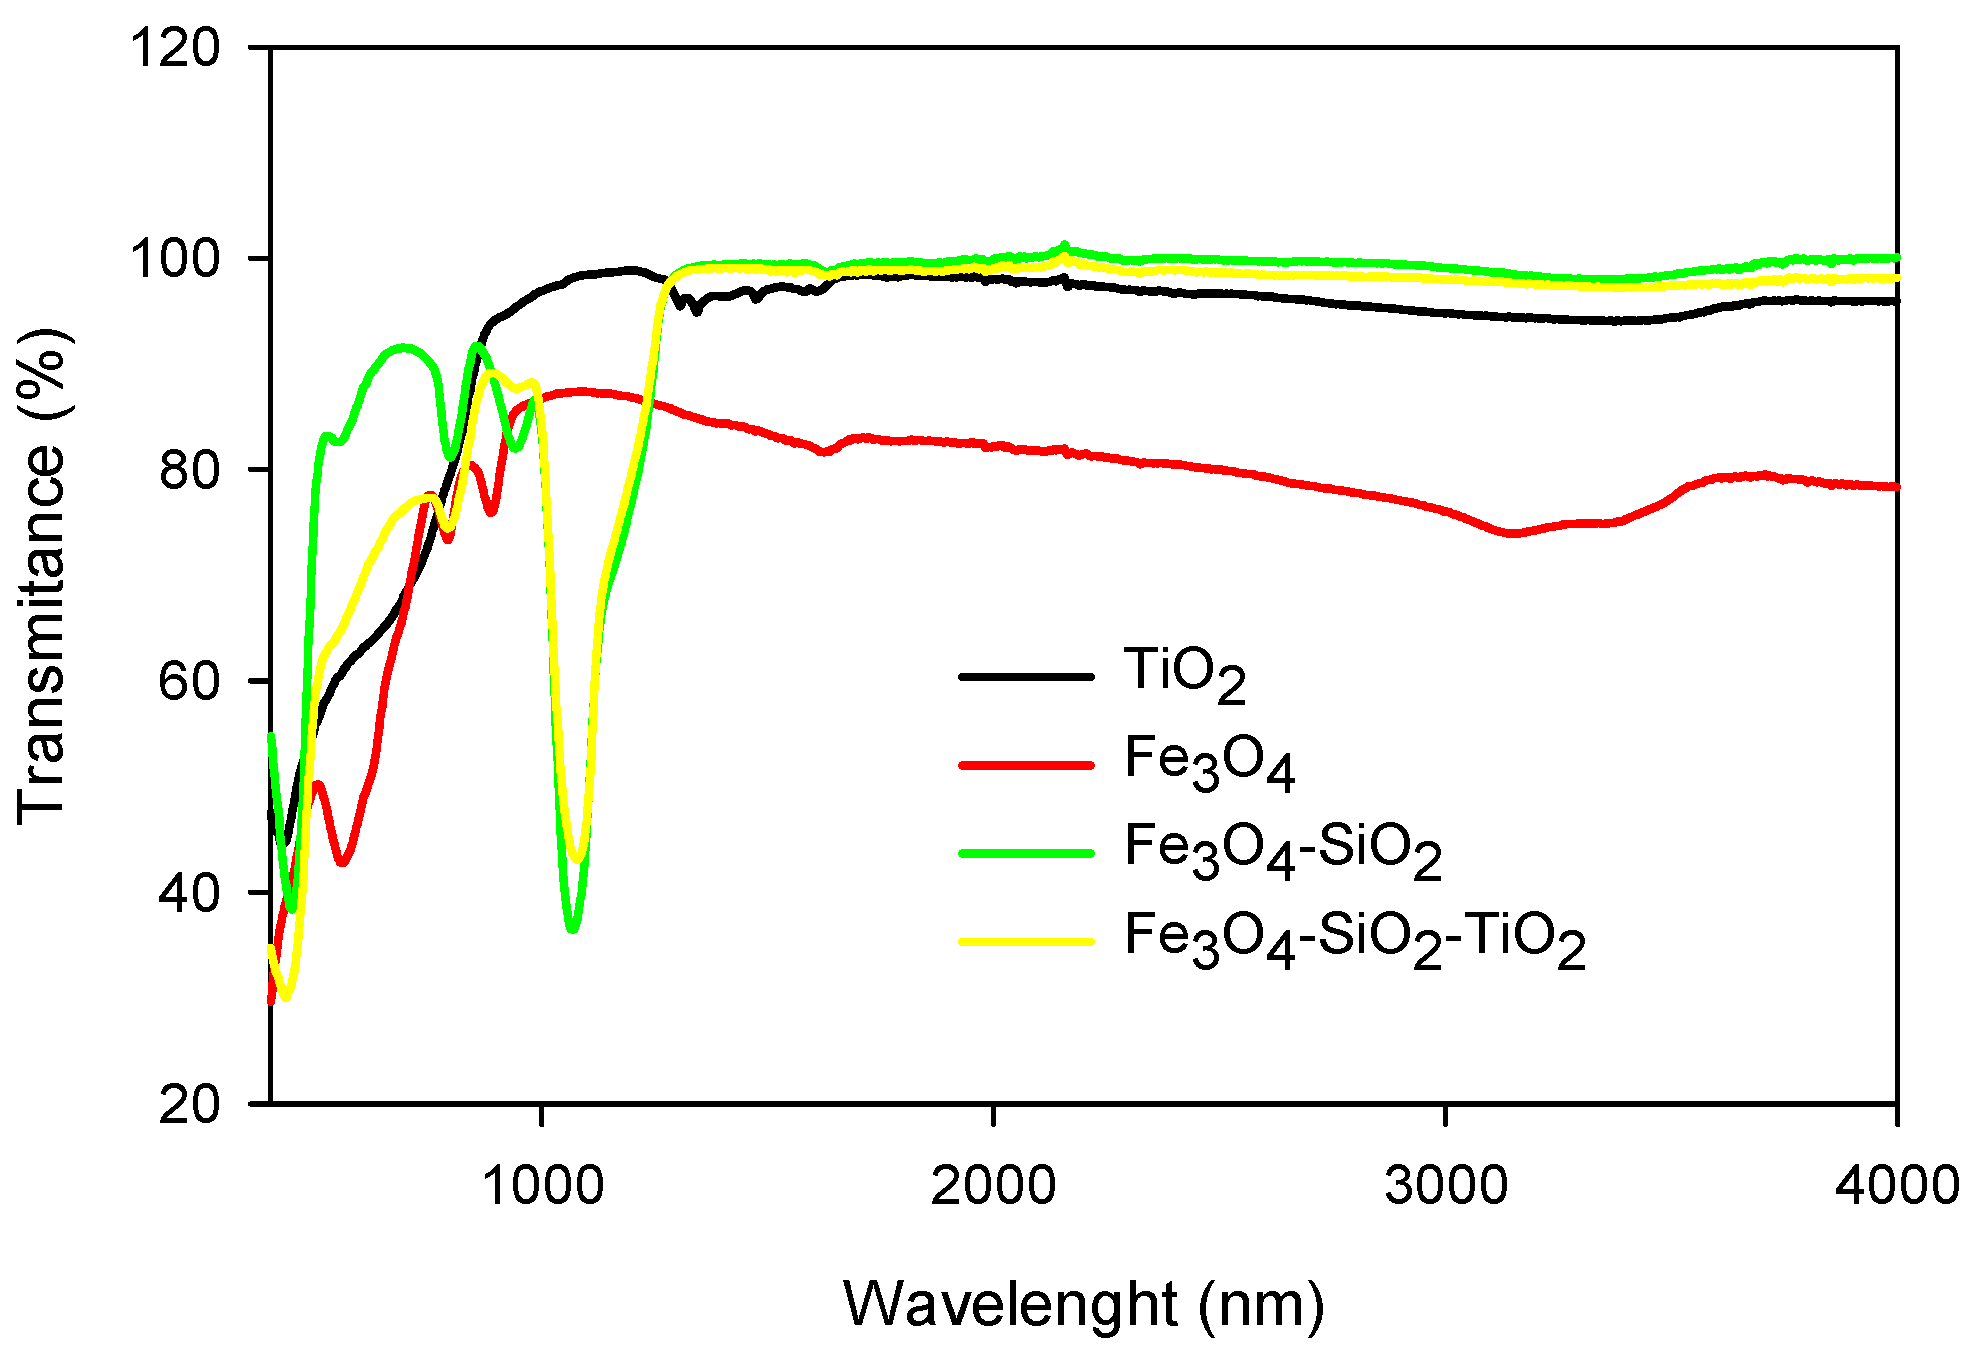
2.2.4. Fourier Transform Infrared
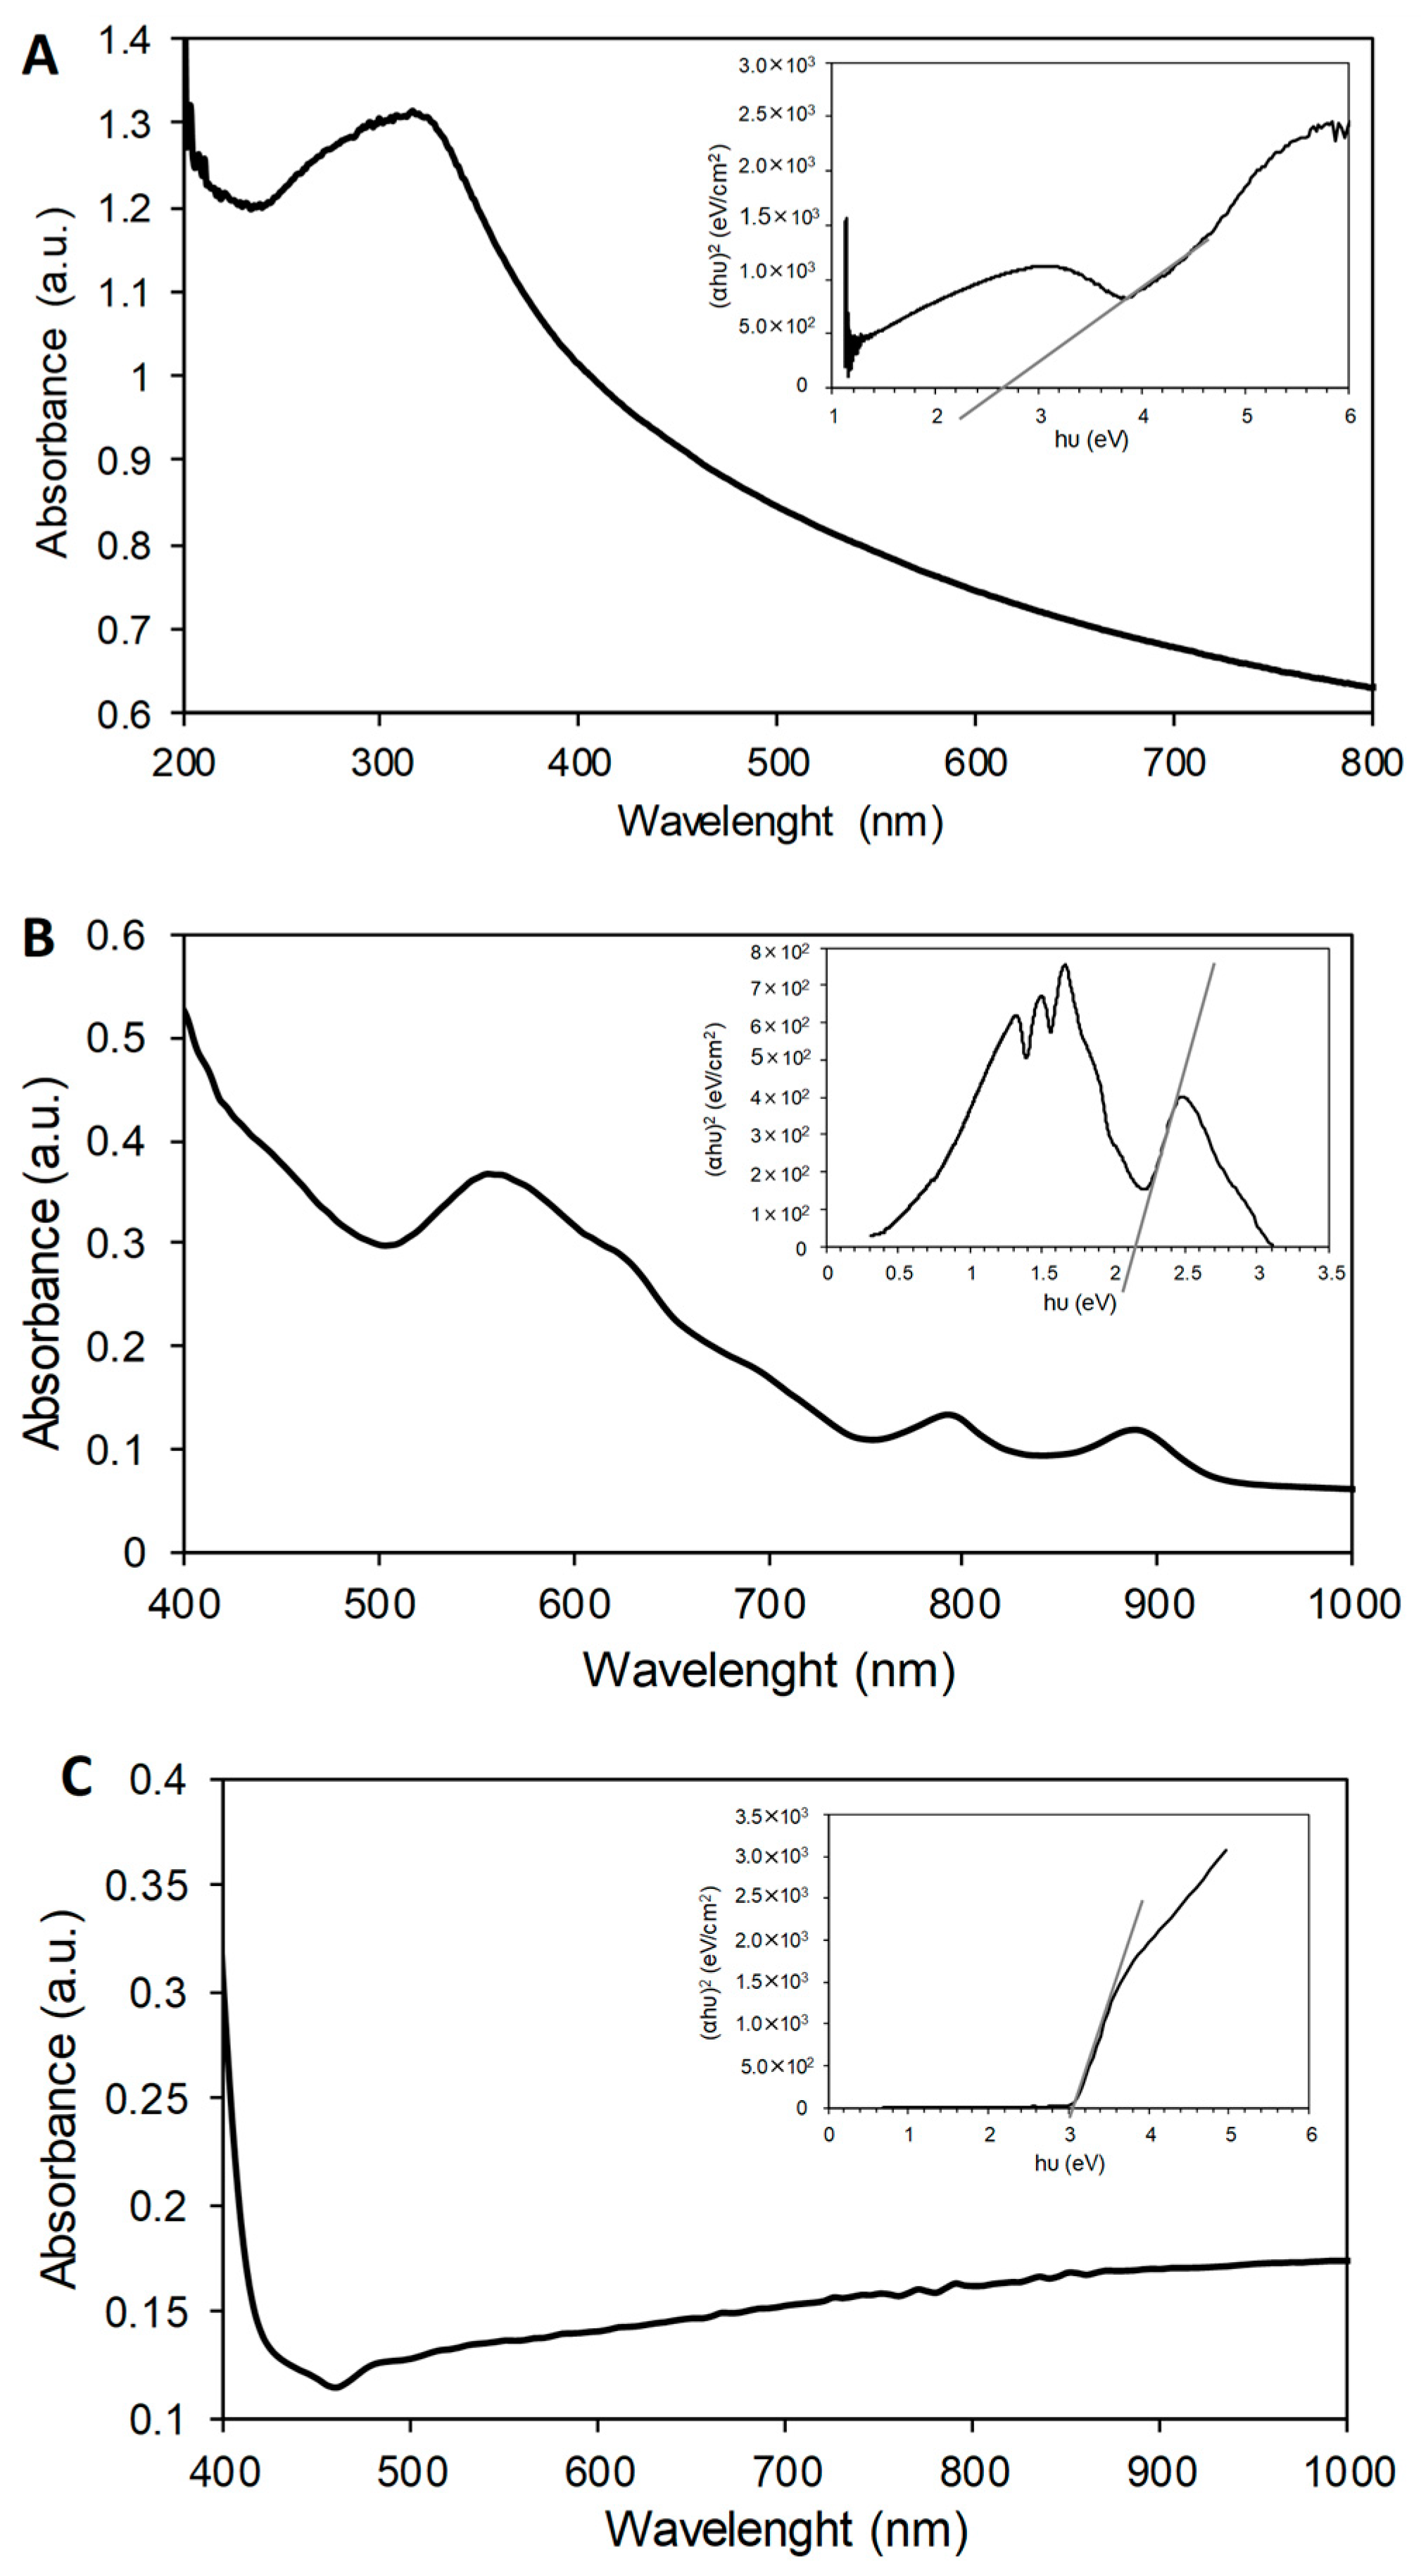
2.2.5. UV-VIS Spectra
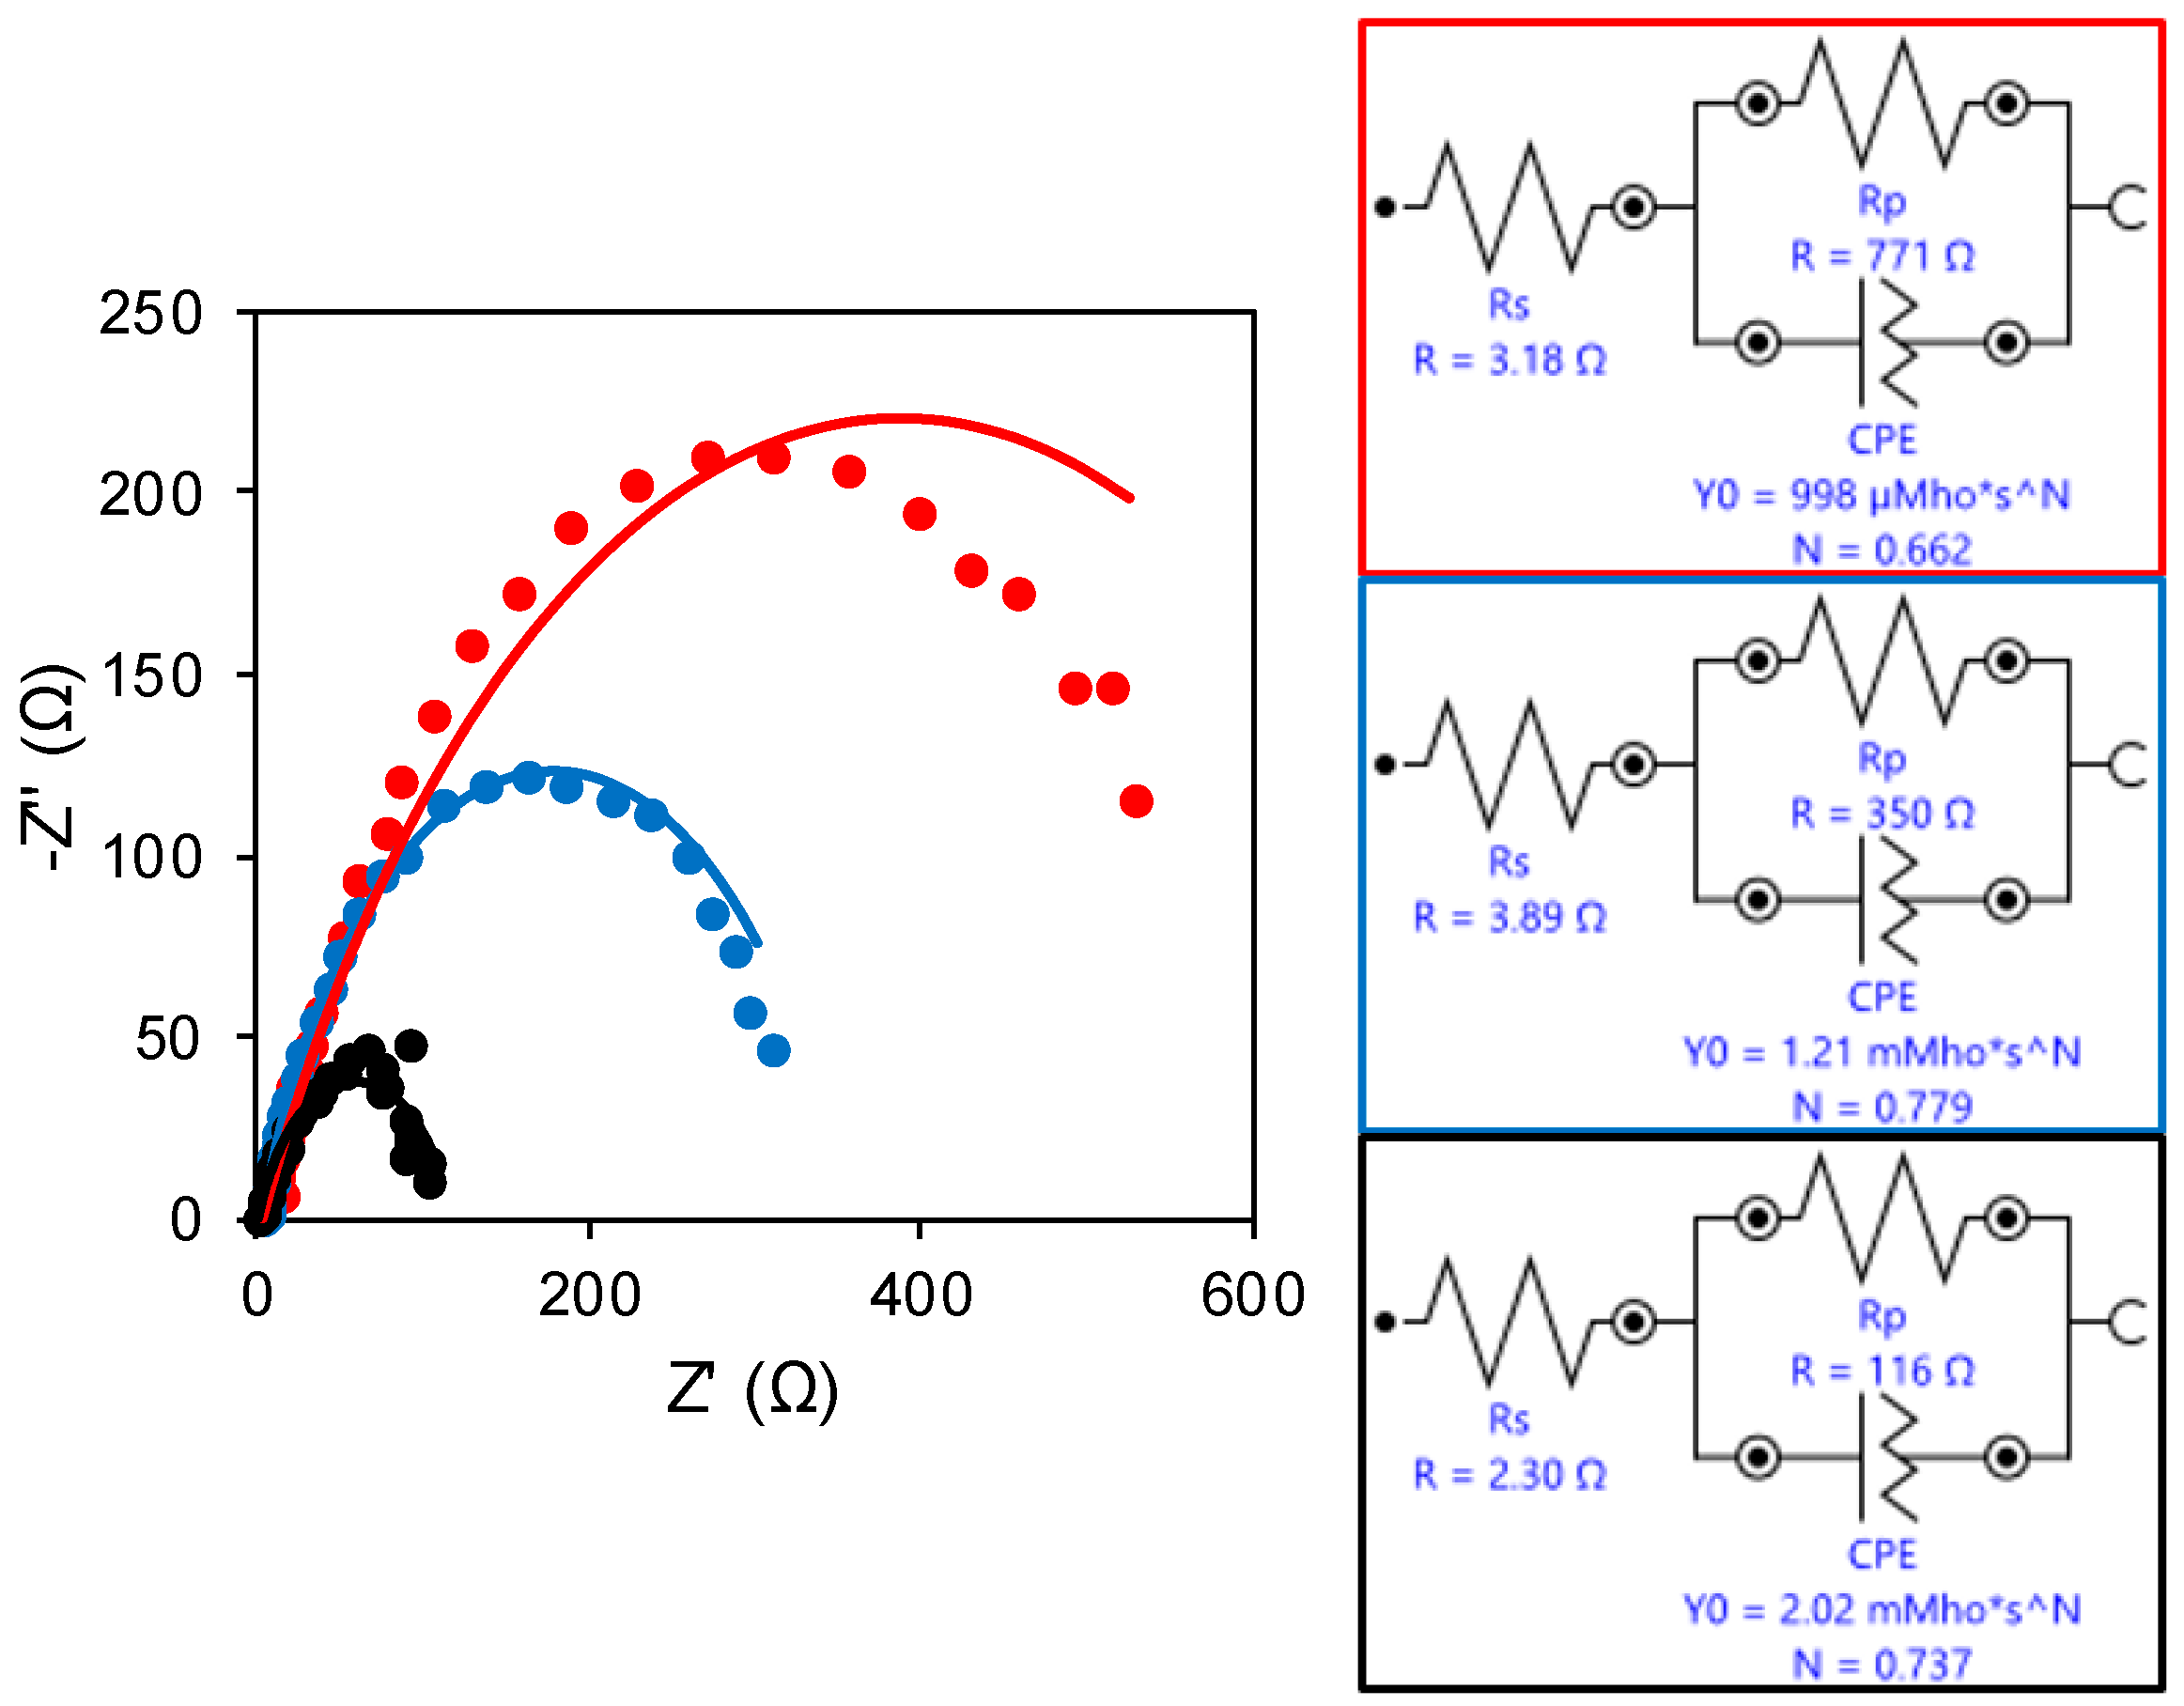
2.2.6. Electrochemical Properties
3. Discussion
3.1. Catalyst Performance
3.1.1. Catalyst Dosage
3.1.2. H2O2 Addition
3.1.3. Pollutant Concentration Effect
3.2. Catalyst Characterization
4. Materials and Methods
4.1. Reagents
4.2. Catalyst Synthesis
4.3. Set-Up
4.4. Analysis
4.4.1. Surface Area
4.4.2. X-ray Diffraction
4.4.3. Fourier Transform Infrared
4.4.4. UV-Vis Spectra
4.4.5. Electrochemical Characterization
4.4.6. TEM
5. Conclusions
Supplementary Materials
Author Contributions
Funding
Conflicts of Interest
References
- Kalam, A.; Al-Sehemi, A.G.; Assiri, M.; Du, G.; Ahmad, T.; Ahmad, I.; Pannipara, M. Modified solvothermal synthesis of cobalt ferrite (CoFe2O4) magnetic nanoparticles photocatalysts for degradation of methylene blue with H2O2/visible light. Results Phys. 2018, 8, 1046–1053. [Google Scholar] [CrossRef]
- Mahalingam, S.; Ramasamy, J.; Ahn, Y.H. Synthesis and application of graphene-αMoO3 nanocomposite for improving visible light irradiated photocatalytic decolorization of methylene blue dye. J. Taiwan Inst. Chem. Eng. 2017, 80, 276–285. [Google Scholar] [CrossRef]
- Habib, I.Y.; Burhan, J.; Jaladi, F.; Lim, C.M.; Usman, A.; Kumara, N.T.R.N.; Tsang, S.C.E.; Mahadi, A.H. Effect of Cr doping in CeO2 nanostructures on photocatalysis and H2O2 assisted methylene blue dye degradation. Catal. Today 2020, 375, 506–513. [Google Scholar] [CrossRef]
- Homocianu, M.; Pascariu, P. Electrospun Polymer-Inorganic Nanostructured Materials and Their Applications. Polym. Rev. 2020, 60, 493–541. [Google Scholar] [CrossRef]
- Chi, Y.; Yuan, Q.; Li, Y.; Zhao, L.; Li, N.; Li, X.; Yan, W. Magnetically separable Fe3O4@SiO2@TiO2-Ag microspheres with well-designed nanostructure and enhanced photocatalytic activity. J. Hazard. Mater. 2013, 262, 404–411. [Google Scholar] [CrossRef] [PubMed]
- El-Salamony, R.A.; Amdeha, E.; Ghoneim, S.A.; Badawy, N.A.; Salem, K.M.; Al-Sabagh, A.M. Titania modified activated carbon prepared from sugarcane bagasse: Adsorption and photocatalytic degradation of methylene blue under visible light irradiation. Environ. Technol. 2017, 38, 3122–3136. [Google Scholar] [CrossRef] [PubMed]
- Wang, S.; Gao, H.; Fang, L.; Hu, Q.; Sun, G.; Chen, X.; Yu, C.; Tang, S.; Yu, X.; Zhao, X.; et al. Synthesis of novel CQDs/CeO2/SrFe12O19 magnetic separation photocatalysts and synergic adsorption-photocatalytic degradation effect for methylene blue dye removal. Chem. Eng. J. Adv. 2021, 6, 100089. [Google Scholar] [CrossRef]
- Pignatello, J.J.; Oliveros, E.; MacKay, A. Advanced oxidation processes for organic contaminant destruction based on the Fenton reaction and related chemistry. Crit. Rev. Environ. Sci. Technol. 2006, 36, 1–84. [Google Scholar] [CrossRef]
- El-Naggar, M.E.; Wassel, A.R.; Shoueir, K. Visible-light driven photocatalytic effectiveness for solid-state synthesis of ZnO/natural clay/TiO2 nanoarchitectures towards complete decolorization of methylene blue from aqueous solution. Environ. Nanotechnol. Monit. Manag. 2021, 15, 100425. [Google Scholar]
- Diez, A.M.; Pazos, M.; Sanroman, M.A. Synthesis of magnetic-photo-Fenton catalyst for degradation of emerging pollutant. Catal. Today 2019, 328, 267–273. [Google Scholar] [CrossRef]
- Rahimi, S.M.; Arghavan, F.S.; Othmani, A.; Nasseh, N. Magnetically recoverable nickel ferrite coated with CuS nanocomposite for degradation of metronidazole in photocatalytic and photo fenton like processes. Int. J. Environ. Anal. Chem. 2020, 1–21. [Google Scholar] [CrossRef]
- Lei, Y.; Ding, J.; Yu, P.; He, G.; Chen, Y.; Chen, H. Low-temperature preparation of magnetically separable Fe3O4@ZnO-RGO for high-performance removal of methylene blue in visible light. J. Alloys Compd. 2020, 821, 153366. [Google Scholar] [CrossRef]
- Bardestani, R.; Patience, G.S.; Kaliaguine, S. Experimental methods in chemical engineering: Specific surface area and pore size distribution measurements-BET, BJH, and DFT. Can. J. Chem. Eng. 2019, 97, 2781–2791. [Google Scholar] [CrossRef]
- Mohamed, R.M.; Harraz, F.A. Photoreduction coupling of NiO/SiO2 nanocomposite with palladium and yttria nanoparticles: Visible-light-driven photocatalysts. Mater. Res. Bull. 2020, 131, 110965. [Google Scholar] [CrossRef]
- Pant, B.; Ojha, G.P.; Kuk, Y.S.; Kwon, O.H.; Park, Y.W.; Park, M. Synthesis and Characterization of ZnO-TiO2/Carbon Fiber Composite with Enhanced Photocatalytic Properties. Nanomaterials 2020, 10, 1960. [Google Scholar] [CrossRef] [PubMed]
- Doumic, L.I.; Génova, M.; Žerjav, G.; Pintar, A.; Cassanello, M.C.; Romeo, H.E.; Ayude, M.A. Hierarchically structured TiO2-based composites for Fenton-type oxidation processes. J. Environ. Manag. 2019, 236, 591–602. [Google Scholar] [CrossRef] [PubMed]
- Saeed, M.; Ahmad, A.; Boddula, R.; ul Haq, A.; Azhar, A. Ag@MnxOy: An effective catalyst for photo-degradation of rhodamine B dye. Environ. Chem. Lett. 2018, 16, 287–294. [Google Scholar] [CrossRef]
- AlSalhi, M.S.; Sakthisabarimoorthi, A.; Devanesan, S.; Dhas, S.M.B.; Jose, M. Study on photocatalytic and impedance spectroscopy investigations of composite CuO/ZnO nanoparticles. J. Mater. Sci. Mater. Electron. 2019, 30, 13708–13718. [Google Scholar] [CrossRef]
- Subalakshmi, A.; Kavitha, B.; Srinivasan, N.; Rajarajan, M.; Suganthi, A. An affordable efficient SrWO4 decorated Bi2O3 nanocomposite: Photocatalytic activity for the degradation of methylene blue under visible light irradiation. Mater. Today Proc. 2021, in press. [Google Scholar] [CrossRef]
- Guo, Y.; Zhang, J.; Zhou, D.; Dong, S. Fabrication of Ag/CDots/BiOBr ternary photocatalyst with enhanced visible-light driven photocatalytic activity for 4-chlorophenol degradation. J. Mol. Liq. 2018, 262, 194–203. [Google Scholar] [CrossRef]
- Mahanthappa, M.; Kottam, N.; Yellappa, S. Enhanced photocatalytic degradation of methylene blue dye using CuSCdS nanocomposite under visible light irradiation. Appl. Surf. Sci. 2019, 475, 828–838. [Google Scholar] [CrossRef]


| MB (mg/L) | Radiation Source | H2O2 (mg/L) | Photocatalyst | Elimination (%)/min | Ref. | |
|---|---|---|---|---|---|---|
| Type | Concentration (g/L) | |||||
| 100 | Vis: 400 nm, 100 W | - | TiO2–AC | 1 | 0.53 | [17] |
| 10 | Vis: 500 W | - | CuO/ZnO NPs | 2 | 0.71 | [18] |
| 3.19 | Vis: 420 nm, 300 W | - | SrWO4/ Bi2O3 | 0.1 | 0.55 | [19] |
| 20 | Vis: n.r. | - | Fe3O4-ZnO–RGO | 0.25 | 0.56 | [12] |
| 10 | Vis: 400 nm | 0.16 | CoFe2O4 | 0.01 | 0.57 | [1] |
| 20 | Vis: 400–740 nm, 600 W. | 0.6 | Fe3O4–SiO2–TiO2 | 0.8 | 1.44 | This study |
Publisher’s Note: MDPI stays neutral with regard to jurisdictional claims in published maps and institutional affiliations. |
© 2021 by the authors. Licensee MDPI, Basel, Switzerland. This article is an open access article distributed under the terms and conditions of the Creative Commons Attribution (CC BY) license (https://creativecommons.org/licenses/by/4.0/).
Share and Cite
Díez, A.M.; Valencia, H.E.; Meledina, M.; Mayer, J.; Kolen'ko, Y.V. Photocatalytic-Fenton Process under Simulated Solar Radiation Promoted by a Suitable Catalyst Selection. Catalysts 2021, 11, 885. https://doi.org/10.3390/catal11080885
Díez AM, Valencia HE, Meledina M, Mayer J, Kolen'ko YV. Photocatalytic-Fenton Process under Simulated Solar Radiation Promoted by a Suitable Catalyst Selection. Catalysts. 2021; 11(8):885. https://doi.org/10.3390/catal11080885
Chicago/Turabian StyleDíez, Aida M., Helen E. Valencia, Maria Meledina, Joachim Mayer, and Yury V. Kolen'ko. 2021. "Photocatalytic-Fenton Process under Simulated Solar Radiation Promoted by a Suitable Catalyst Selection" Catalysts 11, no. 8: 885. https://doi.org/10.3390/catal11080885
APA StyleDíez, A. M., Valencia, H. E., Meledina, M., Mayer, J., & Kolen'ko, Y. V. (2021). Photocatalytic-Fenton Process under Simulated Solar Radiation Promoted by a Suitable Catalyst Selection. Catalysts, 11(8), 885. https://doi.org/10.3390/catal11080885