Article

Insights into the Mechanism of Ethionamide Resistance in Mycobacterium tuberculosis through an in silico Structural Evaluation of EthA and Mutants Identified in Clinical Isolates

by
Vinicius Carius de Souza
1,†,
Deborah Antunes
2,†,
Lucianna H.S. Santos
3,
Priscila Vanessa Zabala Capriles Goliatt
1,
Ernesto Raul Caffarena
4,
Ana Carolina Ramos Guimarães
2,* and
Teca Calcagno Galvão
2
1
Programa de Pós-graduação em Modelagem Computacional, Universidade Federal de Juiz de Fora–UFJF, Juiz de Fora 36036-330, Brazil
2
Fiocruz, Laboratório de Genômica Funcional e Bioinformática, Instituto Oswaldo Cruz, Av. Brasil 4365, Rio de Janeiro 21040-360, Brazil
3
Laboratório de Modelagem Molecular e Planejamento de Fármacos, Departamento de Bioquímica e Imunologia, Instituto de Ciências Biológicas, Universidade Federal de Minas Gerais, Belo Horizonte 31270-901, Brazil
4
Fiocruz, Programa de Computação Científica, Av. Brasil 4365, Rio de Janeiro 21040-360, Brazil
*
Author to whom correspondence should be addressed.
These authors contributed equally to this work.
Catalysts 2020, 10(5), 543; https://doi.org/10.3390/catal10050543
Submission received: 31 December 2019 / Revised: 10 February 2020 / Accepted: 16 February 2020 / Published: 14 May 2020
(This article belongs to the Special Issue Flavin Monooxygenases)

Abstract

:
Mutation in the ethionamide (ETH) activating enzyme, EthA, is the main factor determining resistance to this drug, used to treat TB patients infected with MDR and XDR Mycobacterium tuberculosis isolates. Many mutations in EthA of ETH resistant (ETH-R) isolates have been described but their roles in resistance remain uncharacterized, partly because structural studies on the enzyme are lacking. Thus, we took a two-tier approach to evaluate two mutations (Y50C and T453I) found in ETH-R clinical isolates. First, we used a combination of comparative modeling, molecular docking, and molecular dynamics to build an EthA model in complex with ETH that has hallmark features of structurally characterized homologs. Second, we used free energy computational calculations for the reliable prediction of relative free energies between the wild type and mutant enzymes. The ΔΔG values for Y50C and T453I mutant enzymes in complex with FADH2-NADP-ETH were 3.34 (+/−0.55) and 8.11 (+/−0.51) kcal/mol, respectively, compared to the wild type complex. The positive ΔΔG values indicate that the wild type complex is more stable than the mutants, with the T453I complex being the least stable. These are the first results shedding light on the molecular basis of ETH resistance, namely reduced complex stability of mutant EthA.

1. Introduction

Although tuberculosis (TB) is a treatable disease, Mycobacterium tuberculosis is the single infectious agent causing the highest number of deaths [1]. Despite efforts by governments and bodies such as the WHO, the spread of drug-resistant strains continues. Factors underlying drug resistance include prolonged treatment schemes (ranging from 6 to 18 months), patient social vulnerability and the structure and effectiveness of health systems [2]. Ethionamide (ETH) is used in treatment schemes of TB patients infected with drug-resistant M. tuberculosis. ETH has a low therapeutic index [3] and frequently causes dose-dependent adverse effects (reviewed in [4]). Still, with the increase in the number of patients infected with isolates resistant to the range of drugs available [1], ETH is a critical resource in the clinic.
ETH is a prodrug activated by EthA, a flavin adenine dinucleotide (FAD)-containing NADPH- and O2-dependent Baeyer-Villiger monooxygenase (BVMO) [5,6,7]. Other proteins, such as MymA [8], EthR2 [9], Rv0565c [10] and MshA [11], have also been implicated in this process. However, because mutations in EthA are by far, the most commonly found in ETH resistant (ETHR) M. tuberculosis clinical isolates, this protein is considered the major enzyme capable of forming the bactericidal NAD-ETH adduct (reviewed in [12]). The in vivo role of EthA in M. tuberculosis has not been fully elucidated but seems to involve modulation of cell wall composition. This is based on data showing that deletion of the ethA-ethR locus of Mycobacterium bovis BCG altered cell wall mycolic acid composition and increased adherence to host cells in vitro, a phenotype that can be modulated by cell wall components [13]. Because the mutant accumulates keto-mycolic acids, Alonso and colleagues have postulated a role for EthA in oxidizing keto-mycolic acids to wax ester mycolic acids, a reaction previously shown to be catalyzed by a BVMO in Mycobacterium phlei [13,14].
BVMOs use NADPH as an electron source and molecular oxygen as an oxidant to convert compounds with carbonyl groups into esters or lactones. This class of enzymes can transform a huge number of substrates with great regio- and enantioselectivity, making these enzymes highly relevant as biocatalysts. The type I oxygenation reaction catalyzed by FAD-dependent BVMOs depends on NADPH binding and reducing a stably bound FAD. NADPH, an electron donor, binds to FAD-bound BVMO, reduces FAD, and the reduced flavin reacts with molecular oxygen, forming a reactive flavin-peroxide intermediate that is stabilized by NADP. When the substrate is in the binding site, its electrophilic carbonyl suffers a nucleophilic attack by the peroxyflavin intermediate, forming the Criegee intermediate (a tetrahedral species). Product formation occurs by rearranging the Crieege intermediate coupled to forming the product ester, the regeneration of the oxidized flavin and NADP+ release (reviewed in [15,16,17]).
Nearly two hundred mutations in EthA have been reported in ETHR clinical isolates (compiled in [18]). They are non synonymous substitutions, opal mutations, frameshits, and insertions, likely causing a wide range of changes in EthA that can affect ETH activation. Enzymology studies have described intermediates of ETH activation by EthA [7,19]), without focusing on the BVMO reaction nor in EthA structural aspects. Thus, studies on EthA and on the impact of mutations found in ETHR clinical isolates are sorely lacking. Mutations Y50C and T453I are likely to cause resistance as they were identified in ETHR clinical isolates. Y50 lines the EthA binding pocket for FADH2 and NADP [18], and mutation of the equivalent tyrosine in OTEMO reduces catalysis [20]. T453 is in the control loop region, whose movement is essential for catalysis. Here we use computational approaches to build and validate an EthA model and test the impact of Y50C and T453I.

2. Results and Discussion

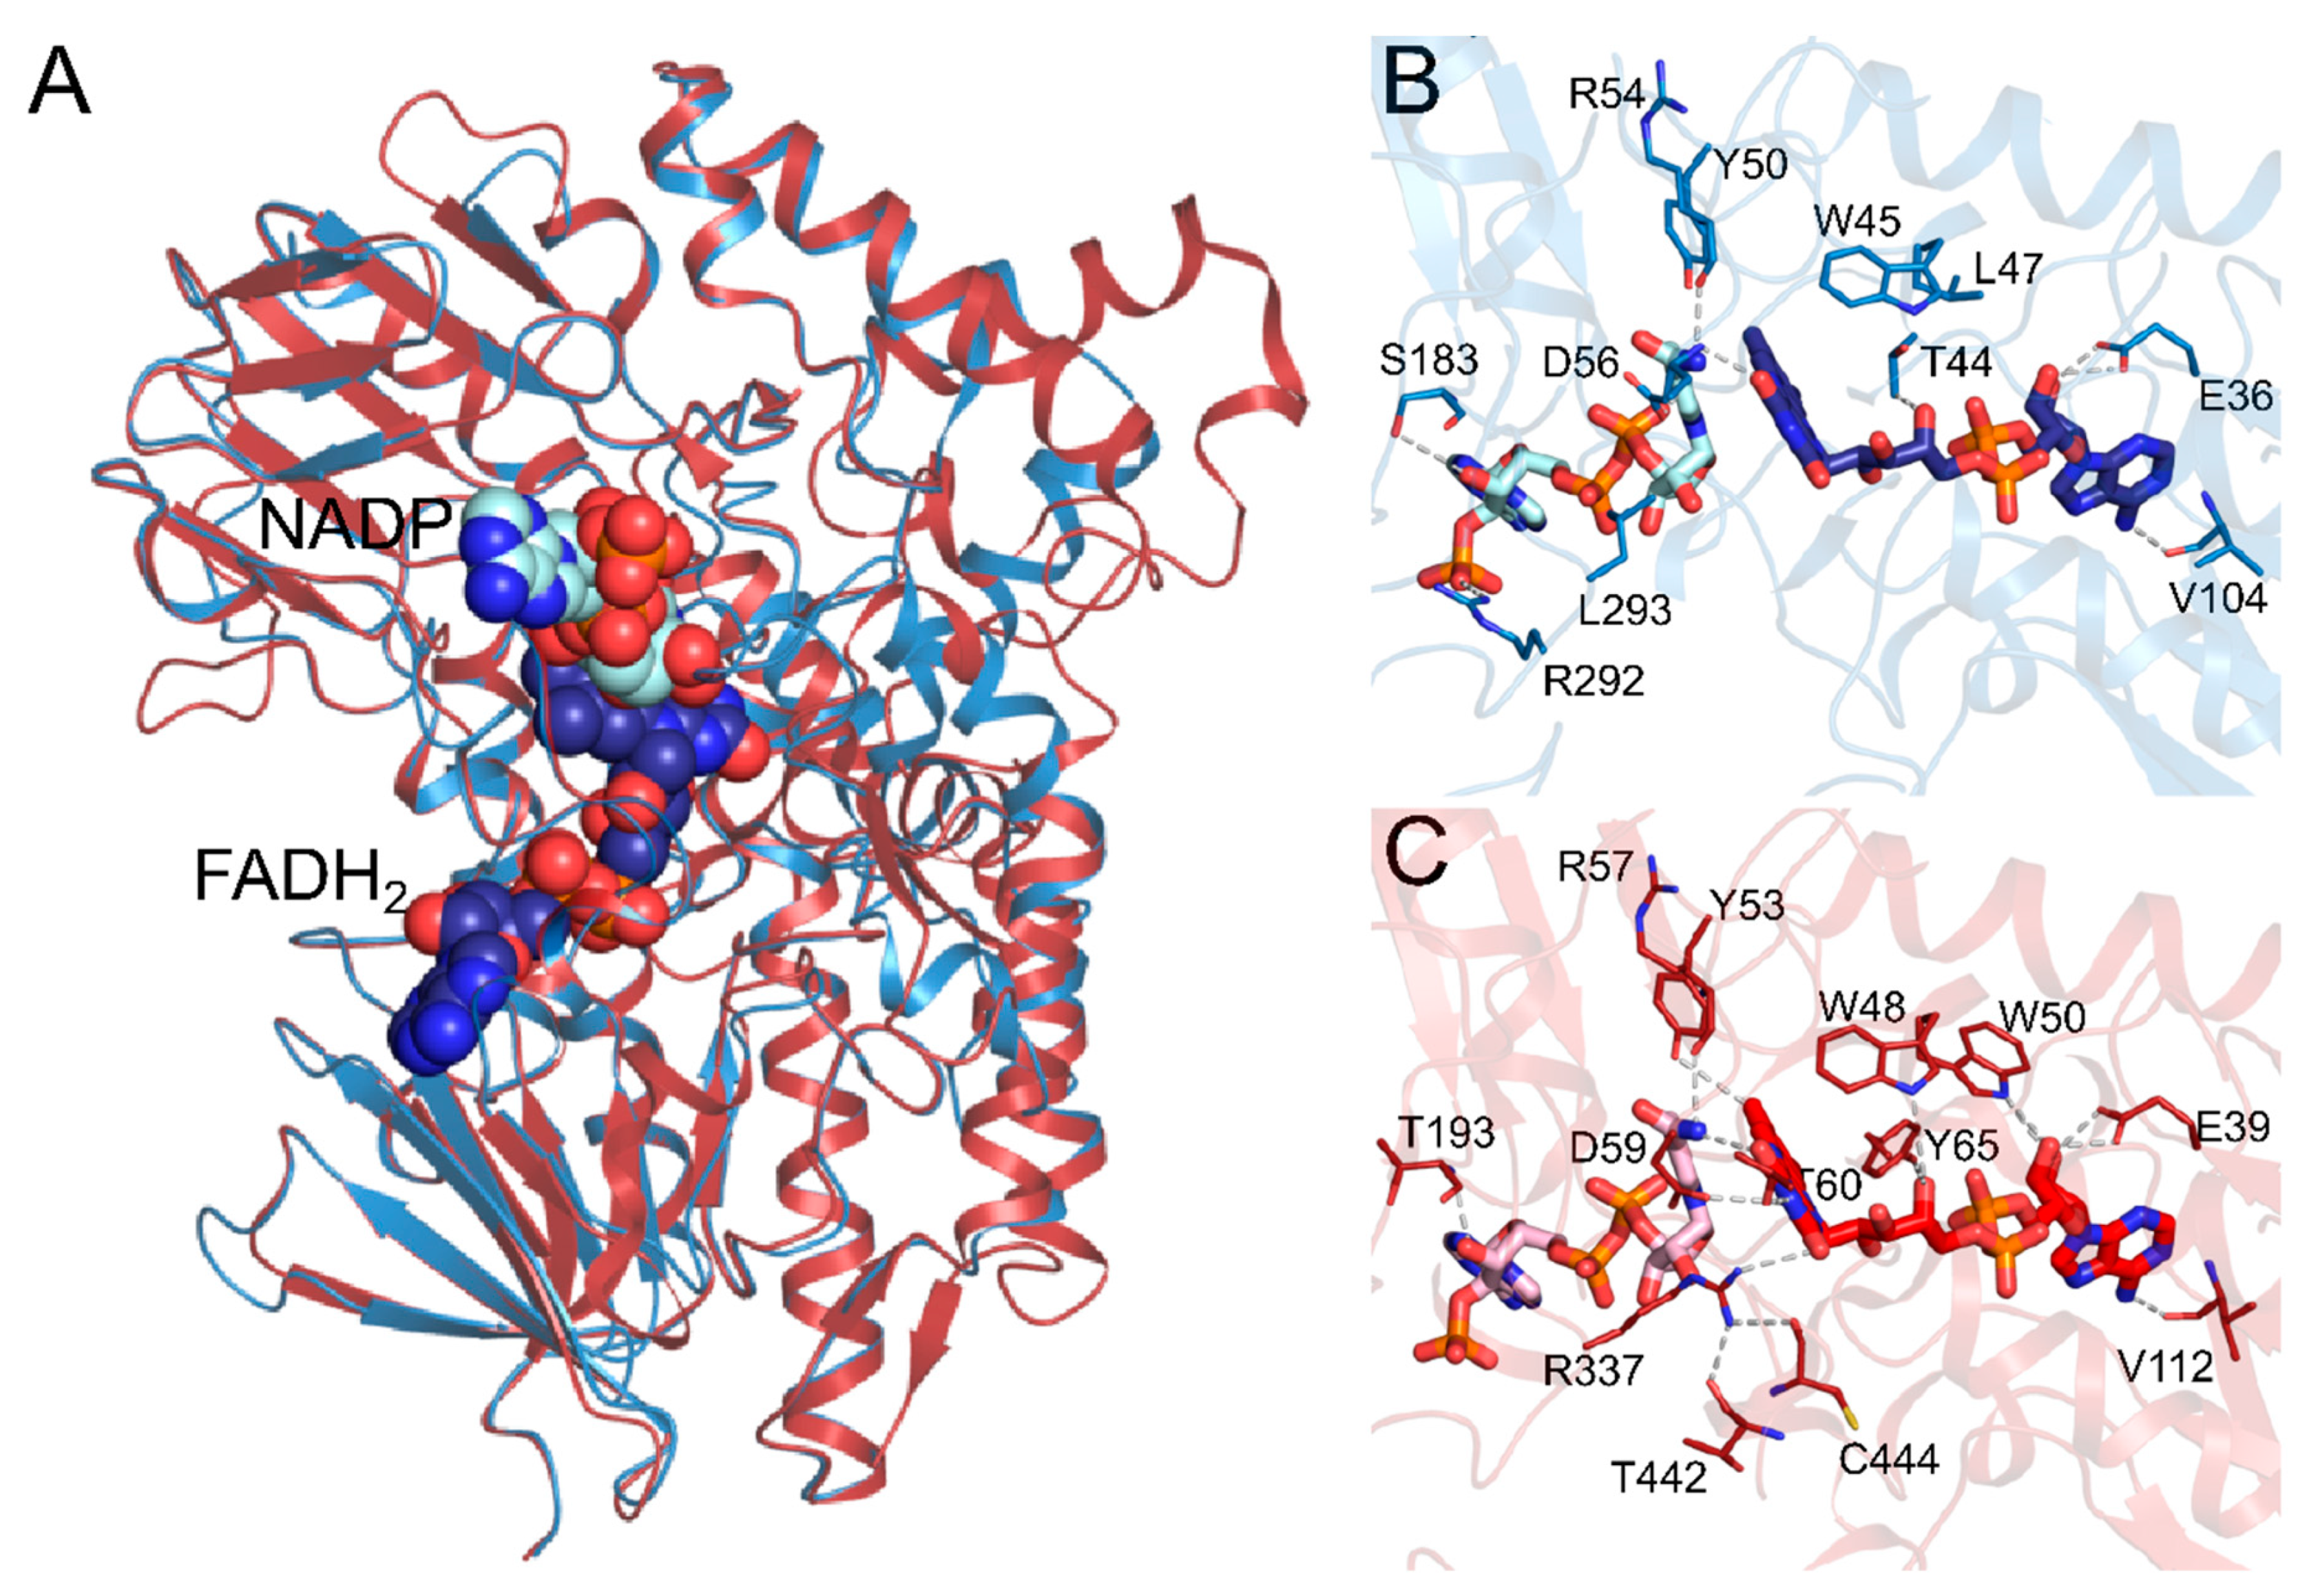
2.1. Comparative Modeling

We modeled the three-dimensional (3D) structure of the 489 amino acid long EthA enzyme from M. tuberculosis (UNIPROT P9WNF9) by comparative modeling using as a template the structure of Pseudomonas putida OTEMO (PDB 3UOZ) [20]. Sequence alignment between EthA and 3UOZ revealed 25% identity, 39% similarity, 20% of gaps, and a query coverage of 450 amino acids (Figure 1a). EthA sequence similarity to cyclohexanone monooxygenase (CHMO), steroid monooxygenase (STMO) and phenylacetone monooxygenase (PAMO), the other BVMOs for which crystal structures are available, is lower than to OTEMO (data not shown). To optimize the overall structure, secondary structure constraints were inserted during the modeling process via Modeller v9.21 [21,22]. All generated models considered the presence of FADH2 and NADP. The quality assessment results of the model were favorable according to ProSA-web, Whatcheck, and DOPE score. For the analysis of stereochemical quality, according to Molprobity, 95.2% of the residues were in the favorable or allowed regions of the Ramachandran map, and Procheck analysis showed that 95.7% of the residues were in the most favorable or allowed regions.
In another step to analyse the model, intermolecular interactions in the EthA FAD and NADPH binding regions were mapped by Protein Ligand Interaction Profiler (PLIP) [23] and compared with those observed in 2-oxo-Δ 3 -4,5,5-trimethylcyclopentenylacetyl-coenzyme A monooxygenase (OTEMO). As shown in Figure 1a, the amino acids making up the OTEMO and EthA FAD and NADPH binding sites are mostly conserved. Three mobile regions characteristic of BVMOs are shown, the BVMO motif, the interdomain linker and the control loop [24]; reviewed in [25]. The overall organization of EthA and OTEMO is shown in Figure 1b, including four regions that, in OTEMO crystal structures, either appear disordered or adopt different conformations [20].
Figure 2 shows the 3D alignment between the EthA model and 3UOZ. The amino acids contributing to FADH2 and NADP binding in OTEMO are mostly conserved in EthA (Figure 2b,c), but there are two important differences. First, in OTEMO, T442 and C444-V446 hold catalytic R337 near the FADH2 isoalloxazine ring; this stretch of amino acids is missing in EthA, and, is not conserved in other BVMOs [18]. Second, the catalytic arginine, R292, is at a different position in EthA, possibly as a result of the absence of the above-mentioned amino acids. Alternatively, the difference in position of the catalytic arginine may be in line with the observation that it adopts two conformations, competent for either intermediate stabilization or for allowing an NADPH arrangement that is competent for reducing FAD [28].

2.2. Clustering and Molecular Docking

MD simulations and clustering analysis helped improve and refine EthA model in complex with cofactors and ligand ETH. We checked which EthA residues or regions underwent structural fluctuations via RMSF calculations (Figure 3) and observed that residues M1, R483 and the loop P486-V489 exhibited the highest fluctuations. A contact matrix with other residues up to 10 Å away was used to analyze conformational changes.
Based on high dimensional data from contact matrices, the PCA and Spectral methods were applied to obtain a new dimensional space (intrinsic space), and Ward clustering was performed. The BVMO motif, interdomain linker, and control loop interact during BVMO catalysis [24]. Thus, the criteria to select representative structures in the clusters obtained was the position of these functional regions relative to each other. The lowest energy conformations from two clusters (01346 and 13841) and the conformation with the overall lowest energy (14053), as detected by the Spectral method, were chosen. While in conformation 01346 the control loop is away from the interdomain linker, in conformations 13841 and 14053 these regions are proximal (Figure 4a−c).
ETH was docked into the region encompassed by amino acids R292-L295, whose interaction with ETH has been proposed for an EthA homolog in A. radioresistens [26]. The putative binding site includes R292 of EthA, a conserved catalytic arginine (Figure 4d−e). Configurations in which the interdomain linker and control loop remained closer (13841 and 14053) were also the ones yielding lower values of interaction energy, indicating more stable ETH binding (Table 1). In the A. radioresistens EthA homolog model, the interaction energy of ETH upon docking was higher [26], indicating a less stable interaction than found here for M. tuberculosis EthA. The docked systems were used for further characterization of the ETH-EthA interaction. It is interesting to point out that in configurations with proximal interdomain linker and control loop (13841 and 14053) ETH interacted with R456. This arginine is adjacent to conserved W455, whose movement together with the rest of the control loop has been described as essential in BVMO catalysis [20,24].

2.3. Assessing the Dynamic Properties of the EthA in Complex with ETH

The structural stability of ETH in different EthA conformations was evaluated by comparing the average RMSD of the systems during MD simulations (Table 2). During simulations, all systems presented EthA and NADP RMSD deviation of around 2 Å and 1.3 Å, respectively, showing a steady behavior throughout the triplicates (Figures S1 and S2). FADH2 remained stable in the 13841 system (1.4 ± 0.3 Å) and less in 14053 (2.9 ± 0.7 Å). (Figure S2). RMSD values of ETH in the 14053 system remained low when compared to 01346 and 13841. Average and standard deviations were 2.9 ± 1.1 Å, 7.0 ± 1.2 Å, and 4.9 ± 3.0 Å, respectively (Figure S1).
We also calculated the hydrogen bond occupancy regarding pairs of residues involved in critical interactions (Table 3). System 01346 formed hydrogen bonds with different residues (C294, A237, and W240) and low occupancy values. ETH hydrogen-bonded to the residues (Q291, T453, and R456) in both the 13841 and 14053 systems. The occupancy values observed in the 14053 system were higher, reaching up to 64%.
The time evolution of the RMSD values show that ETH suffered minor conformational changes in system 14053 when compared to the others. Thus, to inspect the configurational evolution of ETH over time, a clustering analysis was performed using all trajectories with a cut-off of 1.5 Å (Figure 5). ETH mobility and instability in systems 01346 and 13841 contributed to a broad exploration of the pocket, resulting in entirely different poses in the replicates. For the 14053 system, out of 72 clusters reported, the most significant (cluster 1) accounted for 58% of movements in the triplicates. In this system, ETH hydrogen-bonded to Q291, T453, and R456, in line with hydrogen bond occupancy (Table 3). Thus, a convergent configuration of ETH in the replicates was found in the 14053 system.
In OTEMO, two configurations of the control loop, β-hairpin and closed, result in an open or closed active site, respectively. Between these configurations the control loop position shifts dramatically, and in the closed configuration, W501, a BVMO conserved residue, moves 9 Å to make a hydrogen bond with NADP (in agreement with experimental evidence for the role of this residue in catalysis [24]). The shift in the control loop, specifically in the adjacent amino acid W502, is associated with changes in the conformation of the amino acids around catalytic R337 [20]. The observations that in system 14053 residue R456 (adjacent to W455, equivalent to W501) interacts with ETH (Table 1, Table 2 and Table 3; Figure 5) and that the interdomain linker and control loops are in contact are coherent with the importance of this mobile region. Also, these observations open speculation about a role for substrate binding in triggering the control loop movement.
Figure 6 presents the last ETH stabilization frame docked in the 14053 system after the molecular dynamics simulation. Despite the important role attributed to OTEMO W501 in NADP binding upon approximation between the control loop and interdomain linker [20], W455 in EthA remains distant from NADP throughout the molecular dynamics. Instead, R456 makes hydrogen bonds with NADP and ETH:N, suggesting a role in catalysis in place of W455. Interestingly, the conserved catalytic arginine, R292, appears to play an essential role in stabilizing NADP and forming the EthA-ETH complex. The R292-ETH:S interaction would favor electron transfer from the FADH2-NADP system. Prior to molecular dynamics the position of R292 was away from NADP (Figure 2b,c), showing the importance of the molecular dynamics experiments to reveal EthA features. The model was built on an alignment of sequences with limited similarity, and the approach of optimizing the structure has replicated this important feature in BVMO catalysis.

2.4. Free Energy Changes for Y50C and T453I EthA Mutants

To evaluate the impact of mutations found in ETHR clinical isolates, we chose to perform two relative alchemical free energies calculations in the FAD-binding domain. The influence of mutations Y50C and T453I in ligand binding (NADP, FADH2, and ETH) were computed using thermodynamic integration (TI). The rationale for choosing these mutations is as follows. The Y50C mutation has been found in three ETHR clinical isolates [29] and Y50 is conserved in other BVMOs for which three-dimensional structures are available (CHMO, PAMO, OTEMO, and STMO; [18]). It is part of the EthA region that concentrates a large number of mutations in ETHR isolates and which displays 67% similarity to an OTEMO stretch rich in FADH2 and NADP binding amino acids [18]. Also, mutation of the equivalent amino acid in OTEMO, Y53, to phenylalanine, reduces catalysis to 30% [20]. T453 is in the control loop, and the T453I mutation has been identified in two clinical isolates [29]. Also, in system 14053 ETH hydrogen bonds with T453 and is in contact with NADP (Table 3; Figure 5 and Figure 6). Thus, to test the influence of mutations Y50C and T453I in ligand binding (NADP, FADH2, and ETH), we used TI alchemical transformations.
Based on MD analysis showing stable ETH conformation in the -14053 system, we selected the most representative structure for TI simulations. When the Y50 ↔ C50 and T453 ↔ I453 transformations were assessed, positive values of ΔΔG of 3.34 ± 0.55 and 8.11 ± 0.51, respectively, were achieved (Table 4). Positive ΔΔGs implies substituting Y50 and T453 by C50 and I453 would be unfavorable to NADP, FADH2, and ETH binding. Electrostatic transformation (Table 4) achieved similar ΔG values for both systems showing that charge affected the systems equally. However, a substantial change in the van der Waals (vdW) transformation could be noticed for the NADP, FADH2, and ETH bound systems. Spatially, Y50 is located at distances of 3.3 Å, 6.8 Å and 14 Å from NADP, FADH2 and ETH, respectively, suggesting that the ΔΔG value in the Y50C transformation is unlikely to be related to ETH. Y50 lines the FADH2-NADP pocket but mapping of their contacts by PLIP does not show bonding to either molecule. Thus, the reduced stability of the EthA Y50C complex detected by TI together with the reduced catalytic activity measured for the Y53F OTEMO mutant (without detectable loss of NADP affinity [20]) indicate that mutation in this position has a definite, but indirect, role in catalysis. By contrast, distances between T453 and NADP and ETH were 1.8 Å and 3.2 Å, respectively (Figure 7). Thus, in this case the interactions with ETH and NADP are likely to contribute more to the ΔΔG of transformation T453I, which was more unfavorable than Y50C (8.11 and 3.34 kcal/mol, respectively) and resulted in a marked loss of complex stability. The underlying reason for this is that T453 interacts directly with ETH, via hydrogen bonding. The change to isoleucine likely destabilizes this bond, compromising the affinity between the substrate and the enzyme.

3. Materials and Methods

3.1. Comparative Modeling

Three-dimensional models of EthA (UNIPROT P9WNF9) were modeled using the program Modeller v9.21 [21,22]. The template was selected based on local alignment between the EthA sequence and of proteins deposited in Protein Data Bank (PDB). The structure 3UOZ was selected based on sequence identity, similarity, and maximum query coverage parameters. The sequence alignment between EthA and template was generated using ClustalΩ [30]. To verify the secondary structure consensus areas between the target sequence and template, the following programs were used: PSIPRED, NetSurfP, Jpred3, PORTER, SCRATCH and Jufo9D. Also, cysteine disulfide bond analysis was performed by Cyspred and Disulfind programs. Based on the consensus regions predicted by these programs, secondary structure constraints were inserted during the modeling process via Modeller v9.21, performing two cycles of very slow optimization steps of VTFM and MD. 3D models were built considering all heteroatoms from the template. The best model was chosen according DOPE-HR and molpdf energies calculated by Modeller, structural quality evaluated by ProSA-web and Whatcheck, and stereochemical quality assessed by Procheck and Molprobity programs.

3.2. Molecular Dynamics (MD)

MD simulations were carried out using AMBER 18.0 [31,32], and protein interactions were represented using ff14SB forcefield [33]. Bonded, electrostatic and Lennard-Jones parameters for ligands (NADP FADH2 and ETH) were obtained using the generalized amber force field (GAFF) [34] and AM1-BCC [35] tools while atomic partial charges were added using ANTECHAMBER [36]. Electrostatic interactions were treated using the Particle-Mesh Ewald (PME) algorithm with a cut-off of 10 Å. Each system was simulated in an octahedral box filled with TIP3P water molecules [37] under periodic boundary conditions, considering a distance of 14 Å from the outermost protein atoms in all cartesian directions. Protonation states of tritable residues were assigned using PDB2PQR software version 2.1.1. All systems were neutralized by adding 4 Cl counterions. Subsequently, a two-step energy minimization procedure was performed: (i) 2000 steps (1000 steepest descent + 1000 conjugate-gradient) with all heavy atoms harmonically restrained with a force constant of 5 kcal mol−1 Å−2; (ii) 5000 steps (2500 steepest descent + 2500 conjugate-gradient) without position restraints. Next, initial atomic velocities were assigned using a Maxwell-Boltzmann distribution corresponding to an initial temperature of 20 K and the systems were gradually heated to 300 K over one nanosecond utilizing the Langevin thermostat. During this stage, all heavy atoms were harmonically restrained with a force constant of 10 kcal mol−1 Å−2. Systems were subsequently equilibrated during nine successive 500 ps equilibration simulations where position restraints approached zero progressively. After this period, the systems were simulated with no restraints at 300 K in the Gibbs ensemble with a pressure of 1 atm. Two MD processes were performed: (i) a 500 ns simulation of the model (EthA, NADP, and FADH2); (ii) Three independent MD simulations of 100 ns each of the ETH bound to protein in different conformations derived from clustering analysis (EthA, NADP, FADH2, and ETH). Simulation trajectories were analyzed with GROMACS package tools version 2019.3 [38]. Root-mean-square deviation (RMSD) values were calculated separately for each system fitting their backbone atoms, taking the initial structure of the production dynamics as a reference. Conformational clusterization for ETH was performed using the GROMOS method with a cut-off of 1.5 Å considering all atoms. Hydrogen bond formation was defined using a geometric criterion with VMD software version 1.9.3. We considered a hit when the distance between two polar heavy atoms, with at least one hydrogen atom attached, was less than 3.5 Å using a D-Ĥ-A angle cutoff of 30°.

3.3. Clustering and Free Energy Landscape

For a given set of 25,000 conformations of EthA from MD simulations, a contact matrix between residues was used as internal coordinates to analyze and detect structural cluster centers. In order to reduce computational complexity, the root mean square fluctuation (RMSF) for each residue was calculated, and ones with values above 5 Å were considered to calculate the contact matrix using 10 Å as distance cutoff. The Spectral and PCA methods of dimensionality reduction were used to find out the intrinsic space prior to performing clustering. The obtained space was used to cluster protein conformations by ward algorithm. Elbow method was applied to determine the number of groups parameter in the ward algorithm. The free energy landscape (FEL) was calculated using the Weighted Histogram Analysis Method (WHAM) for each conformational set from MD simulations. According to this method, the bins of the histogram, obtained by discrete states of a molecule, provide a relative probability that a state occurs along the trajectory and regions with a higher density of states represent an energy basin [39]. Here, we calculated the FEL using intrinsic space find out by PCA and Spectral methods for two dimensions.

3.4. Docking

All molecular docking simulations were performed using Autodock vina software version 1.1.2 [40]. Using the AutoDock Tools (ADT) v 1.5.6, all hydrogens and Gasteiger charges were added to the EthA model for grid generation and docking. The grid was created with center coordinates in X = 44.180, Y = 47.593 and Z = 51.165 and size was X = 40 Å and Y = Z = 30 Å. During the grid preparation, the side chain of residues R292, L293, C294 and L295 were considered flexible. The 3D structure of ETH was downloaded from PubChem database [code: 2761171] and prepared using ADT software version 1.5.6., with the addition of Gasteiger charges and torsions, to allow flexibility.

3.5. Thermodynamic Integration (TI)

Free energy changes upon mutation of tyrosine to cysteine (Y50C) and threonine to isoleucine (T453I) for system 14053, were evaluated by TI to check how the mutation affects NADP FADH2 and ETH binding. The newly GPU implementation, pmemdGTI [41], in AMBER 18.0 [32,33] was used in 11 equally spaced λ-windows from λ = 0 to λ = 1. The ΔΔG variation was calculated based on a thermodynamic cycle using two structures, a ligand-free 14053 and 14053 bound to NADP, FADH2 and ETH (Figure S3) in aqueous solution. Computational calculations of thermodynamic Integrations were carried out using dual topology procedure. Alchemical transformations of λ-dependent potentials involving Coulomb and Lennard-Jones terms [42,43] were calculated in a set of λ-windows equally spaced in intervals of 0.1. Initial configurations were submitted to 1000 steps of the steepest descent algorithm. Thermalization stage was performed varying temperature from 0 K to 300 K over 100 ps in the NVT ensemble, followed by the equilibration stage in the NPT ensemble for 250 ns at a temperature of 300 K and a pressure of 1 atm. The electrostatic and vdW transformations took 10 ns for each λ-window, although only the last 9 ns were computed for calculations. For the analysis, the Alchemical analysis python package [44] was used to calculate the free energy changes and corresponding errors. Final free energy change along the path was computed as a weighted sum of the ensemble averages of the derivative of the potential energy function with respect to λ using the trapezoidal rule and averaged by forward (λ = 0→1) and backward (λ = 1→0) paths.

4. Conclusions

A model for EthA, the main protein involved in resistance to ETH in M. tuberculosis, was built for the first time. MD simulations offered structural insight about the position of the control loop and showed that ETH binding to EthA involves contacts with the control loop, suggesting a role for substrate binding in control loop movement. TI calculations reveal that two mutations found in M. tuberculosis ETHR clinical isolates, Y50C and T453I, result in lower stability of the mutant enzyme-ligands complex. The results indicate an essential role for T453 in the catalytic mechanism of EthA, interacting with NADP and ETH, and the evaluation of its mutation to isoleucine in this work showed a greater destabilization of the EthA-ETH complex. The results presented in this work shed light on the residues involved in the catalytic mechanism of EthA of M. tuberculosis and on the importance of mutants Y50C and T453I. These first steps helped to guide future experimental work and complementary computational studies.

Supplementary Materials

The following are available online at https://www.mdpi.com/2073-4344/10/5/543/s1, Figure S1: Protein and ETH RMSD of the EthA systems, Figure S2: NADP and FADH2 RMSD of the EthA systems, Figure S3: Thermodynamic cycle of the forward free energy change upon a transformation of a wild residue (Y50 and T453) to a mutant residue (C50 and I453).

Author Contributions

A.C.R.G. and T.C.G. initiated the concept; A.C.R.G., D.A., E.R.C., P.V.Z.C.G. and T.C.G. designed and conceived the experiments; D.A., L.H.S.S., P.V.Z.C.G. and V.C.d.S. performed the experiments; A.C.R.G., D.A., E.R.C., L.H.S.S., P.V.Z.C.G., T.C.G. and V.C.d.S. analyzed the data; D.A., T.C.G. and V.C.d.S. drafted the manuscript; E.R.C., A.C.R.G., P.V.Z.C.G. and T.C.G. reviewed the manuscript prior to submission. All authors approved the final manuscript. All authors have read and agreed to the published version of the manuscript.

Funding

This study was financed by Fiocruz, Coordenação de Aperfeiçoamento de Pessoal de Nível Superior—Brasil (CAPES; Finance Code 001) and CNPq.

Acknowledgments

We thank CAPES and CNPq for continued support to students.

Conflicts of Interest

The authors declare no conflict of interest.

References

  1. WHO. Global Tuberculosis Report 2018; World Health Organization: Geneva, Switzerland, 2018. [Google Scholar]
  2. Gilpin, C.; Korobitsyn, A.; Migliori, G.B.; Raviglione, M.C.; Weyer, K. The World Health Organization standards for tuberculosis care and management. Eur. Respir. J. 2018, 51, 1800098. [Google Scholar] [CrossRef] [Green Version]
  3. API Consensus Expert Committee. API TB Consensus Guidelines 2006: Management of pulmonary tuberculosis, extra-pulmonary tuberculosis and tuberculosis in special situations. J. Assoc. Physicians India 2006, 54, 219–234. [Google Scholar]
  4. Ramachandran, G.; Swaminathan, S. Safety and tolerability profile of second-line anti-tuberculosis medications. Drug Saf. 2015, 38, 253–269. [Google Scholar] [CrossRef] [PubMed]
  5. Baulard, A.R.; Betts, J.C.; Engohang-Ndong, J.; Quan, S.; McAdam, R.A.; Brennan, P.J.; Locht, C.; Besra, G.S. Activation of the pro-drug ethionamide is regulated in mycobacteria. J. Biol. Chem. 2000, 275, 28326–28331. [Google Scholar] [CrossRef] [PubMed] [Green Version]
  6. DeBarber, A.E.; Mdluli, K.; Bosman, M.; Bekker, L.G.; Barry, C.E., 3rd. Ethionamide activation and sensitivity in multidrug-resistant Mycobacterium tuberculosis. Proc. Natl. Acad. Sci. USA 2000, 97, 9677–9682. [Google Scholar] [CrossRef] [PubMed] [Green Version]
  7. Vannelli, T.A.; Dykman, A.; Ortiz de Montellano, P.R. The antituberculosis drug ethionamide is activated by a flavoprotein monooxygenase. J. Biol. Chem. 2002, 277, 12824–12829. [Google Scholar] [CrossRef] [Green Version]
  8. Grant, S.S.; Wellington, S.; Kawate, T.; Desjardins, C.A.; Silvis, M.R.; Wivagg, C.; Thompson, M.; Gordon, K.; Kazyanskaya, E.; Nietupski, R.; et al. Baeyer-Villiger monooxygenases EthA and MymA are required for activation of replicating and non-replicating Mycobacterium tuberculosis inhibitors. Cell Chem. Biol. 2016, 23, 666–677. [Google Scholar] [CrossRef] [Green Version]
  9. Blondiaux, N.; Moune, M.; Desroses, M.; Frita, R.; Flipo, M.; Mathys, V.; Soetaert, K.; Kiass, M.; Delorme, V.; Djaout, K.; et al. Reversion of antibiotic resistance in Mycobacterium tuberculosis by spiroisoxazoline SMARt-420. Science 2017, 17, 1206–1211. [Google Scholar] [CrossRef]
  10. Hicks, N.D.; Carey, A.F.; Yang, J.; Zhao, Y.; Fortune, S.M. Bacterial genome-wide association identifies novel factors that contribute to ethionamide and prothionamide susceptibility in Mycobacterium tuberculosis. mBio 2019, 10, e00616. [Google Scholar] [CrossRef] [Green Version]
  11. Vilchèze, C.; Av-Gay, Y.; Attarian, R.; Liu, Z.; Hazbón, M.H.; Colangeli, R.; Chen, B.; Liu, W.; Alland, D.; Sacchettini, J.C.; et al. Mycothiol biosynthesis is essential for ethionamide susceptibility in Mycobacterium tuberculosis. Mol. Microbiol. 2008, 69, 1316–1329. [Google Scholar] [CrossRef] [Green Version]
  12. Laborde, J.; Deraeve, C.; Bernardes-Génisson, V. Update of antitubercular prodrugs from a molecular perspective: Mechanisms of action, bioactivation pathways, and associated resistance. Chem. Med. Chem. 2017, 12, 1657–1676. [Google Scholar] [CrossRef] [PubMed]
  13. Ang, M.L.; Siti, Z.Z.; Shui, G.; Dianišková, P.; Madacki, J.; Lin, W.; Koh, V.H.; Gomez, J.M.; Sudarkodi, S.; Bendt, A.; et al. An ethA-ethR-deficient Mycobacterium bovis BCG mutant displays increased adherence to mammalian cells and greater persistence in vivo, which correlate with altered mycolic acid composition. Infect. Immun. 2014, 82, 1850–1859. [Google Scholar] [CrossRef] [PubMed] [Green Version]
  14. Toriyama, S.; Imaizumi, S.; Tomiyasu, I.; Masui, M.; Yano, I. Incorporation of 18O into long-chain, secondary alcohols derived from ester mycolic acids in Mycobacterium phlei. BBA Lipid Lipid Met. 1982, 712, 427–429. [Google Scholar] [CrossRef]
  15. Kamerbeek, N.M.; Janssen, D.B.; van Berkel, W.J.H.; Fraaije, M.W. Baeyer–Villiger monooxygenases, an emerging family of flavin-dependent biocatalysts. Adv. Synth. Catal. 2003, 345, 667–678. [Google Scholar] [CrossRef] [Green Version]
  16. Torres Pazmiño, D.E.; Baas, B.-J.; Janssen, D.B.; Fraaije, M.W. Kinetic mechanism of phenylacetone monooxygenase from Thermobifida fusca. Biochemistry 2008, 47, 4082–4093. [Google Scholar] [CrossRef] [Green Version]
  17. Leisch, H.; Morley, K.; Lau, P.C.K. Baeyer−Villiger monooxygenases: More than just green chemistry. Chem. Rev. 2011, 11, 4165–4222. [Google Scholar] [CrossRef] [Green Version]
  18. da Silva, D.A.; Ferreira, N.V.; Rego, A.M.; Barbosa, P.C.; Machado, R.F.; Pimentel, A.; dos Reis, L.M.; de Pina, L.C.; Redner, P.; de Souza Caldas, P.C.; et al. Integrated analysis of ethionamide resistance loci in Mycobacterium tuberculosis clinical isolates. Tuberculosis 2018, 113, 163–174. [Google Scholar] [CrossRef]
  19. Fraaije, M.W.; Kamerbeek, N.M.; Heidekamp, A.J.; Fortin, R.; Janssen, D.B. The prodrug activator EtaA from Mycobacterium tuberculosis is a Baeyer-Villiger monooxygenase. J. Biol. Chem. 2004, 279, 3354–3360. [Google Scholar] [CrossRef] [Green Version]
  20. Leisch, H.; Shi, R.; Grosse, S.; Morley, K.; Bergeron, H.; Cygler, M.; Iwaki, H.; Hasegawa, Y.; Lau, P.C. Cloning, baeyer-villiger biooxidations, and structures of the camphor pathway 2-oxo-δ3-4, 5, 5-trimethylcyclopentenylacetyl-coenzyme a monooxygenase of Pseudomonas putida ATCC 17453. Appl. Environ. Microbiol. 2012, 78, 2200–2212. [Google Scholar] [CrossRef] [Green Version]
  21. Šali, A.; Blundell, T.L. Comparative protein modelling by satisfaction of spatial restraints. J. Mol. Biol. 1993, 234, 779–815. [Google Scholar] [CrossRef]
  22. Webb, B.; Sali, A. Comparative protein structure modeling using MODELLER. Curr. Protoc. Bioinform. 2016, 54, 5–6. [Google Scholar] [CrossRef] [PubMed] [Green Version]
  23. Salentin, S.; Schreiber, S.; Haupt, V.J.; Adasme, M.F.; Schroeder, M. PLIP: Fully automated protein–ligand interaction profiler. Nucleic Acids Res. 2015, 43, W443–W447. [Google Scholar] [CrossRef] [PubMed]
  24. Mirza, I.A.; Yachnin, B.J.; Wang, S.; Grosse, S.; Bergeron, H.; Imura, A.; Iwaki, H.; Hasegawa, Y.; Lau, P.C.; Berghuis, A.M. Crystal structures of cyclohexanone monooxygenase reveal complex domain movements and a sliding cofactor. J. Am. Chem. Soc. 2009, 131, 8848–8854. [Google Scholar] [CrossRef] [PubMed] [Green Version]
  25. Fürst, M.J.; Fiorentini, F.; Fraaije, M.W. Beyond active site residues: Overall structural dynamics control catalysis in flavin-containing and heme-containing monooxygenases. Curr. Opin. Struct. Biol. 2019, 59, 29–37. [Google Scholar] [CrossRef] [PubMed]
  26. Minerdi, D.; Zgrablic, I.; Sadeghi, S.J.; Gilardi, G. Identification of a novel Baeyer-Villiger monooxygenase from Acinetobacter radioresistens: Close relationship to the Mycobacterium tuberculosis prodrug activator EtaA. Microb. Biotech. 2012, 5, 700–716. [Google Scholar] [CrossRef]
  27. Heinig, M.; Frishman, D. STRIDE: A Web server for secondary structure assignment from known atomic coordinates of proteins. Nucl. Acids Res. 2004, 32, W500–W502. [Google Scholar] [CrossRef] [Green Version]
  28. Malito, E.; Alfieri, A.; Fraaije, M.W.; Mattevi, A. Crystal structure of a Baeyer–Villiger monooxygenase. Proc. Natl. Acad. Sci. USA 2004, 101, 13157–13162. [Google Scholar] [CrossRef] [Green Version]
  29. Leung, K.L.; Yip, C.W.; Yeung, Y.L.; Wong, K.L.; Chan, W.Y.; Chan, M.Y.; Kam, K.M. Usefulness of resistant gene markers for predicting treatment outcome on second-line antituberculosis drugs. J. Appl. Microbiol. 2010, 109, 2087–2094. [Google Scholar] [CrossRef]
  30. Sievers, F.; Wilm, A.; Dineen, D.; Gibson, T.J.; Karplus, K.; Li, W.; Lopez, R.; McWilliam, H.; Remmert, M.; Söding, J.; et al. Fast, scalable generation of high-quality protein multiple sequence alignments using Clustal Omega. Mol. Syst. Biol. 2011, 7, 539. [Google Scholar] [CrossRef]
  31. Case, D.A.; Cheatham, T.E., III; Darden, T.; Gohlke, H.; Luo, R.; Merz, K.M., Jr.; Onufriev, A.; Simmerling, C.; Wang, B.; Woods, R.J. The Amber biomolecular simulation programs. J. Comput. Chem. 2005, 26, 1668–1688. [Google Scholar] [CrossRef] [Green Version]
  32. Case, D.A.; Ben-Shalom, I.Y.; Brozell, S.R.; Cerutti, D.S.; Cheatham, T.E., III; Cruzeiro, V.W.D.; Darden, T.A.; Duke, R.E.; Ghoreishi, D.; Gilson, M.K.; et al. AMBER; University of California: San Francisco, CA, USA, 2018. [Google Scholar]
  33. Maier, J.A.; Martinez, C.; Kasavajhala, K.; Wickstrom, L.; Hauser, K.E.; Simmerling, C. ff14SB: Improving the accuracy of protein side chain and backbone parameters from ff99SB. J. Chem. Theory Comput. 2015, 11, 3696–3713. [Google Scholar] [CrossRef] [PubMed] [Green Version]
  34. Wang, J.; Wolf, R.M.; Caldwell, J.W.; Kollman, P.A.; Case, D.A. Development and testing of a general amber force field. J. Comput. Chem. 2004, 25, 1157–1174. [Google Scholar] [CrossRef] [PubMed]
  35. Jakalian, A.; Jack, D.B.; Bayly, C.I. Fast, efficient generation of high-quality atomic charges. AM1-BCC model: II. Parameterization and validation. J. Comput. Chem. 2002, 23, 1623–1641. [Google Scholar] [CrossRef]
  36. Wang, J.; Wang, W.; Kollman, P.A.; Case, D.A. Automatic atom type and bond type perception in molecular mechanical calculations. J. Mol. Graph. Model. 2006, 25, 247–260. [Google Scholar] [CrossRef] [PubMed]
  37. Jorgensen, W.L.; Chandrasekhar, J.; Madura, J.D.; Impey, R.W.; Klein, M.L. Comparison of simple potential functions for simulating liquid water. J. Chem. Phys. 1983, 79, 926–935. [Google Scholar] [CrossRef]
  38. Abraham, M.J.; Murtola, T.; Schulz, R.; Páll, S.; Smith, J.C.; Hess, B.; Lindah, E. Gromacs: High performance molecular simulations through multi-level parallelism from laptops to supercomputers. SoftwareX 2015, 1–2, 19–25. [Google Scholar] [CrossRef] [Green Version]
  39. Kumar, S.; Rosenberg, J.M.; Bouzida, D.; Swendsen, R.H.; Kollman, P.A. The weighted histogram analysis method for free-energy calculations on biomolecules. I. The method. J. Comput. Chem. 1992, 13, 1011–1021. [Google Scholar] [CrossRef]
  40. Trott, O.; Olson, A.J. AutoDock Vina: Improving the speed and accuracy of docking with a new scoring function, efficient optimization and multithreading. J. Comp. Chem. 2010, 31, 455–461. [Google Scholar] [CrossRef] [Green Version]
  41. Lee, T.-S.; Hu, Y.; Sherborne, B.; Guo, Z.; York, D.M. Toward fast and accurate binding affinity prediction with pmemdGTI: An efficient implementation of GPU-accelerated thermodynamic integration. J. Chem. Theory Comput. 2017, 13, 3077–3084. [Google Scholar] [CrossRef]
  42. Kaus, J.W.; Pierce, L.T.; Walker, R.C.; McCammon, J.A. Improving the efficiency of free energy calculations in the amber molecular dynamics package. J. Chem. Theory Comput. 2013, 9, 4131–4139. [Google Scholar] [CrossRef]
  43. Mermelstein, D.J.; Lin, C.; Nelson, G.; Kretsch, R.; McCammon, J.A.; Walker, R.C. Fast and flexible gpu accelerated binding free energy calculations within the amber molecular dynamics package. J. Comput. Chem. 2018, 39, 1354–1358. [Google Scholar] [CrossRef] [PubMed]
  44. Klimovich, P.V.; Shirts, M.R.; Mobley, D.L. Guidelines for the analysis of free energy calculations. J. Comput. Aided Mol. Des. 2015, 29, 397–411. [Google Scholar] [CrossRef] [PubMed] [Green Version]
Figure 1. Comparison of EthA and OTEMO sequence and features. (A) Sequence alignment between EthA and 3UOZ visualized by Pymol Schrodinger llc v2.1.0. Rectangles and arrows represent helices and strands, respectively. Residues mapped by PLIP [23] as contributing to the FADH2 and NADP binding sites are shown in cyan and green, respectively; catalytic arginines are shown in purple; residues in pink contribute to ETH binding in the Acinetobacter radioresistens EthA homolog [26]. Yellow, BVMO motif (EthA, F157-P168; 3UOZ, F160-P171); red, interdomain linker (EthA, G343-L348; 3UOZ, G388-T393); orange, control loop (EthA, G450-R470; 3UOZ, A496-R516). Secondary structure information was obtained with STRIDE [27]. (B) Domains and other features of OTEMO and EthA. Yellow, BVMO motif; red, interdomain linker; orange, control loop; black: OTEMO flexible regions or that and/or undergo conformational transitions in crystal structures. Asterisks: amino acids that are part of the FAD (blue) and NADPH (green) binding sites in OTEMO structures (3UOZ, 3UOY, 3UOV, 3UOX, 3UP4, 3UP5) as mapped by PLIP and according to [20]. OTEMO domains are as in [20]. An alignment between PAMO, CHMO, STMO, OTEMO, and EthA [18] was used to infer EthA domains and EthA and OTEMO mobile functional regions.
Catalysts 10 00543 g001
Figure 2. 3D structure and active site of EthA and 3UOZ. (A) Structural alignment between the EthA model (blue) and 3UOZ (red) FADH2 (blue) and NADP (cyan) are represented by spheres. The FADH2 and NADP binding region is shown for (B) EthA and (C) OTEMO.
Catalysts 10 00543 g002
Figure 3. Root Mean Square Fluctuation (RMSF) to each residue of EthA. The positions of helices (black) and strands (grey) are indicated on the top and bottom axes of the fluctuation plot.
Catalysts 10 00543 g003
Figure 4. Control loop position and ETH docking in the selected conformations from the Spectral clustering results. BVMO motif (yellow), interdomain linker (red), control loop (orange), ETH binding region (green) are represented by spheres. Blue, Y50 and T453I. NADP (cyan) and FADH2 (blue) are shown in stick representation. The distance between the interdomain linker (L348:CA) and control loop (N460:CA) in conformations (a) 01346 (12.7 Å), (b) 13841 (8.5 Å), and (c) 14053 (9.4 Å) are represented by black dashes. Best poses of ETH obtained from docking results in the selected conformations from the Spectral clustering results. (d) 01346, (e) 13841 and (f) 14053.
Catalysts 10 00543 g004
Figure 5. ETH clustering analysis from the MD simulations for systems (a) 01346, (b) 13841 and (c) 14053. The fractional contribution of the first three clusters is shown in each graph. 2D representation of Protein-ETH interaction of the most representative structures resulting from clustering analysis is displayed next to each plot (Poseview server). Black dashed lines and full green lines show hydrogen bonds and hydrophobic interactions, respectively.
Catalysts 10 00543 g005
Figure 6. Representation of EthA-ETH complex stabilized during molecular dynamics. ETH (green), NADP (cyan), FADH2 (blue), and residues (gray) involved in complex stabilization and catalytic mechanism are shown in stick representation. The distance (Å) between ETH, NADP and EthA residues are represented by yellow dashes.
Catalysts 10 00543 g006
Figure 7. The spatial location of residues chosen for TI alchemical transformations in the most representative structure of EthA-14053 system. ETH is located at 14 Å and 3.2 Å from T50 and T453, respectively.
Catalysts 10 00543 g007
Table 1. ETH docking results show more favorable interaction with EthA conformations 13841 and 14053.
EthA ConformationETH InteractionInteraction Energy (Kcal/mol)
01346NADP−4.9
13841R456−5.6
14053D290, Q291, L293, R456, NADP−5.5
Table 2. Root mean square deviations (Å) of EthA systems.
Molecules01346 (Å)13841 (Å)14053 (Å)
EthA2.3 ± 0.32.1 ± 0.42.0 ± 0.4
ETH7.0 ± 1.24.9 ± 3.02.9 ± 1.1
NADP1.6 ± 0.31.2 ± 0.31.2 ± 0.2
FADH21.7 ± 0.81.4 ± 0.32.9 ± 0.7
Table 3. ETH interacts stably with conformation 14053.
Residue PairsOccupancy (%)
DonorAcceptor013461384114053
R456-SideETH-27.5564.46
ETHQ291-Main0.1113.5162.47
ETHT453-Side-11.7926.12
ETHC294-Main12.70--
ETHA237-Main19.24--
W240-MainETH10.59--
Table 4. Wild type EthA-FADH2-NADP-ETH complex is more stable than mutant complexes. TI outcomes for forward and backward paths in the two-step approach to determining the free energy change (ΔΔG = ΔGHOLO – ΔGAPO) for Y50C and T453I.
Y50 ↔ C50T453 ↔ I453
APOHOLOAPOHOLO
ForwardΔGrecharge−17.92 ± 0.09−17.45 ± 0.09−27.29 ± 0.08−29.32 ± 0.08
ΔGvdw123.82 ± 0.27127.45 ± 0.27144.34 ± 0.22155.08 ± 0.25
Backward*ΔGrecharge−19.40 ± 0.08−19.43 ± 0.08−27.52 ± 0.07−30.08 ± 0.07
ΔGvdw124.93 ± 0.28127.55 ± 0.23144.20 ± 0.24154.29 ± 0.27
Final105.72 ± 0.41109.06± 0.38116.87± 0.34124.98 ± 0.38
ΔΔG (kcal/mol)3.34 ± 0.558.11 ± 0.51
* Backward values are consistent with the forward process.

