Enhanced Hydrogen Production from Ethanol Photoreforming by Site-Specific Deposition of Au on Cu2O/TiO2 p-n Junction

 ,
, 
Abstract
1. Introduction
2. Results and Discussion
3. Materials and Methods
3.1. Materials
3.2. Synthesis of Defect-Rich TiO2 Nanorods
3.3. Synthesis of Cu2O Nanocubes
3.4. Synthesis of Cu2O/TiO2
3.5. Synthesis of Au@TiO2 and Au@TiO2/Cu2O
3.6. Synthesis of Au@Cu2O/TiO2
3.7. Synthesis of Au@TiO2/Cu2O@Au
3.8. Characterization
3.9. Photoreforming of Ethanol
3.10. Recycled Use
4. Conclusions
Supplementary Materials
Author Contributions
Funding
Conflicts of Interest
References
- Lu, X.H.; Xie, S.L.; Yang, H.; Tong, Y.X.; Ji, H.B. Photoelectrochemical hydrogen production from biomass derivatives and water. Chem. Soc. Rev. 2014, 43, 7581–7593. [Google Scholar] [CrossRef] [PubMed]
- Zhao, X.X.; Feng, J.R.; Liu, J.W.; Lu, J.; Shi, W.; Yang, G.M.; Wang, G.C.; Feng, P.Y.; Cheng, P. Metal-Organic Framework-Derived ZnO/ZnS Heteronano structures for Efficient Visible Light Driven Photocatalytic Hydrogen Production. Adv. Sci. 2018, 5, 1700590. [Google Scholar] [CrossRef] [PubMed]
- Zhao, X.X.; Feng, J.R.; Liu, J.; Shi, W.; Yang, G.M.; Wang, G.C.; Cheng, P. An Efficient, Visible Light Driven, Hydrogen Evolution Catalyst NiS/ZnxCd1−xS Nanocrystal Derived from a Metal–Organic Framework. Angew. Chem. Int. Ed. 2018, 57, 9790. [Google Scholar] [CrossRef] [PubMed]
- Shimura, K.; Yoshida, H. Heterogeneous photocatalytic hydrogen production from water and biomass derivatives. Energy Environ. Sci. 2011, 4, 2467–2484. [Google Scholar] [CrossRef]
- Hou, T.F.; Zhang, S.Y.; Chen, Y.D.; Wang, D.Z.; Cai, W.J. Hydrogen production from ethanol reforming: Catalysts and reaction mechanism. Renew. Sustain. Energy Rev. 2015, 44, 132–148. [Google Scholar] [CrossRef]
- Yamazaki, T.; Kikuchi, N.; Katohb, M.; Hirosea, T.; Saitoc, H.; Yoshikawa, T.; Wada, M. Behavior of steam reforming reaction for bio-ethanol over Pt/ZrO2 catalysts. Appl. Catal. B Environ. 2010, 99, 81–88. [Google Scholar] [CrossRef]
- Gasparotto, A.; Barreca, D.; Bekermann, D.; Devi, A.; Fischer, R.A.; Fornasiero, P.; Gombac, V.; Lebedev, O.I.; Maccato, C.; Montini, T.; et al. F-Doped Co3O4 Photocatalysts for Sustainable H2 Generation from Water/Ethanol. J. Am. Chem. Soc. 2011, 133, 19362–19365. [Google Scholar] [CrossRef]
- Bac, S.; Keskin, S.; Avci, A.K. Recent advances in materials for high purity H2 production by ethanol and glycerol steam reforming. Int. J. Hydrogen Energy 2019. [Google Scholar] [CrossRef]
- Llorca, J.; Homs, N.; Sales, J.; Fierro, J.L.G.; Piscina, P.R.D.L. Effect of sodium addition on the performance of Co-ZnO-based catalysts for hydrogen production from bioethanol. J. Catal. 2004, 222, 470–480. [Google Scholar] [CrossRef]
- Ciambelli, P.; Palma, V.; Ruggiero, A. Low temperature catalytic steam reforming of ethanol. The effect of the support on the activity and stability of Pt catalysts. Appl. Catal. B Environ. 2010, 96, 18–27. [Google Scholar] [CrossRef]
- Puga, A.V.; Forneli, A.; García, H.; Corma, A. Production of H2 by Ethanol Photoreforming on Au/TiO2. Adv. Funct. Mater. 2014, 24, 241–248. [Google Scholar] [CrossRef]
- Mizukoshi, Y.; Sato, K.; Konno, T.J.; Masahashi, N. Dependence of photocatalytic activities upon the structures of Au/Pd bimetallic nanoparticles immobilized on TiO2 surface. Appl. Catal. B Environ. 2010, 94, 248–253. [Google Scholar] [CrossRef]
- Strataki, N.; Bekiari, V.; Kondarides, D.I.; Lianos, P. Hydrogen production by photocatalytic alcohol reforming employing highly efficient nanocrystalline titania films. Appl. Catal. B Environ. 2007, 77, 184–189. [Google Scholar] [CrossRef]
- Lou, Z.; Fujitsuka, M.; Majima, T. Pt–Au triangular nanoprisms with strong dipole plasmon resonance for hydrogen generation studied by single-particle spectroscopy. ACS Nano 2016, 10, 6299–6305. [Google Scholar] [CrossRef] [PubMed]
- Wu, B.H.; Liu, D.Y.; Mubeen, S.; Chuong, T.T.; Moskovits, M.; Stucky, G.D. Anisotropic growth of TiO2 onto gold nanorods for plasmon-enhanced hydrogen productionfrom water reduction. J. Am. Chem. Soc. 2016, 138, 1114–1117. [Google Scholar] [CrossRef]
- Chang, A.; Peng, W.S.; Tsaia, I.-T.; Chiang, L.F.; Yang, C.M. Efficient hydrogen production by selective alcohol photoreforming on plasmonic photocatalyst comprising sandwiched Au nanodisks and TiO2. Appl. Catal. B Environ. 2019, 255, 117773. [Google Scholar] [CrossRef]
- Nadeem, M.A.; Murdoch, M.; Waterhouse, G.I.N.; Metson, J.B.; Keane, M.A.; Llorca, J.; Idriss, H. Photoreaction of ethanol on Au/TiO2 anatase: Comparing the micro to nanoparticle size activities of the support for hydrogen production. J. Photochem. Photobiol. A Chem. 2010, 216, 250–255. [Google Scholar] [CrossRef]
- Shiraishi, Y.; Imai, J.; Yasumoto, N.; Sakamoto, H.; Tanaka, S.; Ichikawa, S.; Hirai, T. Doping of Nb5+ Species at the Au-TiO2 Interface for Plasmonic Photocatalysis Enhancement. Langmuir 2019, 35, 5455–5462. [Google Scholar] [CrossRef]
- Majhi, S.M.; Rai, P.; Raj, S.; Chon, B.S.; Park, K.K.; Yu, Y.T. Effect of Au Nanorods on Potential Barrier Modulation in Morphologically Controlled Au@Cu2O Core−Shell Nanoreactors for Gas Sensor Applications. ACS Appl. Mater. Interfaces 2014, 6, 7491–7497. [Google Scholar] [CrossRef]
- Li, G.J.; Huang, J.Q.; Chen, J.; Deng, Z.J.; Huang, Q.F.; Liu, Z.Q.; Guo, W.; Cao, R. Highly Active Photocatalyst of Cu2O/TiO2 Octahedron for Hydrogen Generation. ACS Omega 2019, 4, 3392–3397. [Google Scholar] [CrossRef]
- Lu, C.L.; Prasad, K.S.; Wu, H.L.; Ho, J.A.; Huang, M.H. Au Nanocube-Directed Fabrication of Au-Pd Core-Shell Nanocrystals with Tetrahexahedral, Concave Octahedral, and Octahedral Structures and Their Electrocatalytic Activity. J. Am. Chem. Soc. 2010, 132, 14546–14553. [Google Scholar] [CrossRef] [PubMed]
- Zhang, Y.; Xing, Z.; Liu, X.F.; Li, Z.Z.; Wu, X.Y.; Jiang, J.J.; Li, M.; Zhu, Q.; Zhou, W. Ti3+ Self-Doped Blue TiO2(B) Single Crystalline Nanorods for Efficient Solar-Driven Photocatalytic Performance. ACS Appl. Mater. Interfaces 2016, 8, 26851–26859. [Google Scholar] [CrossRef] [PubMed]
- Li, G.; Li, J.; Li, G.; Jiang, G. N and Ti3+ co-doped 3D anatase TiO2 superstructures composed of ultrathin nanosheets with enhanced visible light photocatalytic activity. J. Mater. Chem. A 2015, 3, 22073–22080. [Google Scholar] [CrossRef]
- Wu, S.M.; Liu, X.L.; Lian, X.L.; Tian, G.; Janiak, C.; Zhang, Y.X.; Lu, Y.; Yu, H.Z.; Hu, J.; Wei, H.; et al. Homojunction of Oxygen and Titanium Vacancies and its Interfacial n−p Effect. Adv. Mater. 2018, 30, 1802173–1802180. [Google Scholar] [CrossRef] [PubMed]
- Zhang, X.; Luo, L.; Yun, R.P.; Pu, M.; Zhang, B.; Xiang, X. Increasing the Activity and Selectivity of TiO2 Supported Au Catalysts for Renewable Hydrogen Generation from Ethanol Photoreforming by Engineering Ti3+ Defects. ACS Sustain. Chem. Eng. 2019, 7, 13856–13864. [Google Scholar] [CrossRef]
- Wan, J.W.; Chen, W.X.; Jia, C.Y.; Zheng, L.R.; Dong, J.C.; Zheng, X.S.; Wang, Y.; Yan, W.S.; Chen, C.; Peng, Q.; et al. Defect Effects on TiO2 Nanosheets: Stabilizing Single Atomic Site Au and Promoting Catalytic Properties. Adv. Mater. 2018, 30, 1705369–1705377. [Google Scholar] [CrossRef]
- Wang, Y.; Widmann, D.; Behm, R.J. Influence of TiO2 Bulk Defects on CO Adsorption and CO Oxidation on Au/TiO2: Electronic Metal-Support Interactions (EMSIs) in Supported Au Catalysts. ACS Catal. 2017, 7, 2339–2345. [Google Scholar] [CrossRef]
- Liu, N.; Xu, M.; Yang, Y.; Zhang, S.; Zhang, J.; Wang, W.; Zheng, L.; Hong, S.; Wei, M. Auδ−–Ov–Ti3+ Interfacial Site: Catalytic Active Center towards Low-Temperature Water Gas Shift Reaction. ACS Catal. 2019, 9, 2707–2717. [Google Scholar] [CrossRef]
- Li, H.X.; Bian, Z.F.; Zhu, J.; Huo, Y.N.; Huo, H.; Lu, Y.F. Mesoporous Au/TiO2 Nanocomposites with Enhanced Photocatalytic Activity. J. Am. Chem. Soc. 2007, 129, 4538–4539. [Google Scholar] [CrossRef]
- Zhu, S.Y.; Liang, S.Y.; Tong, Y.C.; An, X.H.; Long, J.L.; Fu, X.Z.; Wang, X.X. Photocatalytic reduction of CO2 with H2O to CH4 on Cu(I) supported TiO2 nanosheets with defective {001} facets. Phys. Chem. Chem. Phys. 2015, 17, 9761–9770. [Google Scholar] [CrossRef]
- Babu, S.G.; Vinoth, R.; Kumar, D.P.; Shankar, M.V.; Chou, H.L.; Vinodgopal, K.; Neppolian, B. Influence of electron storing, transferring and shuttling assets of reduced graphene oxide at the interfacial copper doped TiO2 p-n heterojunction for increased hydrogen production. Nanoscale 2015, 7, 7849–7857. [Google Scholar] [CrossRef] [PubMed]
- Gopiraman, M.; Babu, S.G.; Khatri, Z.; Kai, W.; Kim, Y.A.; Endo, M.; Karvembu, R.; Kim, I.S. An efficient, reusable copperoxide/carbon-nanotube catalyst for N-arylation of imidazole. Carbon 2013, 62, 135–148. [Google Scholar] [CrossRef]
- Movahed, S.K.; Dabiri, M.; Bazgir, A. A one-step method for preparation of Cu@Cu2O nanoparticles on reduced graphene oxide and their catalytic activities in N-arylation of N-heterocycles. Appl. Catal. A 2014, 481, 79–88. [Google Scholar] [CrossRef]
- Balasubramanian, P.; Balamurugan, T.S.T.; Chen, S.M.; Chen, T.W.; Sathesh, T. Rational design of Cu@Cu2O nanospheres anchored B, N co-doped mesoporous carbon: A sustainable electrocatalyst to assay eminent neurotransmitters Acetylcholine and Dopamine. ACS Sustain. Chem. Eng. 2019, 7, 5669–5680. [Google Scholar] [CrossRef]
- Mcshane, C.M.; Choi, K.S. Junction studies on electrochemically fabricated p–n Cu2O homojunction solar cells for efficiency enhancement. Phys. Chem. Chem. Phys. 2012, 14, 6112–6118. [Google Scholar] [CrossRef]
- Xi, Z.H.; Li, C.J.; Zhang, L.; Xing, M.Y.; Zhang, J.L. Synergistic effect of Cu2O/TiO2 heterostructure nanoparticle and its high H2 evolution activity. Int. J. Hydrogen Energy 2014, 39, 6345–6353. [Google Scholar] [CrossRef]
- Yu, M.; Kim, B.; Kim, Y.K. Highly Enhanced Photoactivity of Anatase TiO2 Nanocrystals by Controlled Hydrogenation-Induced Surface Defects. ACS Catal. 2013, 3, 2479–2486. [Google Scholar] [CrossRef]
- Wang, W.; Lu, C.H.; Ni, Y.R.; Su, M.X.; Xu, Z.Z. A new sight on hydrogenation of F and N-F doped {001} facets dominated anatase TiO2 for efficient visible light photocatalyst. Appl. Catal. B Environ. 2012, 127, 28–35. [Google Scholar] [CrossRef]
- Zuo, F.; Wang, L.; Wu, T.; Zhang, Z.; Borchardt, D.; Feng, P. Self-Doped Ti3+ Enhanced Photocatalyst for Hydrogen Productionunder Visible Light. J. Am. Chem. Soc. 2010, 132, 11856–11857. [Google Scholar] [CrossRef]
- Chen, J.J.; Wu, J.C.S.; Wu, P.C.; Tsai, D.P. Plasmonic Photocatalyst for H2 Evolution in Photocatalytic Water Splitting. J. Phys. Chem. C 2011, 115, 210–216. [Google Scholar] [CrossRef]
- Qian, K.; Sweeny, B.C.; Johnston-Peck, A.C.; Niu, W.X.; Graham, J.O.; DuChene, J.S.; Qiu, J.J.; Wang, Y.C.; Engelhard, M.H.; Su, D.; et al. Surface Plasmon-Driven Water Reduction: Gold Nanoparticle Size Matters. J. Am. Chem. Soc. 2014, 136, 9842–9845. [Google Scholar] [CrossRef] [PubMed]
- Zhu, Y.C.; Liu, Y.L.; Xu, Y.T.; Ruan, Y.F.; Fan, G.C.; Zhao, W.W.; Xu, J.J.; Chen, H.Y. Three-Dimensional TiO2@Cu2O@Nickel Foam Electrode: Design, Characterization, and Validation of O2-Independent Photocathodic Enzymatic Bioanalysis. ACS Appl. Mater. Interfaces 2019, 11, 25702–25707. [Google Scholar] [CrossRef] [PubMed]
- Hua, W.J.; Li, D.P.; Yang, Y.; Li, T.; Chen, H.P.; Liu, P. Copper ferrite supported gold nanoparticles as efficient and recyclable catalyst for liquid-phase ethanol oxidation. J. Catal. 2018, 357, 108–117. [Google Scholar] [CrossRef]
- Wolkenstein, T. Theory of the photoadsorption effect in semiconductors. Prog. Surf. Sci. 1975, 6, 213–240. [Google Scholar] [CrossRef]
- Gharahshiran, V.S.; Yousefpour, M. Synthesis and characterization of Zr-promoted Ni-Co bimetallic catalyst supported OMC and investigation of its catalytic performance in steam reforming of ethanol. Int. J. Hydrogen Energy 2018, 43, 7020–7037. [Google Scholar] [CrossRef]
- Mironova, Y.; Lytkina, A.A.; Ermilova, M.M.; Efimov, M.N.; Zemtsov, L.M.; Orekhova, N.V.; Karpacheva, G.P.; Bondarenko, G.N.; Muraviev, D.N.; Yaroslavtsev, A.B. Ethanol and methanol steam reforming on transition metal catalysts supported on detonation synthesis nanodiamonds for hydrogen production. Int. J. Hydrogen Energy 2015, 40, 3557–3565. [Google Scholar] [CrossRef]
- Mulewa, W.; Tahir, M.; Amin, N.A.S. MMT-supported Ni/TiO2 nanocomposite for low temperature ethanol steam reforming toward hydrogen production. Chem. Eng. J. 2017, 326, 956–969. [Google Scholar] [CrossRef]
- Liu, H.; Zhu, X.D.; Han, R.; Dai, Y.X.; Sun, Y.L.; Lin, Y.N.; Gao, D.D.; Wang, X.Y.; Lu, C.N. Study on the internal electric field in the Cu2O/g-C3N4 p-n heterojunction structure for enhancing visible light photocatalytic activity. New J. Chem. 2020. [Google Scholar] [CrossRef]
- Zhang, Z.; Long, J.; Yang, L.; Chen, W.; Dai, W.; Fu, X.; Wang, X. Organic semiconductor for artificial photosynthesis: Water splitting into hydrogen by a bioinspired C3N3S3 polymer under visible light irradiation. Chem. Sci. 2011, 2, 1826–1830. [Google Scholar] [CrossRef]
- Maeda, K.; Sekizawa, K.; Ishitani, O. A polymeric-semiconductor–metal-complex hybrid photocatalyst for visible-light CO2 reduction. Chem. Commun. 2013, 49, 10127–10129. [Google Scholar] [CrossRef]
- He, W.H.; Wang, R.R.; Zhang, L.; Zhu, J.; Xiang, X.; Li, F. Enhanced photoelectrochemical water oxidation on a BiVO4 photoanode modified with multifunctional layered double hydroxide nanowalls. J. Mater. Chem. A 2015, 3, 17977–17983. [Google Scholar] [CrossRef]
- Ramírez-Ortega, A.M.; Melendez, P.; Acevedo-Pena, I.; Gonzalez, R. Arroyo, Semiconducting properties of ZnO/TiO2 composites by electrochemical measurements and their relationship with photocatalytic activity. Electrochim. Acta 2014, 140, 541–549. [Google Scholar] [CrossRef]
- Hu, Y.; Zhou, W.; Zhang, K.F.; Zhang, X.C.; Wang, L.; Jiang, B.J.; Tian, G.H.; Zhao, D.Y.; Fu, H.G. Facile strategy for controllable synthesis of stable mesoporous black TiO2 hollow spheres with efficient solar-driven photocatalytic hydrogen evolution. J. Mater. Chem. A 2016, 4, 7495–7502. [Google Scholar] [CrossRef]
- Matsumoto, Y. Energy Positions of Oxide Semiconductors and Photocatalysis with Iron Complex Oxides. J. Solid State Chem. 1996, 126, 227–234. [Google Scholar] [CrossRef]
- Matsumoto, Y.; Sugiyama, K.; Sato, E. Improvement of CaFe2O4 Photocathode by doping with Na and Mg. J. Solid State Chem. 1988, 74, 117–125. [Google Scholar] [CrossRef]
- Zhang, J.; Liu, J.; Peng, Q.; Wang, X.; Li, Y. Nearly Monodisperse Cu2O and CuO Nanospheres: Preparation and Applications for Sensitive Gas Sensors. Chem. Mater. 2006, 18, 867–871. [Google Scholar] [CrossRef]
- Musa, A.O.; Akomolafe, T.; Carter, M.J. Production of cuprous oxide, a solar cell material, by thermal oxidation and a study of its physical and electrical properties. Sol. Energy Mater. Sol. C 1998, 51, 305–316. [Google Scholar] [CrossRef]
- Zhang, D.-F.; Zhang, H.; Guo, L.; Zheng, K.; Han, X.-D.; Zhang, Z. Delicate control of crystallographic facet-oriented Cu2O nanocrystals and the correlated adsorption ability. J. Mater. Chem. 2009, 19, 5220–5225. [Google Scholar] [CrossRef]


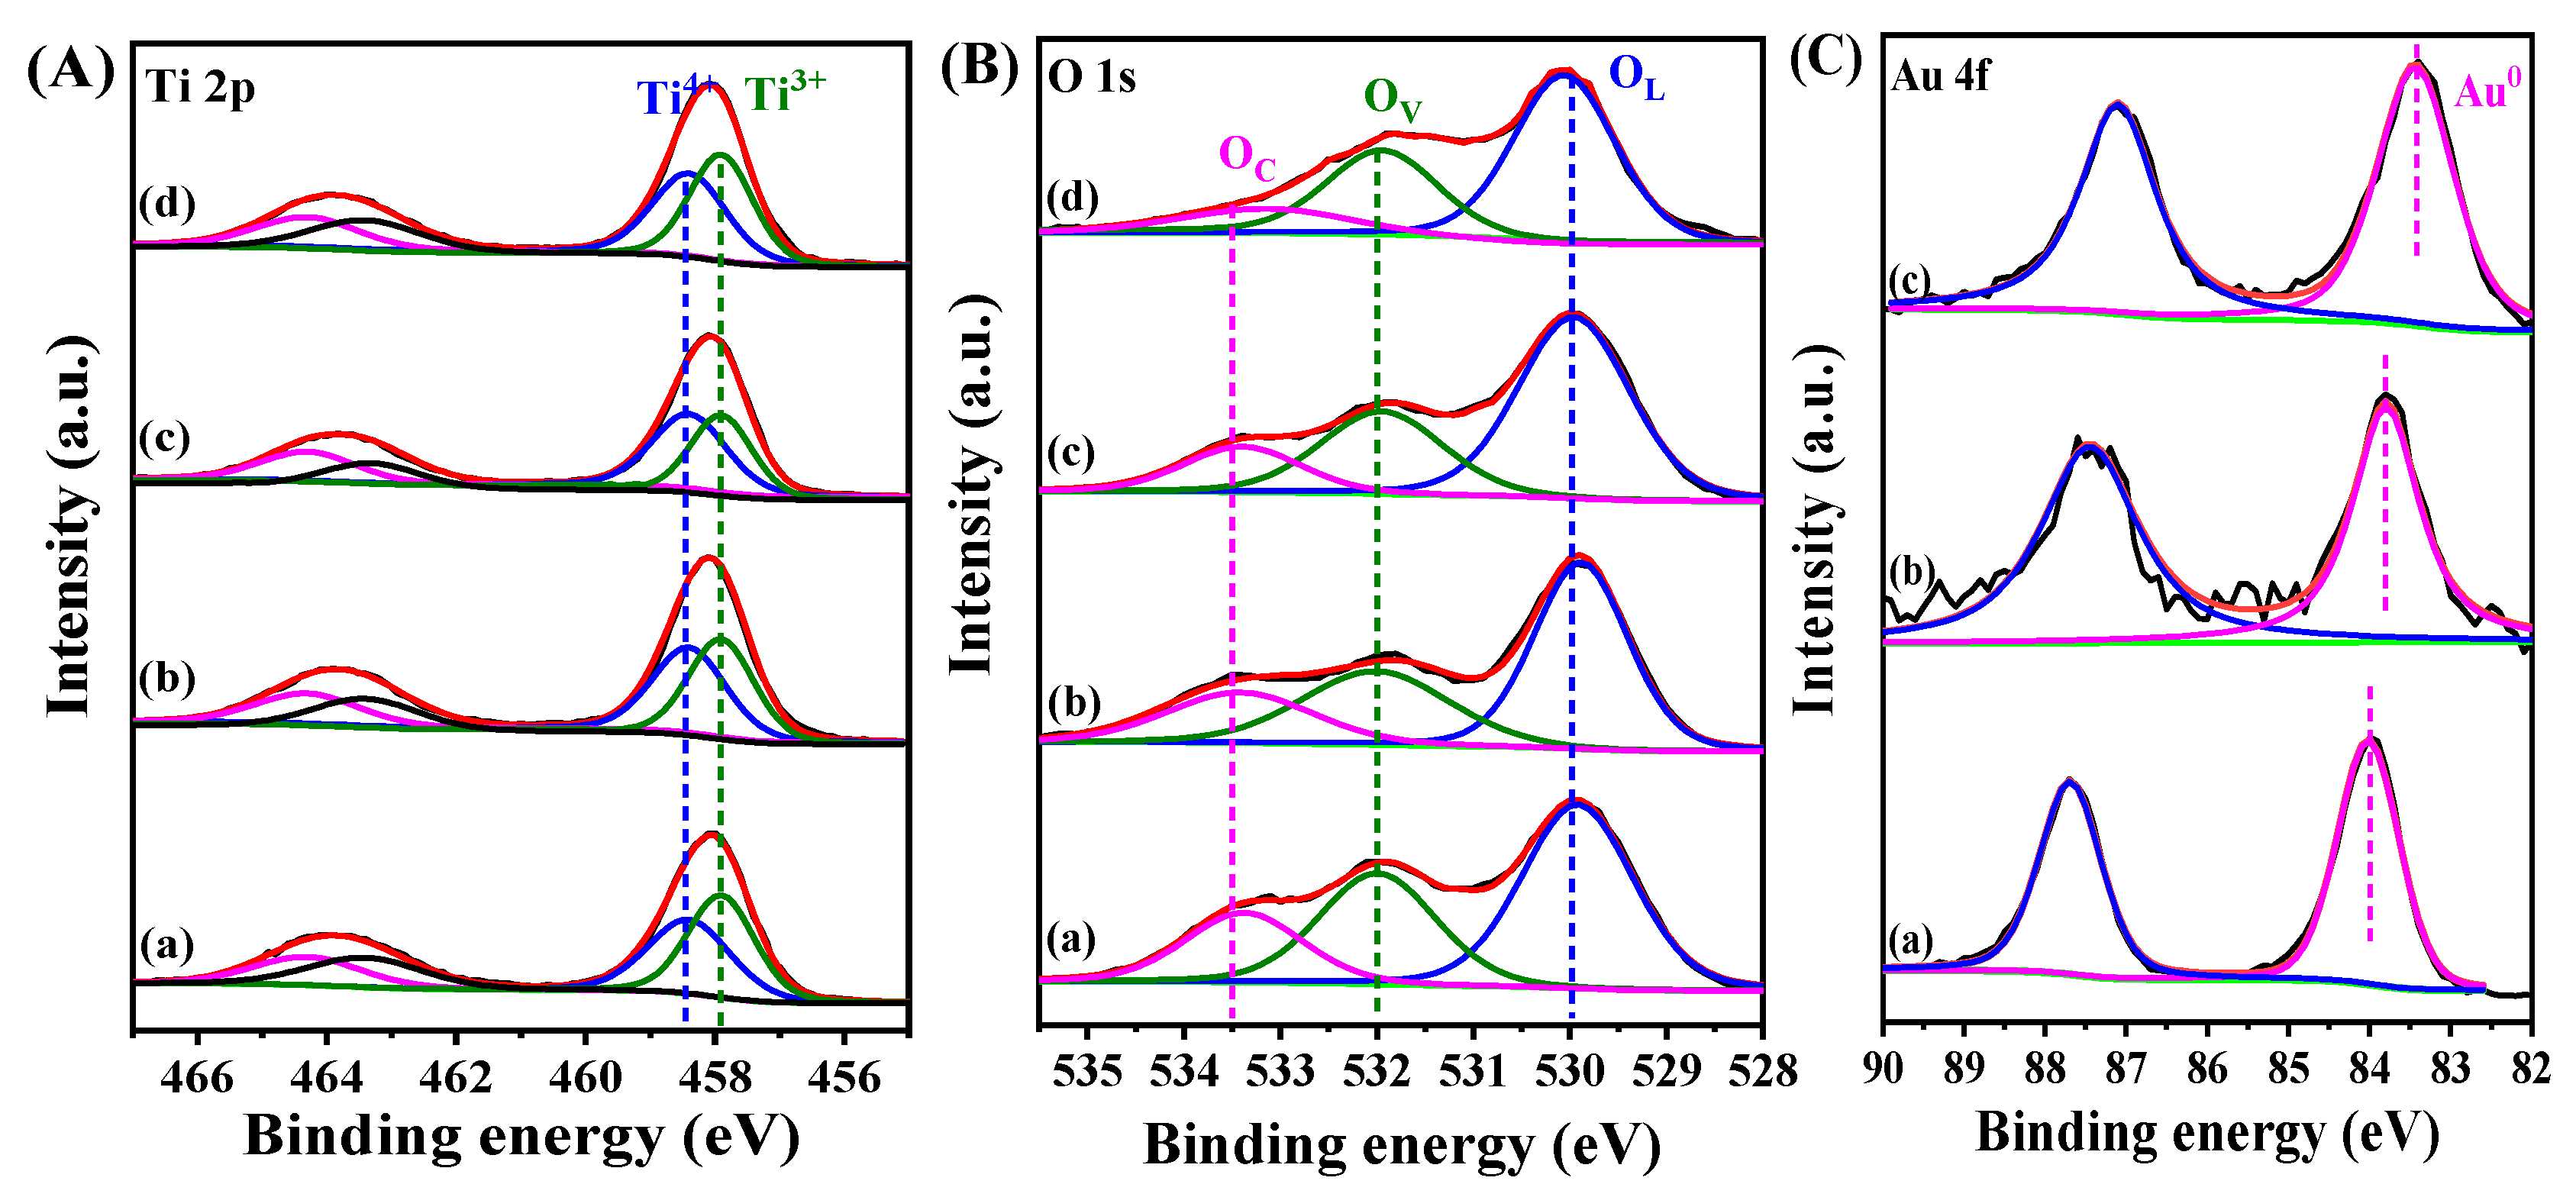
| Sample | B.E. in 2p3/2(eV) | B.E. in 2p1/2(eV) | Ti3+/Ti4+ Ratio 1 | ||
|---|---|---|---|---|---|
| Ti3+ | Ti4+ | Ti3+ | Ti4+ | ||
| TiO2/Cu2O | 457.9 | 458.3 | 463.4 | 464.3 | 1.17/1 |
| Au@TiO2/Cu2O | 457.9 | 458.3 | 463.3 | 464.2 | 0.96/1 |
| Au@TiO2/Cu2O@Au | 457.9 | 458.3 | 463.4 | 464.3 | 1.03/1 |
| Au@Cu2O/TiO2 | 457.8 | 458.2 | 463.4 | 464.2 | 1.11/1 |
| Sample | B.E. (eV) | OV/OL Ratio 1 | ||
|---|---|---|---|---|
| OL | OV | OC | ||
| TiO2/Cu2O | 530.0 | 532.0 | 533.5 | 0.86 |
| Au@TiO2/Cu2O | 530.0 | 532.0 | 533.5 | 0.71 |
| Au@TiO2/Cu2O@Au | 530.0 | 532.0 | 533.5 | 0.74 |
| Au@Cu2O/TiO2 | 530.0 | 532.0 | 533.5 | 0.81 |
| Sample | B.E.(eV) | △B.E.(eV) 1 |
|---|---|---|
| Au@TiO2/Cu2O | 83.4 | −0.6 |
| Au@TiO2/Cu2O@Au | 83.7 | −0.3 |
| Au@Cu2O/TiO2 | 84.0 | - |
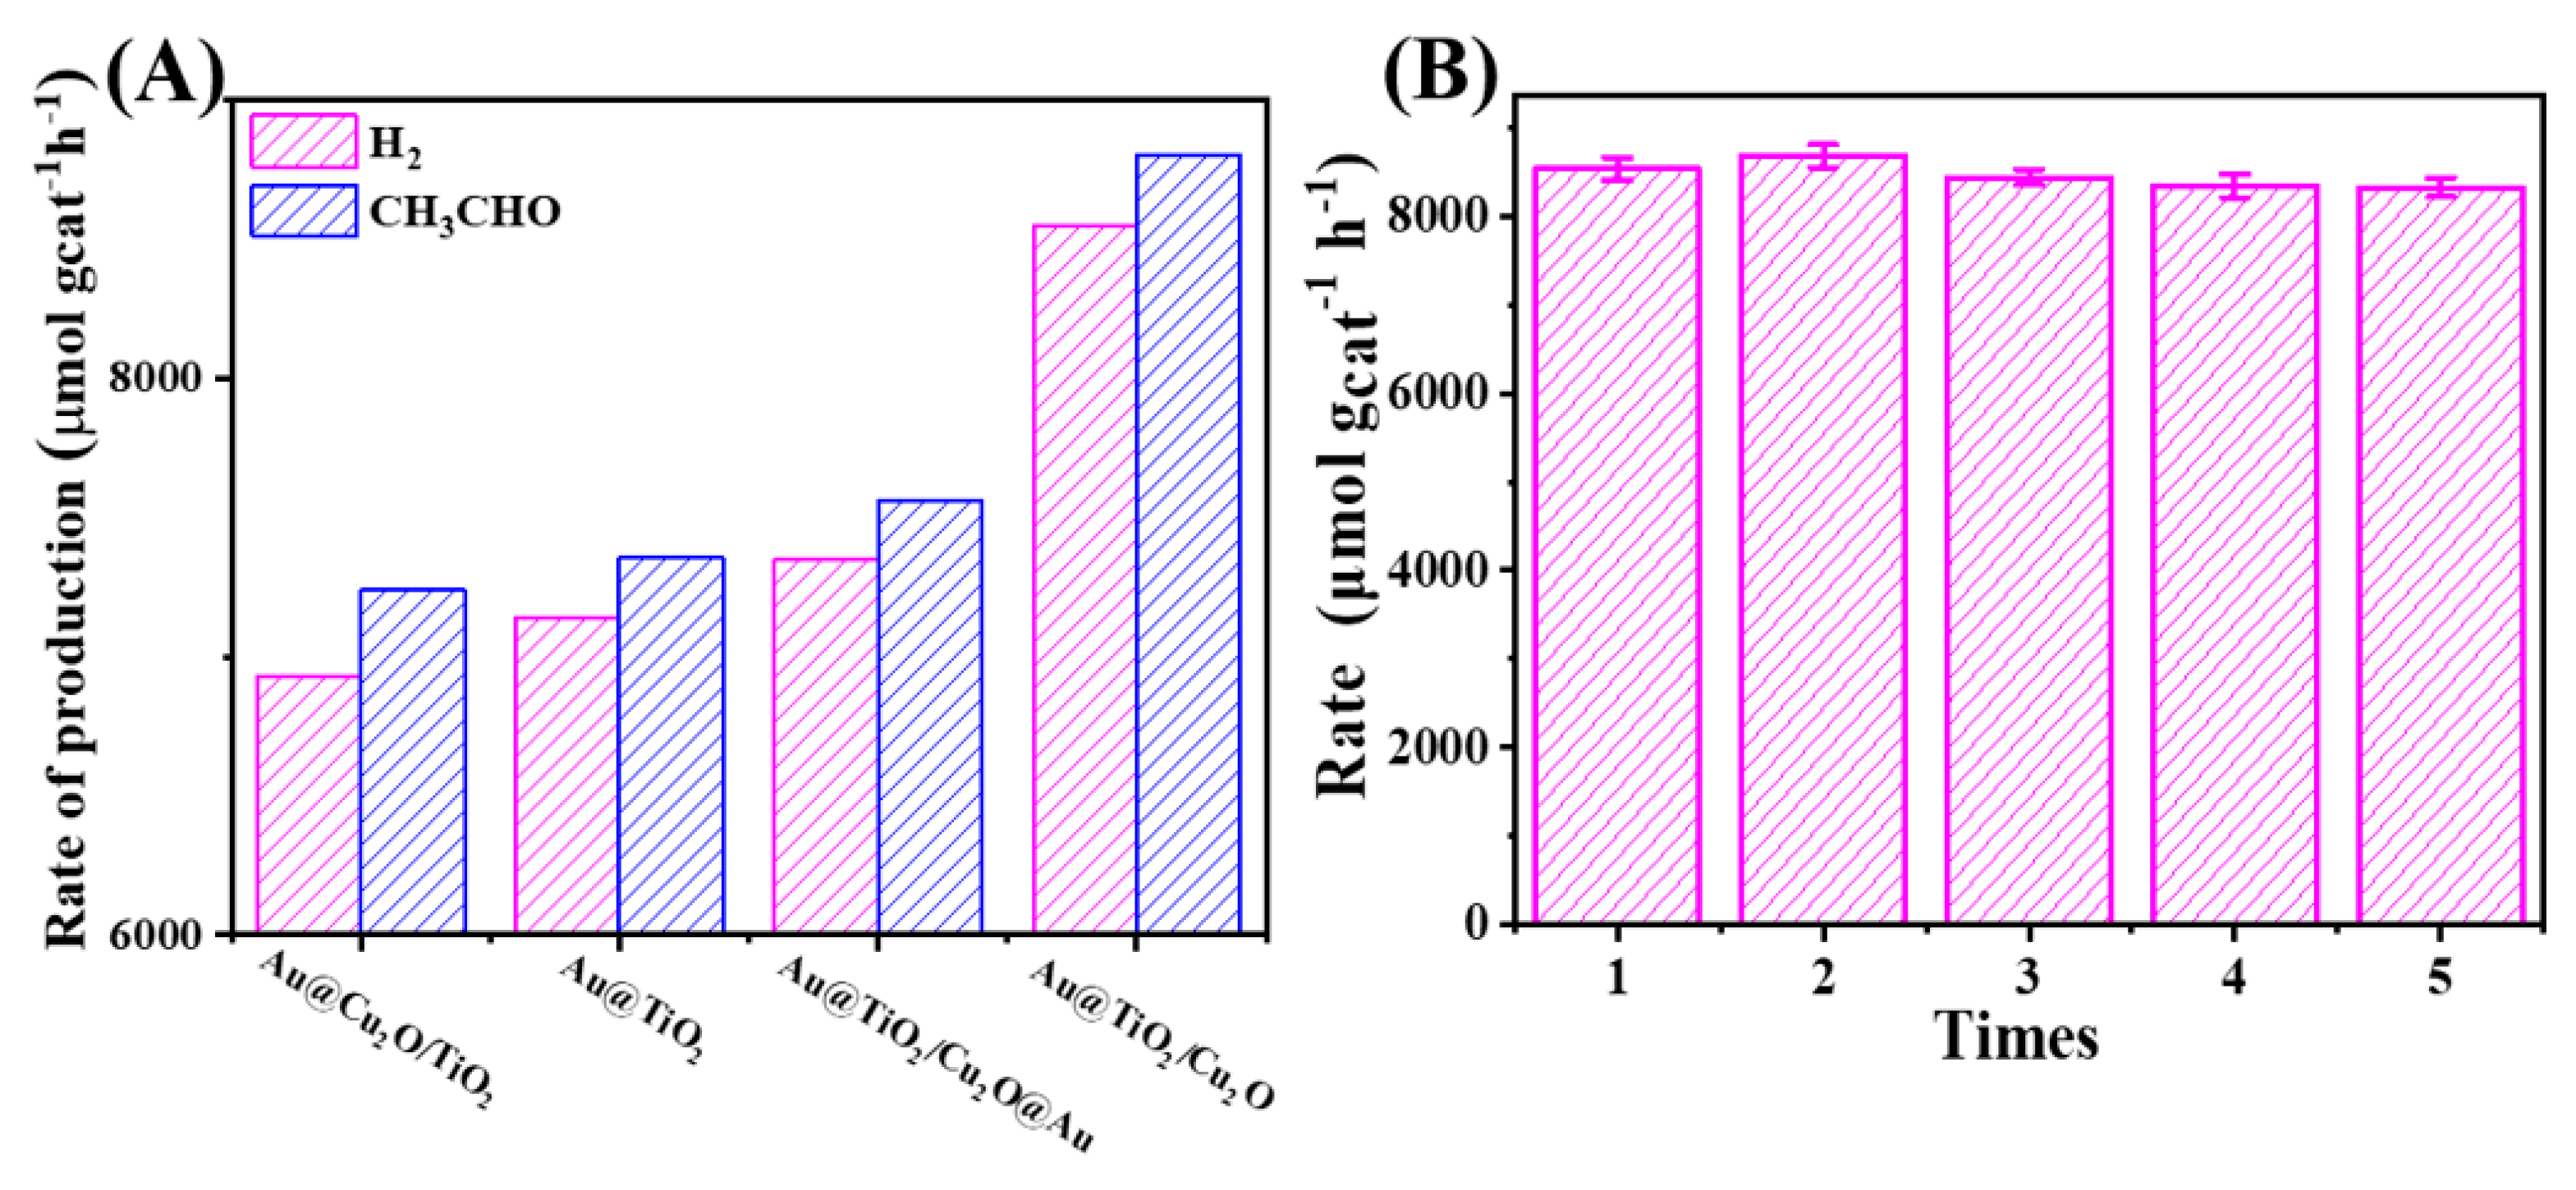
| Catalysts | Production Rate (μmol gcat−1 h−1) 1 | |||||
|---|---|---|---|---|---|---|
| Gas Phase | Liquid Phase | |||||
| H2 | CH4 | CO | CO2 | CH3CHO | CH3COOH | |
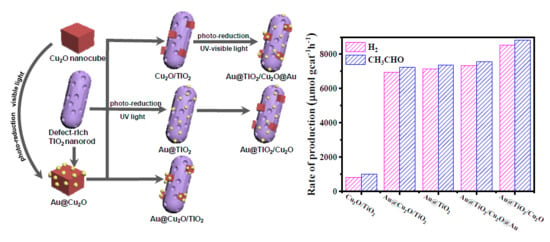
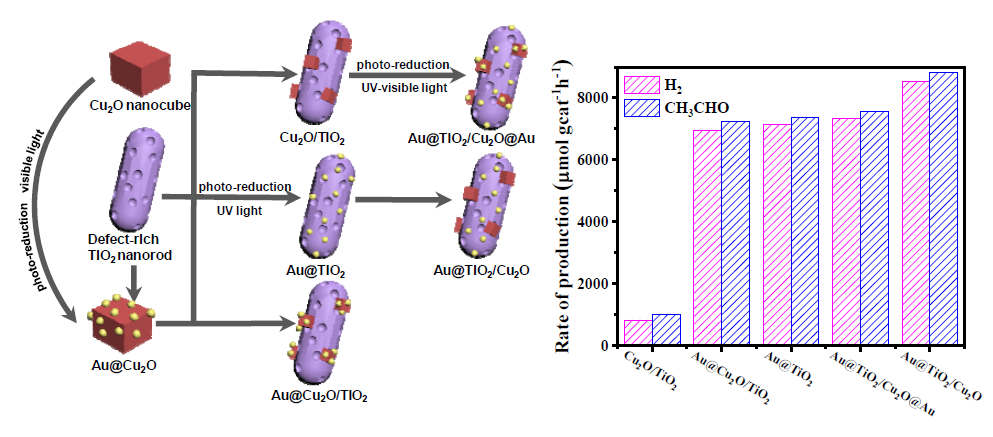
| Au@TiO2/Cu2O | 8548 | 5 | - | 3 | 8806 | - |
| Au@Cu2O/TiO2 | 6932 | 12 | 3 | 9 | 7239 | - |
| Au@TiO2/Cu2O@Au | 7348 | 13 | - | 7 | 7561 | - |
| Au@TiO2 | 7143 | 7 | - | 7 | 7356 | - |
| Cu2O/TiO2 | 830 | - | - | - | 1020 | - |
| TiO2 | 136 | - | - | - | 273 | - |
© 2020 by the authors. Licensee MDPI, Basel, Switzerland. This article is an open access article distributed under the terms and conditions of the Creative Commons Attribution (CC BY) license (http://creativecommons.org/licenses/by/4.0/).
Share and Cite
Luo, L.; Zhang, T.; Zhang, X.; Yun, R.; Lin, Y.; Zhang, B.; Xiang, X. Enhanced Hydrogen Production from Ethanol Photoreforming by Site-Specific Deposition of Au on Cu2O/TiO2 p-n Junction. Catalysts 2020, 10, 539. https://doi.org/10.3390/catal10050539
Luo L, Zhang T, Zhang X, Yun R, Lin Y, Zhang B, Xiang X. Enhanced Hydrogen Production from Ethanol Photoreforming by Site-Specific Deposition of Au on Cu2O/TiO2 p-n Junction. Catalysts. 2020; 10(5):539. https://doi.org/10.3390/catal10050539
Chicago/Turabian StyleLuo, Lan, Tingting Zhang, Xin Zhang, Rongping Yun, Yanjun Lin, Bing Zhang, and Xu Xiang. 2020. "Enhanced Hydrogen Production from Ethanol Photoreforming by Site-Specific Deposition of Au on Cu2O/TiO2 p-n Junction" Catalysts 10, no. 5: 539. https://doi.org/10.3390/catal10050539
APA StyleLuo, L., Zhang, T., Zhang, X., Yun, R., Lin, Y., Zhang, B., & Xiang, X. (2020). Enhanced Hydrogen Production from Ethanol Photoreforming by Site-Specific Deposition of Au on Cu2O/TiO2 p-n Junction. Catalysts, 10(5), 539. https://doi.org/10.3390/catal10050539