Article

Ir-Sn-Sb-O Electrocatalyst for Oxygen Evolution Reaction: Physicochemical Characterization and Performance in Water Electrolysis Single Cell with Solid Polymer Electrolyte

by
Nicté J. Pérez-Viramontes
1,
Virginia H. Collins-Martínez
2,
Ismailia L. Escalante-García
3,
José R. Flores-Hernández
4,
Marisol Galván-Valencia
3 and
Sergio M. Durón-Torres
3,*
1
Electrical Engineering Department, Autonomous University of Zacatecas, Col. Centro, Av. Ramón López Velarde 801, Zacatecas C.P. 98000, Mexico
2
S.C. Department of Materials Engineering and Chemistry, Advanced Materials Research Center, Miguel Cervantes 120, Complejo Industrial Chihuahua C.P. 31190, Mexico
3
Chemistry Department, Autonomous University of Zacatecas, Campus Siglo XXI, Edif. 6, Km 6 Carr. Zacatecas-Guadalajara, Zacatecas C.P. 98160, Mexico
4
National Institute of Electric and Clean Energy, Reforma 113, Col. Palmira, Cuernavaca, Morelos C.P. 62490, Mexico
*
Author to whom correspondence should be addressed.
Catalysts 2020, 10(5), 524; https://doi.org/10.3390/catal10050524
Submission received: 31 March 2020 / Revised: 4 May 2020 / Accepted: 5 May 2020 / Published: 8 May 2020
(This article belongs to the Special Issue Electrocatalytic Water Oxidation)

Abstract

:
Mixed oxide Ir-Sn-Sb-O electrocatalyst was synthesized using thermal decomposition from chloride precursors in ethanol. Our previous results showed that Ir-Sn-Sb-O possesses electrocatalytic activity for an oxygen evolution reaction (OER) in acidic media. In the present work, the physicochemical characterization and performance of Ir-Sn-Sb-O in an electrolysis cell are reported. IrO2 supported on antimony doped tin oxide (ATO) was also considered in this study as a reference catalyst. Scanning electron microscopy (SEM) images indicated that Ir-Sn-Sb-O has a mixed morphology with nanometric size. Energy dispersive X-ray spectroscopy (EDS) showed a heterogeneous atomic distribution. Transmission electron microscopy (TEM) analysis resulted in particle sizes of IrO2 and ATO between 3 to >10 nm, while the Ir-Sn-Sb-O catalyst presented non-uniform particle sizes from 3 to 50 nm. X-ray diffraction (XRD) measurements indicated that synthesized mixed oxide consists of IrO2, IrOx, doped SnO2 phases and metallic Ir. The Ir-Sn-Sb-O mixed composition was corroborated by temperature programmed reduction (TPR) measurements. The performance of Ir-Sn-Sb-O in a single cell electrolyser showed better results for hydrogen production than IrO2/ATO using a mechanical mixture. Ir-Sn-Sb-O demonstrated an onset potential for water electrolysis close to 1.45 V on Ir-Sn-Sb-O and a current density near to 260 mA mg−1 at 1.8 V. The results suggest that the mixed oxide Ir-Sn-Sb-O has favorable properties for further applications in water electrolysers.

Graphical Abstract

1. Introduction

Hydrogen (H2) production has been achieved using different processes such as hydrocarbon reforming, photocatalytic generation, biodigestion, water thermolysis and water electrolysis [1,2]. Water electrolysis (WE) is one of the most preferable processes since pure H2 can be obtained with the production of O2 as a secondary reaction [3]. Water electrolysis is a process in which a water molecule is separated into hydrogen and oxygen through the use of electrical energy. Hydrogen evolution reaction (HER) occurs at the cathode, while the evolution reaction of oxygen takes place in the anode side of a water electrolysis system [4,5,6]. Alkaline water electrolysis (AWE), solid oxide electrolysis (SOE) and solid polymer electrolyte water electrolysis (SPEWE) are some examples of water electrolysis systems currently available [7]. AWE presents several advantages such as a well-established technology, use of low-cost metals as catalysts and relatively low-cost materials for the system design. However, low current densities, crossover of gases and low operational pressures are some disadvantages that are associated with AWE. SOE is an emerging technology and further research is essential to establish its future potential application. On the other hand, SPEWE is currently the most studied electrolysis process thanks to several technological features [7,8,9,10]: high current densities, high voltage efficiency, good partial load range, compact system design and high purity gas production. Nevertheless, SPEWE has drawbacks such as the high cost of its components (i.e., proton membrane exchange (PEM) and noble metal catalysts) and a restricted low range of output power. In general, water electrolysis requires an excess of energy (i.e., overpotential) to overcome activation barriers, and without a proper supply of this energy excess, hydrogen and oxygen are produced slowly [11].
In WE, HER occurs near its thermodynamic potential with a rapid rate [12]. In contrast, the determining step in WE is the oxygen evolution reaction (OER). This is an irreversible reaction that commonly requires the application of a high overpotential in order to succeed. In order to reduce the power requirement of OER, several electrocatalysts have been proposed. In acidic media, it has been found that oxides of ruthenium and iridium with a rutile structure present high electrocatalytic activity for this reaction [4,5,6,13,14,15,16]. However, these are metals of low abundance in the earth’s crust; thus, their use considerably increases the overall cost of a water electrolyser when using these materials. In addition, RuO2 is unstable and dissolves at the operating potentials of SPEWE [5,13,17,18,19]. Accordingly, it is essential to obtain new lower-cost materials that catalyse the OER and present electrochemical, mechanical and thermal stability at the usual electrolyser operating conditions. A common practice that deserves attention and more research is the addition of supports and/or dopant elements in order to achieve low-load and stable catalysts with synergistic effects that speed up the oxygen evolution reaction [20,21,22,23,24,25]. Antimony doped tin oxide (ATO) has been used in multiple electrochemical applications, for instance, in fuel cells, batteries, gas sensors, solar cells, etc. [23,26]. Recently, ATO has been studied as a support for catalysts in WE due to its corrosion resistance properties in acidic media [21]. Likewise, SnO2-IrO2 mixtures have been extensively researched as electrocatalysts for the OER in an acidic environment [16,27,28].
Synthesis methods to obtain multi-element metallic materials have been investigated in order to reduce the load of precious metal in the anode design without compromising their electrocatalytic activity by their dilution [29,30,31,32,33,34,35]. Mixed oxides synthesized by thermal decomposition have shown high activity for OER [36,37,38]. However, the preparation of electrodes using this technique generally involves the use of a metallic substrate (i.e., titanium plates), and as a consequence, an adequate electrical contact between the electrode and the electrolyte membrane in the SPEWE is limited. As an alternative approach, the development of catalyst-support composite in powdered form can be proposed in order to improve the electrical contact between materials in the membrane electrode assembly (MEA) of SPEWE. In this context, our research group has previously reported a half-cell study of a mixed oxide Ir-Sn-Sb-O that demonstrated catalytic activity for OER [39]. In this early study, the oxide with Ir at 40% atomic composition showed superior electrocatalytic activity for OER compared with the mechanical mixed IrO2/ATO.
In order to further explore the properties and potential application of Ir-Sn-Sb-O mixed oxide, in this paper a detailed characterization and the preliminary performance of Ir-Sn-Sb-O in a single cell electrolyser are reported. For comparison purposes, mechanical mixtures of IrO2 and ATO (IrO2/ATO) were used as a reference and characterized using the same techniques. All electrocatalytic materials were obtained by thermal decomposition of the chloride precursors in ethanol using a synthesis procedure previously reported [39]. The morphology, structure and composition of electrocatalysts were analyzed using the following techniques: SEM, EDS, TEM, XRD and TPR. In order to get additional information about the materials, electrical conductivity was calculated from resistivity measurements by using a four points electrical resistivity (ER) device.
In general, the results showed that the polarisation curves for both catalysts are consistent with electrochemical impedance spectroscopy (EIS) results and other electrochemical measurements. These results indicate that Ir-Sn-Sb-O has better OER electrocatalytic properties than IrO2/ATO. Remarkably, the Ir-Sn-Sb-O material has the advantage of being obtained through a one-pot reaction, which is of great importance because the synthesis time was considerably reduced. For OER in WE, the measured onset potential was close to 1.45 V, and a current density of 300 mA per mg of Ir was recorded at a potential of 2.0 V for non-optimized single electrolysis cell measurements. The physicochemical and electrochemical results confirm that Ir-Sn-Sb-O electrocatalyst material could be used as anode in commercial WE devices.

2. Results and Discussion

2.1. Physical and Chemical Properties

2.1.1. Electrical Conductivity

The electrical conductivity, σ, of the materials was evaluated at different powder compaction pressures, P, using a four-points probe in a cylinder-piston device. The obtained conductivity values are reported in Table 1. The σ of the materials decreases as Ir-Sn-Sb-O > IrO2 > ATO, as shown in Table 1. The higher electrical conductivity observed for Ir-Sn-Sb-O may be due to the presence of metallic iridium and to the doping of mixed oxide with antimony, which improves the electron transport through the material. At 150 psi of pressure, the Ir-Sn-Sb-O material presented an electrical conductivity of 158,000 S m−1 approximately. This is a higher conductivity value than that for the 308 S m−1 mean value obtained for ATO. At the same time, the σ of Ir-Sn-Sb-O is several magnitude orders higher than typical conductivity values reported for Vulcan carbon (2160 S m−1), ATO (29.5 S m−1) and SnO2 (0.17 S m−1), obtained using four-points probe measurements in pellets at high compaction pressure [40]. For the IrO2 synthetized by thermal decomposition, the σ value (>1 × 10⁵ S m−1) was lower than the value reported for the mixed oxide; however, this value is consistent with the metallic conductivity commonly observed in iridium oxides [38,41]. Although a true comparison of conductivity with literature data is difficult to make due to the different experimental approaches used, the synthesized mixed oxide obtained appears to be a better electronic conductor than commonly used supports. These results suggest that the one pot synthesis method used in this work and the interaction of different metal oxides promotes the electronical conductivity of material. In Table 1, note that for all the materials, σ increases as the applied pressure increases. This observation is consistent with the progressive compaction of the powder by the piston in the measurement system, enhancing, then, the physical contact between the particles, and as a result, higher electrical conductivity values were obtained.

2.1.2. Scanning Electron Microscopy

Figure 1 shows the SEM micrographs of the ATO, IrO2 and Ir-Sn-Sb-O materials. Figure 1a corresponds to a micrograph of ATO with a 50,000× magnification, and it can be seen that the material is composed of agglomerates of particles with an average size of 50 nm. A higher magnification micrograph, 200,000×, shown in Figure 1b, reveals that the ATO support is composed of globular particles with sizes close to 10 nm. In Figure 1c,d, it is possible to appreciate that IrO2 exhibits a more homogeneous morphology; in this case, nanometric IrO2 particles showed less agglomeration than ATO particles and the micrograph at 200,000× magnification, Figure 1d, corroborated a near-to-spherical morphology of iridium oxide. In contrast, the Ir-Sn-Sb-O micrographs (Figure 1e,f) show a heterogeneous morphology composed of low porosity, large laminar aggregates with a size up to 600 nm and smaller agglomerates composed of fine globular particles. The high magnification SEM image suggests that Ir-Sn-Sb-O particles have particle sizes less than 10 nm, as shown in Figure 1f. The results of the chemical composition analysis using EDS and chemical elements distribution are discussed below.

2.1.3. Transmission Electron Microscopy

TEM micrographs of ATO are shown in Figure 2. Scanning-transmission electron microscopy (STEM) bright field mode micrographs displayed that the material is a polydisperse system of globular particles, as shown in Figure 2a. From image analysis of Figure 2b, STEM dark field mode, the histogram shown as an insert was obtained. It can be observed here that ATO nanoparticles show sizes between 3 nm to >10 nm, 5 nm and 7 nm being the sizes with the most abundant frequencies. Figure 2c shows the highest magnification micrograph, where the globular shape of the particles is confirmed. In some micrograph areas it is possible to distinguish the crystalline planes of the material. Although most of the particles have sizes smaller than 10 nm, a small fraction of them exceeds this size. Furthermore, some dislocations and deflections can be appreciated in the planes, which could be associated with the doping of SnO2 with Sb. Interplanar distances are determined in Figure 2d. The evaluated distances of 2.36 Å and 3.34 Å are associated with (200) and (110) planes of SnO2 with a rutile structure, and the (110) plane is predominantly across this oxide. Ávila Vázquez et al. [42] reported a d-spacing of 3.34 Å for the (110) plane for the Sb doped tin oxide, therefore tin oxide synthesized in this work may be considered as doped by Sb. The presence of these planes was further supported by XRD results.
TEM micrographs of the IrO2 are shown in Figure 3. A globular shape and dispersion of oxide particles are observed in the STEM bright field micrographs (Figure 3a). Particle size distribution analysis was obtained from Figure 3b, and the corresponding histogram is shown as an insert. Measured particles sizes ranged from 3 nm to particles greater than 10 nm; the major frequencies were observed between 5 to 7 nm. The shape of the nanoparticles is mainly globular (Figure 4c). Interplanar distances were obtained from the high resolution micrograph in Figure 3d, and spacings of 2.58 Å and 3.18 Å were attributed to (101) and (110) planes, respectively, of rutile structure IrO2.
TEM micrographs of Ir-Sn-Sb-O are shown in Figure 4. The STEM bright field micrograph in Figure 4a reveals highly dispersed nanosized particles that are deposited on the surface of micrometric size particles. In addition, the particles are agglomerated in large clusters. From Figure 4b, it was possible to obtain the histogram of the particle size distribution. The smaller particles have sizes between 2 to 9 nm, although larger particles with sizes >100 nm could be observed. Figure 4c shows TEM micrographs at high resolution. EDS coupled with TEM indicated that Area 1 shown in Figure 4c (larger particles) corresponds to ATO composition, while Area 2 (smaller particles) corresponds to IrO2 composition. In Figure 4d an interplanar distance of 2.2 Å is observed for smaller particles. This distance could be associated with an IrO2 plane with a rutile structure or with Ir0 with a simple cubic structure. This result could indicate the existence of multiple Ir oxidation states.
Three regions of each sample were analyzed using EDS, and typical atomic percent compositions of the elements are shown in Table 2. The ATO analysis shows the presence of Sn, O and Sb. In two regions (referred to as Area 2 and Area 3), a Sn:O atomic ratio of 1:2 is observable; thus, it is suggested that the main synthesized oxide is SnO2. However, a Sn:O ratio of 1:1 is also observed in the third region, which may be related with the presence of non-stoichiometric oxides. Likewise, a small percentage of Sb is present in two regions. This low atomic percentage is consistent with antimony as a doping species. On the other hand, the varying Ir:O atomic ratios found in IrO2, suggest the formation of different oxides in the catalyst, and they may be related with the presence of non-stoichiometric iridium oxide.
The analyzed areas of the Ir-Sn-Sb-O catalyst reveal the presence of Ir, Sn, Sb and O. Area 1 corresponds to one of the largest particles found in TEM, as previously described in Figure 4c. Here, the presence of Ir was not observable, confirming that the larger particles correspond to tin oxide; again, the low atomic percentage of Sb suggests that SnO2 is doped with Sb. In Area 2, corresponding to small particles, the atomic ratio between metal and oxygen is 2:1, which corresponds to IrO2 composition. However, the atomic percentage of the elements in Area 3 indicates that the formed oxide is non-stoichiometric. Thus, the EDS results of Ir-Sn-Sb-O suggest that the surface composition of the catalyst is heterogeneous and corresponds to a mixture of multiple iridium oxides dispersed on Sb doped tin oxide. The Cl atoms found in EDS analyses are attributed to the presence of precursor residues. In addition, the atomic percentage of Ir was expected to be 40 at.% Ir for Ir-Sb-Sn-O (according to the precursor proportions used in the synthesis step described in the Materials and Methods ection); however, the EDS results indicate that the average iridium atomic percentage was 33 at.% Ir in the Ir-Sb-Sn-O material, which is equivalent to a 20 wt.% Ir. This value was used to calculate the catalyst load in the anode of the electrolyser.

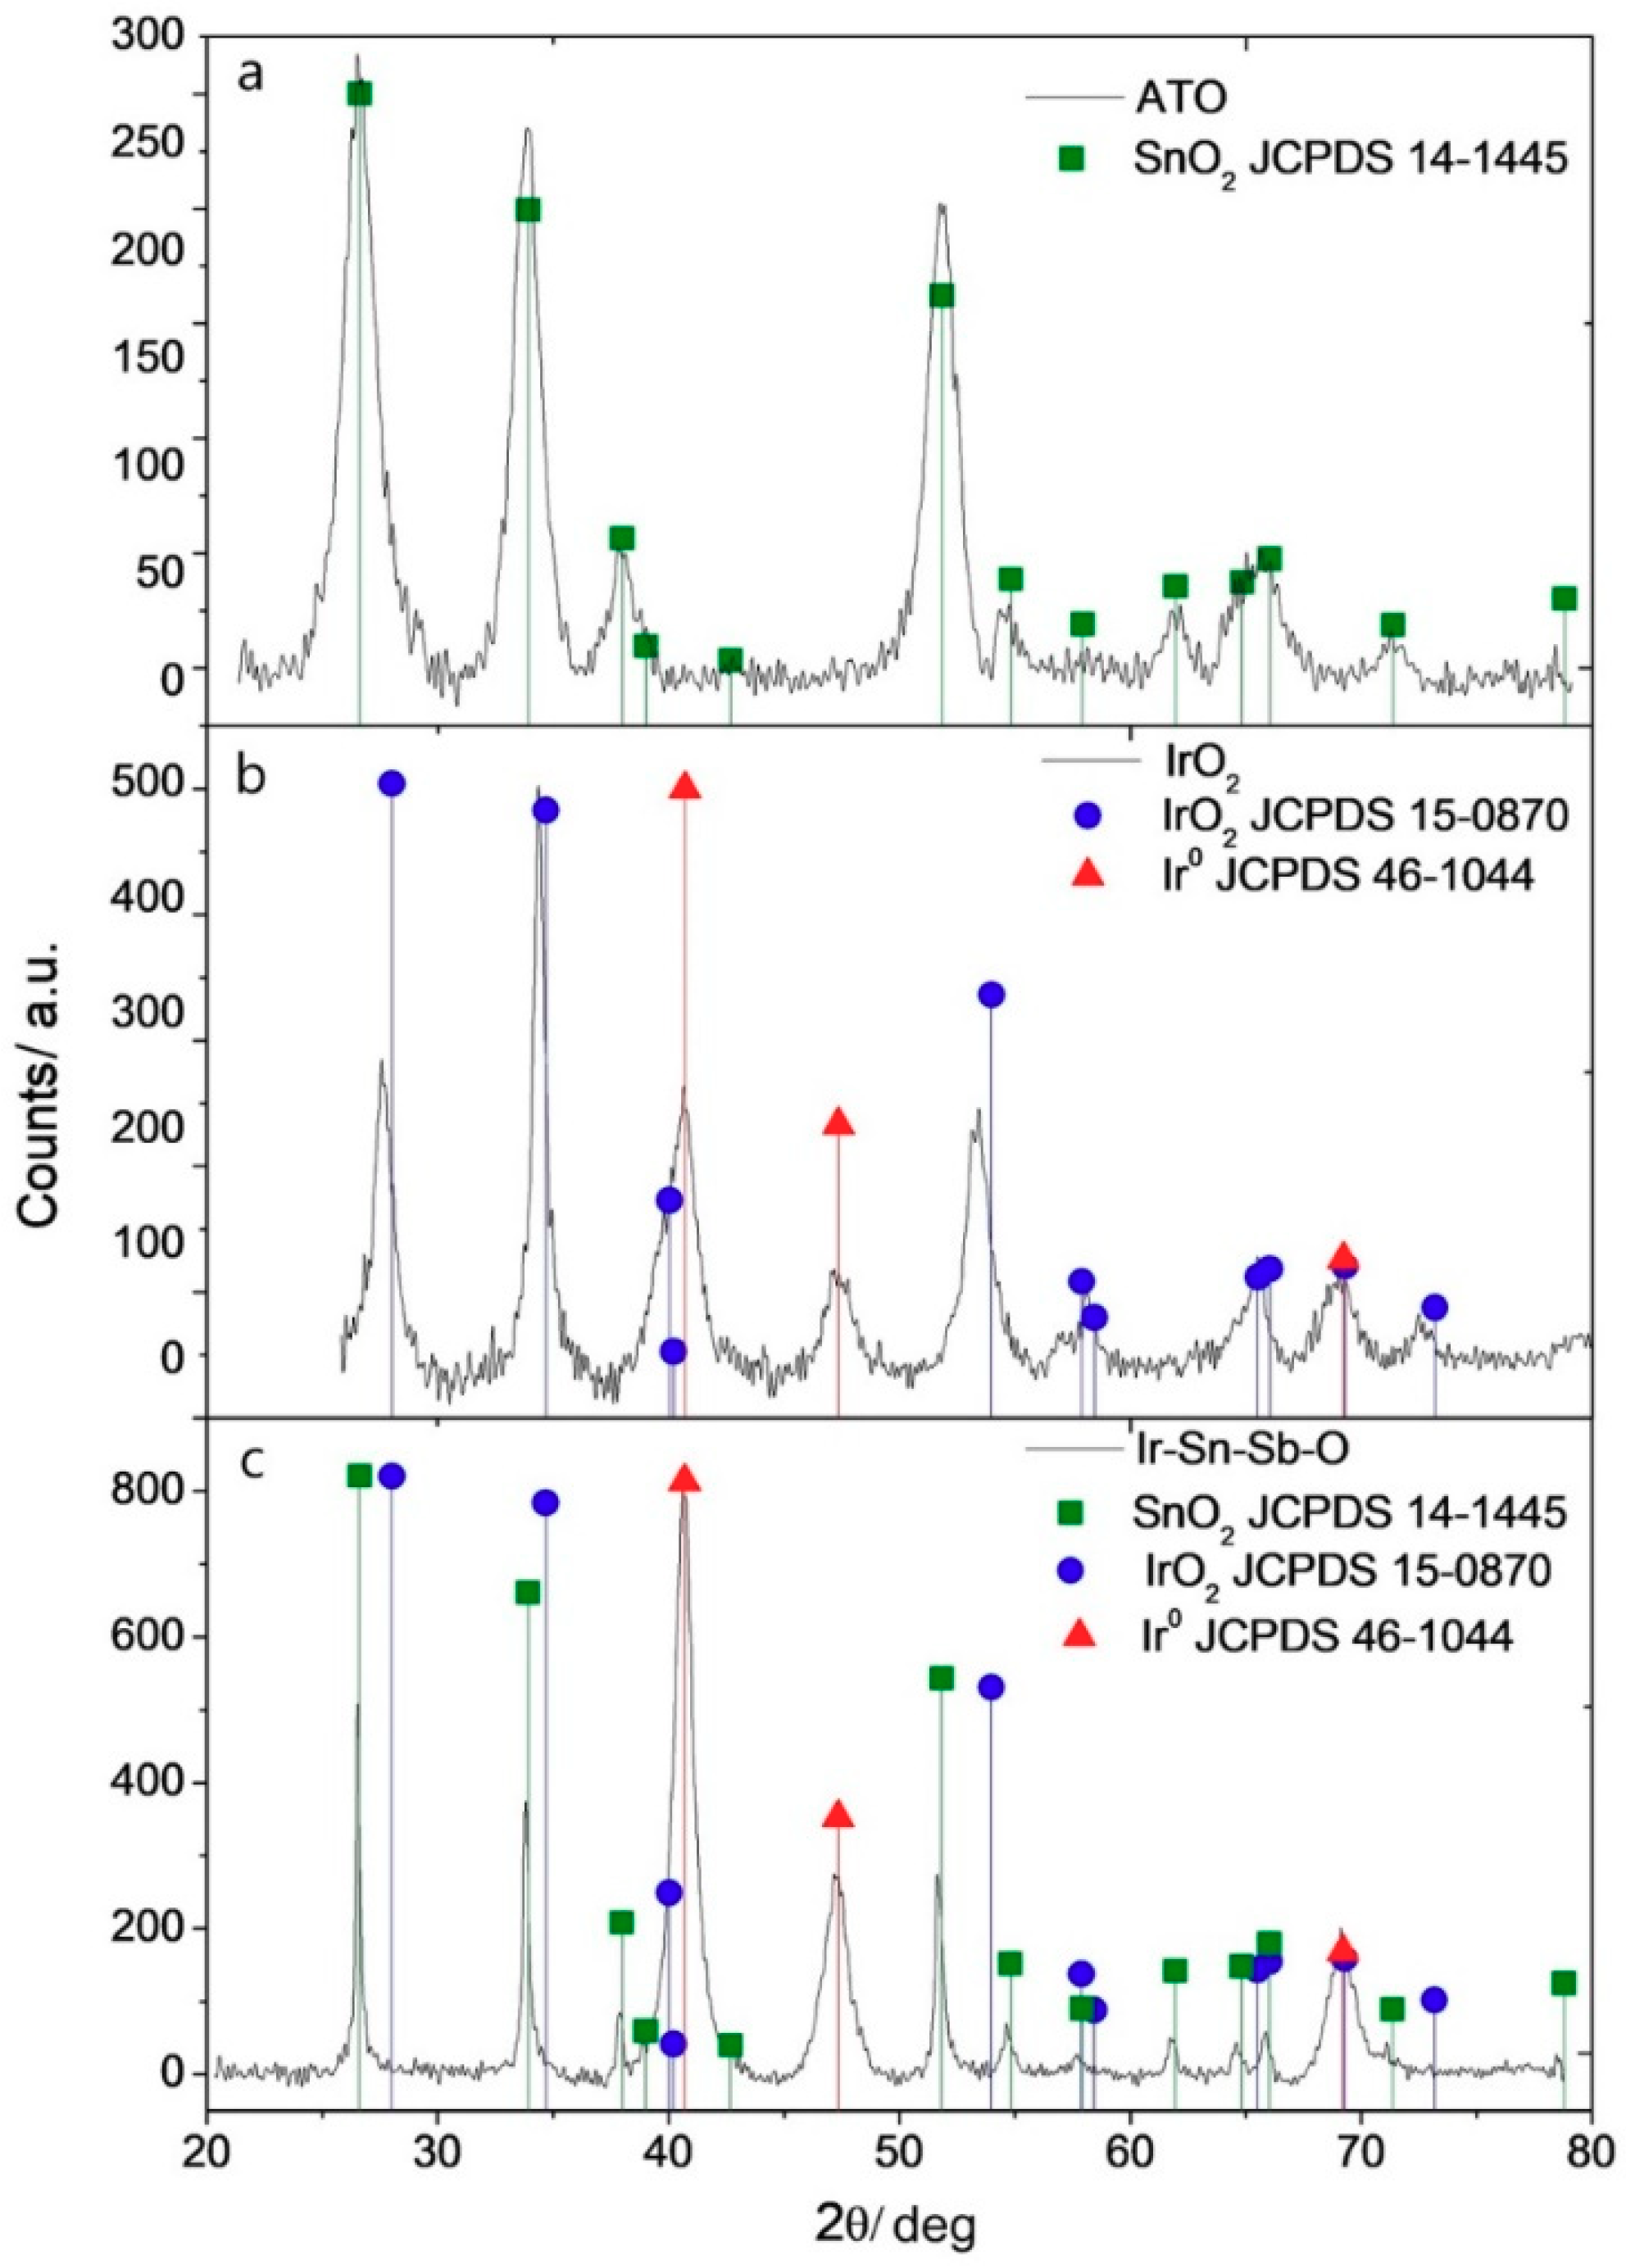
2.1.4. X-ray Diffraction

The X-ray powder diffractograms of ATO, IrO2 and Ir-Sn-Sb-O materials are shown in Figure 5. It can be appreciated that the three oxides present a crystalline structure typical of small size crystallite materials. Figure 5a displays the diffraction pattern of ATO, which is compared with the SnO2 reference pattern (JCPDS 14-1445). The diffractogram shows multiple peaks at 27.8°, 33.9°, 38.1°, 52.46°, 55.28°, 61.78°, 67° and 72.2°, which are associated with (110), (101), (200), (211), (220), (310) and (301) SnO2 planes respectively. These diffraction angles are related to a rutile structure of the oxide. The small displacement observed in the ATO diffraction peaks in respect to those of reference, suggest again that tin oxide is doped with antimony. The XRD pattern of the IrO2 (Figure 5b) showed intense peaks at 2θ values of 26.02°, 34.96°, 53.42°, 58.1°, 65.52° and 72.48°, which are in good agreement with the pattern of JCPDS 15-0870 crystallographic card and attributed to the diffraction of (110), (101), (221), (002), (310) and (202) planes of IrO2 with a rutile structure, respectively [43]. Additionally, the peak observed at 47.74° is associated with the (200) plane of metallic Ir, with a cubic structure (JCPDS 46-1044). The broad diffraction peak at 40.64° is associated with the overlapping between the diffraction of the (200) and (111) planes of the IrO2 and the (111) plane of Ir. Similarly, the peak at 69.04° corresponds to the overlapping of the (301) plane of the IrO2 and (220) plane of Ir. The slight displacements appreciated in the IrO2 diffractogram in respect to the reference cards can be attributed to the presence of Ir or other non-stoichiometric iridium oxides that could result in X-ray diffraction changes. Thus, the XRD results prove that synthesized IrO2 is mainly a mixture of metallic Ir and iridium oxide phases. Finally, Figure 5c shows the XRD diffraction pattern of Ir-Sn-Sb-O. In this diffractogram, the presence of peaks is observed at 27.54°, 33.82°, 37.88°, 51.96°, 54.76°, 57.76°, 61.77°, 64.58°, 65.88° and 69.12°, corresponding as before to diffraction angles of the SnO2 rutile structure, as previously discussed. Again, the peaks at 40.62° and 47.2° can be associated with cubic structured metallic Ir. In this catalyst it was not possible to identify any diffraction peak related with IrO2; however, the presence of amorphous IrOx cannot be discarded, since it does not commonly present a defined XRD pattern [44]. Furthermore, TPR measurements could confirm the presence of this species.

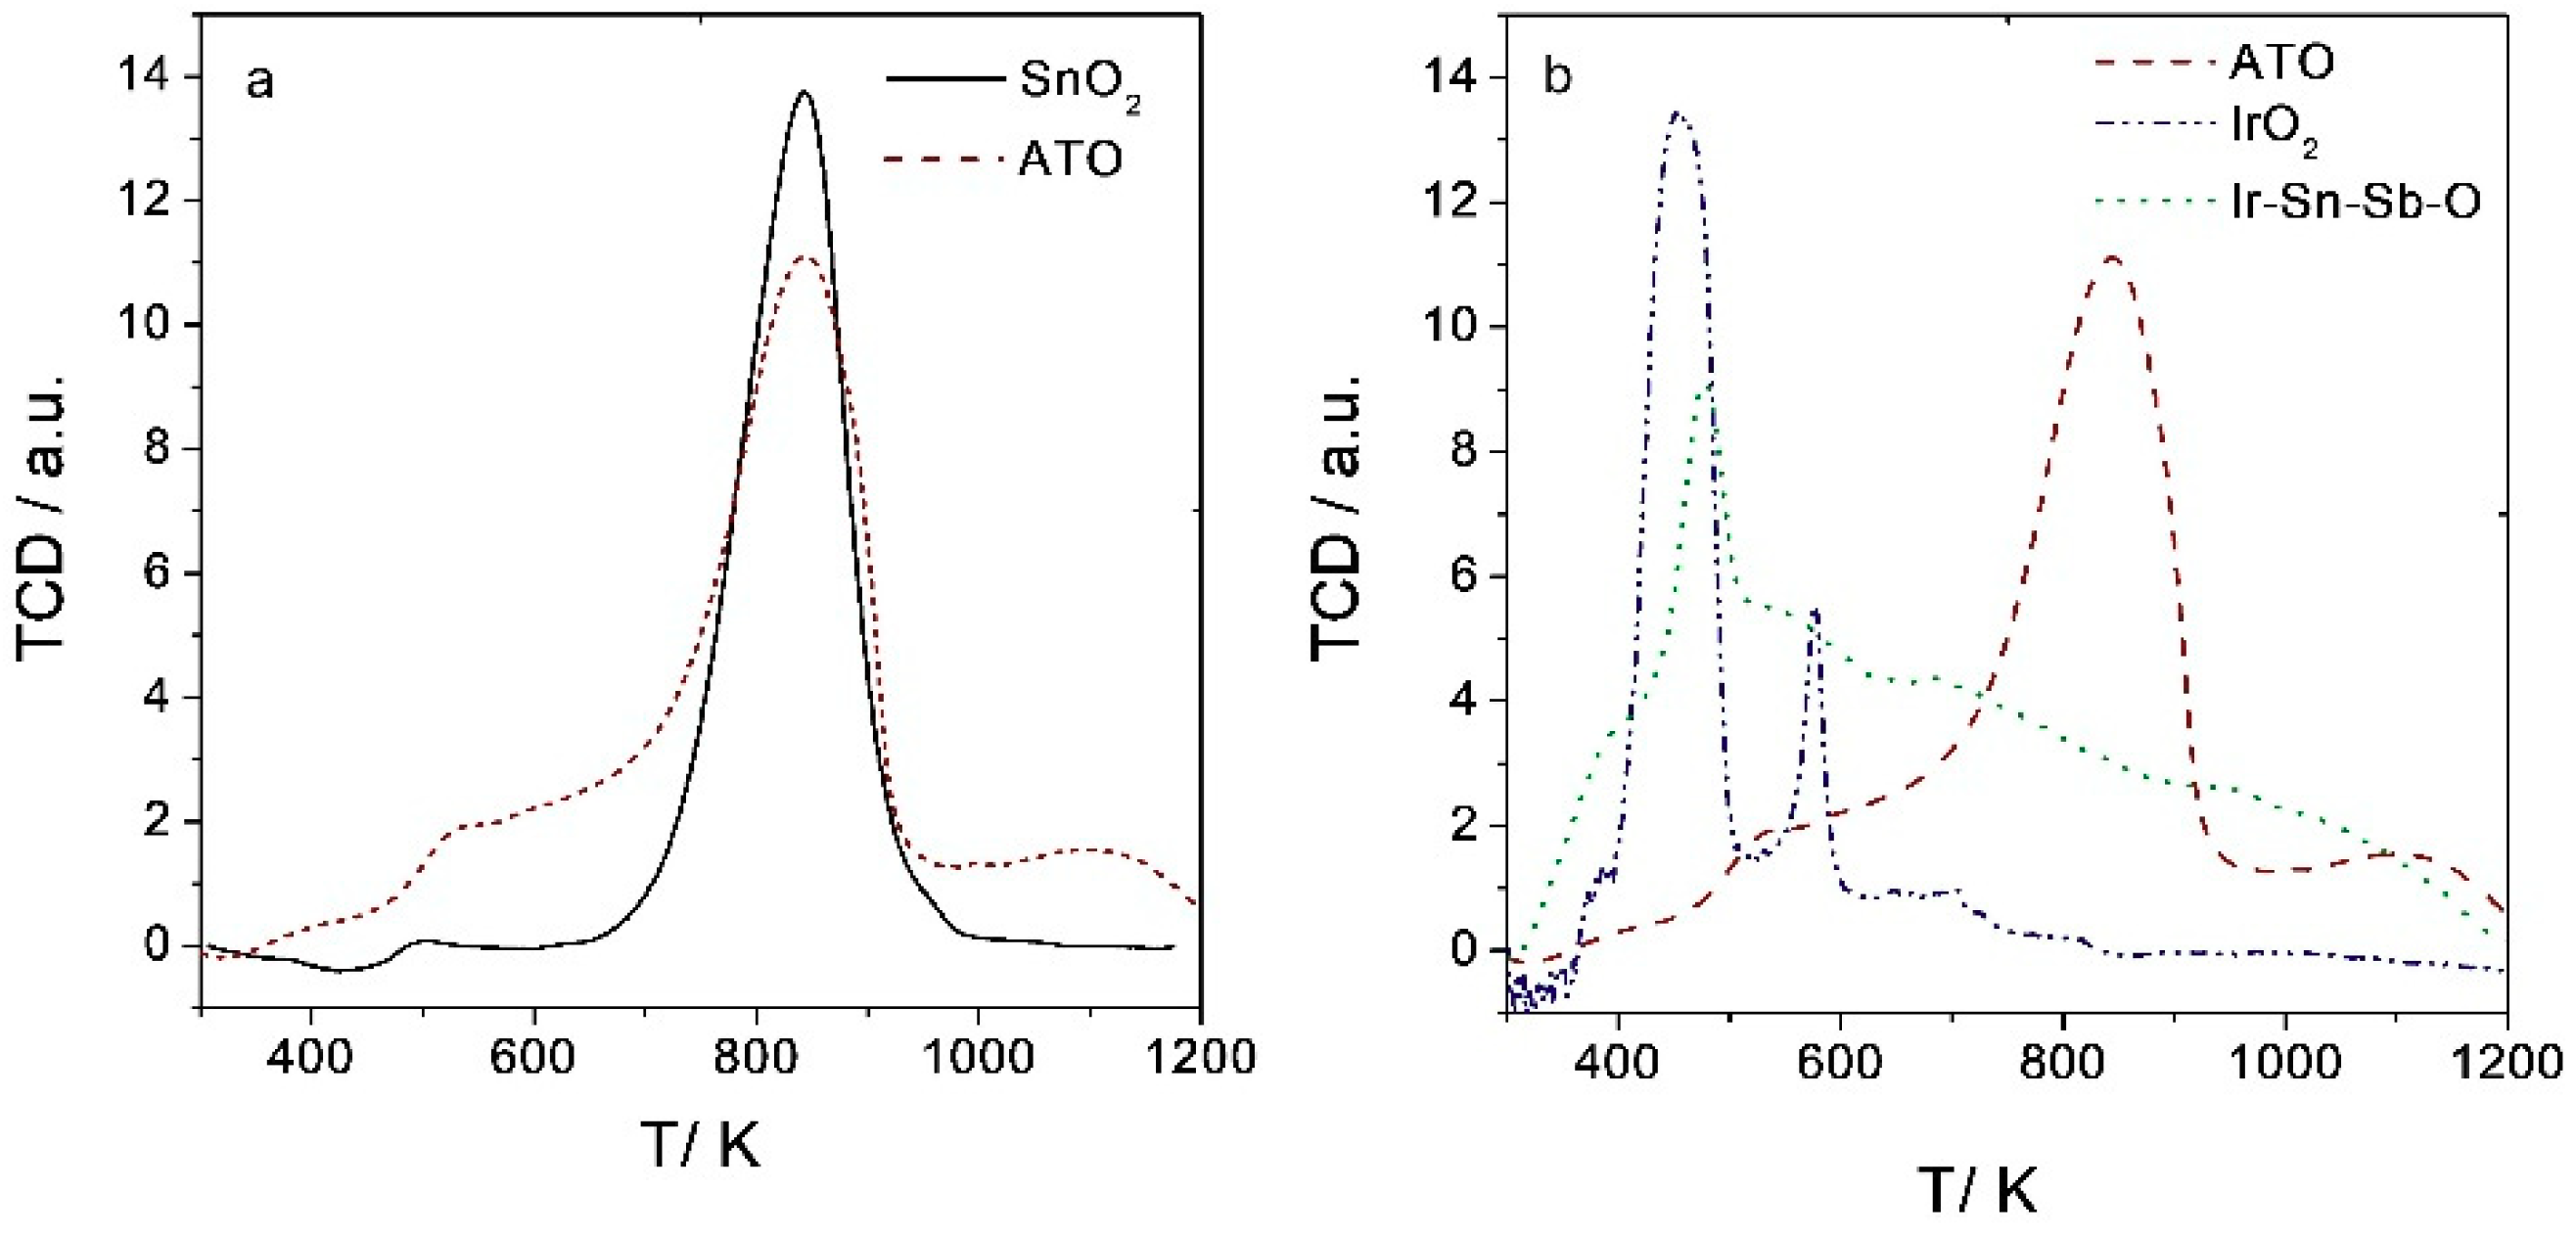
2.1.5. Temperature Programmed Reduction

TPR profiles of commercial SnO2 and synthesized ATO are shown in Figure 6a, and the TPR profiles of ATO, IrO2 and Ir-Sn-Sb-O are reported in Figure 6b. Note that the thermal conductivity detector (TCD) signal for Figure 6a,b was normalized by the sample mass. The reduction profile of SnO2 is symmetric with a maximum of 850 K; this signal suggests that the SnO2 suffers an easy reduction by H2. The TPR profile of ATO has a maximum at the same temperature, suggesting that the main oxide corresponds to SnO2. Furthermore, the slight asymmetry observed and the presence of a small peak near to 1100 K have been reported as evidence for the Sb doping of SnO2 [45]. In Figure 6b, TPR profiles are shown for IrO2 and Ir-Sn-Sb-O catalyst, and they are also compared with those for SnO2. In the IrO2 reduction, two stages are observed as described next. A first reduction peak starts near to 400 K reaching a maximum value at 450 K; this peak is associated with the amorphous phase of iridium oxide (IrOx) [44]. A second reduction peak appears close to 550 K and is associated with the reduction of the IrO2 with a rutile structure [44]. On the other hand, the Ir-Sn-Sb-O TPR curve shows multiple reduction peaks, with the first appearing near to 500 K, which likewise is associated with the reduction of IrOx. A displacement in the maximum of the reduction peak can be observed with respect to that obtained for IrO2, and it is associated with an improvement of the thermal stability of the oxide due to the interaction with other metal oxides. Similarly, a shoulder near to 550 K is observable and corresponds to the reduction of IrO2. Broad reduction peaks of SnO2 species can also be appreciated between 700 and 800 K. The TPR results along with the EDS and XRD results confirm that Ir-Sn-Sb-O catalyst consists of a mixture of multiple phases, with different oxidations states of Ir which could interact with each other to favor the electrocatalysis of OER.

2.2. Single Cell Electrochemistry

All electrochemical experiments in single electrolysis cell were carried out at 70 °C with a flow rate of water of 7 mL min−1. The total resistance of the cell was measured by using a high impedance ohmmeter, showing a low resistance of 0.24 Ω. The single-cell experiments were performed for comparative purposes between Ir-Sn-Sb-O and IrO2/ATO catalysts using a potentiostat/galvanostat. In the electrochemical graphics shown in this section, the current density is normalized by the Ir metal mass used in the anode, and all the potentials reported in the paper correspond to the cell voltage (Ecell), which is the terminal potential applied between the cathode and anode, usually is represented as:
E c e l l = G ( T , p ) 2 F + η A a ( j ) + | η A c ( j ) | + j   R c e l l
where G ( T , p ) 2 F is the thermodynamic voltage of water electrolysis, η A a and | η A c | are the anodic and cathodic overvoltages, and R c e l l is the global ohmic resistance of the cell [46,47].
A commercial catalyst of Pt/C at 5 wt.% was used as cathode, with a load of 0.2 mg cm−2 of Pt. At the anode side, Ir-Sn-Sb-O or IrO2/ATO, was used with a load of 2.6 mg cm−2 equivalent to 0.5 mg cm−2 of Ir metal, as estimated from EDS measurements. The catalysts were sprayed on both sides of a Nafion® 117 membrane. Further details of the electrolysis cell and MEA preparation can be found in the Materials and Methods section.

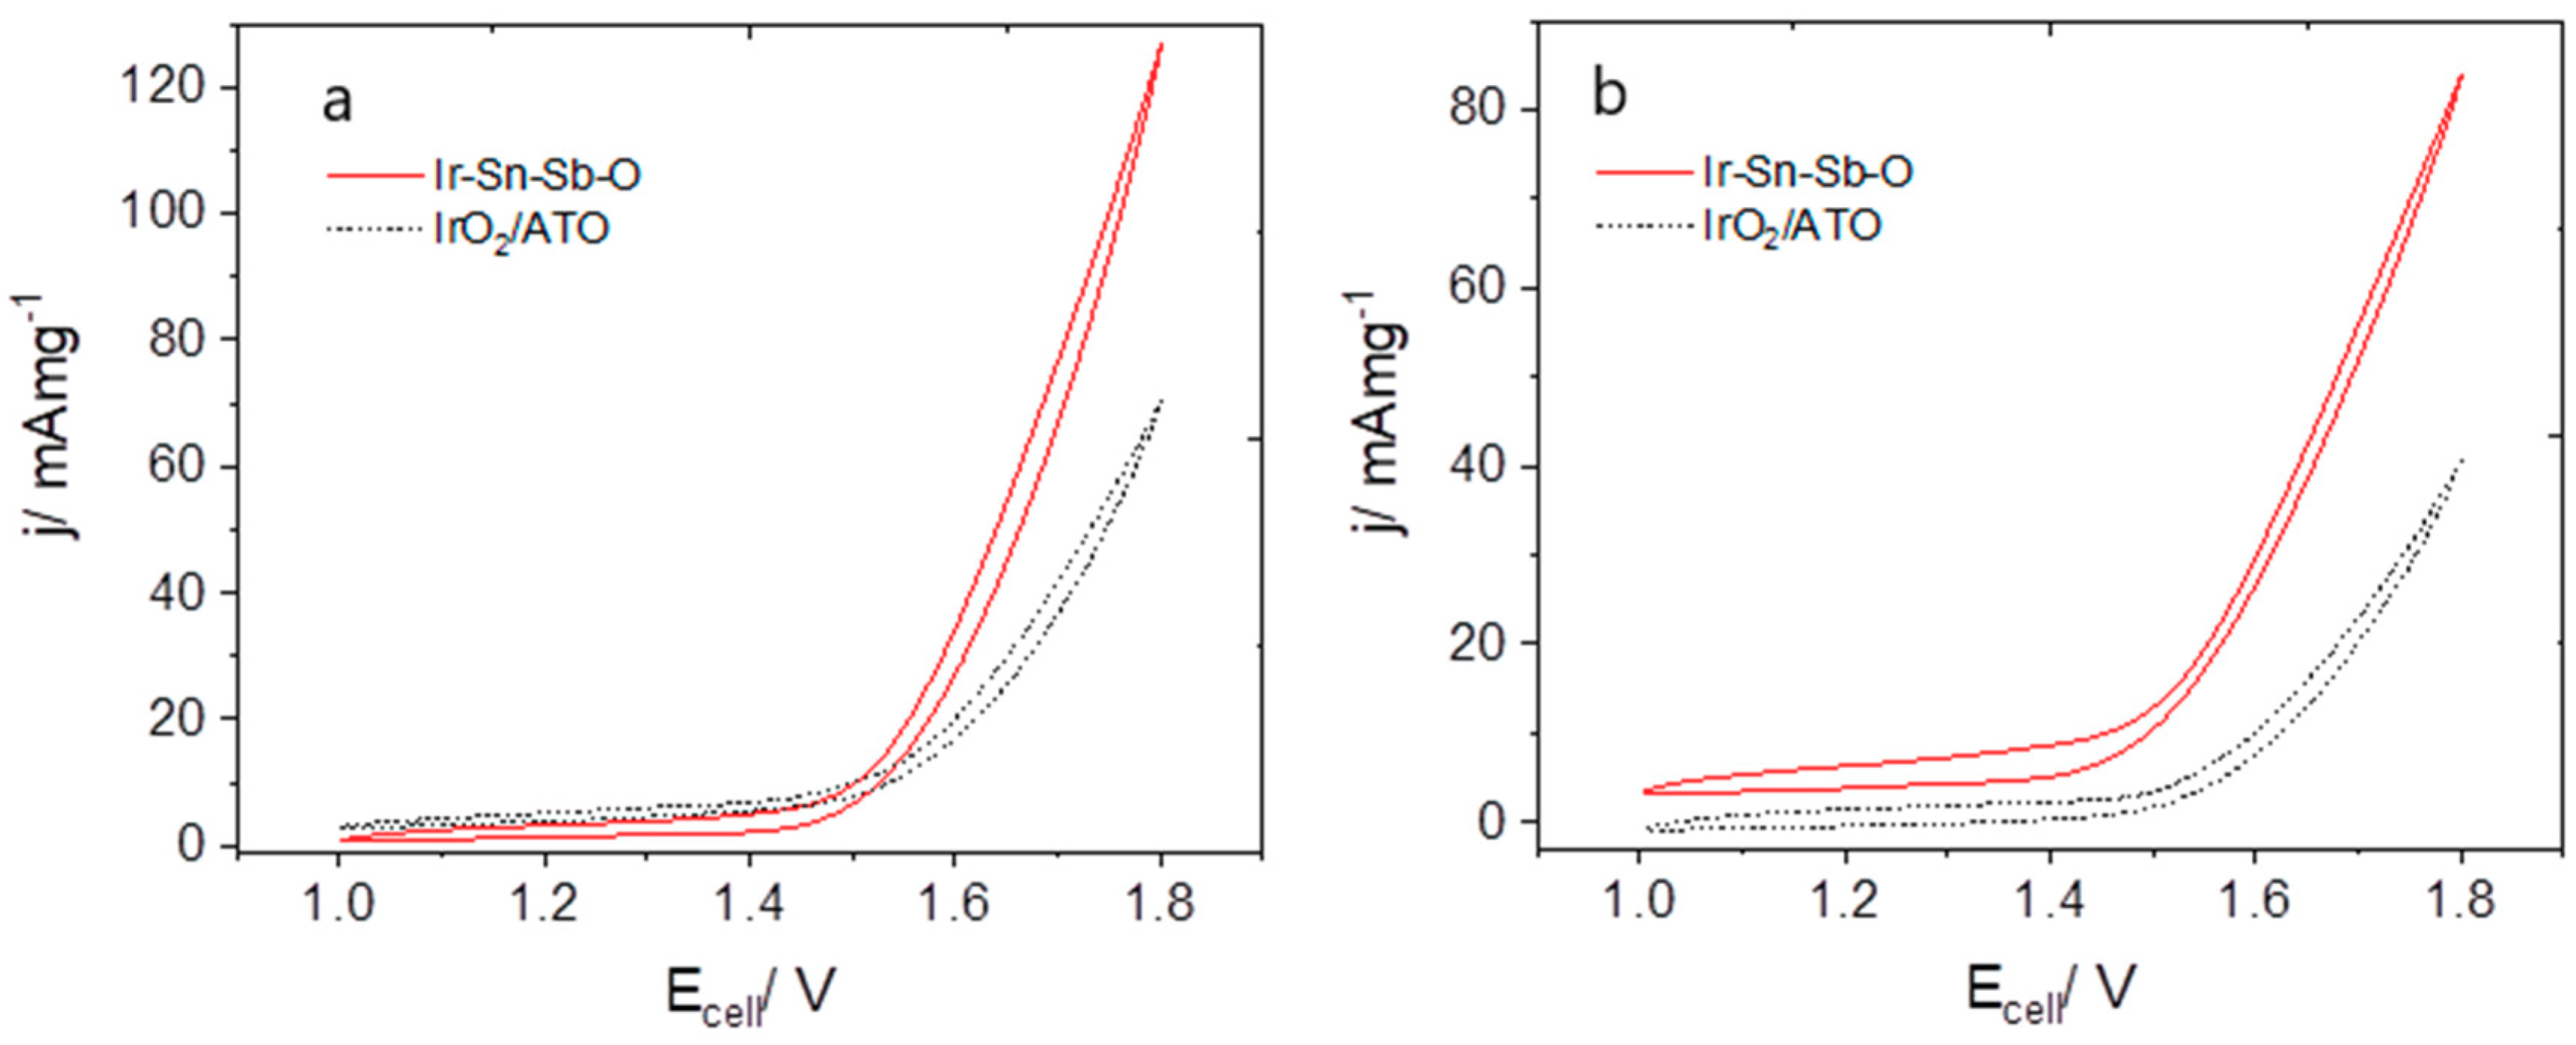
2.2.1. Cyclic Voltammetry

Cyclic voltammetry (CV) of IrO2/ATO and Ir-Sn-Sb-O MEAs obtained before the polarization curves are shown in Figure 7a. It can be observed that the onset potential for the OER (EOER) starts near to 1.5 V for assemblies with IrO2/ATO or Ir-Sn-Sb-O catalysts. Nevertheless, the electrolysis reaction on the Ir-Sn-Sb-O occurs faster than on the IrO2/ATO assembly. For instance, at 1.8 V the current density is approximately 70 mA mg−1 for ATO supported iridium oxide and close to 130 mA mg−1 for Ir-Sn-Sb-O catalyst. In Figure 7b, the CV of Ir-Sn-Sb-O and IrO2/ATO are shown after the polarization curve, and a decrease in the electroactivity of both assemblies can be appreciated. The decrease in the current density for both materials could be due to a dissolution of the coating on the membrane surface, but further experimentation should be done to prove it. However, the fall in the current density for Ir-Sn-Sb-O in the CV was close to 30% of the initial current density, while the IrO2/ATO assembly exhibited a drop near to 40%. Overall, these results may be interpreted as the first evidence of an increased stability of Ir-Sn-Sb-O.

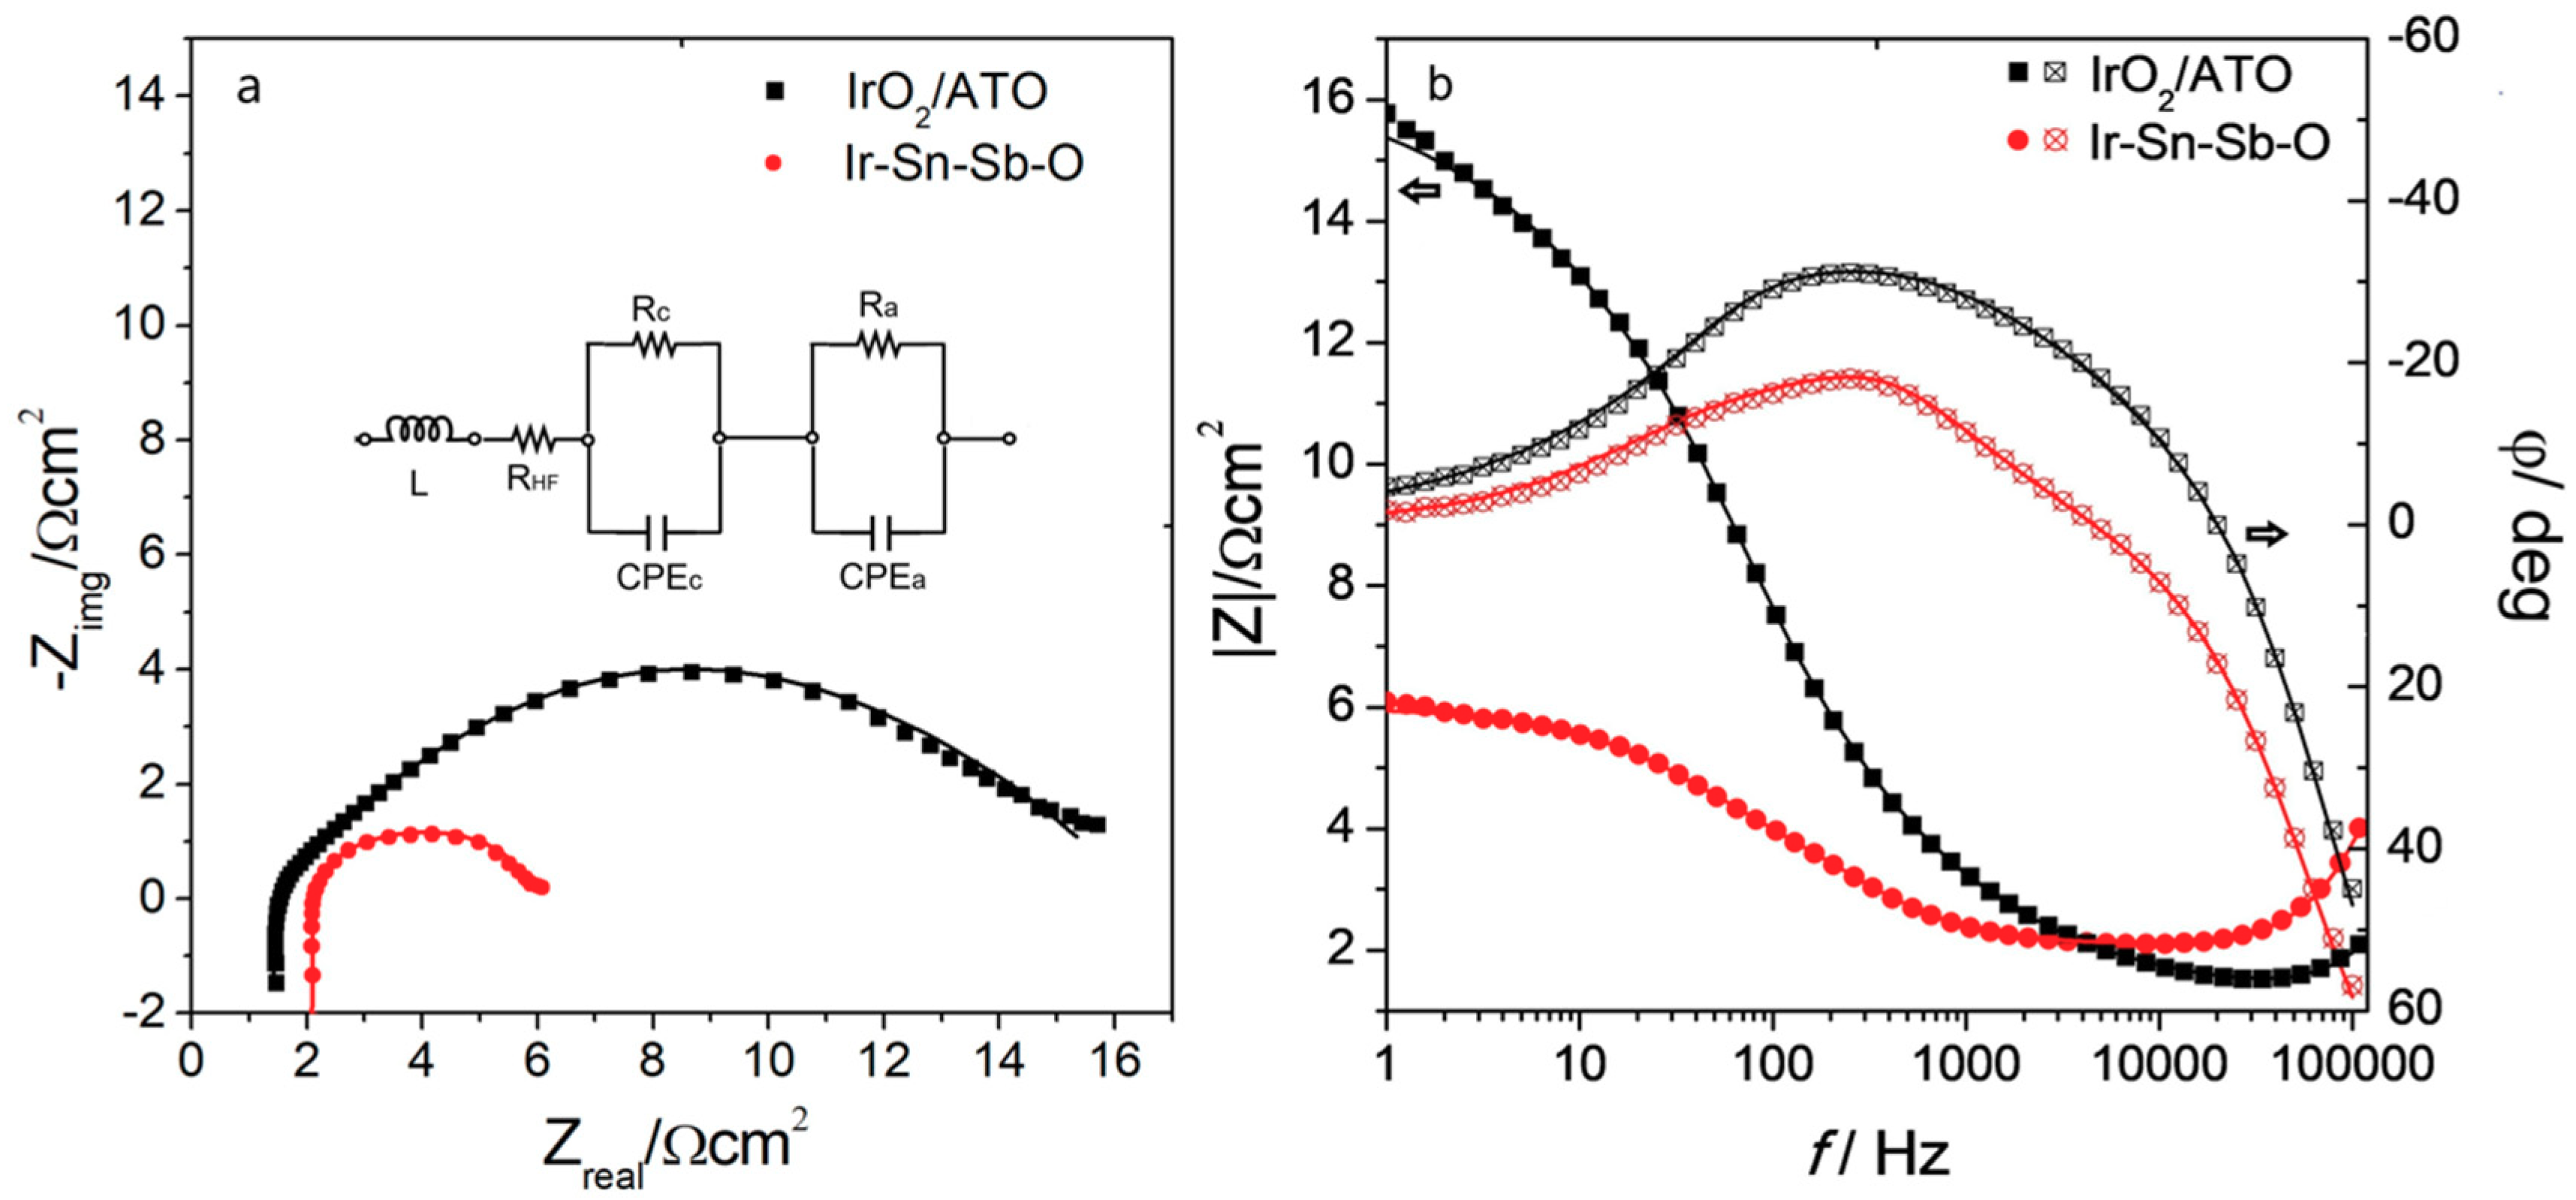
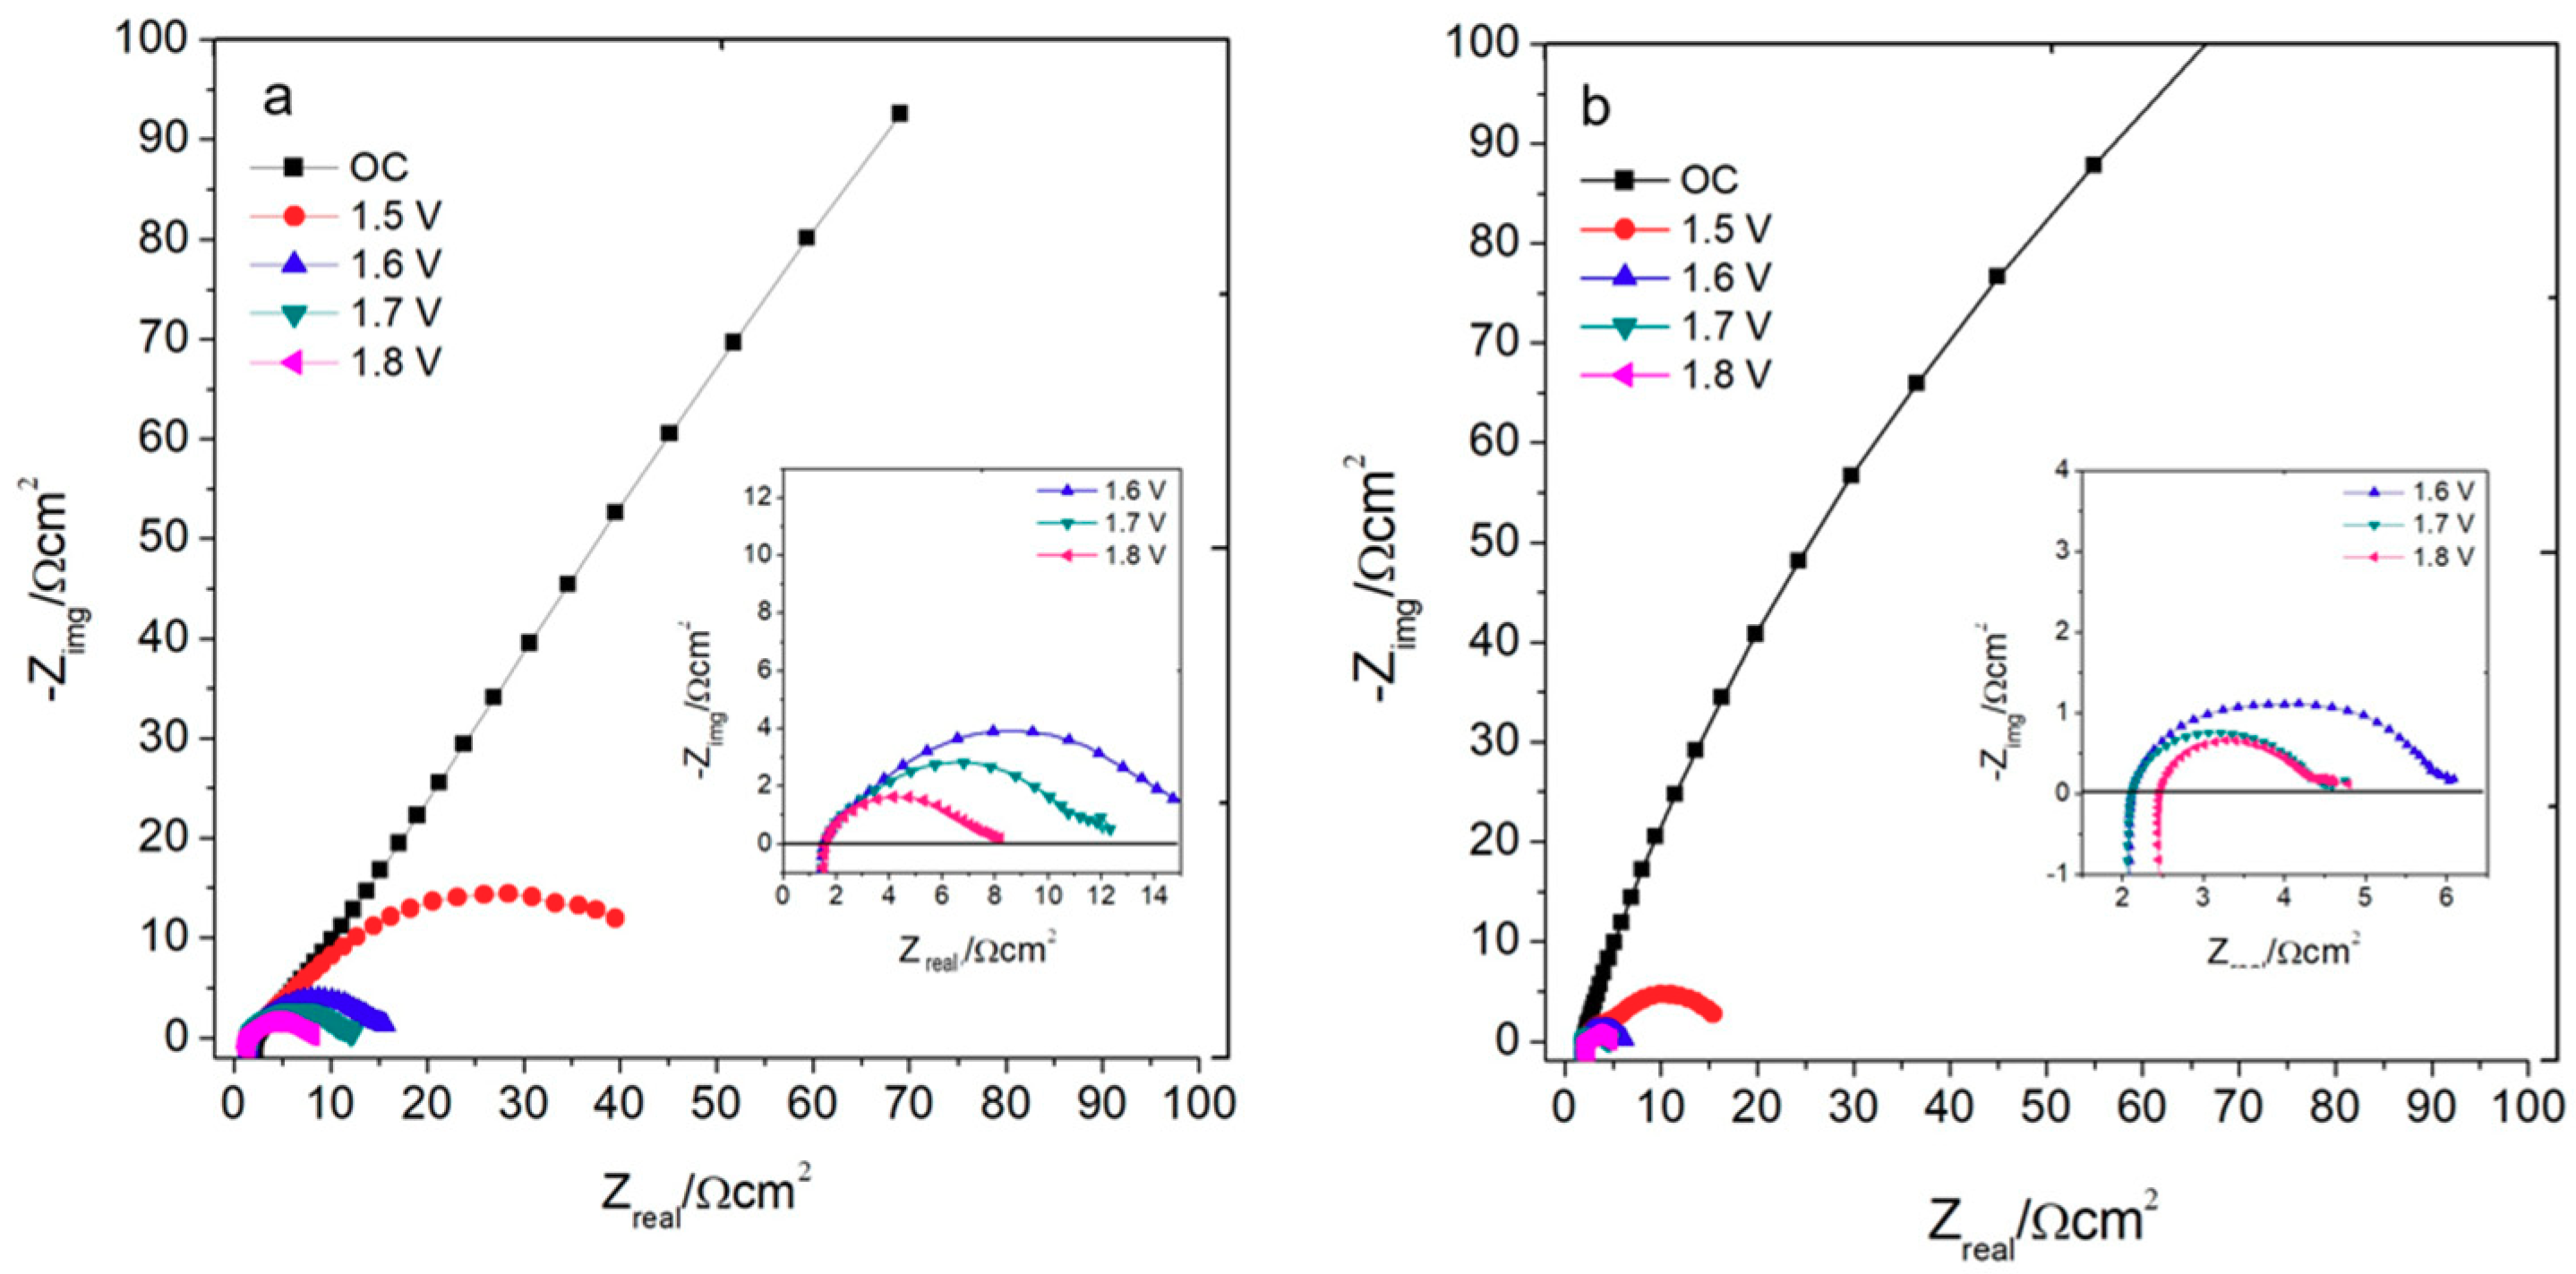
2.2.2. Electrochemical Impedance Spectroscopy

Figure 8 shows the EIS plots for the electrolysis cell assembled with IrO2/ATO and Ir-Sn-Sb-O MEAs at 1.6 V. Figure 8a,b shows Nyquist and Bode plots respectively. At the high frequency region, impedances points can be observed with positive components in the imaginary impedance axis, which are related to inductive effects associated to the magnetic field created by the electrical current flow through the wiring and measuring components of the cell [48]. In Figure 8a, the intercept on the Zreal axis corresponds to the cell ohmic resistance, which includes the resistance of wiring components, membrane and the resistance of the catalytic layer [48,49]. This value was used for ohmic drop correction of the polarization curves described below. It can be appreciated that ohmic resistance in both assemblies is similar. In addition, in both spectra, a depressed arc can be observed that includes two overlapped semicircles related to the interfacial impedance of the two electrodes. The presence of two electrode processes is revealed in a clearer form in the phase angle curve of Bode plots (Figure 8b), where the separate characteristic frequencies can be appreciated of two parallel R-C circuits. The projection of the arcs on the real impedance axis corresponds to the global charge transfer resistance associated with electrode reactions. It is easy to observe that the transfer resistance is smaller for the Ir-Sn-Sb-O catalyst than that for the mechanical mixture. In the insert of Figure 8a, the proposed equivalent circuit (EC) for the electrolysis system is shown. This circuit is similar to that previously reported [50]. In the EC, L is the inductor, RHF represents the resistance at high frequencies, Rc and CPEc correspond to a parallel arrangement between a resistor and a constant phase element associated with the processes in the cathode, and Ra and CPEa represent a second parallel circuit corresponding to the anodic process. The complex nonlinear least squares fitting (CNLS) of the experimental data obtained using the equivalent circuit discussed before is shown as continuous lines in Figure 8a,b. It can be observed that a good fit between the simulated and experimental data was obtained for both Nyquist and Bode graphics (χ2 = 7.3 × 10⁻⁶). A summary of the EC element values obtained from the fitting are presented in Table 3.
From Table 3, we can appreciate that the inductance values due to the external circuitry were in the order of 10−6 H. This is in agreement with inductance values reported before and are related to framework cell components [51]. Furthermore, it is confirmed that the high frequency resistances values, close to 2 Ω cm2, were similar in both assemblies because the same electrolysis cell was used in all EIS experiments. The Ra value in both assemblies was higher than the Rc values; this result supports the fact that OER is the limiting reaction in water electrolysis. On the other hand, the anode charge transfer resistance of the Ir-Sn-Sb-O catalyst was 3.6 times smaller than that for the IrO2/ATO mixture, which means that the Ir-Sn-Sb-O material improves the global kinetics in the electrolyser, mainly the OER rate.
Figure 9a,b show the Nyquist plots as a function of potential for IrO2/ATO and Ir-Sn-Sb-O assemblies respectively. It can be clearly observed that the total impedance of both systems decreases as the applied voltage increases. The insets in Figure 9 present more detailed impedance curves for high potentials. For each applied potential the arc amplitudes were smaller for the Ir-Sn-Sb-O than for IrO2/ATO. These results further confirm that the one pot synthesized material presented higher electroactivity for OER than the mechanical mixture catalyst for applications as anode.

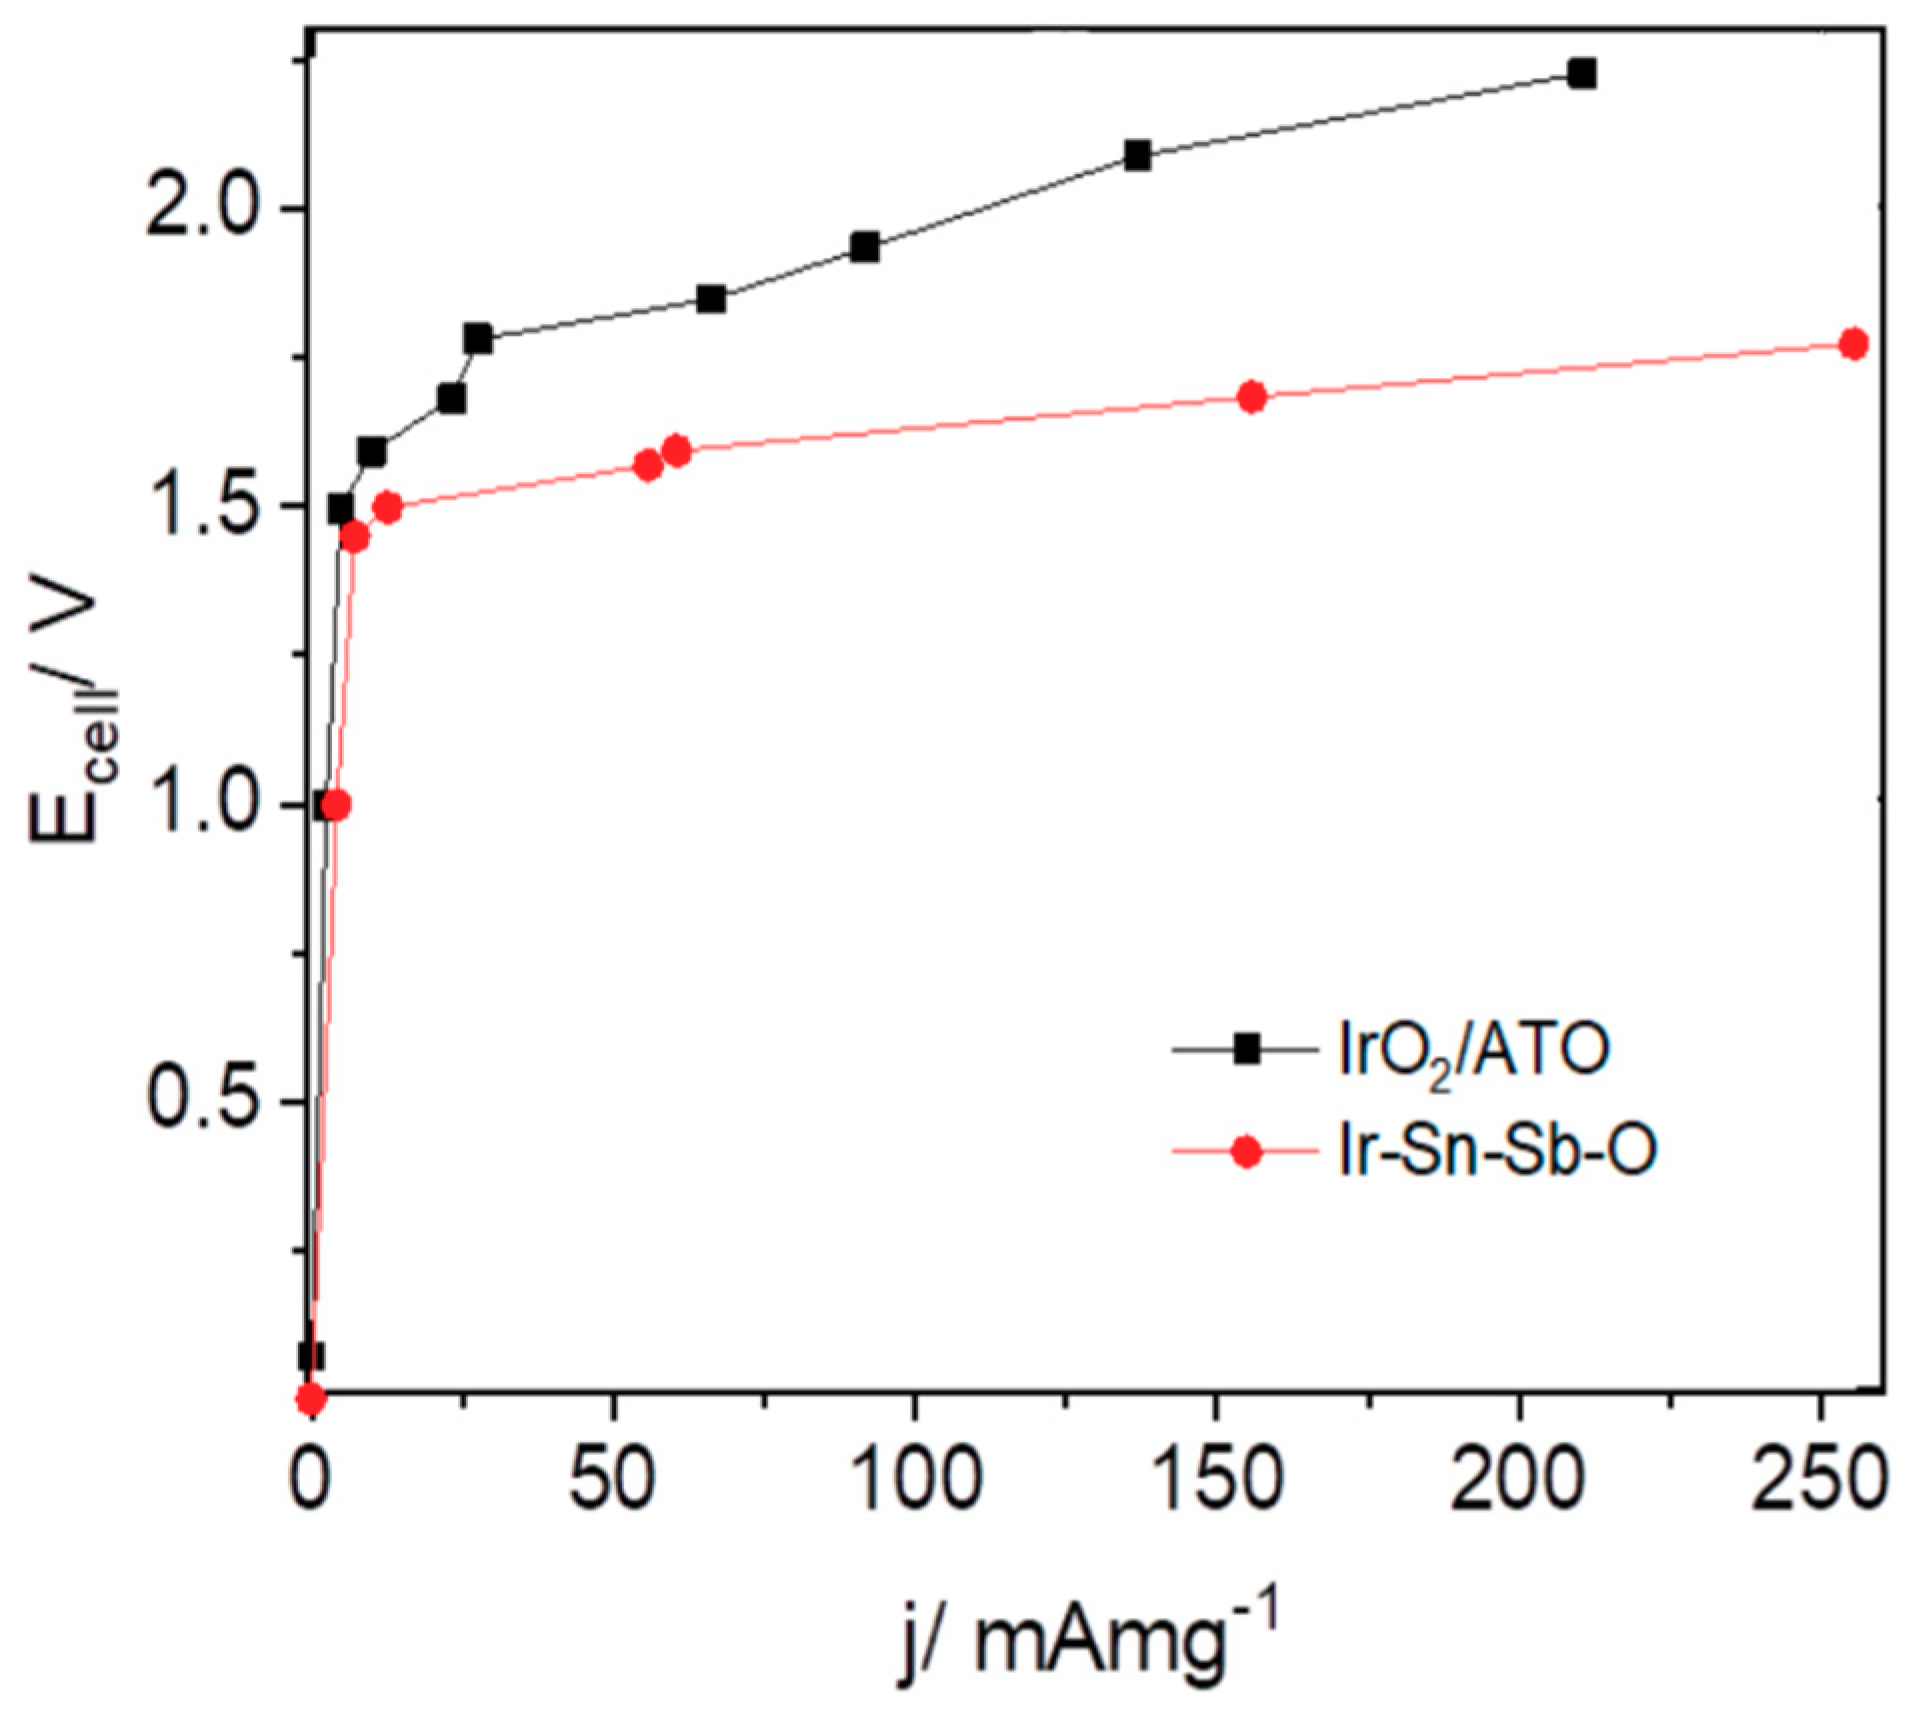
2.2.3. Electrolyser Performance

Polarization curves, after ohmic drop correction, for a single cell electrolyser using IrO2/ATO or Ir-Sn-Sb-O as catalyst are shown in Figure 10. Although the electrolysis starts at around 1.45 V in both assemblies, a fast increase in current density when potential increases can be observed when mixed oxide is used in the anode, while a slower electrolysis curve was obtained for IrO2/ATO. As a consequence, at 1.75 V the Ir-Sn-Sb-O assembled electrolyser reaches a current value of 254 mA mg−1 against only 13.7 mA mg−1 obtained when the supported IrO2 catalyst was used. These current density values are equivalent to oxygen volumetric flows of 5.77 mL min−1 and 0.78 mL min−1 respectively as estimated from Faraday’s Law [52]. Assuming a quasi-linear behavior, the slope of the polarization curves also implies that the required overpotential to increase the current density by one order of magnitude (from 20 to 200 mA mg−1) is 3.3 times higher for the IrO2/ATO mixture than for Ir-Sn-Sb-O when used as anode catalysts in a single cell. The internal resistance calculated from the slopes of the curves E/j shown in Figure 10 correspond to 5.2 Ω cm2 and 2.4 Ω cm2 for IrO2/ATO and Ir-Sn-Sb-O respectively; these values are consistent with the global charge transfer resistance that can be obtained from EIS spectra at 1.7 V (inserts in Figure 9).
Additionally, the onset potential for Ir-Sn-Sb-O is similar to some values reported in the literature, even though the experimental conditions used are not equivalent. Marshall et al. [7] have reported an EOER close to 1.45 V, with current density close to 1 mA cm−2 at 1.5 V for Ir0.5Sn0.5O2 mixtures. Siracusano et al. [8], reported a similar onset potential for OER in acidic media, close to 1.45 V, in a single cell for unsupported catalyst Ir0.7Ru0.3Ox. On the other hand, a current density value of 254 mA mg−1 was registered at 1.75 V for Ir-Sn-Sb-O as catalyst anode in the single cell electrolyser. Here, it is important to mention that a low catalyst load was used (0.5 mg cm−2) in the anode. Thus, a small current density was obtained in this study as compared with those values, >1 A cm−2, reported in the literature for most IrO2-based catalysts and at higher catalyst loads, in current PEM water electrolysis systems [7,53].
Therefore, the single cell electrolyser results shown here suggest that Ir-Sn-Sb-O can be considered as a potential anodic electrocatalyst in water electrolysis.

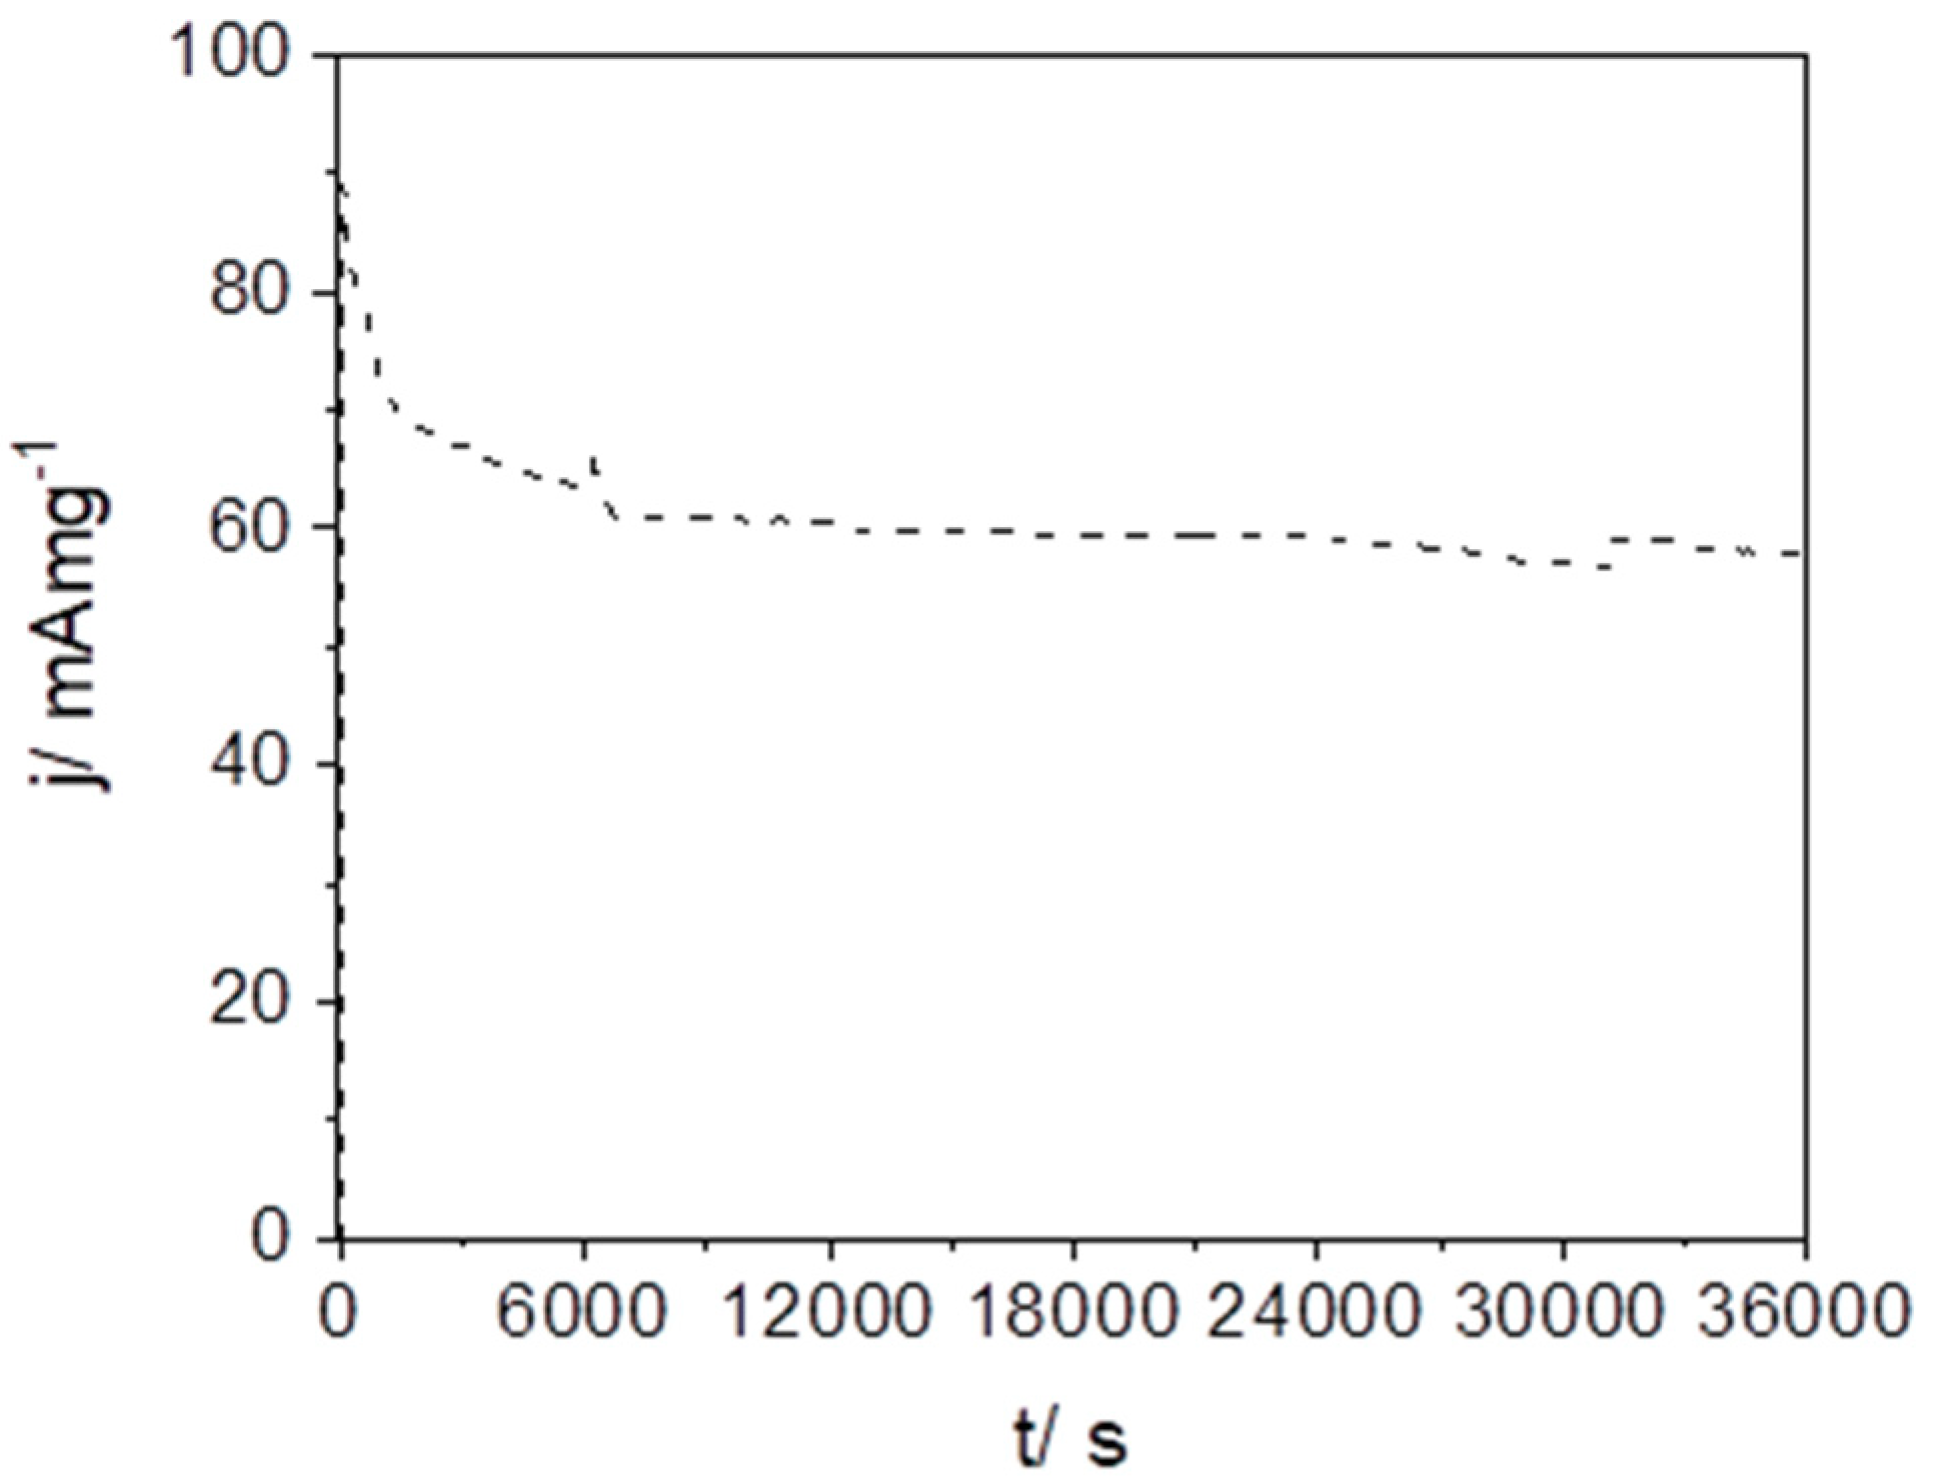
2.2.4. Chronoamperometry

A first evidence of the stability test for Ir-Sn-Sb-O was performed by applying a constant potential of 1.8 V during 10 h. The chronoamperometric results are shown in Figure 11. After the initial abrupt increase in current density, a rapid drop is observed until a relative stabilization is reached at about 40 min and at a current density value of 70 mA mg−1. The current value remains practically constant through the testing period, reaching a final value of 64 mA mg−1 in 600 min. A current drop of only 10% of the initial steady state value was obtained at the end of the experiment. This is evidence that the catalyst presents good stability under the experimental conditions employed.
Several authors have performed a similar stability evaluation using chronopotentiometry as reported in this work but longer periods greater than 100 h have been used. For instance, Yu et al. [54] reported an increase in the potential from 1.97 V to 2.10 V in a period of 250 h, when a current density of 1.8 A cm−2 was imposed on a PEM electrolyser with a MEA area of 28 cm2 and a Ir-based catalyst with a catalytic loading of 0.04 mg cm−2 was used as anode. Siracusano et al. [55] reported chronopotentiometry as a durability test for 1000 h at 3 A cm−2 for a IrRuOx catalyst in a single cell electrolyser. A significant increase in the cell overpotential at the applied current was not observed. Although the chronoamperometric results obtained for Ir-Sn-Sb-O may be considered as first evidence of the stability of the electrocatalyst in acidic media, corroboration of the stability properties under higher current densities and for longer periods is deserved.

3. Materials and Methods

3.1. Mixed Oxide Synthesis

The catalysts for the oxygen evolution reaction were prepared using conventional thermal decomposition with the precursors H2IrCl6, SnCl4·5H2O and SbCl3 (Aldrich, St. Louis, MO, USA). The metal precursor proportions used for the synthesis corresponded to (1) 40 at.% Ir, 57 at.% Sn and 3 at.% Sb for Ir-Sn-Sb-O synthesis, (2) 100 at.% Ir for IrO2 synthesis and (3) 95 at.% Sn and 5 at.% Sb for ATO. The synthesis procedure used has been previously reported [39]. In brief, 50 mL of a 0.25 M ethanolic solution was prepared considering the atomic percentages of the precursor salts previously mentioned. The solution was placed in a flask, heated at 50 °C (using a mineral oil bath) and stirred under a N2 atmosphere for 2 h. The ethanol was evaporated at 80 °C for 2 h in a drying oven. The precursor was then calcined at 450 °C for 0.5 h under air flux in a tube furnace 21,100 Barnstead (Thermo Fisher Scientific, Waltham, MA, USA) to obtain the final oxide. A quartz tube was used as container. The obtained catalyst material was washed three times with hot water and later once with methanol. Finally, the obtained powder was oven dried at 80 °C.

3.2. Physicochemical Characterization

The electrical resistivity, ρ, four points measurements were performed using an 4338B miliohmeter (Agilent, St. Clara CA, USA) at room temperature. In order to control the pressure of powder compacting, a stainless steel home-made cylinder-piston system was used. The resistivity measurements were obtained by compressing the powders using a 4386 mechanical press (Carver Inc., Wabash, IN, USA) at pressures from 0 to 200 psi. The electrical conductivity (σ) was calculated from the equation σ = 1 / ρ = L / ( R A ) , where L/A corresponds to the geometrical correction factor of the measurement system.
Scanning electron microscopy images were acquired using an JSEM 7401F microscope (JEOL, Tokyo, Japan), with a field emission gun at an accelerating voltage of 30 kV. Transmission electron microscopy was performed with a JEM-2200FS instrument (JEOL, Tokyo, Japan) with a field emission gun at an accelerating voltage of 200 kV, and the microscopic atomic composition of the materials was measured using an energy dispersive analyzer coupled with TEM.
X-ray diffraction analysis was performed using an Xpert PRO diffractometer (Malvert Panalytical, Almedo, The Netherlands) with an X´Celerator detector and Cu Kα radiation. Temperature programmed reduction was conducted using a ChemiSorb 2720 instrument (Micromeritics, Norcross, GA, USA) through the ChemiSoft TPx software. A temperature scan from 25 °C to 850 °C was employed with a heating rate of 10 °C min−1 under a flux of 30 mL min−1 of 10% H2/Ar gas mixture. Prior to the analysis, the samples were dried for 20 min at 150 °C under N2 flux.

3.3. Membrane Electrode Assembly

Membrane electrode assemblies (MEAs) were prepared through a method previously reported [36,38,56]. A Nafion 117 membrane (Aldrich, St. Louis, MO, USA) was used as solid polymer electrolyte. Catalytic inks were prepared and deposited over the Nafion membrane using a sprayer. Later, the MEA was hot pressed using a 4386 mechanical press (Carver Inc., Wabash, IN, USA) at 200 psi and 80 °C for 30 s. For the cathode, the catalytic ink consisted of a mixture of ethanol, Nafion® perfluorinated resin solution, 5 wt. % in lower aliphatic alcohols and water (Aldrich) and 5 wt.% Pt/C catalyst (Premetek, Cherry Hill, NJ, USA) to obtain a final platinum load of 0.2 mg cm−2. At the anode, the ink was composed of synthesized Ir-Sn-Sb-O or a mechanical mixture of IrO2/ATO (40 at.% of IrO2) and 10 wt.% of Nafion solution dispersed in ethanol. For both catalysts, the final load was 2.6 mg cm−2, equivalent to 0.5 mg cm−2 of Ir metal. The electrodes were previously activated at 2 V and 80 °C for 2 h.

3.4. Single Cell Electrochemistry

The electrocatalytic activities of Ir-Sn-Sb-O and the mechanical mixture of IrO2/ATO were evaluated in single cell PEMWE with an MEA active area of 4 cm2. The cell included two monopolar plates made of titanium with a parallel flow configuration. Two sintered titanium plates of 70% average porosity were employed as diffusors and two stainless steel plates were used as end plates. All single cell tests were performed using a flow rate of water of 7 mL min−1 at 70 °C using a peristaltic pump (WPI, Sarasota, FL, USA).
The electrochemical properties of the catalysts were evaluated using cyclic voltammetry (CV) and electrochemical impedance spectroscopy (EIS) in the single cell. Ir-Sn-Sb-O or IrO2/ATO catalyst was used as anode and Pt/C catalyst as cathode. The electrodes were prepared as described above. At the cathode a carbon mesh was employed as gas diffusor. A potential scan rate of 100 mV s−1 was used for all CV tests in a potential window from 1 to 1.8 V before and after polarization curves. The EIS measurements were conducted in a frequency region from 105 to 1 Hz, in a potential range between 1.5 to 1.8 V for both assemblies. A sinusoidal potential perturbation of 5 mV amplitude was employed. The polarization curves were obtained using chronopotentiometry (CP) measurements and were conducted within a current density range from 0 mA mg−1 to 300 mA mg−1 for both catalysts. The time of the potential stabilization was 1 min. Open circuit EIS was measured before and after polarization curves were collected. All electrochemical tests were performed using a Reference 600 potentiostat/galvanostat (Gamry, Warminster, PA, USA). The operation temperature in the electrolytic cell was maintained at 70 °C using a MD-BASIS thermostatic bath (Julabo, Seelbach, Germany).

4. Conclusions

A mixed oxide material based on Ir, Sn and Sb with both electrocatalyst and support characteristics for OER was synthesized using the one pot method, by simple thermal decomposition of metallic salts. The physicochemical properties and electrochemical activity of the Ir-Sn-Sb-O material was compared with an equivalent IrO2 catalyst supported on ATO. The analyses of the Ir-Sn-Sb-O indicate that the obtained catalyst is a heterogeneous mixture of nano-particled oxides of Ir, Sn and Sb, with small particles (~6 nm) of IrO2 and IrOx and bigger particles (>50 nm) of Sb doped SnO2. The analytical results also confirmed the presence of metallic Ir in the synthesized catalyst. The Ir-Sn-Sb-O presented a higher electrical conductivity than the IrO2/ATO, meaning an improved electronic transport through the mixed oxide material. The results obtained from CV, EIS and single cell performance are consistent with a better electroactivity of Ir-Sn-Sb-O in respect to IrO2/ATO for oxygen evolution reaction. The stability of the Ir-Sn-Sb-O catalyst during OER as evaluated using chronoamperometry over a few hours indicates a non-significant electrolysis current drop, suggesting, in a first instance, that the mixed oxide is a stable material.
The improved catalytic performance of the mixed oxide can be attributed to a possible synergistic effect between iridium dioxide, amorphous iridium oxide and ATO. It is possible that the presence of multiple iridium oxide species and their interaction with doped tin oxide favors the overlapping of inner d-orbitals of Ir, thus increasing the electron conduction of the mixed oxide [57]. However, the need for in-depth kinetics and catalysis studies in relation to the structure are suggested to elucidate the mechanism details of OER on this kind of material. It is also mandatory to optimize and perform benchmark electrolysis experiments in order to adequately compare the electrocatalytic properties of the obtained Ir-Sb-Sn-O material with those of “state of the art” on OER catalysts.
According to the properties of Ir-Sn-Sb-O reported in this work, it is suggested that this material synthesized in a single step is a promising anodic catalyst for SPEWE.

Author Contributions

Conceptualization, N.J.P.-V. and S.M.D.-T.; formal analysis, N.J.P.-V., V.H.C.-M. and S.M.D.-T.; funding acquisition, S.M.D.-T.; investigation, N.J.P.-V., I.L.E.-G., J.R.F.-H. and S.M.D.-T.; methodology, N.J.P.-V., V.H.C.-M., I.L.E.-G., J.R.F.-H., M.G.-V. and S.M.D.-T.; project administration, S.M.D.-T.; supervision, S.M.D.-T.; validation, N.J.P.-V.; writing—original draft, N.J.P.-V. and S.M.D.-T.; writing—review and editing, N.J.P.-V., M.G.-V. and S.M.D.-T. All authors have read and agreed to the published version of the manuscript.

Funding

This research received no external funding.

Acknowledgments

The authors are thankful to Eng. Miguel J. Meléndez, M. Sc. Carlos E. Ornelas M. Sc. Karla Campos, Eng. Wilber Antunez and M. Sc. Ernesto Guerrero for their contributions to the TEM, SEM and XRD results. Special acknowledgements are given to Laboratorio Nacional de Nanotecnología in Centro de Investigación en Materiales Avanzados S. C. for their support in the use of the facilities. Particular gratitude goes to Ana I. Peña of Laboratorio Nacional de Investigación en Nanociencias y Nanotecnología in Instituto Potosino de Investigación Científica y Tecnológica. N.J. Pérez thanks CONACyT for a graduate fellowship.

Conflicts of Interest

The authors declare no conflicts of interest.

References

  1. Chaubey, R.; Sahu, S.; James, O.; Maity, S. A review on development of industrial processes and emerging techniques for production of hydrogen from renewable and sustainable sources. Renew. Sustain. Energy Rev. 2013, 23, 443–462. [Google Scholar] [CrossRef]
  2. Azwar, M.Y.; Hussain, M.A.; Abdul-Wahab, A.K. Development of biohydrogen production by photobiological, fermentation and electrochemical processes: A review. Renew. Sustain. Energy Rev. 2014, 31, 158–173. [Google Scholar] [CrossRef]
  3. Stiller, C.; Hochrinner, H. Use of Conventional and Green Hydrogen in the Chemical Industry. In Hydrogen and Fuel Cell; Töpler, J., Lehmann, J., Eds.; Springer: Berlin/Heidelberg, Germany, 2016; pp. 173–186. ISBN 978-3-662-44971-4. [Google Scholar]
  4. Alves, V.A.; da Silva, L.A.; Boodts, J.F.C.; Trasatti, S. Kinetics and mechanism of oxygen evolution on IrO2-based electrodes containing Ti and Ce acidic solutions. Electrochim. Acta 1994, 39, 1585–1589. [Google Scholar] [CrossRef]
  5. Abreu-Sepulveda, M.; Trinh, P.; Malkhandi, S.; Narayanan, S.R.; Jorné, J.; Quesnel, D.J.; Postonr, J.A., Jr.; Manivannan, A. Investigation of Oxygen Evolution Reaction at LaRuO3, La3.5Ru4O13, and La2RuO5. Electrochim. Acta 2015, 180, 401–408. [Google Scholar] [CrossRef] [Green Version]
  6. Giordano, L.; Han, B.; Risch, M.; Hong, W.T.; Rao, R.R.; Stoerzinger, K.A.; Shao-Horn, Y. pH dependence of OER activity of oxides: Current and future perspectives. Catal. Today 2016, 262, 2–10. [Google Scholar] [CrossRef]
  7. Carmo, M.; Fritz, D.L.; Mergel, J.; Stolten, D. A comprehensive review on PEM water electrolysis. Int. J. Hydrogen Energy 2013, 38, 4901–4934. [Google Scholar] [CrossRef]
  8. Millet, P.; Ngameni, R.; Grigoriev, S.A.; Mbemba, N.; Brisset, F.; Ranjbari, A.; Etiévant, C. PEM water electrolyzers: From electrocatalysis to stack development. Int. J. Hydrogen Energy 2010, 35, 5043–5052. [Google Scholar] [CrossRef]
  9. Agbli, K.S.; Péra, M.C.; Hissel, D.; Rallières, O.; Turpin, C.; Doumbia, I. Multiphysics simulation of a PEM electrolyser: Energetic Macroscopic Representation approach. Int. J. Hydrogen Energy 2011, 36, 1382–1398. [Google Scholar] [CrossRef]
  10. Chandesris, M.; Médeau, V.; Guillet, N.; Chelghoum, S.; Thoby, D.; Fouda-Onana, F. Membrane degradation in PEM water electrolyzer: Numerical modeling and experimental evidence of the influence of temperature and current density. Int. J. Hydrogen Energy 2015, 40, 1353–1366. [Google Scholar] [CrossRef]
  11. Lee, J.; Jeong, B.; Ocon, J.D. Oxygen electrocatalysis in chemical energy conversion and storage technologies. Curr. Appl. Phys. 2013, 13, 309–321. [Google Scholar] [CrossRef]
  12. Lasia, A. Mechanism and kinetics of the hydrogen evolution reaction. Int. J. Hydrogen Energy 2019, 44, 19484–19518. [Google Scholar] [CrossRef]
  13. Reier, T.; Oezaslan, M.; Strasser, P. Electrocatalytic Oxygen Evolution Reaction (OER) on Ru, Ir, and Pt Catalysts: A Comparative Study of Nanoparticles and Bulk Materials. ACS Catal. 2012, 2, 1765–1772. [Google Scholar] [CrossRef]
  14. Jamesh, M.-I.; Sun, X. Recent progress on earth abundant electrocatalysts for oxygen evolution reaction (OER) in alkaline medium to achieve efficient water splitting—A review. J. Power Sources 2018, 400, 31–68. [Google Scholar] [CrossRef]
  15. Ahmed, J.; Mao, Y. Ultrafine Iridium Oxide Nanorods Synthesized by Molten Salt Method toward Electrocatalytic Oxygen and Hydrogen Evolution Reactions. Electrochim. Acta 2016, 212, 686–693. [Google Scholar] [CrossRef] [Green Version]
  16. Rubel, M.; Haasch, R.; Mrozek, P.; Wieckowski, A.; De Pauli, C.; Trasatti, S. Characterization of IrO2-SnO2 thin layers by electron and ion spectroscopies. Vacuum 1994, 45, 423–427. [Google Scholar] [CrossRef]
  17. Ardizzone, S.; Fregonara, G.; Trasatti, S. “Inner” and “outer” active surface of RuO2 electrodes. Electrochim. Acta 1990, 35, 263–267. [Google Scholar] [CrossRef]
  18. Audichon, T.; Mayousse, E.; Morisset, S.; Morais, C.; Comminges, C.; Napporn, T.W.; Kokoh, K.B. Electroactivity of RuO2–IrO2 mixed nanocatalysts toward the oxygen evolution reaction in a water electrolyzer supplied by a solar profile. Int. J. Hydrogen Energy 2014, 39, 16785–16796. [Google Scholar] [CrossRef]
  19. Cherevko, S.; Geiger, S.; Kasian, O.; Kulyk, N.; Grote, J.-P.; Savan, A.; Shrestha, B.R.; Merzlikin, S.; Breitbach, B.; Ludwig, A.; et al. Oxygen and hydrogen evolution reactions on Ru, RuO2, Ir, and IrO2 thin film electrodes in acidic and alkaline electrolytes: A comparative study on activity and stability. Catal. Today 2016, 262, 170–180. [Google Scholar] [CrossRef]
  20. Alonso-Vante, N. Photocatalysis an enhancer of electrocatalytic process. Curr. Opin. Electrochem. 2018, 9, 114–120. [Google Scholar] [CrossRef]
  21. Ávila-Vázquez, V.; Cruz, J.C.; Galván-Valencia, M.; Ledesma-García, J.; Arriaga, L.G.; Guzmán, C.; Durón-Torres, S.M. Electrochemical study of Sb-doped SnO2 supports on the oxygen evolution reaction: Effect of synthesis annealing time. Int. J. Electrochem. Sci. 2013, 8, 10586–10600. [Google Scholar]
  22. Dimitrov, M.; Guncheva, M.; Zhiryakova, D.; Lazarova, T.; Lalev, G.; Tsoncheva, T. Nanostructured tin dioxide—A promising multipurpose support material for catalytic and biocatalytic applications. Chem. Eng. J. 2014, 252, 55–63. [Google Scholar] [CrossRef]
  23. Du, C.; Chen, M.; Cao, X.; Yin, G.; Shi, P. A novel CNT-SnO2 core–sheath nanocomposite as a stabilizing support for catalysts of proton exchange membrane fuel cells. Electrochem. Commun. 2009, 11, 496–498. [Google Scholar] [CrossRef]
  24. Jia, Y.; Jiang, K.; Wang, H.; Yao, X. The Role of Defect Sites in Nanomaterials for Electrocatalytic Energy Conversion. Chem 2019, 5, 1371–1397. [Google Scholar] [CrossRef]
  25. Keeler, A.J.; Salazar-Banda, G.R.; Russell, A.E. Mechanistic insights into electrocatalytic reactions provided by SERS. Curr. Opin. Electrochem. 2019, 17, 90–96. [Google Scholar] [CrossRef]
  26. Hagemeyer, A.; Hogan, Z.; Schlichter, M.; Smaka, B.; Streukens, G.; Turner, H.; Volpe, A.; Weinberg, H.; Yaccato, K. High surface area tin oxide. Appl. Catal. A Gen. 2007, 317, 139–148. [Google Scholar] [CrossRef]
  27. Murakami, Y.; Ohkawauchi, H.; Ito, M.; Yahikozawa, K.; Takasu, Y. Preparations of ultrafine IrO2-SnO2 binary oxide particles by a sol-gel process. Electrochim. Acta 1994, 39, 2551–2554. [Google Scholar] [CrossRef]
  28. Kadakia, K.; Datta, M.K.; Velikokhatnyi, O.I.; Jampani, P.H.; Kumta, P.N. Fluorine doped (Ir,Sn,Nb)O2 anode electro-catalyst for oxygen evolution via PEM based water electrolysis. Int. J. Hydrogen Energy 2014, 39, 664–674. [Google Scholar] [CrossRef]
  29. Baker, P.G.L.; Sanderson, R.D.; Crouch, A.M. Sol–gel preparation and characterisation of mixed metal tin oxide thin films. Thin Solid Films 2007, 515, 6691–6697. [Google Scholar] [CrossRef]
  30. Balko, E.N.; Nguyen, P.H. Iridium-tin mixed oxide anode coatings. J. Appl. Electrochem. 1991, 21, 678–682. [Google Scholar] [CrossRef]
  31. Biesinger, M.C.; Payne, B.P.; Lau, L.W.M.; Gerson, A.; Smart, R.S.C. X-ray photoelectron spectroscopic chemical state quantification of mixed nickel metal, oxide and hydroxide systems. Surf. Interface Anal. 2009, 41, 324–332. [Google Scholar] [CrossRef]
  32. Browne, M.P.; Nolan, H.; Duesberg, G.S.; Colavita, P.E.; Lyons, M.E.G. Low-Overpotential High-Activity Mixed Manganese and Ruthenium Oxide Electrocatalysts for Oxygen Evolution Reaction in Alkaline Media. ACS Catal. 2016, 6, 2408–2415. [Google Scholar] [CrossRef]
  33. De Pauli, C.P.; Trasatti, S. Electrochemical surface characterization of IrO2 + SnO2 mixed oxide electrocatalysts. J. Electroanal. Chem. 1995, 396, 161–168. [Google Scholar] [CrossRef]
  34. Pintar, A.; Batista, J.; Hočevar, S. Redox Behavior of (CuO)0.15(CeO2)0.85 Mixed Oxide Catalyst Prepared by Sol-Gel Peroxide Method. Acta Chim. Slov. 2005, 52, 44–52. [Google Scholar]
  35. Tan, F.K.; Hassan, J.; Wahab, Z.A.; Azis, R.S. Electrical conductivity and dielectric behaviour of manganese and vanadium mixed oxide prepared by conventional solid state method. Eng. Sci. Technol. 2016, 19, 2081–2087. [Google Scholar] [CrossRef] [Green Version]
  36. Marshall, A.; Tsypkin, M.; Boørresen, B.; Hagen, G.; Tunold, R. Nanocrystalline IrxSn(1-X)O2 electrocatalysts for oxygen evolution in water electrolysis with polymer electrolyte—Effect of heat treatment. J. New Mater. Electrochem. Syst. 2004, 7, 197–204. [Google Scholar]
  37. Marshall, A.; Børresen, B.; Hagen, G.; Tsypkin, M.; Tunold, R. Electrochemical characterisation of IrxSn1−xO2 powders as oxygen evolution electrocatalysts. Electrochim. Acta 2006, 51, 3161–3167. [Google Scholar] [CrossRef]
  38. Marshall, A.; Børresen, B.; Hagen, G.; Tsypkin, M.; Tunold, R. Hydrogen production by advanced proton exchange membrane (PEM) water electrolysers—Reduced energy consumption by improved electrocatalysis. Energy 2007, 32, 431–436. [Google Scholar] [CrossRef]
  39. Pérez-Viramontes, N.J.; Escalante-García, I.L.; Guzmán-Martínez, C.; Galván-Valencia, M.; Durón-Torres, S.M. Electrochemical study of Ir–Sn–Sb–O materials as catalyst-supports for the oxygen evolution reaction. J. Appl. Electrochem. 2015, 45, 1165–1173. [Google Scholar] [CrossRef]
  40. Oh, H.-S.; Nong, H.N.; Strasser, P. Preparation of Mesoporous Sb-, F-, and In-Doped SnO2 Bulk Powder with High Surface Area for Use as Catalyst Supports in Electrolytic Cells. Adv. Funct. Mater. 2015, 25, 1074–1081. [Google Scholar] [CrossRef]
  41. Marshall, A.; Borresen, B.; Hagen, G.; Tsypkin, M.; Tunold, R. Preparation and characterisation of nanocrystalline IrSnO electrocatalytic powders. Mater. Chem. Phys. 2005, 94, 226–232. [Google Scholar] [CrossRef]
  42. Ávila-Vázquez, V.; Galván-Valencia, M.; Ledesma-García, J.; Arriaga, L.G.; Collins-Martínez, V.H.; Guzmán-Martínez, C.; Escalante-Garcia, I.L.; Durón-Torres, S.M. Electrochemical performance of a Sb-doped SnO2 support synthesized by coprecipitation for oxygen reactions. J. Appl. Electrochem. 2015, 45, 1175–1185. [Google Scholar] [CrossRef]
  43. Puthiyapura, V.K.; Pasupathi, S.; Su, H.; Liu, X.; Pollet, B.; Scott, K. Investigation of supported IrO2 as electrocatalyst for the oxygen evolution reaction in proton exchange membrane water electrolyser. Int. J. Hydrogen Energy 2014, 39, 1905–1913. [Google Scholar] [CrossRef]
  44. Pfeifer, V.; Jones, T.E.; Velasco Vélez, J.J.; Massué, C.; Greiner, M.T.; Arrigo, R.; Teschner, D.; Girgsdies, F.; Scherzer, M.; Allan, J.; et al. The electronic structure of iridium oxide electrodes active in water splitting. Phys. Chem. Chem. Phys. 2016, 18, 2292–2296. [Google Scholar] [CrossRef] [PubMed] [Green Version]
  45. Hughes, V.B.; McNicol, B.D. Evaluation of semiconducting tin oxide as an electrocatalyst support. J. Chem. Soc. Faraday Trans. 1 Phys. Chem. Condens. Phases 1979, 75, 2165. [Google Scholar] [CrossRef]
  46. Xiang, C.; Papadantonakis, K.M.; Lewis, N.S. Principles and implementations of electrolysis systems for water splitting. Mater. Horiz. 2016, 3, 169–173. [Google Scholar] [CrossRef] [Green Version]
  47. Bessarabov, D.; Millet, P. PEM Water Electrolysis; Academic Press: London, UK, 2018; Volume 1, ISBN 9780128111468. [Google Scholar]
  48. Lasia, A. Electrochemical Impedance Spectroscopy and Its Applications; Springer-Verlag: New York, NY, USA, 2014; ISBN 978-1-4614-8932-0. [Google Scholar]
  49. Sunde, S.; Lervik, I.A.; Owe, L.-E.; Tsypkin, M. An impedance model for a porous intercalation electrode with mixed conductivity. J. Electrochem. Soc. 2009, 156, B927–B937. [Google Scholar] [CrossRef]
  50. Lettenmeier, P.; Kolb, S.; Sata, N.; Fallisch, A.; Zielke, L.; Thiele, S.; Gago, A.S.; Friedrich, K.A. Comprehensive investigation of novel pore-graded gas diffusion layers for high-performance and cost-effective proton exchange membrane electrolyzers. Energy Environ. Sci. 2017, 10, 2521–2533. [Google Scholar] [CrossRef] [Green Version]
  51. Hu, J.-M.; Zhang, J.-Q.; Cao, C.-N. Oxygen evolution reaction on IrO2-based DSA® type electrodes: Kinetics analysis of Tafel lines and EIS. Int. J. Hydrogen Energy 2004, 29, 791–797. [Google Scholar] [CrossRef]
  52. Yigit, T.; Selamet, O.F. Mathematical modeling and dynamic Simulink simulation of high-pressure PEM electrolyzer system. Int. J. Hydrogen Energy 2016, 41, 13901–13914. [Google Scholar] [CrossRef]
  53. Yu, H.; Danilovic, N.; Wang, Y.; Willis, W.; Poozhikunnath, A.; Bonville, L.; Capuano, C.; Ayers, K.; Maric, R. Nano-size IrOx catalyst of high activity and stability in PEM water electrolyzer with ultra-low iridium loading. Appl. Catal. B Environ. 2018, 239, 133–146. [Google Scholar] [CrossRef]
  54. Buttler, A.; Spliethoff, H. Current status of water electrolysis for energy storage, grid balancing and sector coupling via power-to-gas and power-to-liquids: A review. Renew. Sustain. Energy Rev. 2018, 82, 2440–2454. [Google Scholar] [CrossRef]
  55. Siracusano, S.; Baglio, V.; Van Dijk, N.; Merlo, L.; Aricò, A.S. Enhanced performance and durability of low catalyst loading PEM water electrolyser based on a short-side chain perfluorosulfonic ionomer. Appl. Energy 2017, 192, 477–489. [Google Scholar] [CrossRef]
  56. Ardizzone, S.; Bianchi, C.L.; Cappelletti, G.; Ionita, M.; Minguzzi, A.; Rondinini, S.; Vertova, A. Composite ternary SnO2–IrO2–Ta2O5 oxide electrocatalysts. J. Electroanal. Chem. 2006, 589, 160–166. [Google Scholar] [CrossRef]
  57. Trasatti, S.; Buzzanca, G. Ruthenium dioxide—New interesting electrode material-solid state structure and electrochemical behaviour. J. Electroanal. Chem. 1971, 29, A1. [Google Scholar] [CrossRef]
Figure 1. SEM micrographs of ATO: (a) 50,000× and (b) 200,000×. IrO2: (c) 50,000× and (d) 200,000×. Ir-Sn-Sb-O: (e) 50,000× and (f) 200,000×.
Catalysts 10 00524 g001
Figure 2. TEM images of ATO (a) STEM bright field mode, (b) STEM dark field image, in the insert: particle size distribution, (c,d) high resolution transmission electron microscopy (HRTEM) images of nanoparticles.
Catalysts 10 00524 g002
Figure 3. TEM images of IrO2 (a) STEM bright field mode, (b) STEM dark field image, insert: particle size distribution, (c,d) HRTEM images of nanoparticles.
Catalysts 10 00524 g003
Figure 4. TEM images of Ir-Sn-Sb-O (a) STEM bright field mode, (b) STEM dark field image, insert: particle size distribution (c) TEM micrographs of nanoparticles, insert: selected areas for EDS analysis, (d) HRTEM images of nanoparticles, show the d spacing lattice.
Catalysts 10 00524 g004
Figure 5. X-ray diffraction patterns of (a) ATO, (b) IrO2 and (c) Ir-Sn-Sb-O.
Catalysts 10 00524 g005
Figure 6. TPR profile of (a) commercial SnO2 (—) and ATO (- - -) and (b) ATO (- - -), IrO2 (- ∙ ∙) and Ir-Sn-Sb-O (∙ ∙ ∙) at 10 °C min−1 heating rate.
Catalysts 10 00524 g006
Figure 7. Cyclic voltammetry of IrO2/ATO (- - -) and Ir-Sn-Sb-O (___) MEAs. (a) Before and (b) after polarization. 70 °C and 7 mL min−1, ν = 100 mV s−1.
Catalysts 10 00524 g007
Figure 8. Electrochemical impedance spectroscopy (EIS) curves of IrO2/ATO (∎) and Ir-Sn-Sb-O (), (a) Nyquist plot, insert: proposed equivalent circuit. (b) Bode plots. The continuous lines depict the complex nonlinear least squares (CNLS) simulation curves from the equivalent circuit. The spectra were obtained at 1.6 V, 70 °C and a water flux of 7 mL min−1.
Catalysts 10 00524 g008
Figure 9. Electrochemical impedances spectra of (a) IrO2/ATO and (b) Ir-Sn-Sb-O.
Catalysts 10 00524 g009
Figure 10. Polarization curves of IrO2/ATO (■) and Ir-Sn-Sb-O () at 70 °C and 7 mL min−1 of water.
Catalysts 10 00524 g010
Figure 11. Stability study of Ir-Sn-Sb-O catalyst in single cell at 1.8 V and 60 °C for a period of 10 h.
Catalysts 10 00524 g011
Table 1. Electrical conductivity of the synthesized materials at different pressures values.
P/psiIr-Sn-Sb-OIrO2ATO a
σ/S m−1
011,163 ± 715252 ± 163.6 ± 0.5
5087,447 ± 16,17922,191 ± 16816.4 ± 0.5
100122,620 ± 668842,788 ± 2609175 ± 34
150157,981 ± 15,41887,236 ± 6618308 ± 48
200270,037 ± 24,019145,357 ± 23,769559 ± 52
a: antimony doped tin oxide.
Table 2. EDS analysis for three selected areas for ATO, IrO2 and Ir-Sn-Sb-O materials.
CatalystAreaIrOSnSbCl
Element/at.%
ATO1-----53.2844.552.17-----
2-----66.2331.132.64-----
3-----69.4530.550-----
IrO2122.7471.24----------6.02
245.152.17----------2.73
317.6579.86----------2.49
Ir-Sn-Sb-O1074.1722.683.150
226.7257.346.877.41.67
339.1543.189.934.782.96
Table 3. Equivalent circuit parameters obtained from CNLS fitting.
CatalystL/HRHF/Ω cm2Rc/ Ω cm2CPEc/F cm−2Ra/Ω cm2CPEa/F cm−2
IrO2/ATO6.26 × 10−71.380.380.001814.160.0072
Ir-Sn-Sb-O1.03 × 10−61.910.130.00383.950.0120

