Article

Exploring the Factors Influencing AI Adoption Intentions in Higher Education: An Integrated Model of DOI, TOE, and TAM

1
Department of Computer Science, Philadelphia University, Amman 19392, Jordan
2
Department of Business Management, Istanbul Aydin University, Istanbul 34295, Türkiye
3
Department of Computer Science, Applied Science Private University, Amman 11931, Jordan
4
Department of E-Marketing and Social Media, Princess Sumaya University for Technology, Amman 11941, Jordan
*
Author to whom correspondence should be addressed.
Computers 2025, 14(6), 230; https://doi.org/10.3390/computers14060230
Submission received: 20 March 2025 / Revised: 31 May 2025 / Accepted: 31 May 2025 / Published: 11 June 2025

Abstract

:
This study investigates the primary technological and socio-environmental factors influencing the adoption intentions of AI-powered technology at the corporate level within higher education institutions. A conceptual model based on the Diffusion of Innovation Theory (DOI), the Technology–Organization–Environment (TOE), and the Technology Acceptance Model (TAM) combined framework were proposed and tested using data collected from 367 higher education students, faculty members, and employees. SPSS Amos 24 was used for CB-SEM to choose the best-fitting model, which proved more efficient than traditional multiple regression analysis to examine the relationships among the proposed constructs, ensuring model fit and statistical robustness. The findings reveal that Compatibility “C”, Complexity “CX”, User Interface “UX”, Perceived Ease of Use “PEOU”, User Satisfaction “US”, Performance Expectation “PE”, Artificial intelligence “AI” introducing new tools “AINT”, AI Strategic Alignment “AIS”, Availability of Resources “AVR”, Technological Support “TS”, and Facilitating Conditions “FC” significantly impact AI adoption intentions. At the same time, Competitive Pressure “COP” and Government Regulations “GOR” do not. Demographic factors, including major and years of experience, moderated these associations, and there were large differences across educational backgrounds and experience.

1. Introduction

The embrace of advanced digital methods has become essential to today’s business climate due to the constant demand for competition and efficiency. This has completely transformed the organization’s work [1]. Companies increasingly utilize AI technologies to enhance productivity, decision-making, and efficiency [2]. The ubiquitous application of AI in marketing, education, manufacturing, and finance has shown positive performance and productivity outcomes because it transcends human cognitive constraints [3]. AI technologies are swiftly growing in organizations, disrupting traditional business processes and entering areas where human talent once thrived [4]. AI can cover a range of skills, from speech recognition to problem-solving and learning, that mimic human cognition [5]. Machine learning techniques cannot effectively leverage AI, preventing organizations from extracting patterns and rules from extensive datasets. This limits organizations’ ability to improve operational efficiency and make well-informed decisions [6]. Integrating AI technologies into companies offers considerable opportunities for enhancing business value chains, decision-making assistance, knowledge management, forecast maintenance, customer support, and relationship management [7]. Despite rising investments in AI technologies, organizations frequently encounter challenges in achieving the desired results. These problems include constrained budgets, skill deficiencies, and a lack of awareness, all of which hinder the widespread integration of AI [8]. Accordingly, there is an increasing necessity to identify the key factors influencing the successful implementation of AI technologies on an organizational scale [9]. Artificial Intelligence (AI) systems have emerged as a vital element in ensuring organizational effectiveness and improving student experiences in the ever-changing world of higher education [10]. The study reveals the technical and socio-environmental factors influencing the corporate-level adoption of AI-based technologies in higher education. It builds an abstract framework anchored in the DOI “theory of Everett Rogers on how new technology or ideas spread across society” [11] and the TOE model, “a model that highlights technological, organizational, and environmental aspects that influence an organization’s technology adoption” [12]. The research also incorporates the Technology Acceptance Model (TAM) [13], which provides insight into users’ behavioral intentions by focusing on perceived usefulness and perceived ease of use as the main drivers of technology acceptance [14]. This research aims to gain a deep understanding of the intricate processes underlying the use of AI in higher education. The paper examines the challenges to the implementation of AI in higher education. It explores “C”, “CX”, “UX”, “PEOU”, “US”, “PE”, “AINT”, “AIS”, “AVR”, “TS”, “FC”, “COP”, and “GOR”. The research aims to uncover how these factors shape decision-making. It further evaluates the impact of age, gender, education, and experience. Understanding these interactions is crucial for AI adoption in higher education. The study provides insights into the complexities of AI adoption and aims to contribute to adoption strategies. It investigates the dynamics of AI adoption in higher education institutions and informs decision-making and planning for AI integration. Quantitative research employing a standardized questionnaire across three nations met the research objectives. “CB-SEM) was used in IBM SPSS AMOS version 24 to assess the associations of the study’s latent variables. It was chosen for theory testing and model validation, especially with the DOI, TOE, and TAM models [15,16]. CB-SEM is preferred for verifying a theoretically grounded model in this study compared to (PLS-SEM), which is utilized for exploratory or predictive research. As Byrne (2016) states, CB-SEM allows simultaneous evaluation of measurement and structural models, including measurement error and indirect effects [17]. Global model fit indices offer a thorough and confirmatory approach to assessing structural relationships. (MLE) was used to estimate the model. The model fit was assessed using recognized indices, including CFI, TLI, RMSEA, and χ2/df [18]. This analytical technique ensured the model’s dependability, validity, and accuracy in hypothesis testing accuracy.

2. Literature Review

2.1. Higher Education

In higher education, curiosity towards using AI is diminishing. Making AI available to higher education has become all the more exciting because it can completely change the way that people learn and teach. Numerous studies have emphasized the profound impact on higher education, highlighting the importance of recognizing the drivers that drive AI use in the classroom. This question of AI in higher education is becoming more intriguing because it has the potential to reshape the way people teach and learn altogether. Greenhalgh et al. emphasized the need to understand the diffusion of innovations within service organizations, particularly to pay attention to parameters such as communication channels and message delivery speed. This aligns with the research question of whether service organizations will use AI-based technologies [19]. Numerous studies have emphasized the profound influence AI has on higher education, underscoring the significance of comprehending the factors that affect the adoption of AI-based technologies in educational environments [20,21,22,23]. “C”, “CX”, “UX”, “PEOU”, “US”, “PE”, “AIS”, “AVR”, “COP”, “GR”, “TS”, and “FC” and demographic variables such as age, gender, education, and years of experience all contribute to the intricate web of factors that influence the decision to adopt AI-based technologies [24]. Research discoveries have proven that incorporating AI in higher education is impacted by factors such as perceived risk, facilitating conditions, and expected effort. These factors, in contrast, do impact individuals’ attitudes toward and intentions to utilize AI [25]. The likelihood of AI having a significant impact on higher education is highlighted in the literature, with expectations of considerable growth in AI implementation in the education sector [26]. As AI evolves, universities will need to adopt and leverage AI solutions for their educational activities. Recognizing the drivers of the use of AI in higher education and addressing the obstacles to its use are key to fully exploiting AI’s educational potential.

2.2. Artificial Intelligence

AI is increasingly entering the field of higher education teaching and learning. Numerous studies have focused on AI and educational environments, specifically on factors that impact the adoption of AI-based technology.
Several key factors have been recognized as influencing the intention to adopt AI-based technologies within higher education. These include “C”, “CX”, “UX”, “PEOU”, “US”, “PE”, “AIS”, “AVR”, “COP”, “GR”, “TS”, and “FC” [27]. Studies have highlighted AI’s transformative potential within educational spheres, where breakthroughs like unobtrusive brain–computer interfaces, coupled with AI, pave the way for pioneering pedagogical methods [28].

2.3. Compatibility

Rogers defined ‘compatibility’ as “the extent to which an innovation is consistent with the values, practices, and needs of potential adopters.” [11]. For AI-based technologies in higher education, alignment plays an important role in determining adoption strategies and institutional readiness [29]. AI solutions must adapt to prevailing educational methodologies and systems to become effective and widely adopted across educational facilities. The study underemphasizes compatibility as a crucial factor in adopting technological changes, such as cloud computing and e-commerce. These studies highlight that integrating new technologies with an organization’s existing systems and practices is crucial for organizations to effectively leverage and benefit from technological advancements [29,30]. Similarly, in the AI applications for higher education, AI-driven tools must fit the context, curriculum requirements, and pedagogical practices. This consistency is crucial in order to ensure that educators and students adopt and effectively use these tools. Incorporating AI into learning environments is connected to several variables, including personalization, usability, and interactivity [24,31]. All of these factors play a key role in leveraging AI technologies for the differing needs and preferences of students and teachers. Further, openness to experimentation and compatibility between AI solutions and institutional goals and objectives are essential to the fit that motivates them.
The successful implementation of AI in education, as highlighted by [32]. Studies have also explored compatibility in the deployment of AI in healthcare, HR, and e-learning settings. It stresses the importance of perceived compatibility with organizational goals, technological infrastructure, and user requirements [32,33]. Understanding factors influencing compatibility and addressing barriers to harmonization is key to making sure that AI technologies are used effectively across different organizational contexts. compatibility, in short, is an important factor in adopting AI technologies in universities and other fields. With AI solutions that are in sync with practices, values, and systems, organizations can make it easier for AI technologies to be used and integrated. resulting in increased efficiency, effectiveness, and creativity in educational processes. Therefore, we propose:
H1a: 
There is a significant impact of “C” on AI adoption intentions.

2.4. Complexity

The adoption of AI technologies in organizational contexts, such as higher education, is heavily dependent on their level of sophistication. In this context, ‘complexity’ refers to the perceived difficulty of using and implementing AI solutions in schools. Understanding the factors contributing to this complexity is key to the successful integration and maximization of AI technologies within higher education [23]. Research suggests that educational institutions struggle to implement AI technologies, which can negatively impact students’ learning experiences. Furthermore, applying AI for teaching, student support, and other administrative tasks presents challenges for these institutions and requires further research to address these issues [23]. The deployment and execution of AI systems face hurdles due to their complex nature and the varying needs of educational stakeholders. The complexity of technology is not the only factor influencing the adoption of AI-based technologies; human elements are equally important. ALTakhayneh et al. explored the psychological resistance of teachers to digital innovation, highlighting the importance of overcoming psychological barriers and fostering positive attitudes toward educational technology to facilitate the adoption process. Navigating the intricacies of AI adoption in educational settings necessitates overcoming resistance and cultivating a welcoming attitude towards AI technologies. Moreover, the successful integration of AI-based technologies in higher education depends on the interplay of complexity with other elements such as “C”, User Experience, and organizational preparedness. Addressing these multifaceted challenges and adopting strategies to enhance user acceptance and organizational support are crucial for educational institutions aiming to successfully navigate the complexities of AI adoption and unlock AI’s transformative power in teaching and learning. In summary, grasping and addressing the complexities associated with adopting AI-based technologies is vital for their successful incorporation and use in higher education. Recognizing these challenges and implementing strategies to overcome obstacles will enable educational institutions to refine the adoption process and utilize AI technologies to improve educational outcomes [34]. Therefore, we propose:
H1b: 
There is a significant impact of “CX” on AI adoption intentions.

2.5. User Experience

User Experience “UX” plays a key role in utilizing AI technologies, particularly in the higher education sector. UX encompasses the overall user experience, satisfaction, and interaction with AI platforms and applications. Understanding the factors that influence UX is vital for enhancing user adoption, engagement, and the implementation of AI in educational environments [35,36]. Many studies emphasize the importance of UI design that addresses the diverse needs and preferences of users, especially those with limited reading skills. Numerous studies have underscored the critical nature of usability, accessibility, and user-centered design principles in developing intuitive, engaging, and inclusive artificial intelligence “AI” applications [35].
By creating intuitive user interfaces that are responsive to users’ needs, colleges and universities can vastly improve the “UX” of AI technologies at the higher educational level. Furthermore, AI’s entrance into the healthcare space has reaffirmed UX’s role in fostering trust and acceptance among doctors and patients. Transparency, reliability, and ease of use all contribute to good user behavior and perceptions of AI in the medical environment [36]. With an emphasis on a transparent, trustworthy, and simple AI system design, healthcare providers can enhance UX and build user trust. The application of goal-setting theory in understanding user adoption intentions has been utilized for AI-enabled mobile applications. Researchers have delved into the impact of users’ internal states on their behavior and attitudes toward AI-powered mobile applications, considering AI technologies’ intelligent and anthropomorphic characteristics [37]. To design AI applications that resonate with user expectations and preferences, it is essential to grasp users’ perceptions of AI technology and its influence on their goal-setting behavior. Moreover, the UX of AI-driven systems, like mobile fitness apps, has been scrutinized from a UX perspective. Employing goal-setting theory, researchers have explored how users’ views on informational and emotional support influence their adoption and ongoing engagement with AI-powered applications [37]. Enhancing user engagement and satisfaction over the long term can be achieved by improving the UX of AI technologies with personalized and supportive elements. For higher education and other sectors to boost user acceptance and engagement, prioritizing UX in designing and deploying AI-based technologies is imperative. By concentrating on usability, accessibility, transparency, and personalization, organizations can refine the UX of AI systems, leading to enriched user experiences and heightened adoption and use of AI technologies. Therefore, we propose:
H1c: 
There is a significant impact of “UX” on AI adoption intentions.

2.6. Perceived Ease of Use

(PEOU) is a fundamental construct within the Technology Acceptance Model (TAM), defined as “the degree to which a person believes that using a particular system would be free from effort” [14]. Perceived Ease of Use (PEOU) greatly affects consumers’ attitudes and behavioral intentions regarding the adoption of new technology. In the realm of mobile website utilization, perceived ease of use (PEOU) has been demonstrated to favorably influence user happiness, underscoring its significance in improving user experience and acceptance [38]. In e-learning contexts, perceived ease of use (PEOU) directly affects users’ attitudes and indirectly shapes their behavioral intentions via perceived usefulness, highlighting its essential role in technology adoption [39]. Moreover, research on mobile learning has shown that perceived ease of use (PEOU) substantially influences both perceived usefulness and user attitudes, thereby affecting their intention to utilize these technologies [40]. These findings collectively underscore that when people regard a technology as user-friendly, they are more inclined to consider it beneficial and cultivate a positive attitude toward its adoption. Therefore, we propose:
H1d: 
There is a significant impact “PEOU” on AI adoption intentions.

2.7. User Satisfaction

User satisfaction plays a major role in ensuring the adoption and continued use of AI-based technologies, especially in higher education institutions. It refers to the aggregate happiness and good experiences people have in interacting with AI systems and resources. Understanding the elements that impact user satisfaction is essential for improving engagement, acceptance, and implementation of AI technologies in educational environments. Research has emphasized the significance of user satisfaction in various AI-powered systems, including mental health chatbots and mobile banking applications. Studies indicate that factors such as usability, service quality, and anthropomorphism influence user contentment and their continued use of AI technologies [37,41]. User satisfaction is pivotal to the successful deployment and continued use of AI technologies within higher education. It pertains to how well users’ expectations and actual experiences correspond with the effectiveness and advantages offered by AI systems. Recognizing the elements that impact user satisfaction is vital for fostering favorable user perceptions, involvement, and sustained use of AI technologies in academic environments [42,43]. Moreover, integrating AI into educational settings has underscored the importance of user satisfaction in fostering the effective implementation of technology. Elements like system performance, ease of operation, and perceived advantages have been recognized as crucial factors influencing user satisfaction and acceptance of AI-driven tools in education, both in teaching and administrative tasks [43]. By emphasizing user-centered design and features, educational establishments can improve user satisfaction and ease the seamless incorporation of AI technologies into educational activities. Moreover, the advancement of AI technology in education depends on feedback systems that capture user satisfaction and preferences. The research underscores the importance of user feedback, usability testing, and iterative design in enhancing user satisfaction and driving innovation in educational AI applications [37]. By integrating user feedback into the development of AI technologies, educational institutions can guarantee that AI systems meet user expectations and enhance learning outcomes positively. In conclusion, it is imperative to consider user satisfaction when designing, implementing, and testing AI technology for positive user experiences and easy adoption of AI in higher education. Through prioritizing factors that boost user satisfaction, such as perceived usefulness, expectation-fulfillment, and individualized experience, education providers can enhance user interaction and the use of AI technology for better learning outcomes. Therefore, we propose:
H1e: 
There is a significant impact of “US” on AI adoption intentions.

2.8. Performance Expectation

Performance Expectation “PE” is an essential factor influencing the adoption intentions of AI-based technologies in different sectors, including higher education. The research conducted by [44] demonstrated that performance expectancy significantly and positively impacts behavioral intention, among other factors. This highlights the importance of PE in shaping individuals’ attitudes towards adopting new technologies. Similarly, Rasheed et al. classified the existing literature on AI adoption into drivers and barriers, emphasizing the role of PE in influencing adoption decisions [45]. In examining e-learning adoption among students, Tarhini et al. highlight the significance of factors influencing student adoption behaviors, such as performance expectations. Their research enriches academic discourse by incorporating a range of variables that the University Information Disclosure System correlates with perceived performance outcomes, emphasizing the importance of fulfilling information needs to enhance enterprise agility. This study underscores the role of PE in influencing users’ perceptions of technology performance within universities and evaluating them within the context of UK universities, offering significant perspectives on the influence of PE in students’ acceptance of technology [46]. Lee et al. investigated what methods of satisfaction with the systems, highlighting the need for aligning technology with user expectations [47]. They also investigated the influence of quality library information resources on the satisfaction of postgraduate students at the Ignatius Ajuru University of Education library. The study emphasized the significance of pertinent information resources and their accessibility in boosting user satisfaction. It stressed the crucial role of the physical environment in determining users’ contentment with library services, pointing out the necessity for sufficient resources to fulfill user expectations [47]. Therefore, we propose:
H1f: 
There is a significant impact of “PE” on AI adoption intentions.

2.9. Introducing AI New Tools

Implementing new AI technologies in different organizational contexts, including universities, is impacted by a range of technological and socio-environmental factors. A study conducted by Henke examined university communication tactics and viewpoints on generative AI tools. The findings revealed significant variations in adopting AI tools among universities, which can be attributed to disparities in their approaches. The variation highlights the different methods and tactics used by universities to incorporate and utilize AI capabilities in their teaching settings [48]. In their study, Okunlaya et al. presented a novel conceptual framework that explores the use of AI library services to alter university education digitally. They highlighted the need to adopt AI technology to improve service delivery and encourage new behaviors in educational institutions [49]. The study conducted by Dora et al. revealed key factors that play a crucial role in the adoption of artificial intelligence in food supply chains. These factors include technology readiness, security, privacy, customer satisfaction, demand volatility, regulatory compliance, competitor pressure, and information sharing among partners. The study highlights the importance of these factors in promoting the adoption of AI. These aspects are essential in influencing the adoption of AI technology in many areas, such as education [42]. In addition, Gupta and Gupta highlight the combined effectiveness of need-based and curiosity-based experimentation in the adoption of AI technology for libraries. This study offers a comprehensive approach to controlling the adoption of AI technology in the educational scope [50]. Sallu, S.et al. focus on the utilization of AI in higher education. The study provides valuable information on how AI technologies can bring about significant changes and improvements in academic settings [51]. Saidakhror examines the influence of artificial intelligence on higher education and the economic aspects of information technology, demonstrating the various uses of AI tools in educational environments. The implementation of AI technologies in higher education institutions is impacted by various elements, such as technology preparedness, organizational backing, and individual perspectives. Comprehending these factors is crucial for universities to negotiate the intricacies of AI implementation, improve teaching and learning methods, and stimulate innovation in educational environments [52]. Therefore, we propose:
H1g: 
There is a significant impact of “AINT” on AI adoption intentions.

2.10. AI Strategic Alignment

AI strategic alignment “AIS” is one of the biggest drivers for the use and deployment of AI within higher education, particularly universities. Many researchers have captured the strategic implications of AI adoption and how AI activities align with institutional objectives and goals in the university context, which further indicates the importance of AIS in ensuring successful technology integration. Jarrahi et al. discussed in greater depth the strategic benefits of AI and its profound influence on the improvement of organizational learning. The study indicates the significance of AIS in supporting innovation in organizations and the effective operation of knowledge assets. In its attention to the slow, pathway-driven adoption of AI in organizational life cycles and continuous learning strategies, this study accentuates the strategic implications of AIS in navigating organizational successes towards long-term success [53]. Okunlaya et al. developed a new theoretical model for digitizing university teaching using AI library services. The study focuses on the importance of adopting AI in the context of university library services to support educational outcomes and customer experiences, as well as the significance of AI systems in driving digital transformation efforts. According to the literature review, the strategic coherence of AI is crucial for its successful deployment and incorporation in higher education. Understanding the strategic implications of AI adoption and aligning AI initiatives with university objectives is essential for universities to successfully leverage AI technology and encourage innovation in the classroom [49].Therefore, we propose:
H1h: 
There is a significant impact of “AIS” on AI adoption intentions.

2.11. Availability of Resources

The Availability of Resources “AVR” is essential for successfully implementing and integrating AI-based technologies in higher education institutions, including universities. Multiple studies have examined the necessity of having enough resources to facilitate the adoption of technology and innovation in universities, particularly concerning AI efforts. Bearman and Ajjawi examined the educational significance of artificial intelligence in education, highlighting educators’ need to modify their instructional approaches to integrate AI technologies proficiently. This study emphasizes the importance of having access to resources, such as AI tools and educational materials, in equipping students for a future that involves AI technology. It highlights how resources play a crucial role in influencing teaching methods in higher education [54]. The study specifically examined the factors that influence the employability of these graduates. This study emphasizes the significance of resource availability, such as high-quality education and skills development programs, in improving graduates’ capacity to find employment and achieve success in the job market. It underscores the value of resources in supporting student outcomes [55]. Boonsiritomachai et al. emphasized the significance of technical resources in influencing the acceptance of modern technologies. They underlined the relevance of physical assets, such as networking, data, and computer hardware, in promoting the adoption of technology. This study emphasizes the importance of collaborative resources in establishing a scalable and adaptable basis for business applications, emphasizing the crucial role of technical resources in facilitating the integration of technology [56].
Availability of Resources “AVR” is a crucial element in facilitating the effective implementation and assimilation of AI-based technologies in higher education institutions. Universities must have sufficient resources and match their strategies with organizational goals in order to effectively utilize AI technologies and promote innovation in the education industry. Therefore, we propose:
H1i: 
There is a significant impact of “AVR” on AI adoption intentions.

2.12. Competitive Pressure “COP”

Competitive pressure “COP” influences the willingness of higher education institutions, especially universities, to adopt AI-based technology. Multiple studies have emphasized the significance of competitive pressure in promoting the adoption of technology and innovation in universities. These studies show the strategic necessity of effectively responding to competitive market dynamics. Hungund and Mani emphasized that organizational decisions about technology adoption are influenced by the external environment in which the company operates. They emphasized the strategic necessity of competitive pressure for firms to remain competitive in highly competitive markets. This research highlights the importance of competitive pressure in driving businesses to adopt innovative technologies to increase performance and increase their likelihood of survival in competitive environments [57]. Alsheibani et al. identified competitive pressure as a driving force for the spread of innovative technologies, highlighting its significance in allowing companies to compete efficiently and preserve their competitive edge in the market. This research emphasized that companies operating in high-pressure situations tend to embrace innovative technologies to enhance their performance and enhance their likelihood of survival, emphasizing the strategic significance of addressing competitive challenges through technology adoption [58]. As Porter and Millar also pointed out, IT innovation can change the organization of industries, modify rules of competition, and reshape the landscape of competition, thus revealing the game-changing effect of technology on competition. The study emphasized that firms could take a step ahead in utilizing innovative technology and AI to improve their services and differentiate themselves from competitors in the market. This research illustrates how “COP” has an enormous impact on AI adoption intentions in higher education. In order to remain competitive, universities must adopt and innovate with technology to improve their performance and drive innovation in the education sector [59].Therefore, we propose:
H1j: 
There is a significant impact of “COP” on AI adoption intentions.

2.13. Government Regulations “GOR”

Government regulations “GOR” are essential in influencing the willingness of higher education institutions, namely universities, to adopt AI-based technologies. Multiple studies have emphasized the importance of government laws and regulations in promoting IT breakthroughs, such as integrating AI technology, in university environments. Alghamdi et al. (2020); Dora et al. (2021); Pan et al. (2022) [42,60,61] highlighted the crucial significance of governmental policies and laws in incentivizing the use of AI technology. These studies highlighted the support provided by state authorities in encouraging the implementation of AI technology through regulatory frameworks and guidelines, demonstrating the government’s commitment to advancing technological progress in various industries, including higher education. Wong and Yap highlight the government’s significance in shaping the adoption of artificial intelligence in accounting within micro, small, and medium firms. This exemplifies the extensive scope of government rules in influencing the deployment of AI technologies in many business contexts [62]. In addition, Dora et al. emphasizes that government regulators can exert pressure on companies to implement innovative technologies in their supply chain operations, demonstrating the impact of government regulations on technological progress in organizational procedures [42]. Ghani et al. highlights the essential role of government assistance in promoting the adoption of AI, underscoring the importance of government rules in influencing the acceptance of technology [63]. Within the domain of responsible AI governance, Alexander et al. (2024) [64] proposes that although governments are beginning to enforce formal regulatory measures to oversee AI, there is a requirement for ethics frameworks and “soft law” tools to supplement these rules. Moon proposes the notion of AI participatory governance, which involves several stakeholders, including government regulators, to ensure the fair and constructive utilization of AI for society’s progress [65]. Farida et al. examine the impact of government AI systems on obtaining accountable results, emphasizing the crucial role of government rules in guaranteeing responsible development and implementation of AI technology [66]. In their study, Noordt and Misuraca put out a comprehensive framework that aims to enhance the effective implementation of AI systems in government settings. They highlight the various elements that play a role in AI adoption, going beyond just the technical components. “GOR” significantly impacts the willingness of organizations, particularly higher education institutions, to use AI-based technologies. The interplay of regulatory frameworks, ethical considerations, and stakeholder involvement highlights the intricate nature of AI governance, where responsible practices are essential for optimizing the advantages of AI technologies while mitigating associated risks. An intricate comprehension of government regulations and their consequences is crucial for promoting innovation, guaranteeing adherence, and propelling sustainable technological advancement [67]. Therefore, we propose:
H1k: 
There is a significant impact of “GOR” on AI adoption intentions.

2.14. Technological Support

Technological support also determines the chances that higher education institutions will adopt AI technologies. Several studies have highlighted the importance of technological support for artificial intelligence adoption in the educational setting. Multiple studies have emphasized the need for technological assistance to incorporate artificial intelligence in educational environments. Hannan highlights the revolutionary influence of technological breakthroughs in higher education operations by demonstrating successful implementations of AI technologies in improving student learning experiences, student support services, and enrollment administration systems within educational institutions [26]. According to Greiner et al., the Technology Acceptance Model (TAM) and the Four-Sides Communication Model can be employed to understand how humans interact with AI and the adjustments needed for acceptance, specifically in the context of grading dissertations. This emphasizes the significance of matching technological assistance with the needs and expectations of users [55]. Crompton and Song explore how AI benefits students and faculty in higher education. They highlight how AI enables personalized learning, intelligent tutoring systems, facilitates collaboration, and automates grading. Such instances demonstrate how technological support improves educational processes [21]. Mohsin et al. highlight various factors that contribute to creating a favorable environment for adopting AI. These factors include sufficient funding, technological infrastructure, IT support, training programs, and institutional policies that promote the integration of AI. The author emphasizes the diverse range of technological support required to facilitate the adoption of AI [68]. In another study, an analysis was conducted on faculty attitudes, technology readiness, curriculum reform needs, and policy implications in the integration of AI in information technology education [69]. The study highlights the intricate nature of providing technological support in educational environments. Opesemowo and Adekomaya examine the qualitative elements of utilizing AI to promote Sustainable Development Goals in South Africa’s higher education system. The study highlights the need for technological assistance in promoting sustainable educational practices [70]. Polyportis, A. performs a long-term investigation on the acceptance of AI, providing practical advice for AI developers and educational institutions to enhance student involvement with AI technologies, highlighting the ever-changing nature of technology assistance in educational settings. The presence of technology support plays a crucial role in determining the likelihood of AI-based technologies being adopted in higher education. The analyzed papers highlight the numerous ways in which technological support enhances educational processes, ranging from enhancing student learning experiences to optimizing administrative procedures. Comprehending the complex and diverse aspects of technology assistance is crucial for higher education institutions to successfully incorporate AI technologies, enhance student involvement, and foster innovation in instructional methods [71]. Therefore, we propose:
H1l: 
There is a significant impact of “TS” on AI adoption intentions.

2.15. Facilitating Conditions

Facilitating conditions have a critical role in shaping the likelihood of AI-based technologies being adopted in different organizational settings, such as higher education institutions. According to Eftimov and Kitanoviki, facilitating conditions refer to the conducive surroundings and incentives that empower individuals to acknowledge the advantages of using AI technologies [72]. Tanantong and Wongras establish a connection between enabling situations and individuals’ perceptions of the resources and support required for various behaviors [73]. Jain et al. highlight that the ease of conditions relies on users’ perceptions regarding the accessibility of assistance and resources for utilizing technology within companies [22]. Mohsin et al. stress the positive effect of accommodating environments on effort expectancy, suggesting that a comfortable setting increases users’ willingness to be able to effectively engage with AI systems [68]. Morrison examines barriers and facilitators for AI deployment in clinical settings in the NHS. Facilitating factors play a significant role in shaping the adoption strategies of AI technologies across multiple organizational settings. Creating optimal conditions, setting priorities, and creating the right environment are essential to using technology. Understanding and adapting to appropriate environments is essential for businesses, in particular higher education institutions, to be able to integrate AI, enhance the user experience, and drive creativity into adoption processes [74]. Therefore, we propose:
H1m: 
There is a significant impact of “FC” on AI adoption intentions.

2.16. AI Adoption Intention

Factors driving the decision to bring AI into universities include technological innovation, social-environmental aspects, and institutional factors. According to Chen et al. explored the conditions leading to the successful application of AI in China’s telecommunications sector. The results of their study offer valuable insights for companies on how to choose and spend resources in adopting AI. The research pointed to the importance of understanding the factors leading to the successful adoption of AI in a particular industry context [75]. Furthermore, Chen et al. investigated the determinants impacting the acceptance of big data analytics and artificial intelligence in connection to operational effectiveness. The study highlighted the correlation between operational performance and environmental performance [76]. Furthermore, Bughin investigated the impact of a company’s AI strategy on employment growth, specifically analyzing the strategic goals and resources affected by the use of AI. The study provided valuable insights into the consequences of using artificial intelligence on internal operations and various enterprise resources [77]. Govindan highlighted the significance of artificial intelligence in advancing sustainable and economically efficient innovation. He emphasized the importance of vendors integrating AI-based processes in order to adopt these technologies [78] effectively. Horani et al. (2023) provide valuable insights into the key elements that influence the implementation of artificial intelligence within organizations. By incorporating these findings into the discourse on the desire to embrace AI, companies, especially higher education institutions, can gain a comprehensive understanding of the key elements that impact decisions related to the adoption of technology [79]. Subsequently, individuals can utilize this acquired understanding to proficiently maneuver through the procedure of integrating AI and attain triumph. In summary, the choice to use AI-driven technologies in higher education institutions is influenced by factors such as technological support, favorable conditions, and regulatory frameworks. Understanding these attributes is crucial for businesses to successfully manage the use of artificial intelligence and foster innovation for enduring and sustainable expansion. Therefore, we propose:

3. Objectives

It seeks to identify and assess the key technological and socio-economic factors that may influence universities’ decisions to adopt AI technologies. The research aims to understand the factors related to the intent to implement AI technologies, such as “C”, “CX”, User Experience, Perceived Usefulness, “PEOU”, “US”, “PE”, “AIS”, available resources, “COP”, Government Policy, Technological Assistance, and Facilitating Environments.
Moreover, the study aims to analyze how demographic characteristics such as age, gender, education, and years of experience affect the relationships between the aforementioned parameters and the intention to use AI-based technology. Additionally, the study aims to develop a comprehensive understanding of how personal attributes are likely to interact with the tool and their implications for understanding the factors that govern decisions about AI implementation and its impact on organizational transformation.

4. Methodology

4.1. Participants

The study collected data from a diverse panel of 500 respondents, including university students and professional workers in higher education. This ensures that the contexts under which they might use AI-based technologies in their professional lives or higher education settings are considered. The viewpoints of learners and practitioners also help generate a comprehensive understanding of the intentions an individual might have to adopt AI use in educational settings.

4.2. Data Collection

The main tool for gathering data was a structured questionnaire that was created using well-known models, the (TAM), (DOI), and the (TOE) framework. The questionnaire was broken into multiple sections to evaluate different influencing factors and contained both demographic and construct-related items.
Instruments and constructs measuring the following were included in the survey:
The questionnaire was developed to assess constructs based on the DOI, TOE, and TAM models. Every construct was assessed using several indicators modified from recent validated studies. The survey included items related to compatibility (C1–C5), complexity (CX1–CX4), user experience (UX1–UX4), perceived ease of use (PEOU1–PEOU3), user satisfaction (US1–US6), performance expectation (PE1–PE3), AI strategic alignment (AIS1–AIS3), availability of resources (AVR1–AVR3), competitive pressure (COP1–COP3), government regulations (GOR1–GOR3), technological support (TS1–TS3), facilitating conditions (FC1–FC3), and AI adoption intentions (AIA1–AIA3).
Each item was scored using a 5-point Likert scale, with 1 denoting ’strongly disagree‘ and 5 denoting ’strongly agree.’ The items were adapted and contextualized for the higher education environment. The full list of item codes and their source citations is provided in Appendix A. Open-ended questions were also incorporated to supplement the quantitative data in order to gather more information and set the statistical results in context.

4.3. Research Questions

How do the factors influence the adoption intentions of AI-based technologies in higher education institutions, aligned with the (TAM) and the (TOE) framework? Additionally, what are the mediating roles of demographic variables in these relationships?
The impact of key factors “C”, “CX”, User Experience “UX”, “PEOU”, “US”, “PE”, “AINT”, “AIS”, “AVR”, “COP”, “GOR”, “TS”, and “FC” together on AI adoption intentions among higher education students and faculty members in Türkiye, Canada, and the USA is investigated. Additionally, the study aims to understand the moderating roles of age, gender, and years of experience in this relationship.

4.4. Deductive Approach

The current investigation utilized a deductive methodology. The deductive approach is typically initiated by formulating a hypothesis and subjecting it to careful observations or data collection. In the context of this particular inquiry, the investigation was initiated with a theoretical framework relating to the influence of the key factors on AI adoption intentions and then tested this theoretical perspective using empirical data from higher education students and faculty members.

4.5. Population

The study’s participants were based in the USA, Canada, and Türkiye. Given that they are experts who play important roles in higher education, such as faculty members or student services specialists, they were specifically chosen to offer valuable insights into the factors influencing AI adoption intentions. Academic contacts, professional networks, and university directories were used to find participants. In Türkiye, a combination of Google Forms shared through institutional emails and paper-based questionnaires given out in person was used for recruitment. The Google Forms survey was disseminated to participants in Canada and the USA via direct messaging, sharing in pertinent academic groups, and professional social media sites like LinkedIn. Follow-up reminders were sent to encourage higher response rates, and participation was anonymous and voluntary. To investigate the relationships between variables and analyze the hypotheses put forth, the analysis relied on quantitative methods, covariance-based structural equation modeling (CB-SEM), and descriptive statistics. Multi-group comparisons and interaction effects within the SEM framework were also used to examine the moderating effects of demographic variables, including age, gender, years of experience, and educational background.

4.6. Sample Size Calculation

The sample size of the study of 367 university students and workers can be estimated using the sample size formula for a quantitative variable. This approach is often applied to prevalence or cross-sectional studies to make sure the sample size is large enough to provide statistical power and allow for the proper rejection of the data the null hypothesis if needed. G*Power 3.1, a popular statistical power analysis program for structural equation modeling (SEM), notably covariance-based SEM, was utilized to calculate the sample size for this investigation. G*Power efficiently estimates sample sizes using statistical test types, effect sizes, significance levels (α), and statistical power (1–β), providing trustworthy model estimation. This study utilized a priori power analysis for linear multiple regression (fixed model, R2 departure from zero), a typical SEM sample size estimation proxy. These parameters were used:
Effect size (f2) = 0.15 (medium, per Cohen’s standards). Level of significance: α = 0.05 power = 1–β = 0.95
The proposed model has 12 predictors based on latent variables. These characteristics led G*Power to recommend 184 samples. The study has 367 participants, which exceeds this threshold and provides enough statistical power to detect relevant effects and yield reliable SEM results. G*Power follows SEM research best practices, where sample size is crucial for model fit, parameter stability, and generalizability [80].

4.7. Sampling Method

The study recruited 367 university students, faculty, and administrative staff through purposive sampling to investigate AI technology adoption in higher education. Researchers employed a non-probability sampling approach to include only participants with relevant knowledge or experience in educational technology systems in their study.

4.8. Rationale for Purposive Sampling

Purposive sampling was used to gather specific and valuable information from individuals who use technology in education or are impacted by it. Participants were selected based on characteristics aligned with the study’s focus, such as prior experience using digital platforms, decision-making roles in technology integration, or involvement in institutional technology planning. This strategy is particularly suitable for research exploring adoption behavior, as it prioritizes the inclusion of informed individuals who can contribute to a more nuanced appraisal of AI acceptance in universities [81].
Data were collected through an online survey distributed via institutional mailing lists, professional academic networks (LinkedIn, ResearchGate), and university forums across institutions in Türkiye, Canada, and the United States. Before participating, we informed all respondents of the study’s objectives and obtained their informed consent.

4.9. TAM Construct Modification

Several fundamental concepts from the TAM model, originally created by Davis in 1989 and later refined by Venkatesh and Davis in 2000, were modified for this study. The conceptual framework was employed to reflect users’ evaluations of AI-based technology in higher education using “PEOU” and “PU”, with PU operationalized as “PE”. In various organizational contexts, these constructs have consistently demonstrated their value in explaining people’s intentions to adopt new technologies [14,82]. In line with extended (TAM) model frameworks, the inclusion of “US” and “TS” emphasizes the importance of post-adoption satisfaction and institutional infrastructure as factors influencing continued usage intention [83,84].

4.10. Theoretical Background and Hypothesis Structuring

Camisón and Villar-López defined innovation adoption as “the implementation of a new or significantly improved product (goods or services) or process, a new marketing method, or a new organizational method in business practices, workplace organization, or external relations.” In other words, innovation organizational adoption refers to a firm’s explicit choice to either adopt or use an innovative technology [85]. AI is an advanced and innovative technological domain [86]. Applying existing technology adoption models to study the implementation of AI at the organizational level poses significant challenges. AI encompasses the overall aspects of organizations, including their processes, data, talents, strategies, and structures [8]. Therefore, to examine the perspective of higher education organizations’ implementation of AI, this article utilizes three frameworks: DOI [11], TAM [14], and the TOE framework [12]. DOI, or Diffusion of Innovation, is the process by which innovation or technology is shared among members of a social group over time through certain channels of communication [87]. The proposition suggests that the spread of a new idea or technology is determined by how people perceive it and the specific features of the technology itself. Diffusion is the process through which businesses, individuals, communities, or subsystems acquire and fully embrace innovative concepts, such as innovative technology, to advance in science and education. TAM does not incorporate a social element. Although Unified Theory of Acceptance and Use of Technology (UTAUT) includes social impact as a primary element in its model, it does not include the attitude variable. Attitude significantly determines the behavioral intention to use a specific technology, as highlighted in education [88]. The DOI theory and the TOE framework share significant commonalities, as noted by Baker (2012). The organizational and technological aspects of the TOE framework correspond to the innovative characteristics and organizational context of the DOI model, respectively [89]. However, there are notable distinctions between DOI and TOE [88,90]. Unlike the DOI, the TOE system does not account for specific characteristics of individuals. Conversely, unlike the TOE model, the DOI hypothesis ignores environmental influences. Integrating the TOE and TAM elements is seen as essential to overcome DOI theory limitations in the context of technology adoption across multiple settings [91,92,93]. Therefore, by aligning the DOI, TOE, and TAM into a single framework, we can investigate the external and internal drivers behind an organization’s adoption of AI. This means that the triad DOI-TOE-TAM model (Figure 1) is suitable for explaining the technological and socio-environmental aspects of AI implementation in organizations.

4.11. Research Hypotheses

H1: 
There is a statistically significant impact of key factors “C”, “CX”, “UX”, “PEOU”, “US”, “PE”, “AINT”, “AIS”, “AVR”, “COP”, “GOR”, “TS”, and “FC”) together on AI adoption intentions at p ≤ 0.05.
This hypothesis was divided into 13 sub-hypotheses:
H1a: 
There is a statistically significant impact of “C” on AI adoption intentions at p ≤ 0.05.
H1b: 
There is a statistically significant impact of “CX” on AI adoption intentions at p ≤ 0.05.
H1c: 
There is a statistically significant impact of “UX” on AI adoption intentions at p ≤ 0.05.
H1d: 
There is a statistically significant impact of perceived ease of “PEOU” on AI adoption intentions at p ≤ 0.05.
H1e: 
There is a statistically significant impact of US on AI adoption intentions at p ≤ 0.05.
H1f: 
There is a statistically significant impact of “PE” on AI adoption intentions at p ≤ 0.05.
H1g: 
There is a statistically significant impact of “AINT” on AI adoption intentions at p ≤ 0.05.
H12h: 
There is a statistically significant impact of “AIS” on AI adoption intentions at p ≤ 0.05.
H1i: 
There is a statistically significant impact of “AVR” on AI adoption intentions at p ≤ 0.05.
H1j: 
There is a statistically significant impact of “COP” on AI adoption intentions at p ≤ 0.05.
H1k: 
There is a statistically significant impact of “GOR” on AI adoption intentions at p ≤ 0.05.
H1l: 
There is a statistically significant impact of “TS” on AI adoption intentions at p ≤ 0.05.
H1m: 
There is a statistically significant impact of “FC” on AI adoption intentions at p ≤ 0.05.

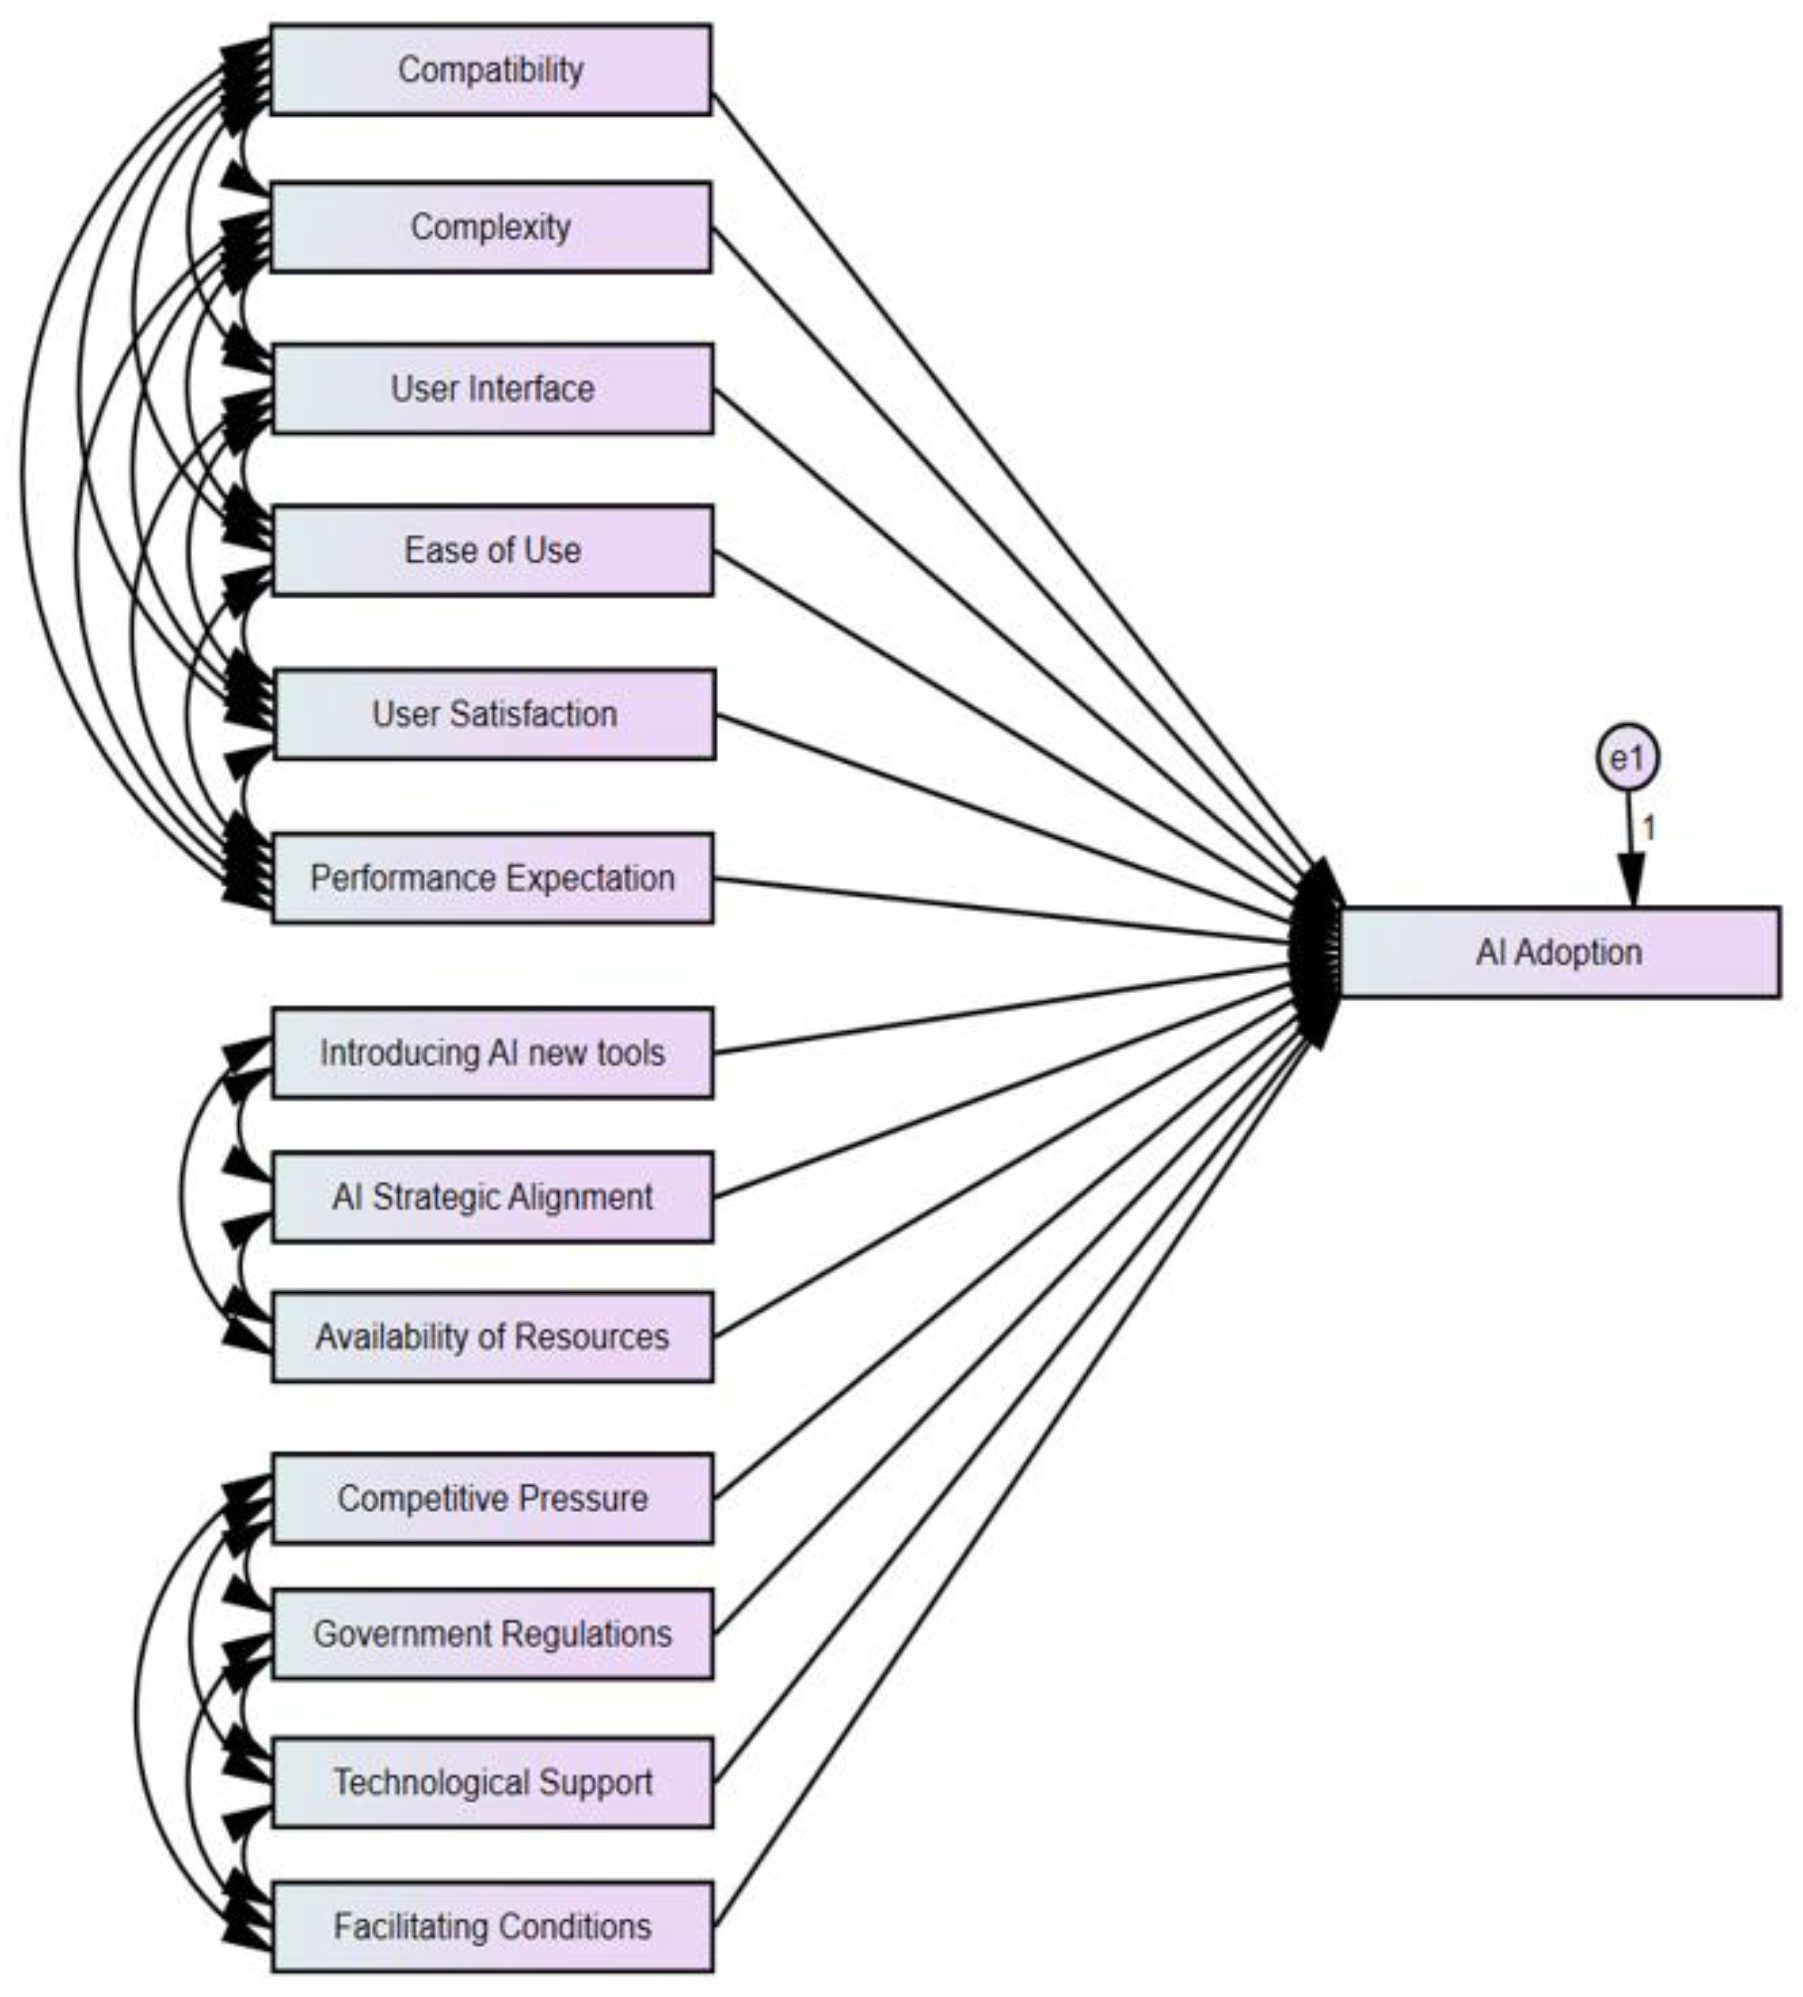
4.12. The Research Model

Figure 1 shows the study model, which includes the independent variables (technological factors, organizational factors, environmental factors) and the dependent variable, which is AI adoption intention.

4.13. Data Analysis

A descriptive statistical analysis was performed to calculate the values, and both simple and multiple regression analyses were conducted to examine the relationships between the external variables and other study elements. The acquired data was analyzed, and the hypotheses of the study were evaluated using SPSS® Amos version 24 (IBM Corp., Armonk, NY, USA).

4.14. Descriptive Analysis

4.14.1. Sample Characteristics

Table 1 presents the demographic variables of the study sample; the male respondents were 51%, and the female respondents were 49%. The majority of respondents were between 34 and 44 years old (47.7%). The majority of respondents’ education level was a PhD degree (59.2%). The majority of respondents’ educational major was IT (37.1%), while respondents with other majors (32.7%) were in languages (16), structural design (seven), engineering (22), education (21), biology (five), economics (13), science (18), marketing (nine), MIS (five), and finance (four). The majority of respondents’ work experience (44.7%) was 10 years and above, with (25.6%) of respondents using AI tools or apps for less than 6 months, (15%) of respondents using AI tools or apps from 6 months–less than 1 year, (13.1%) of respondents using AI tools or apps from 1 year–less than 2 years, and (46.3%) of respondents using AI tools or Apps for 2 years and more. The majority of respondents preferred Windows PC operating system to use their preferred AI tool, with a percentage of (73.3%), while the other respondents used Linux operating system.

4.14.2. What Type of AI Tools Do You Use for Your Work or School Needs?

Table 2 shows that (74.7%) of all respondents used the ChatGPT-4 tool in their work or school needs, (36.8%) of all respondents used the QuillBot tool in their work or school needs, (67.6%) of all respondents used the Grammarly tool in their work or school needs, (9.8%) of all respondents used the Scholarcy tool in their work or school needs, (11.7%) of all respondents used the Scite tool in their work or school needs, (18.5%) of all respondents used the pdf.ai tool in their work or school needs, and finally (6.5%) of all respondents used other tools in their work or school needs which included Scispace AI, Tome AI, Cognigy.ai, Copilot, Generative AI by Adobe, Rytr Deep learning, and OpenAI API Key.

4.14.3. How Has Management Supported the Usage of AI in Your Workplace?

Table 3 shows that (21.3%) of all respondents agreed that management supported the usage of AI in their workplace by conferences, (29.4%) of all respondents agreed that management supported the usage of AI in their workplace by workshops, (34.9%) of all respondents agreed that management supported the usage of AI in their workplace by training, (22.6%) of all respondents agreed that management supported the usage of AI in their workplace by all of conferences, workshops, and training, and finally (18.8%) of all respondents agreed that management supported the usage of AI in their workplace in other ways.

4.14.4. What Are Some of the Resources That You Believe Support the Adoption of AI in Your Organization?

Table 4 shows that (19.1%) of all respondents believe that the resources that support the adoption of AI in their organization are application processes, (15.3%) of all respondents believe that the resources support the adoption of AI in their organization are collaboration strategies, (23.2%) of all respondents believe that the resources support the adoption of AI in their organization are IT development plans, (26.4%) of all respondents believe that the resources support the adoption of AI in their organization are technical knowledge/skills, (48.2%) of all respondents believe that the resources support the adoption of AI in their organization, and finally, (2.5%) of all respondents believe that other resources are supporting the adoption of AI in their organization.

4.14.5. What Are Some of the Assistances Offred by State Authorities to Motivate the Adoption of AI?

Table 5 shows that (26.4%) of all respondents believe that the social attitudes about morals and ethics offered by state authorities motivate the adoption of AI, (19.3%) of all respondents believe that the guidelines for the development of AI applications offered by state authorities motivate the adoption of AI, (33.5%) of all respondents believe that the protect privacy and ownership rights offered by state authorities motivates the adoption of AI, (28.1%) of all respondents believe that all of the above resources offered by state authorities motivate the adoption of AI, and finally (13.1%) of all respondents believe that other resources offered by state authorities motivate the adoption of AI.

4.14.6. What Technological Support Does Your Organization Have to Support the Adoption of AI?

Table 6 shows that (24.3%) of all respondents believe that their organization has supportive AI in-house software to support the adoption of AI, (20.2%) of all respondents believe that their organization has adoptive operating systems that support AI to support the adoption of AI, (20.4%) of all respondents believe that their organization has a supportive in-house AI network to support the adoption of AI, (47.7%) of all respondents believe that their organization is not yet there, none of the above support the adoption of AI, finally (2.2%) of all respondents believe that their organization has other technological support to support the adoption of AI.

4.15. Testing the Model

4.15.1. Confirmatory Factor Analysis

Confirmatory factor analysis (CFA) is used to validate the factor structure of the collection of observed variables (the factor loadings). Convergence validity and composite reliability (CR) are evaluated. Table 7 below displays the findings. Discriminate validity is seen in Table 8.
Given that the recommended factor loading is 0.50 or higher, and ideally 0.70 or higher [94], Table 7 demonstrates that all of the item loadings range from 0.621 to 0.874; the results are therefore accepted.
Composite reliability (CR) and average variance extracted (AVE) can be used to evaluate convergent validity in factor loadings. According to the findings, composite reliability scores of 0.757 to 0.905, which are higher than 0.7, indicate strong internal consistency. Additionally, the results demonstrate that the average variance extracted (AVE) values, which are greater than 0.50 (the cut-off value justifies the usage of the construct), ranged from 0.512 to 0.714. As a result, all of the latent variables satisfy the requirements needed to demonstrate convergent validity [15].
All of the HTMT values obtained are less than 0.85, as shown in Table 8, suggesting that there are no issues with discriminant validity. Henseler et al. (2015) state that discriminant validity amongst reflective constructs is established by HTMT values less than 0.90 [95]. According to the findings, there were no overlapping items in the impacted constructs according to respondents’ perceptions, and there were no collinearity issues among the latent constructs (multicollinearity).
Based on the results of Table 7 and Table 8 above, the final best-fitting model is presented in Figure 2 below.

4.15.2. Goodness of Fit

Several metrics are used to assess the model’s goodness of fit, Standardized Root Mean Squared Residual (SRMR), comparative fit index (CFI), Tucker and Lewis’s index of fit (TLI), normed fit index (NFI), and root mean square error of approximation (RMSEA)). Other indicators include the recommended cut-off values of model fit (Chi-square χ2 (p > 0.05); Normed Chi-Square (χ2/df) 1.0≤ χ2/df ≤ 3; RMSEA 0.10, NFI 0.90; CFI 0.90; IFI 0.90; TLI 0.90). Table 9 below displays the findings.
Table 9 demonstrates that an excellent model fit is indicated by the SRMR value, which is less than 0.08 [18]. A great match for the model is shown by a CFI score greater than 0.95 [16]. Additionally, an excellent match is shown by the TLI value, which is greater than 0.90 [96]. A good match for the model is also shown by the NFI and IFI values, both of which are greater than 0.90 [18]. A good fit for the model is indicated when the RMSEA is less than or equal to 0.1 [97].
The suggested model is fitted since indexes indicate that it adequately fits the available data.

4.16. Testing the Hypotheses

A covariance-based Structural Equation Model (CB-SEM), using Partial Least Squares, is utilized to evaluate the research hypotheses which are necessary for this study. Figure 3 shows the SEM model hypotheses.

4.17. Testing the First Hypothesis

H1: 
There is a statistically significant impact of key factors (“C”, “CX”, “UX”, “PEOU”, “US”, “PE”, “AINT”, “AIS”, “AVR”, “COP”, “GOR”, “TS”, and “FC”) together on AI adoption intentions. at a level of p ≤ 0.05.
This hypothesis was divided into 13 sub-hypotheses:
H1a: 
There is a statistically significant impact of “C” on AI adoption intentions at a level of p ≤ 0.05.
H1b: 
There is a statistically significant impact of “CX” on AI adoption intentions at a level of p ≤ 0.05.
H1c: 
There is a statistically significant impact of User Experience “UX” on AI adoption intentions at a level of p ≤ 0.05.
H1d: 
There is a statistically significant impact of “PEOU” on AI adoption intentions at a level of p ≤ 0.05.
H1e: 
There is a statistically significant impact of “US” on AI adoption intentions at a level of p ≤ 0.05.
H1f: 
There is a statistically significant impact of “PE” on AI adoption intentions at a level of p ≤ 0.05.
H1g: 
There is a statistically significant impact of “AINT” on AI adoption intentions at a level of p ≤ 0.05.
H1h: 
There is a statistically significant impact of “AIS” on AI adoption intentions at a level of p ≤ 0.05.
H1i: 
There is a statistically significant impact of (AVR” on AI adoption intentions at a level of p ≤ 0.05.
H1j: 
There is a statistically significant impact of (COP” on AI adoption intentions at a level of p ≤ 0.05.
H1k: 
There is a statistically significant impact of (GOR” on AI adoption intentions at a level of p ≤ 0.05.
H1l: 
There is a statistically significant impact of “TS” on AI adoption intentions at a level of p ≤ 0.05.
H1m: 
There is a statistically significant impact of (FC” on AI adoption intentions at a level of p ≤ 0.05.
The result of the SEM for testing the hypotheses is presented in Table 10 below, which shows the following results:
  • “C” has a positive significant impact on AI adoption intentions, as indicated by the regression weights; the route is significant since the p-value (***) is less than 0.001 and the crucial ratio value is more than 2 [17]. Consequently, it is decided to embrace the first alternative sub-hypothesis;
  • (CX) has a significant positive impact on AI adoption intentions, as indicated by the regression weights; the route is significant since the p-value (***) is less than 0.001 and the crucial ratio value is more than 2 [17]. Consequently, it is decided to embrace the second alternative sub-hypothesis;
  • (CX) has a significant positive impact on AI adoption intentions, as indicated by the regression weights; the route is significant since the p-value (***) is less than 0.001 and the crucial ratio value is more than 2 [17]. Consequently, it is decided to embrace the second alternative sub-hypothesis;
  • User Experience (UX) has a significant positive impact on AI adoption intentions, as indicated by the regression weights; the route is significant since the p-value (***) is less than 0.001 and the crucial ratio value is more than 2 [17]. Consequently, it is decided to embrace the third alternative sub-hypothesis;
  • (PEOU) has a significant positive impact on AI adoption intentions, as indicated by the regression weights; the route is significant since the p-value (***) is less than 0.001 and the crucial ratio value is more than 2 [17]. Consequently, it is decided to embrace the fourth alternative sub-hypothesis;
  • (US) has a significant positive impact on AI adoption intentions, as indicated by the regression weights; the route is significant since the p-value (***) is less than 0.001 and the crucial ratio value is more than 2 [17]. Consequently, it is decided to embrace the fifth alternative sub-hypothesis;
  • (PE) has a positive significant impact on AI adoption intentions, as indicated by the regression weights; the route is significant since the p-value (0.001) is less than 0.01 and the crucial ratio value is more than 2 [17]. Consequently, it is decided to embrace the sixth alternative sub-hypothesis;
  • (AINT) has a significant positive impact on AI adoption intentions, as indicated by the regression weights; the route is significant since the p-value (***) is less than 0.001 and the crucial ratio value is more than 2 [17]. Consequently, it is decided to embrace the seventh alternative sub-hypothesis;
  • (AIS) has a significant positive impact on AI adoption intentions, as indicated by the regression weights; the route is significant since the p-value (0.003) is less than 0.01 and the crucial ratio value is more than 2 [17]. Consequently, it is decided to embrace the eighth alternative sub-hypothesis;
  • (AVR) has a significant positive impact on AI adoption intentions, as indicated by the regression weights; the route is significant since the p-value (***) is less than 0.001 and the crucial ratio value is more than 2 [17]. Consequently, it is decided to embrace the ninth alternative sub-hypothesis;
  • As per Byrne (2013), the regression weights indicate that (COP) has an insignificant impact on AI adoption intentions. This is because the critical ratio value is less than 2, and the p-value (0.421) is higher than 0.05, indicating that the path is not significant [17]. The tenth null hypothesis is thus accepted;
  • As per Byrne (2013), the regression weights indicate that (GOR) has an insignificant impact on AI adoption intentions. This is because the critical ratio value is less than 2, and the p-value (0.785) is higher than 0.05, indicating that the path is not significant [17]. The eleventh null hypothesis is thus accepted;
  • (TS) has a significant positive impact on AI adoption intentions, as indicated by the regression weights; the route is significant since the p-value (***) is less than 0.001 and the crucial ratio value is more than 2 [17]. Consequently, it is decided to embrace the twelfth alternative sub-hypothesis;
  • (FC) has a significant positive impact on AI adoption intentions, as indicated by the regression weights; the route is significant since the p-value (***) is less than 0.001 and the crucial ratio value is more than 2 [17]. Consequently, it is decided to embrace the thirteenth alternative sub-hypothesis.

4.18. Testing the Second Hypothesis

H2: 
Demographic factors (gender, age, education, major, and years of experience) moderate the original relationship between key factors “C”, “CX”, User Interface, “PEOU”, “US”, “PE”, “AINT”, “AIS”, “AVR”, “GOR”, “TS”, and “FC”) together and AI adoption intentions.
H2a: 
Gender significantly moderates the relationship between key factors and AI adoption intentions at p ≤ 0.05.
H2b: 
Age significantly moderates the relationship between key factors and AI adoption intentions at p ≤ 0.05
H2c: 
Education level significantly moderates the relationship between key factors and AI adoption intentions at p ≤ 0.05.
H2d: 
Academic major significantly moderates the relationship between key factors and AI adoption intentions at p ≤ 0.05.
H2e: 
Years of experience significantly moderates the relationship between key factors and AI adoption intentions at p ≤ 0.05.
The second main hypothesis is tested through multiple-group CB-SEM analysis using AMOS for the seven demographics it represents.
The results of the sub-hypothesis testing are presented in the following subsections.
H2a: 
Gender Moderation: Gender categorical moderation is examined, and the results are presented in Table 11 below.
Table 11 demonstrates that because the p-value (0.491) is higher than (0.05), the chi-square value (0.455) is not significant. This indicates that the disparities between the groups of men and women are negligible.
H2b: 
Age Moderation: Age categorical moderation is examined, and the results are presented in Table 12 below.
Given that the p-value (0.322) is higher than (0.05), Table 12 demonstrates that the chi-square value (1.279) is not significant. This suggests that age has no discernible moderating influence on the first association between the AI key factors (“C”, “CX”, “UX”, “PEOU”, “US”, “PE”, “AINT”, “AIS”, “AVR”, “GOR”, “TS”, and “FC”) together and AI adoption intentions because there are no notable variations across the various age groups.
H2c: 
Education Moderation: The Education categorical moderation is examined, and the results are presented in Table 13 below.
Given that the p-value (0.099) is higher than (0.05), Table 4, Table 5, Table 6, Table 7, Table 8, Table 9, Table 10, Table 11, Table 12 and Table 13 demonstrates that the chi-square value (4.624) is not significant. This suggests that education has no discernible moderating influence on the first association between the AI key factors (“C”, “CX”, “UX”, “PEOU”, “US”, “PE”, “AINT”, “AIS”, “AVR”, “COP”, “GOR”, “TS”, and ”FC”) together and AI adoption intentions, because there are no notable variations across the various education level groups.
H2d: 
Major Moderation: The Major categorical moderation is examined, and the results are presented in Table 14 below.
Table 14 shows that the chi-square value (12.939) is significant since the p-value (0.012) is less than (0.05). This means significant differences exist between the different types of major groups. This suggests that major has a moderating influence on the first association between the AI key factors (“C“, “CX“, “UX“, “PEOU“, “US“, “PE“, “AINT“, “AIS“, “AVR“, “COP“, “GOR“, “TS“, and “FC“) together and AI adoption intentions.
While the results in Table 15 show that all types of majors have a significant moderation effect since the critical ratio value is greater than 2 and the p-values are less than 0.01, the path is significant, except for the medicine major which has an insignificant moderation effect on the original relationships between the AI key factors and AI adoption intentions.
Other majors have the biggest effect with 0.764, then come, respectively, (IT, Management, and Pharmaceutical) with effect values of (0.692, 0.676, and 0.675).
H2e: 
Experience Moderation: The Experience categorical moderation is examined, and the results are presented in Table 16 below.
Table 16 shows that the chi-square value (10.625) is significant since the p-value (0.031) is less than (0.05). This means that there are significant differences between the different groups of Experience; therefore, the groups of Experience have a moderating influence on the first association between the AI key factors (“C“, “CX“, “UX“, “PEOU“, “US“, “PE“, “AINT“, “AIS“, “AVR“, “COP“, “GOR“, “TS“, and “FC“) together and AI adoption intentions.
The results above in Table 17 show that all categories included in years of experience have a significant moderation effect since the critical ratio value is greater than 2 and the p-values are less than 0.01, the path is significant.
Years of experience (8 years–less than 10 years) has the biggest effect, with 0.907, then come years of experience (10 years and above, 6 years–less than 8 years, 2 years–less than 6 years, and less than 2 years) with effect values (0.760, 0.738, 0.666, and 0.339).

5. Conclusions and Future Work

5.1. Conclusions

The findings of this study support several factors that trigger higher education institutions to innovate and adopt Artificial Intelligence. The study revealed that all investigated factors, namely “C”, “CX”, “UX”, “PEOU”, “US”, “PE”, AI introduces new tools “AINT”, “AIS”, “AVR”, “TS”, and “FC”, have a statistically significant positive impact on AI adoption intentions. The statistical analysis showed that the p-values for all factors reached high significance (p < 0.001 for most factors), allowing us to accept the alternative hypothesis for the aforementioned factors. However, “COP” and “GOR” showed no statistically significant impact on AI adoption intentions, leading us to accept the null hypothesis for those factors. Demographic factors were also examined as possible moderators in this study. It was found that age and education level did not significantly impact the relationship between key factors and AI adoption intentions. Significant moderation effects were observed for main fields of study and years of experience, suggesting that these demographic factors might influence how individuals perceive and formulate their intentions to adopt AI in a higher education context.

5.2. Future Work and Recommendations

The results of this study offer a useful understanding of the elements that influence the intent of higher education institutions to adopt AI technology. Considering the notable effects that have been identified, several suggestions can be put forth for future endeavors and real-world implementations:
(1)
Compatibility “C”: The results indicate that compatibility has a significant positive impact on AI adoption intentions. Further research should investigate how institutions might improve the compatibility of AI technology with current systems and processes to allow a more effortless adoption.
(2)
“CX”: complexity also shows a significant positive impact on AI adoption intentions. Further study endeavors may explore methods to streamline AI technologies and diminish apparent intricacy, promoting wider consumer acceptance.
(3)
“UX”: The positive impact of user interface on AI adoption aspirations underscores the need to craft user-friendly interfaces. Subsequent research should prioritize creating user-friendly and easily available artificial intelligence systems that address the varied requirements of individuals in higher education.
(4)
“PEOU”: The strong correlation between “PEOU” and AI adoption intentions indicates that institutions should prioritize providing training and support to boost users’ confidence in employing AI technologies. Subsequent studies could investigate the efficacy of various training programs in enhancing the perception of usability.
(5)
“US”: User satisfaction significantly influences AI adoption intentions, indicating that organizations must ensure a positive user experience with AI tools. Subsequent research should investigate the elements influencing user satisfaction and determine methods.
(6)
“PE”: The findings reveal that “PE” positively impacts AI adoption intentions. Future research should explore how organizations might effectively convey the anticipated advantages of AI technologies to prospective users.
(7)
Demographic variables: The study highlights the mediating roles of demographic variables such as age, gender, education, and years of experience. Further investigation is needed to explore the impact of these characteristics on the adoption of AI technology and develop strategies accordingly. To summarize, the results of this study highlight the significance of resolving the highlighted elements to improve the intent of higher education institutions to use artificial intelligence. Further investigation should be conducted to examine these aspects, offering practical knowledge for policymakers and educational administrators to promote the effective incorporation of AI in academic environments.

5.3. Practical Implications

The research findings offer higher education institutions looking to adopt AI-enabled technologies several useful takeaways. First, by integrating AI tools with current teaching and learning methods, university administrators should prioritize improving the perceived utility and compatibility of these tools. Adoption rates can be greatly increased by training programs that increase faculty and staff confidence in utilizing AI technologies, especially by addressing issues with usability and complexity. Institutions should also make investments in strong technology infrastructure and guarantee that sufficient resources and support systems are available. Decision-makers at the policy level must take demographic variations into account and create inclusive strategies that encourage adoption by people with a range of educational backgrounds and levels of experience. These doable actions can hasten the effective adoption of AI in settings related to higher education.

Author Contributions

Conceptualization, R.N.A. and O.N.B.; methodology, R.N.A.; software, R.N.A.; validation, R.N.A., O.N.B. and M.A.S.; formal analysis, R.N.A., F.O.; investigation, R.N.A.; resources, R.N.A.; data curation, R.N.A.; writing—original draft preparation, R.N.A.; writing—review and editing, O.N.B., F.O. and M.A.S.; visualization, R.N.A.; supervision, O.N.B.; project administration, O.N.B.; funding acquisition, M.A.S. All authors have read and agreed to the published version of the manuscript.

Funding

This research received no external funding.

Data Availability Statement

The data presented in this study are available on request from the corresponding author. The data are not publicly available due to restrictions related to participant privacy and ethical considerations.

Conflicts of Interest

The authors declare no conflict of interest.

Appendix A

Table A1. Survey Items and Sources.
Construct Item Codes Source
CompatibilityC1–C5Moore and Benbasat (1991) [98]
ComplexityCX1–CX4Rogers (2003) [11]
User Experience (UX)UX1–UX4Zhang and Adipat (2005) [99]
Perceived Ease of UsePEOU1–PEOU3Davis (1989) [14]
User SatisfactionUS1–US6DeLone and McLean (2003) [100]
Performance ExpectationPE1–PE3Venkatesh et al. (2003) [82]
AI Strategic AlignmentAIS1–AIS3Luftman et al. (2004) [101]
Availability of ResourcesAVR1–AVR3Tornatzky and Fleischer (1990) [12]
Competitive PressureCOP1–COP3Zhu and Kraemer (2005) [102]
Government RegulationsGOR1–GOR3Kuan and Chau (2001) [103]
Technological SupportTS1–TS3Ifinedo (2011) [83]
Facilitating ConditionsFC1–FC3Venkatesh et al. (2003) [82]
AI Adoption IntentionsAIA1–AIA3Venkatesh and Bala (2008) [104]

Appendix B

Table A2. List of Abbreviations.
Abbreviation Definition
AIArtificial Intelligence
TAMTechnology Acceptance Model
DOIDiffusion of Innovation
TOETechnology–Organization–Environment
CB-SEMCovariance-Based Structural Equation Modeling
PEOUPerceived Ease of Use
UXUser Experience
USUser Satisfaction
PEPerformance Expectation
AISAI Strategic Alignment
AVRAvailability of Resources
COPCompetitive Pressure
GORGovernment Regulations
TSTechnological Support
FCFacilitating Conditions
AIAAI Adoption Intentions
AVEAverage Variance Extracted
CRComposite Reliability
PUPerceived usefulness
MLEMaximum Likelihood Estimation
PLS-SEMPartial Least Squares Structural Equation Modeling.

References

  1. Volberda, H.W.; Khanagha, S.; Baden-Fuller, C.; Mihalache, O.R.; Birkinshaw, J. Strategizing in a digital world: Overcoming cognitive barriers, reconfiguring routines and introducing new organizational forms. Long Range Plan. 2021, 54, 102110. [Google Scholar] [CrossRef]
  2. Duan, Y.; Edwards, J.S.; Dwivedi, Y.K. Artificial intelligence for decision making in the era of Big Data-evolution, challenges and research agenda. Int. J. Inf. Manag. 2019, 48, 63–71. [Google Scholar] [CrossRef]
  3. Jöhnk, J. Managing digital transformation: Challenges and choices in organizational design and decision-making. Ph.D. Thesis, University of Bayreuth, Bayreuth, Germany,, 2020. [Google Scholar] [CrossRef]
  4. Pillai, R.; Sivathanu, B. Adoption of artificial intelligence (ai) for talent acquisition in it/ites organizations. Benchmarking Int. J. 2020, 27, 2599–2629. [Google Scholar] [CrossRef]
  5. Chatterjee, S.; Ghosh, S.K.; Chaudhuri, R. Knowledge management in improving business process: An interpretative framework for successful implementation of ai-crm-km system in organizations. Bus. Process Manag. J. 2020, 26, 1261–1281. [Google Scholar] [CrossRef]
  6. Bharadiya, J.P. Machine learning and AI in business intelligence: Trends and opportunities. Int. J. Comput. (IJC) 2023, 48, 123–134. [Google Scholar]
  7. Enholm, I.M.; Papagiannidis, E.; Mikalef, P.; Krogstie, J. Artificial intelligence and business value: A literature review. Inf. Syst. Front. 2022, 24, 1709–1734. [Google Scholar] [CrossRef]
  8. Dwivedi, Y.K.; Hughes, L.; Ismagilova, E.; Aarts, G.; Coombs, C.; Crick, T.; Williams, D.M. Artificial Intelligence (AI): Multidisciplinary perspectives on emerging challenges, opportunities, and agenda for research, practice and policy. Int. J. Inf. Manag. 2021, 57, 101994. [Google Scholar] [CrossRef]
  9. Chatterjee, S.; Ghosh, S.K.; Chaudhuri, R.; Chaudhuri, S. Adoption of ai integrated crm system by indian industry: From security and privacy perspective. Comput. Secur. 2020, 29, 1–24. [Google Scholar] [CrossRef]
  10. George, B.; Wooden, O. Managing the strategic transformation of higher education through artificial intelligence. Adm. Sci. 2023, 13, 196. [Google Scholar] [CrossRef]
  11. Rogers, E.M. Diffusion of Innovations; Free Press: New York, NY, USA, 2003. [Google Scholar]
  12. Tornatzky, L.G.; Fleischer, M. The Processes of Technological Innovation; Issues in Organization and Management Series; Lexington Books: Lexington, MA, USA, 1990. [Google Scholar]
  13. Venkatesh, V.; Davis, F.D. A theoretical extension of the technology acceptance model: Four longitudinal field studies. Manag. Sci. 2000, 46, 186–204. [Google Scholar] [CrossRef]
  14. Davis, F.D.; Bagozzi, R.P.; Warshaw, P.R. Technology acceptance model. J. Manag. Sci. 1989, 35, 982–1003. [Google Scholar]
  15. Hair, J.F.; Ringle, C.M.; Sarstedt, M. CB-SEM: Indeed a silver bullet. J. Mark. Theory Pract. 2011, 19, 139–152. [Google Scholar] [CrossRef]
  16. Kline, R.B. Principles and Practice of Structural Equation Modeling; Guilford Press: New York, NY, USA, 2005. [Google Scholar]
  17. Byrne, B.M. Adaptation of assessment scales in cross-national research: Issues, guidelines, and caveats. Int. Perspect. Psychol. 2016, 5, 51–65. [Google Scholar] [CrossRef]
  18. Hu, L.T.; Bentler, P.M. Cutoff criteria for fit indexes in covariance structure analysis: Conventional criteria versus new alternatives. Struct. Equ. Model. Multidiscip. J. 1999, 6, 1–55. [Google Scholar] [CrossRef]
  19. Greenhalgh, T.; Robert, G.; Macfarlane, F.; Bate, P.; Kyriakidou, O. Diffusion of innovations in service organizations: Systematic review and recommendations. Milbank Q. 2004, 82, 581–629. [Google Scholar] [CrossRef]
  20. Bozkurt, A.; Karadeniz, A.; Bañeres, D.; Rodríguez, M.E. Artificial intelligence and reflections from educational landscape: A review of ai studies in half a century. Sustainability 2021, 13, 800. [Google Scholar] [CrossRef]
  21. Crompton, H.; Song, D. El potencial de la inteligencia artificial en la educación superior. Rev. Virtual Univ. Católica Norte 2021, 62, 1–4. [Google Scholar] [CrossRef]
  22. Jain, R.; Garg, N.; Khera, S.N. Adoption of ai-enabled tools in social development organizations in india: An extension of utaut model. Front. Psychol. 2022, 13, 893691. [Google Scholar] [CrossRef]
  23. Popenici, S.; Kerr, S. Exploring the impact of artificial intelligence on teaching and learning in higher education. Technol. Enhanc. Learn. 2017, 12, 22. [Google Scholar] [CrossRef]
  24. Zawacki-Richter, O.; Marín, V.I.; Bond, M.; Gouverneur, F. Systematic review of research on artificial intelligence applications in higher education-where are the educators? Int. J. Educ. Technol. High. Educ. 2019, 16, 39. [Google Scholar] [CrossRef]
  25. Wu, W.; Zhang, B.; Li, S.; Liu, H. Exploring Factors of the Willingness to Accept AI-Assisted Learning Environments: An Empirical Investigation Based on the UTAUT Model and Perceived Risk Theory. Front. Psychol. 2022, 13, 870777. [Google Scholar] [CrossRef] [PubMed]
  26. Hannan, E. Ai: New source of competitiveness in higher education. Compet. Rev. Int. Bus. J. 2021, 33, 265–279. [Google Scholar] [CrossRef]
  27. Chen, L.; Chen, P.; Lin, Z. Artificial intelligence in education: A review. IEEE Access 2020, 8, 75264–75278. [Google Scholar] [CrossRef]
  28. Luckin, R.; Cukurova, M. Designing educational technologies in the age of ai: A learning sciences-driven approach. Br. J. Educ. Technol. 2019, 50, 2824–2838. [Google Scholar] [CrossRef]
  29. Low, C.; Chen, Y.; Wu, M. Understanding the determinants of cloud computing adoption. Ind. Manag. Data Syst. 2011, 111, 1006–1023. [Google Scholar]
  30. Arshad, Y.; Chin, W.P.; Yahaya, S.N.; Nizam, N.Z.; Masrom, N.R.; Ibrahim, S.N.S. Small and medium enterprises’ adoption for e-commerce in Malaysia tourism state. Int. J. Acad. Res. Bus. Soc. Sci. 2018, 8, 1457–1557. [Google Scholar] [CrossRef]
  31. Pillai, R.; Metri, B.A.; Kaushik, N. Students’ adoption of ai-based teacherbots (t-bots) for learning in higher education. Inf. Technol. Amp. People 2023, 37, 328–355. [Google Scholar] [CrossRef]
  32. Paton, C.; Kobayashi, S. An open science approach to artificial intelligence in healthcare. Yearb. Med. Inform. 2019, 28, 47–051. [Google Scholar] [CrossRef]
  33. Tuffaha, M.; Perello-Marin, M.R. Adoption factors of artificial intelligence in human resources management. Future Bus. Adm. 2022, 1, 1–12. [Google Scholar] [CrossRef]
  34. AL-Takhayneh, S.K.; Karaki, W.; Hasan, R.A.; Chang, B.; Shaikh, J.M.; Kanwal, W. Teachers’ psychological resistance to digital innovation in Jordanian entrepreneurship and business schools: Moderation of teachers’ psychology and attitude toward educational technologies. Front. Psychol. 2022, 13, 1004078. [Google Scholar] [CrossRef]
  35. Islam, M.N.; Khan, N.I.; Inan, T.T.; Sarker, I.H. Designing user interfaces for illiterate and semi-literate users: A systematic review and future research agenda. SAGE Open 2023, 13, 21582440231172741. [Google Scholar] [CrossRef]
  36. Ismatullaev, U.V.U.; Kim, S.H. Review of the factors affecting acceptance of ai-infused systems. Hum. Factors J. Hum. Factors Ergon. Soc. 2022, 66, 126–144. [Google Scholar] [CrossRef] [PubMed]
  37. Lee, J.C.; Chen, X. Exploring users’ adoption intentions in the evolution of artificial intelligence mobile banking applications: The intelligent and anthropomorphic perspectives. Int. J. Bank Mark. 2022, 40, 631–658. [Google Scholar] [CrossRef]
  38. Amin, M.; Rezaei, S.; Abolghasemi, M. User satisfaction with mobile websites: The impact of perceived usefulness (PU), perceived ease of use (PEOU) and trust. Nankai Bus. Rev. Int. 2014, 5, 258–274. [Google Scholar] [CrossRef]
  39. Chahal, J.; Rani, N. Exploring the acceptance for e-learning among higher education students in India: Combining technology acceptance model with external variables. J. Comput. High. Educ. 2022, 34, 844–867. [Google Scholar] [CrossRef]
  40. Kuo, Y.C.; Walker, A.E.; Schroder, K.E.; Belland, B.R. Interaction, Internet self-efficacy, and self-regulated learning as predictors of student satisfaction in online education courses. Internet High. Educ. 2014, 20, 35–50. [Google Scholar] [CrossRef]
  41. Zhu, Y.; Wang, R.; Pu, C. “I am chatbot, your virtual mental health adviser.” What drives citizens’ satisfaction and continuance intention toward mental health chatbots during the covid-19 pandemic? An empirical study in china. Digital Health 2022, 8, 20552076221090031. [Google Scholar] [CrossRef]
  42. Dora, M.; Kumar, A.; Mangla, S.K.; Pant, A.; Kamal, M.M. Critical success factors influencing artificial intelligence adoption in food supply chains. Int. J. Prod. Res. 2021, 60, 4621–4640. [Google Scholar] [CrossRef]
  43. Sun, H.; Fang, Y.; Zou, H. Choosing a fit technology: Understanding mindfulness in technology adoption and continuance. J. Assoc. Inf. Syst. 2016, 17, 377–412. [Google Scholar] [CrossRef]
  44. Alalwan, A.A.; Dwivedi, Y.K.; Rana, N.P. Factors influencing adoption of mobile banking by Jordanian bank customers: Extending utaut2 with trust. Int. J. Inf. Manag. 2017, 37, 99–110. [Google Scholar] [CrossRef]
  45. Rasheed, H.M.W.; Yuanqiong, H.; Khizar, H.M.U.; Khalid, J. What drives the adoption of artificial intelligence among consumers in the hospitality sector: A systematic literature review and future agenda. J. Hosp. Tour. Technol. 2024, 15, 211–231. [Google Scholar] [CrossRef]
  46. Tarhini, A.; Masa’deh, R.; Al-Busaidi, K.A.; Mohammed, A.B.; Maqableh, M. Factors influencing students’ adoption of e-learning: A structural equation modeling approach. J. Int. Educ. Bus. 2017, 10, 164–182. [Google Scholar] [CrossRef]
  47. Lee, H.; Lee, S.; Shin, J. An analysis on the satisfaction and perception of performance outcomes of the university information disclosure system. Asia-Pac. J. Educ. Manag. Res. 2020, 5, 49–56. [Google Scholar] [CrossRef]
  48. Henke, J. Navigating the ai era: University communication strategies and perspectives on generative ai tools. J. Sci. Commun. 2024, 23, A05. [Google Scholar] [CrossRef]
  49. Okunlaya, R.O.; Abdullah, N.S.; Alias, R.A. Artificial intelligence (ai) library services innovative conceptual framework for the digital transformation of university education. Libr. Hi Tech 2022, 40, 1869–1892. [Google Scholar] [CrossRef]
  50. Gupta, V.; Gupta, C. Synchronizing innovation: Unveiling the synergy of need-based and curiosity-based experimentation in ai technology adoption for libraries. Libr. Hi Tech News 2023, 40, 15–17. [Google Scholar] [CrossRef]
  51. Sallu, S.; Raehang, R.; Qammaddin, Q. Exploration of artificial intelligence (ai) application in higher education. Archit. High Perform. Comput. 2024, 6, 315–327. [Google Scholar] [CrossRef]
  52. Saidakhror, G. The impact of artificial intelligence on higher education and the economics of information technology. Int. J. Law Policy 2024, 2, 1–6. [Google Scholar] [CrossRef]
  53. Jarrahi, M.H.; Kenyon, S.; Brown, A.; Donahue, C.; Wicher, C. Artificial intelligence: A strategy to harness its power through organizational learning. J. Bus. Strategy 2022, 44, 126–135. [Google Scholar] [CrossRef]
  54. Bearman, M.; Ajjawi, R. Learning to work with the black box: Pedagogy for a world with artificial intelligence. Br. J. Educ. Technol. 2023, 54, 1160–1173. [Google Scholar] [CrossRef]
  55. Greiner, C.; Peisl, T.C.; Höpfl, F.; Beese, O. Acceptance of ai in semi-structured decision-making situations applying the four-sides model of communication-an empirical analysis focused on higher education. Educ. Sci. 2023, 13, 865. [Google Scholar] [CrossRef]
  56. Boonsiritomachai, W.; Mcgrath, G.M.; Burgess, S. Exploring business intelligence and its depth of maturity in Thai SMEs. Cogent Bus. Manag. 2016, 3, 1220663. [Google Scholar] [CrossRef]
  57. Hungund, S.; Mani, V. Benchmarking of factors influencing adoption of innovation in software product SMEs: An empirical evidence from India. Benchmarking Int. J. 2019, 26, 1451–1468. [Google Scholar] [CrossRef]
  58. Alsheibani, S.; Messom, C.; Cheung, Y. Re-Thinking the Competitive Landscape of Artificial Intelligence. In Proceedings of the Hawaii International Conference on System Sciences (HICSS), Maui, HI, USA, 7–10 January 2020; pp. 5861–5870. [Google Scholar]
  59. Porter, M.E.; Millar, V.E. How Information Gives You Competitive Advantage; Routledge: London, UK, 1985. [Google Scholar]
  60. Alghamdi, M.I. Assessing factors affecting intention to adopt AI and ML: The case of the Jordanian retail industry. Period. Eng. Nat. Sci. (PEN) 2020, 8, 2516–2524. [Google Scholar] [CrossRef]
  61. Pan, Y.; Froese, F.; Liu, N. The adoption of artificial intelligence in employee recruitment: The influence of contextual factors. Int. J. Hum. Resour. Manag. 2022, 33, 1125–1147. [Google Scholar] [CrossRef]
  62. Wong, J.W.; Yap, K.H.A. Factors influencing the adoption of artificial intelligence in accounting among micro, small medium enterprises (msmes). Quantum J. Soc. Sci. Humanit. 2024, 5, 16–28. [Google Scholar] [CrossRef]
  63. Ghani, E.K.; Ariffin, N.; Sukmadilaga, C. Factors influencing artificial intelligence adoption in publicly listed manufacturing companies: A technology, organisation, and environment approach. Int. J. Appl. Econ. 2022, 14, 108–117. [Google Scholar] [CrossRef]
  64. Alexander, C.S.; Yarborough, M.; Smith, A. Who is responsible for ‘responsible AI’?: Navigating challenges to build trust in AI agriculture and food system technology. Precis. Agric. 2024, 25, 146–185. [Google Scholar] [CrossRef]
  65. Moon, M.J. Searching for inclusive artificial intelligence for social good: Participatory governance and policy recommendations for making ai more inclusive and benign for society. Public Adm. Rev. 2023, 83, 1496–1505. [Google Scholar] [CrossRef]
  66. Farida, I.; Ningsih, W.; Lutfiani, N.; Aini, Q.; Harahap, E.P. Responsible urban innovation working with local authorities a framework for artificial intelligence (ai). Sci. J. Inform. 2023, 10, 121–126. [Google Scholar] [CrossRef]
  67. Noordt, C.V.; Misuraca, G. Exploratory insights on artificial intelligence for government in Europe. Soc. Sci. Comput. Rev. 2020, 40, 426–444. [Google Scholar] [CrossRef]
  68. Mohsin, F.H.; Isa, N.M.; Ishak, K.; Salleh, H. Navigating the adoption of artificial intelligence in higher education. Int. J. Bus. Technopreneurship (IJBT) 2024, 14, 109–120. [Google Scholar] [CrossRef]
  69. Bai, X. The role and challenges of artificial intelligence in information technology education. Pac. Int. J. 2024, 7, 86–92. [Google Scholar] [CrossRef]
  70. Opesemowo, O.A.G.; Adekomaya, V. Harnessing artificial intelligence for advancing sustainable development goals in south africa’s higher education system: A qualitative study. Int. J. Learn. Teach. Educ. Res. 2024, 23, 67–86. [Google Scholar] [CrossRef]
  71. Polyportis, A. A longitudinal study on artificial intelligence adoption: Understanding the drivers of chatgpt usage behavior change in higher education. Front. Artif. Intell. 2024, 6, 1324398. [Google Scholar] [CrossRef]
  72. Eftimov, L.; Kitanovikj, B. Unlocking the path to ai adoption: Antecedents to behavioral intentions in utilizing ai for effective job (re)design. J. Hum. Resour. Manag.-HR Adv. Dev. 2023, 2023, 123–134. [Google Scholar] [CrossRef]
  73. Tanantong, T.; Wongras, P. A utaut-based framework for analyzing users’ intention to adopt artificial intelligence in human resource recruitment: A case study of thailand. Systems 2024, 12, 28. [Google Scholar] [CrossRef]
  74. Morrison, K. Artificial intelligence and the nhs: A qualitative exploration of the factors influencing adoption. Future Healthc. J. 2021, 8, 648–654. [Google Scholar] [CrossRef]
  75. Chen, H.; Li, L.; Chen, Y. Explore success factors that impact artificial intelligence adoption on telecom industry in china. J. Manag. Anal. 2020, 8, 36–68. [Google Scholar] [CrossRef]
  76. Chen, C.; Chen, S.; Khan, A.; Lim, M.K.; Tseng, M. Big data analytics-artificial intelligence and supply chain ambidexterity impacts on corporate image and green communication. Ind. Manag. Data Syst. 2024, 124, 2899–2918. [Google Scholar] [CrossRef]
  77. Bughin, J. Does artificial intelligence kill employment growth: The missing link of corporate ai posture. Front. Artif. Intell. 2023, 6, 1239466. [Google Scholar] [CrossRef] [PubMed]
  78. Govindan, K. How artificial intelligence drives sustainable frugal innovation: A multitheoretical perspective. IEEE Trans. Eng. Manag. 2024, 71, 638–655. [Google Scholar] [CrossRef]
  79. Horani, O.M.; Al-Adwan, A.S.; Yaseen, H.; Hmoud, H.; Al-Rahmi, W.M.; Alkhalifah, A. The critical determinants impacting artificial intelligence adoption at the organizational level. Inf. Dev. 2023, 02666669231166889. [Google Scholar] [CrossRef]
  80. Faul, F.; Erdfelder, E.; Buchner, A.; Lang, A.-G. Statistical power analyses using G*Power 3.1: Tests for correlation and regression analyses. Behav. Res. Methods 2009, 41, 1149–1160. [Google Scholar] [CrossRef]
  81. Wut, T.M.; Chan, E.A.H.; Wong, H.S.M.; Chan, J.K. Perceived artificial intelligence literacy and employability of university students. Educ. + Train. 2025, 67, 258–274. [Google Scholar] [CrossRef]
  82. Venkatesh, V.; Morris, M.G.; Davis, G.B.; Davis, F.D. User acceptance of information technology: Toward a unified view. MIS Q. 2003, 27, 425–478. [Google Scholar] [CrossRef]
  83. Ifinedo, P. Internet/e-business technologies acceptance in Canada’s SMEs: An exploratory investigation. Internet Res. 2011, 21, 255–281. [Google Scholar] [CrossRef]
  84. Al-Gahtani, S.S. Modeling the electronic transactions acceptance using an extended technology acceptance model. Appl. Comput. Inform. 2011, 9, 47–77. [Google Scholar] [CrossRef]
  85. Camisón, C.; Villar-López, A. Non-technical innovation: Organizational memory and learning capabilities as antecedent factors with effects on sustained competitive advantage. Ind. Mark. Manag. 2011, 40, 1294–1304. [Google Scholar] [CrossRef]
  86. Harwood, S.; Eaves, S. Conceptualising technology, its development and future: The six genres of technology. Technol. Forecast. Soc. Change 2020, 160, 120174. [Google Scholar] [CrossRef]
  87. Chang, H.C. A new perspective on Twitter hashtag use: Diffusion of innovation theory. Proc. Am. Soc. Inf. Sci. Technol. 2010, 47, 1–4. [Google Scholar] [CrossRef]
  88. Ciftci, S.K.; Gok, R.; Karadag, E. Acceptance and use of the distance education systems of Turkish medical educators during COVID-19 pandemic: An analysis of contextual factors with the UTAUT2. BMC Med. Educ. 2023, 23, 36. [Google Scholar] [CrossRef] [PubMed]
  89. Priyadarshinee, P.; Raut, R.D.; Jha, M.K.; Gardas, B.B. Understanding and predicting the determinants of cloud computing adoption: A two staged hybrid SEM-Neural networks approach. Comput. Hum. Behav. 2017, 76, 341–362. [Google Scholar] [CrossRef]
  90. Park, Y.J.; Jeong, Y.J.; An, Y.S.; Ahn, J.K. Analyzing the Factors Influencing the Intention to Adopt Autonomous Ships Using the TOE Framework and DOI Theory. J. Navig. Port Res. 2022, 46, 134–144. [Google Scholar]
  91. Ahmad, S.; Miskon, S.; Alkanhal, T.A.; Tlili, I. Modeling of business intelligence systems using the potential determinants and theories with the lens of individual, technological, organizational, and environmental contexts—A systematic literature review. Appl. Sci. 2020, 10, 3208. [Google Scholar] [CrossRef]
  92. Beshdeleh, M.; Angel, A.; Bolour, L. Adoption of EBET Agency’s Cloud Casino Software by Using TOE and DOI Theory as a Solution for Gambling Website. J. Innov. Bus. Res. 2020, 116, 100–119. [Google Scholar]
  93. Qasem, Y.A.; Abdullah, R.; Yah, Y.; Atan, R.; Al-Sharafi, M.A.; Al-Emran, M. Towards the development of a comprehensive theoretical model for examining the cloud computing adoption at the organizational level. Recent Adv. Intell. Syst. Smart Appl. 2021, 295, 63–74. [Google Scholar]
  94. Bollen, K.A. Structural Equations with Latent Variables; John Wiley & Sons: Hoboken, NJ, USA, 2014. [Google Scholar]
  95. Henseler, J.; Ringle, C.M.; Sarstedt, M. A New Criterion for Assessing Discriminant Validity in Variance-based Structural Equation Modeling. J. Acad. Mark. Sci. 2015, 43, 115–135. [Google Scholar] [CrossRef]
  96. Sharma, S.; Mukherjee, S.; Kumar, A.; Dillon, W.R. A simulation study to investigate the use of cutoff values for assessing model fit in covariance structure models. J. Bus. Res. 2005, 58, 935–943. [Google Scholar] [CrossRef]
  97. Brown, T.A. Confirmatory Factor Analysis for Applied Research; Guilford Publications: New York, NY, USA, 2015. [Google Scholar]
  98. Moore, G.C.; Benbasat, I. Development of an instrument to measure the perceptions of adopting an information technology innovation. Inf. Syst. Res. 1991, 2, 192–222. [Google Scholar] [CrossRef]
  99. Zhang, D.; Adipat, B. Challenges, methodologies, and issues in the usability testing of mobile applications. Int. J. Hum.-Comput. Interact. 2005, 18, 293–308. [Google Scholar] [CrossRef]
  100. DeLone, W.H.; McLean, E.R. The DeLone and McLean model of information systems success: A ten-year update. J. Manag. Inf. Syst. 2003, 19, 9–30. [Google Scholar]
  101. Luftman, J.; Kempaiah, R.; Nash, E. Key issues for IT executives 2005. MIS Q. Exec. 2006, 5, 81–99. [Google Scholar]
  102. Zhu, K.; Kraemer, K.L. Post-adoption variations in usage and value of e-business by organizations: Cross-country evidence from the retail industry. Inf. Syst. Res. 2005, 16, 61–84. [Google Scholar] [CrossRef]
  103. Kuan, K.K.Y.; Chau, P.Y.K. A perception-based model for EDI adoption in small businesses using a technology–organization–environment framework. Inf. Manag. 2001, 38, 507–521. [Google Scholar] [CrossRef]
  104. Venkatesh, V.; Bala, H. Technology acceptance model 3 and a research agenda on interventions. Decis. Sci. 2008, 39, 273–315. [Google Scholar] [CrossRef]
Figure 1. The study model.
Computers 14 00230 g001
Figure 2. Final best-fitting CFA model.
Computers 14 00230 g002
Figure 3. The CB-SEMmodel for the hypothesis.
Computers 14 00230 g003
Table 1. Sample Demographic Information.
VariableCategoryCountPercent
GenderMale18751
Female18049
Other--
Total367100
Age18–245515
25–337119.3
34–4417547.7
45–544010.9
55–65267.1
66 and older--
Total367100
ResidenceTürkiye7119.4
USA19252.3
Canada10428.3
Total367100
EducationDiploma degree--
Bachelor’s degree4612.5
Master’s degree10428.3
PhD21759.2
Total367100
Educational MajorIT13637.1
Management7420.1
Accounting41.1
Medicine226
Pharmaceutical113
Other12032.7
Total367100
Work ExperienceLess than 2 years5815.8
2 years–less than 6 years7821.3
6 years–less than 8 years256.8
8 years–less than 10 years4211.4
10 years and above16444.7
Total367100
How long have you been using AI tools or apps?Less than 6 months9425.6
6 months–less than 1 year5515
1 year–less than 2 years4813.1
2 years and more17046.3
Total367100
Where do you most use your preferred AI tool (which type of operating system do you use)?Windows PC26973.3
Mac OS (Mac Book)246.5
Android (Samsung, Sony, HTC, LG, Motorola…etc.)195.2
iOS (iPhone)4612.5
Tablet20.5
Other71.9
Total367100
Table 2. Frequencies and percentages.
CategoryCountPercent
ChatGPT27474.7
QuillBot13536.8
Grammarly24867.6
Scholarcy369.8
Scite4311.7
pdf.ai6818.5
Other246.5
Table 3. Frequencies and Percentages of Management Support.
CategoryCountPercent
Conferences7821.3
Workshops10829.4
Training12834.9
All of the above8322.6
Other6918.8
Table 4. Frequencies and Percentages Resources That Believeed to Support the Adoption.
CategoryCountPercent
Application processes7019.1
Collaboration strategies5615.3
IT development plans8523.2
technical knowledge/skills9726.4
All of the above17748.2
Other92.5
Table 5. Frequencies and Percentages of Assisted Offenders by State Authorities.
CategoryCountPercent
Social attitudes about morals and ethical concerns9726.4
Offer guidelines for the development of AI applications7119.3
Protect Privacy and Ownership rights12333.5
All of the above10328.1
Other4813.1
Table 6. Frequencies and Percentages Technological Support.
CategoryCountPercent
Supportive AI in-house software.8924.3
Adoptive operating systems that support AI.7420.2
Supportive AI in-house Network.7520.4
Not yet there, none of the above.17547.7
Other82.2
Table 7. Confirmatory factor analysis results (factor loading).
Latent VariableIndicatorFLFLSAVE
(>0.50)
CR
(>0.70)
Cronbach’s
Alpha
CompatibilityC10.820.6720.5850.8750.883
C20.6630.440
C30.8310.691
C40.7650.585
C50.7320.536
ComplexityCX10.8730.7620.5740.8430.867
CX20.6980.487
CX30.7530.567
CX40.6940.482
User User ExperienceUX10.8670.7520.6970.9020.938
UX20.8390.704
UX30.8480.719
UX40.7840.615
Ease of UsePEOU10.8740.7640.5850.8070.821
PEOU20.7210.520
PEOU30.6870.472
User SatisfactionUS10.7630.5820.6150.9050.95
US20.7210.520
US30.7380.545
US40.8650.748
US50.8320.692
US60.7780.605
Performance ExpectationPE10.7570.5730.6640.8550.881
PE20.8110.658
PE30.8720.760
AI Strategic AlignmentAIS10.8340.6960.5730.800.835
AIS20.7570.573
AIS30.6710.450
Availability of ResourcesAVR10.7040.4960.6140.8260.862
AVR20.7850.616
AVR30.8540.729
Competitive PressureCOP10.7160.5130.5550.7890.817
COP20.7650.585
COP30.7540.569
Government RegulationsGOR10.7840.6150.5280.770.814
GOR20.6820.465
GOR30.7110.506
Technological SupportTS10.6210.3860.5120.7570.805
TS20.7450.555
TS30.7720.596
Facilitating ConditionsFC10.8570.7340.7090.880.913
FC20.8230.677
FC30.8460.716
AI Adoption IntentionsAIA10.8440.7120.7140.8820.929
AIA20.8560.733
AIA30.8340.696
FL = Factor Loading, FLS = Factor Loading Squared, AVE = Average Variance Extracted, CR = Composite Reliability. Refer to Appendix B for the full list of abbreviations.
Table 8. HTTP analysis.
CCXUXPEOUUSPEAINTAISAVRCOPGORTS
C
CX0.722
UX0.8150.834
PEOU0.7720.7850.822
US0.6240.5230.6130.561
PE0.7950.7930.7520.7840.712
AINT0.6610.6990.7710.6930.7340.653
AIS0.5340.5120.5350.4530.5970.4910.482
AVR0.5140.5430.5330.6180.4990.4870.6670.559
COP0.7320.7020.6880.7250.6940.5960.7380.6440.723
GOR0.5040.4780.4680.5740.4890.5550.5730.5130.4970.533
TS0.7060.6650.6240.7180.6770.6490.7460.7280.6250.7290.634
FC0.7830.7980.8090.7390.770.7590.610.8120.7990.6750.7550.822
Table 9. Final measurements of model fit.
X251.213
X2/DF5.12
SRMR0.037
CFI0.951
TLI0.924
NFI0.958
IFI0.958
RMSEA0.07
Table 10. Structural equation modelling regression weights.
EstimateS.E.C.R.pResult
H1aCAIA0.3420.0546.876***Not Supported
H1bCXAIA0.2680.0446.085***Supported
H1cUXAIA0.4210.0588.154***Not Supported
H1dPEOUAIA0.3320.0457.382***Supported
H1eUSAIA0.2160.0464.672***Supported
H1fPEAIA0.1860.0434.3120.001Supported
H1gAINTAIA0.7660.03323.519***Supported
H1hAISAIA0.1000.0313.2630.003Supported
H1iAVRAIA0.1220.0225.587***Supported
H1jCOPAIA0.0720.0351.0040.421Not Supported
H1kGORAIA0.0080.0290.7430.785Not Supported
H1lTSAIA0.5510.0348.581***Not Supported
H1mFCAIA0.9640.03925.000***Supported
S.E. = Standard errors of the regression weights, C.R. = Critical Ratio, p = p-value (*** < 0.001).
Table 11. Multiple-group SEM analysis results for gender model.
Model Structural Weights
DF1
CMIN0.455
p0.491
NFI Delta-10.002
IFI Delta-20.002
Table 12. Multiple-group SEM analysis results for age model.
Model Structural Weights
DF2
CMIN1.279
p0.322
NFI Delta-10.009
IFI Delta-20.009
Table 13. Multiple-group SEM analysis results for education model.
Model Structural Weights
DF2
CMIN4.624
p0.099
NFI Delta-10.017
IFI Delta-20.017
Table 14. Multiple-group SEM analysis results for major model.
Model Structural Weights
DF4
CMIN12.939
p0.012
NFI Delta-10.053
IFI Delta-20.053
Table 15. Structural Equation Modelling Regression Weights of AI Key Factors.
EstimateS.E.C.R.pEffectR2
AI Key Factors
(Less than 2 years)
AIA0.6060.2222.7260.0060.3390.115
AI Key Factors
(2 years–less than 6 years)
AIA1.1360.1457.839***0.6660.444
AI Key Factors
(6 years–less than 8 years)
AIA1.4810.2735.429***0.7380.544
AI Key Factors
(8 years–less than 10 years)
AIA1.3660.09813.886***0.9070.823
AI Key Factors
(10 years and above)
AIA1.1950.08014.890***0.7600.578
S.E. = Standard errors of the regression weights, C.R. = Critical Ratio, p = p-value (*** < 0.001).
Table 16. Multiple-group SEM analysis results for experience model.
EstimateS.E.C.R.pEffectR2
AI Key Factors (IT)AIA1.0530.09511.110***0.6920.479
AI Key Factors (Management)AIA1.5760.2017.829***0.6760.456
AI Key Factors (Medicine)AIA0.2190.3380.6480.5170.1380.019
AI Key Factors (Pharmaceutical)AIA1.2750.4223.0170.0030.6750.456
AI Key Factors (Other)AIA1.2500.09712.890***0.7640.584
S.E. = Standard errors of the regression weights, C.R. = Critical Ratio, p = p-value (*** < 0.001).
Table 17. Structural equation modelling regression weights.
Model Structural Weights
DF4
CMIN10.625
p0.03
NFI Delta-10.038
IFI Delta-20.038
Disclaimer/Publisher’s Note: The statements, opinions and data contained in all publications are solely those of the individual author(s) and contributor(s) and not of MDPI and/or the editor(s). MDPI and/or the editor(s) disclaim responsibility for any injury to people or property resulting from any ideas, methods, instructions or products referred to in the content.

