1. Introduction
Thailand is endowed with abundant natural freshwater resources, comprising 25 major basins and 254 sub-basins, which include rivers, tributaries, reservoirs, canals, creeks, marshes, and manmade water bodies spanning approximately 511,361 square kilometers. These water sources are critical for the livelihoods of communities, where agriculture and fishing are key occupations, with some relying on fishing as their primary source of income. In 2020, freshwater fish catches totaled 112,727.31 tons, accounting for 96.47% of all aquatic animals caught and valued at 6754.98 million baht, or 90.50% of total aquatic value. Species such as carp, tilapia, and white-tailed fish dominated the catch, significantly contributing to the economy. Kalasin Province, home to the Lam Pao Dam, one of Thailand’s largest earthen reservoirs, exemplifies the role of freshwater resources in supporting agriculture, fisheries, and tourism. Communities surrounding the dam depend on fish harvesting and processed fish products like dried fish, fermented fish, fish roe sausage and fermented fish paste, which play a vital role in meeting growing market demands. However, the labor-intensive nature of fish sorting poses challenges due to its time-consuming and inconsistent processes, leading to increased costs and limiting production scalability. These limitations underscore the need for innovative, automated solutions to improve sorting efficiency and fish freshness evaluation. Traditional methods, such as sensory evaluations and biochemical analyses, are effective yet impractical for large-scale operations. Consequently, the adoption of artificial intelligence, particularly deep learning models, has gained attention as a viable method for enhancing fish quality assessment, addressing both economic and operational challenges [
1].
Deep learning methodologies, particularly Convolutional Neural Networks (CNNs), have demonstrated exceptional accuracy in image-based classification tasks, making them highly suitable for assessing fish freshness through visual analysis. These models process complex patterns and features in image datasets, offering a scalable and automated solution for quality assessment, particularly in the seafood industry. Yasin et al. [
2] proposed a novel framework integrating deep learning for feature extraction (SqueezeNet, InceptionV3) with traditional machine learning models such as Support Vector Machines (SVM) and Artificial Neural Networks (ANN). Their objective was to automate fish freshness evaluation, historically performed through manual sensory assessment. By leveraging a large dataset of Nile Tilapia images, their method achieved nearly 100% accuracy, surpassing previous classification techniques. While their framework provides a cost-effective and reliable approach, the authors recommend future research to refine the model by incorporating additional features such as gill color and texture to enhance classification robustness and generalizability. Similarly, Rayan et al. [
3] developed a hybrid deep learning framework combining VGG16-based feature extraction with a BiLSTM layer to classify fish freshness. Their model, trained on a dataset of 4000 Nile Tilapia images, attained a high accuracy rate of 98%, outperforming earlier methods that relied solely on machine learning or traditional image processing. The study highlights the importance of dataset diversity and suggests the inclusion of additional fish attributes such as eye clarity and skin texture to improve classification accuracy. The authors also propose the adoption of retrainable architecture to enhance model adaptability for large-scale fisheries and export-driven operations. In another advancement, Hu et al. [
4] introduced a low-cost, portable image acquisition system integrated with a Faster R-CNN deep learning model to classify squid species and assess their freshness levels. Their approach, which identifies three common squid species, Loligo beka, Todarodes pacificus, and Ommastrephes bartramii, demonstrated an accuracy exceeding 85%. The study addresses the labor-intensive nature of manual seafood classification and incorporates color-based threshold segmentation to monitor spoilage progression. However, limitations such as the system’s dependence on consistent lighting conditions and well-annotated datasets suggest further improvements are necessary for real-world applications in seafood processing environments. Anas et al. [
5] employed a deep learning approach using Tiny YOLOv2 to classify fish freshness into three quality levels: good, medium, and poor. Using a dataset of 3378 fish images from three species (Rastrelliger, Euthynnus affinis, and Chanos chanos), their model achieved an average precision of 72.9% and an overall accuracy of 57.5%, indicating the need for further dataset enhancement and refined classification methods. The study acknowledges challenges such as dataset imbalance, variability in image conditions, and the subjectivity of traditional organoleptic assessments. The authors recommend future work to expand dataset size, integrate more fish species, and refine deep learning models to achieve higher classification reliability. Suharto et al. [
6] explored MobileNet V1 for the classification of freshwater fish species, including Tilapia, Carp, and Pomfret. Using a dataset of 700 images sourced online and augmented through rotation-based techniques, their model achieved 90% accuracy. While lightweight and efficient for mobile deployment, dataset biases and misclassification errors were noted as potential drawbacks. Future research should focus on incorporating real-world image datasets and refining preprocessing techniques to enhance classification precision and enable real-time deployment in aquaculture monitoring. Beyond fish classification, deep learning applications have been extended to agricultural and marine biodiversity studies [
7]. Yang et al. [
8] introduced a self-supervised multi-network fusion classification model (LFC-Net) for diagnosing common strawberry diseases, achieving a classification accuracy of 92.48%. Similarly, Villon et al. [
9] demonstrated the superiority of CNN-based classification over traditional Histogram of Oriented Gradients (HOG) and SVM models in identifying coral reef fish species. Their study highlighted CNNs’ ability to handle occlusions, background clutter, and species variability, making them valuable tools for marine biodiversity research. Additional research by Yudhana et al. [
10] explored machine learning-based classification of fish freshness using k-Nearest Neighbor (k-NN) and Naïve Bayes (NB) classifiers. Their study utilized fisheye images to extract RGB and Grey Level Co-occurrence Matrix (GLCM) features, achieving an accuracy of 97% with k-NN and 94% with NB. While demonstrating promising results, the study noted dataset limitations and potential biases due to controlled image acquisition settings. Future work suggests expanding dataset diversity, incorporating real-world variations, and developing mobile-based freshness detection systems to enhance practical applicability. Sanga et al. [
11] developed a modified ResNeXt CNN model for fish freshness classification, achieving 84% accuracy. Their study, based on a dataset of 60 large yellow croakers stored on ice, highlights the challenge of detecting early-stage freshness degradation through visual cues. Future work should focus on increasing dataset diversity and refining classification techniques to improve performance across different storage conditions and time intervals. Hasan et al. [
12] proposed a Mask R-CNN-based system for automating fish freshness evaluation, achieving 96.5% accuracy. Their system integrates robotic sorting mechanisms to remove defective fish from processing lines and includes a real-time monitoring web interface for quality control. Despite its high performance, the study identifies challenges related to dataset representation, interspecies variations, and real-time industrial deployment. Future enhancements should focus on expanding dataset diversity, optimizing robotic sorting efficiency, and integrating multimodal sensor technology to improve classification robustness.
Deep learning models, particularly Convolutional Neural Networks (CNNs), have demonstrated exceptional accuracy in image-based classification tasks, making them highly effective for fish freshness assessment. Various studies have explored different CNN architectures, including ResNeXt, SqueezeNet, InceptionV3, VGG16, and MobileNet, to evaluate fish quality based on visual characteristics. While models such as ResNeXt and Faster R-CNN achieve superior accuracy, lightweight architectures like MobileNet V1 offer a more practical solution for real-time applications due to their reduced computational complexity [
13]. However, challenges remain, including dataset limitations, environmental variations, and model scalability. To address these challenges, this study aims to evaluate deep learning models for assessing the freshness of Barbonymus gonionotus (Silver Barb), a commercially significant species in Thailand. Given the high processing volume in community-based fish enterprises, the research focuses on integrating deep learning models into an automated fish quality sorting machine to enhance operational efficiency and scalability. The proposed system is designed for real-world deployment, where fast processing speed (fps) and high classification accuracy are essential for effective and precise sorting.
The Technique for Order Preference by Similarity to Ideal Solution (TOPSIS), a multi-criteria decision-making (MCDM) method, offers a robust framework for addressing this challenge. By comparing alternatives based on their relative proximity to an ideal solution, TOPSIS enables a balanced and objective evaluation of models using multiple performance criteria such as accuracy, processing time, and computational cost [
14]. For instance, Das [
15] employs advanced computational techniques to evaluate the water quality of the Mahanadi River, highlighting significant pollution from agricultural and industrial activities, with Bayesian, AHP-TOPSIS, MOORA, and RF models achieving 89% accuracy. Similarly, Dey et al. [
16] applied TOPSIS in the agricultural sector, demonstrating its capability to prioritize decision-making for sustainable farming. In the context of supply chains, Huo et al. [
17] introduced an MCDM model incorporating TOPSIS to evaluate fresh food suppliers, focusing on quality and consistency. Meanwhile, Kalimuthu et al. [
18] developed intelligent decision-making frameworks integrating TOPSIS to improve efficiency in agriculture supply chains. Additionally, Supriya and Gadekallu [
19] provided a comprehensive survey on hybrid fuzzy TOPSIS models, highlighting their potential in federated learning applications. For industrial and logistics evaluations, Rishabh and Das [
20] explored Grey-TOPSIS methods for biomass energy selection, presenting significant advancements in MCDM applications. Maharani et al. [
21] utilize SWARA and TOPSIS to enhance the selection process for e-commerce promotional products, emphasizing price, product listing, and rating as critical factors, with Soundcore, Lenovo, and Xiaomi emerging as the top-ranked choices. Furthermore, Demircan and Özcan [
22] demonstrated the utility of fuzzy TOPSIS in warehouse location selection, emphasizing its role in optimizing freshness and logistics in cold chain management. Recent research by Seyam et al. [
23] applied TOPSIS alongside VIKOR models to enhance food supply chain resilience, showcasing its ability to reduce waste while maintaining freshness. Lastly, Yadav et al. [
24] utilized TOPSIS for performance measurement in agro-food supply chains, reinforcing its effectiveness for trade-off analysis and optimal decision making.
Recently, the TOPSIS linear programming model introduced by To-On et al. [
25] simplifies the conventional TOPSIS method. Based on Wichapa et al.’s Relative Closeness Coefficient model [
26], it retains TOPSIS principles while improving efficiency and usability. By reducing steps, it minimizes calculation errors and handles large datasets effectively, making it suitable for various applications in fields such as logistics, healthcare, and engineering. The model’s ability to integrate diverse criteria and its computational efficiency make it a practical tool for solving real-world decision-making problems. This novel method has gained recognition through its applications in multiple studies [
27,
28,
29,
30]. Its user-friendly nature ensures easy adoption, allowing experts and non-experts alike to apply it successfully. Furthermore, its versatility across industries highlights its potential as a universal solution for decision-making challenges. This significant advancement bridges theoretical frameworks with practical implementation, enhancing its relevance and value in addressing complex problems.
This study aims to evaluate deep learning models for assessing the freshness of Barbonymus gonionotus (Silver Barb), a species of significant economic importance in Thailand. Given the high volume of fish processed by community enterprises, the research focuses on integrating deep learning models into an automated fish quality sorting machine to enhance efficiency and scalability. The machine is designed for real-world deployment, where fast processing speed (fps) and classification accuracy are critical for effective sorting. To achieve this, three lightweight deep learning models, MobileNetV2, MobileNetV3, and EfficientNet Lite2, are explored to optimize computational efficiency while maintaining high classification performance.
To systematically assess the models’ performance, 18 candidate alternatives were derived by combining the following:
Model Type: MobileNetV2 (M1), MobileNetV3 (M2), and EfficientNet Lite2 (M3).
Model Size: Small (S), Medium (M), and Large (L).
Data Processing Method: With Preprocessing (P) and Without Preprocessing (NP).
These 18 alternatives were then evaluated using the TOPSIS-LP method, which ranks each configuration based on multiple performance criteria, including processing speed, classification accuracy, and computational efficiency. The ultimate goal is to identify the most optimal model configuration for real-world implementation in fish quality sorting systems.
The main contributions of this paper can be summarized as follows:
Evaluation and Optimization of Deep Learning Models for Fish Freshness Assessment: This study systematically evaluates and optimizes three lightweight deep learning architectures, MobileNetV2, MobileNetV3, and EfficientNet Lite2, across 18 different configurations. The study finds the best model for real-time fish freshness classification by testing different preprocessing methods (with and without preprocessing) and model sizes (small, medium, and large). The evaluation focuses on finding the best balance between classification accuracy, inference speed, and computational efficiency. This makes sure that the models work well and can be used in places with limited resources.
Integration of YOLOv8 for image preprocessing: To enhance the accuracy and robustness of fish freshness classification, this study incorporates YOLOv8 for object detection and image preprocessing. This technique improves the quality of input images by eliminating background noise, cropping images to standardized dimensions, and refining feature extraction. As a result, the models are better able to distinguish subtle visual cues related to fish freshness, leading to more reliable classification results compared to raw image inputs.
Application of Multi-Criteria Decision-Making (MCDM) Using TOPSIS-LP: The study employs the Technique for Order Preference by Similarity to Ideal Solution with Linear Programming (TOPSIS-LP) to rank the 18 model configurations based on multiple performance criteria, including classification accuracy, inference speed, and computational efficiency. By integrating a structured decision-making framework, the research provides a systematic approach to identifying the most optimal deep learning model, ensuring that the selected configuration balances performance and computational feasibility.
Identification of the Optimal Model Configuration for Deployment: The results of the evaluation indicate that the MobileNetV3 model with a large parameter size and preprocessing (M2-PL-P) achieves the highest performance, with 98.33% classification accuracy and an inference speed of 6.95 frames per second (fps). This model configuration is recommended for real-world deployment in automated fish quality sorting systems, providing an effective solution that maintains both speed and accuracy in processing high volumes of fish.
Practical Contribution to Fishery-Based Community Enterprises: This study contributes to the practical implementation of AI-driven fish quality assessment in fishery-based community enterprises. By automating fish freshness evaluation, the research improves sorting efficiency, reduces reliance on manual labor, and supports scalable fish processing operations. The proposed solution not only enhances the productivity of local fisheries but also promotes sustainable and technology-driven approaches to fish quality control in real-world applications.
The remainder of this article is organized as follows:
Section 2 describes the materials and methods, detailing the dataset collection, preprocessing techniques, model configurations, training procedures, and the application of the TOPSIS-LP method for model selection.
Section 3 presents the results, providing key findings from the evaluation of the 18 candidate models.
Section 4 offers a comparative analysis of the experimental results, discussing model performance, ranking outcomes, and the implications of preprocessing and model variations. Finally,
Section 5 concludes the study by summarizing the key findings, highlighting their significance for fishery-based enterprises, and outlining potential directions for future research and improvements in AI-driven fish quality assessment.
2. Materials and Methods
This section presents the methodology for evaluating deep learning models in fish freshness assessment, encompassing data collection, preprocessing, model selection, and performance evaluation. Images of Silver Barb were systematically collected from the Lam Pao Dam in Kalasin Province, Thailand, using a 2K QHD high-resolution webcam, with samples categorized into three freshness levels. Two preprocessing approaches were employed: one using raw images and the other integrating YOLOv8 for automatic fish detection, cropping to 224 × 224 pixels, and background noise removal. Three lightweight CNN models, MobileNetV2, MobileNetV3, and EfficientNet Lite2, were trained under 18 different configurations, combining model type, size (small, medium, large), and preprocessing method (with/without preprocessing) to optimize computational efficiency and classification accuracy. Model evaluation focused on classification accuracy, inference speed, and computational efficiency, with the TOPSIS-LP method applied to rank the models and select the most suitable configuration for real-world deployment in an automated fish quality sorting machine. This comprehensive methodology ensures a balanced approach to maximizing accuracy and processing speed, addressing the practical needs of fishery-based community enterprises. The framework for this study is shown in
Figure 1.
2.1. Data Collection
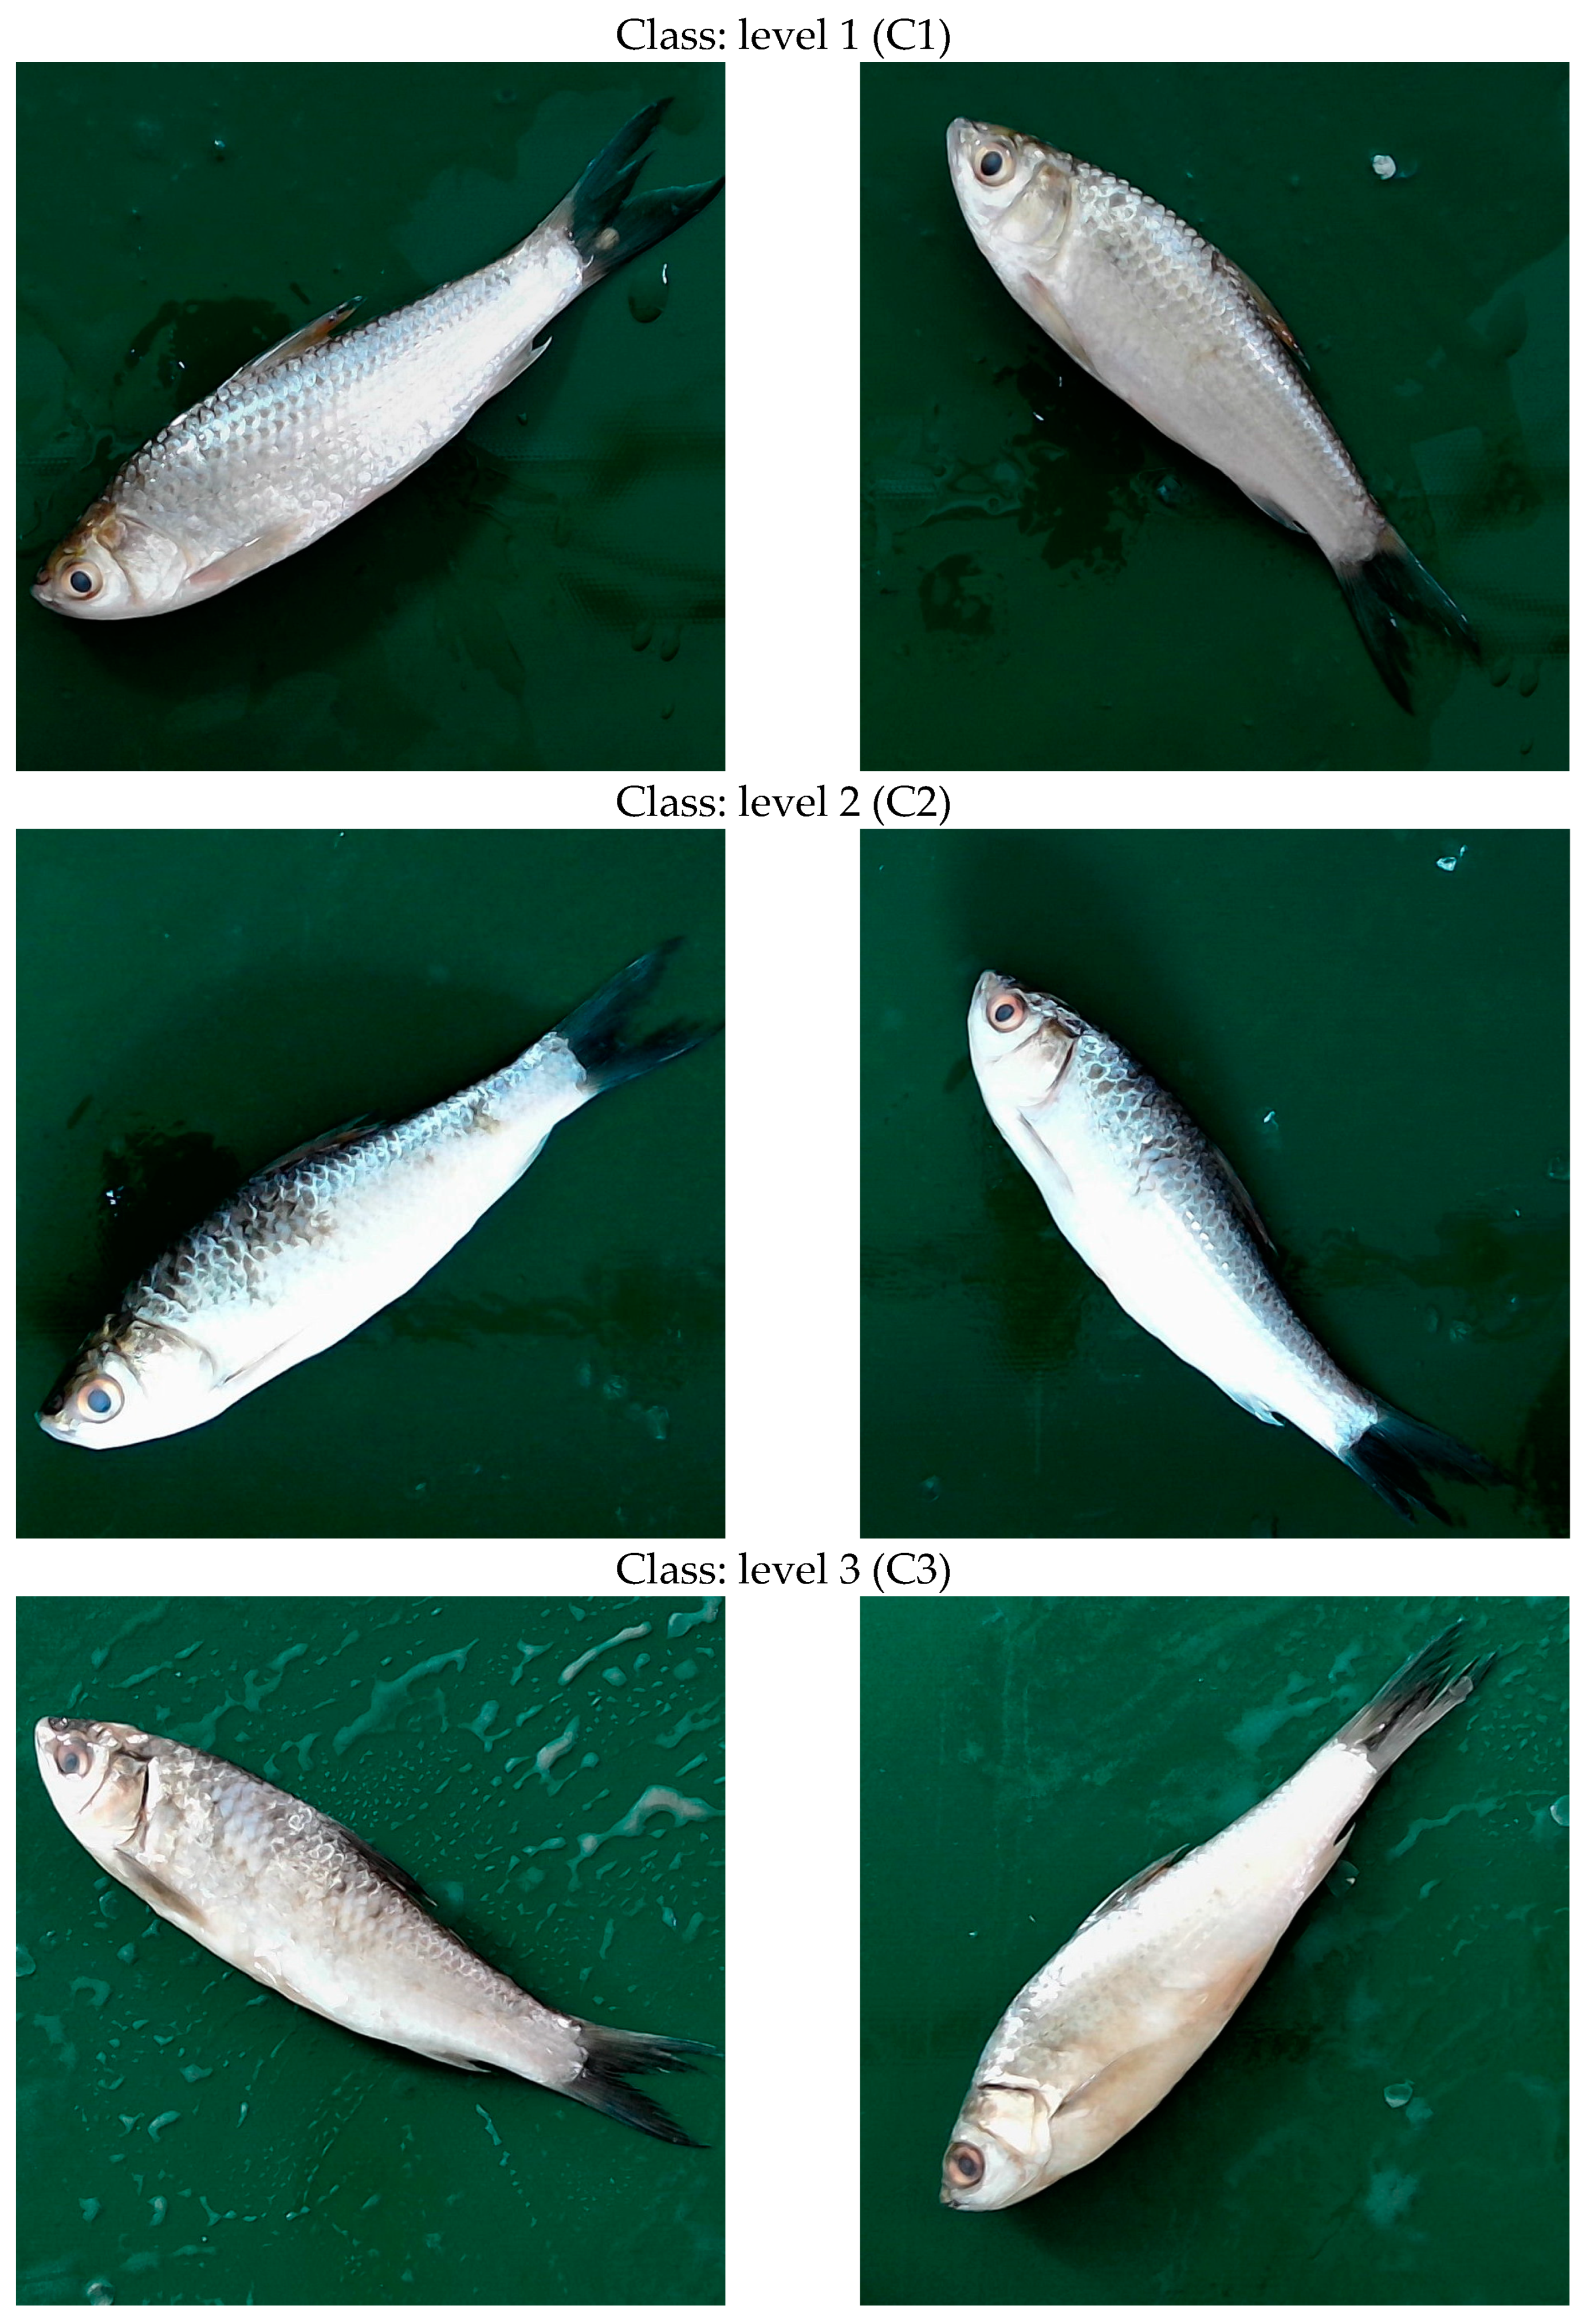
This study involved the systematic collection of Silver Barb images from the Lam Pao Dam in Kalasin Province, Thailand, forming a comprehensive dataset for fish freshness classification. Images were categorized into three freshness levels: C1 (1–2 days, optimal freshness), C2 (3–4 days, moderate freshness), and C3 (5–6 days, significant degradation). A 2K QHD high-resolution webcam was used for image acquisition, ensuring clarity in texture, color, and structural integrity, with standardized lighting and noise reduction techniques applied for consistency. The final dataset consisted of 1200 high-resolution images (1920 × 1080 pixels), evenly distributed across three categories (400 per class) to minimize bias and ensure fair model evaluation. This balanced and high-quality dataset served as a robust foundation for training deep learning models, enabling accurate assessment of classification performance and comprehensive analysis of freshness impacts on fish quality.
Figure 2 showcases representative samples for each category: C1 displays vibrant color and intact texture, indicating optimal freshness; C2 presents slight dullness and minor texture changes, reflecting moderate freshness; and C3 shows visible degradation, characterized by faded color and roughened texture, signifying diminished freshness. This detailed categorization facilitates precise model training and evaluation, enhancing the accuracy and reliability of freshness classification.
2.2. Data Preprocessing
In this study, two distinct data preprocessing strategies were adopted to optimize the classification of fish freshness: Without Preprocessing and With Preprocessing.
Under this approach, raw images were employed in their original form without any modifications. By preserving all background elements and variations in lighting conditions, the dataset retained its authenticity, requiring the classification models to be exceptionally robust. Consequently, these models had to contend with noise, irrelevant background details, and inconsistent illumination. Such complexities inherently introduced a higher risk of reduced classification accuracy, as any extraneous elements could obscure the subtle visual cues critical for accurately differentiating freshness levels.
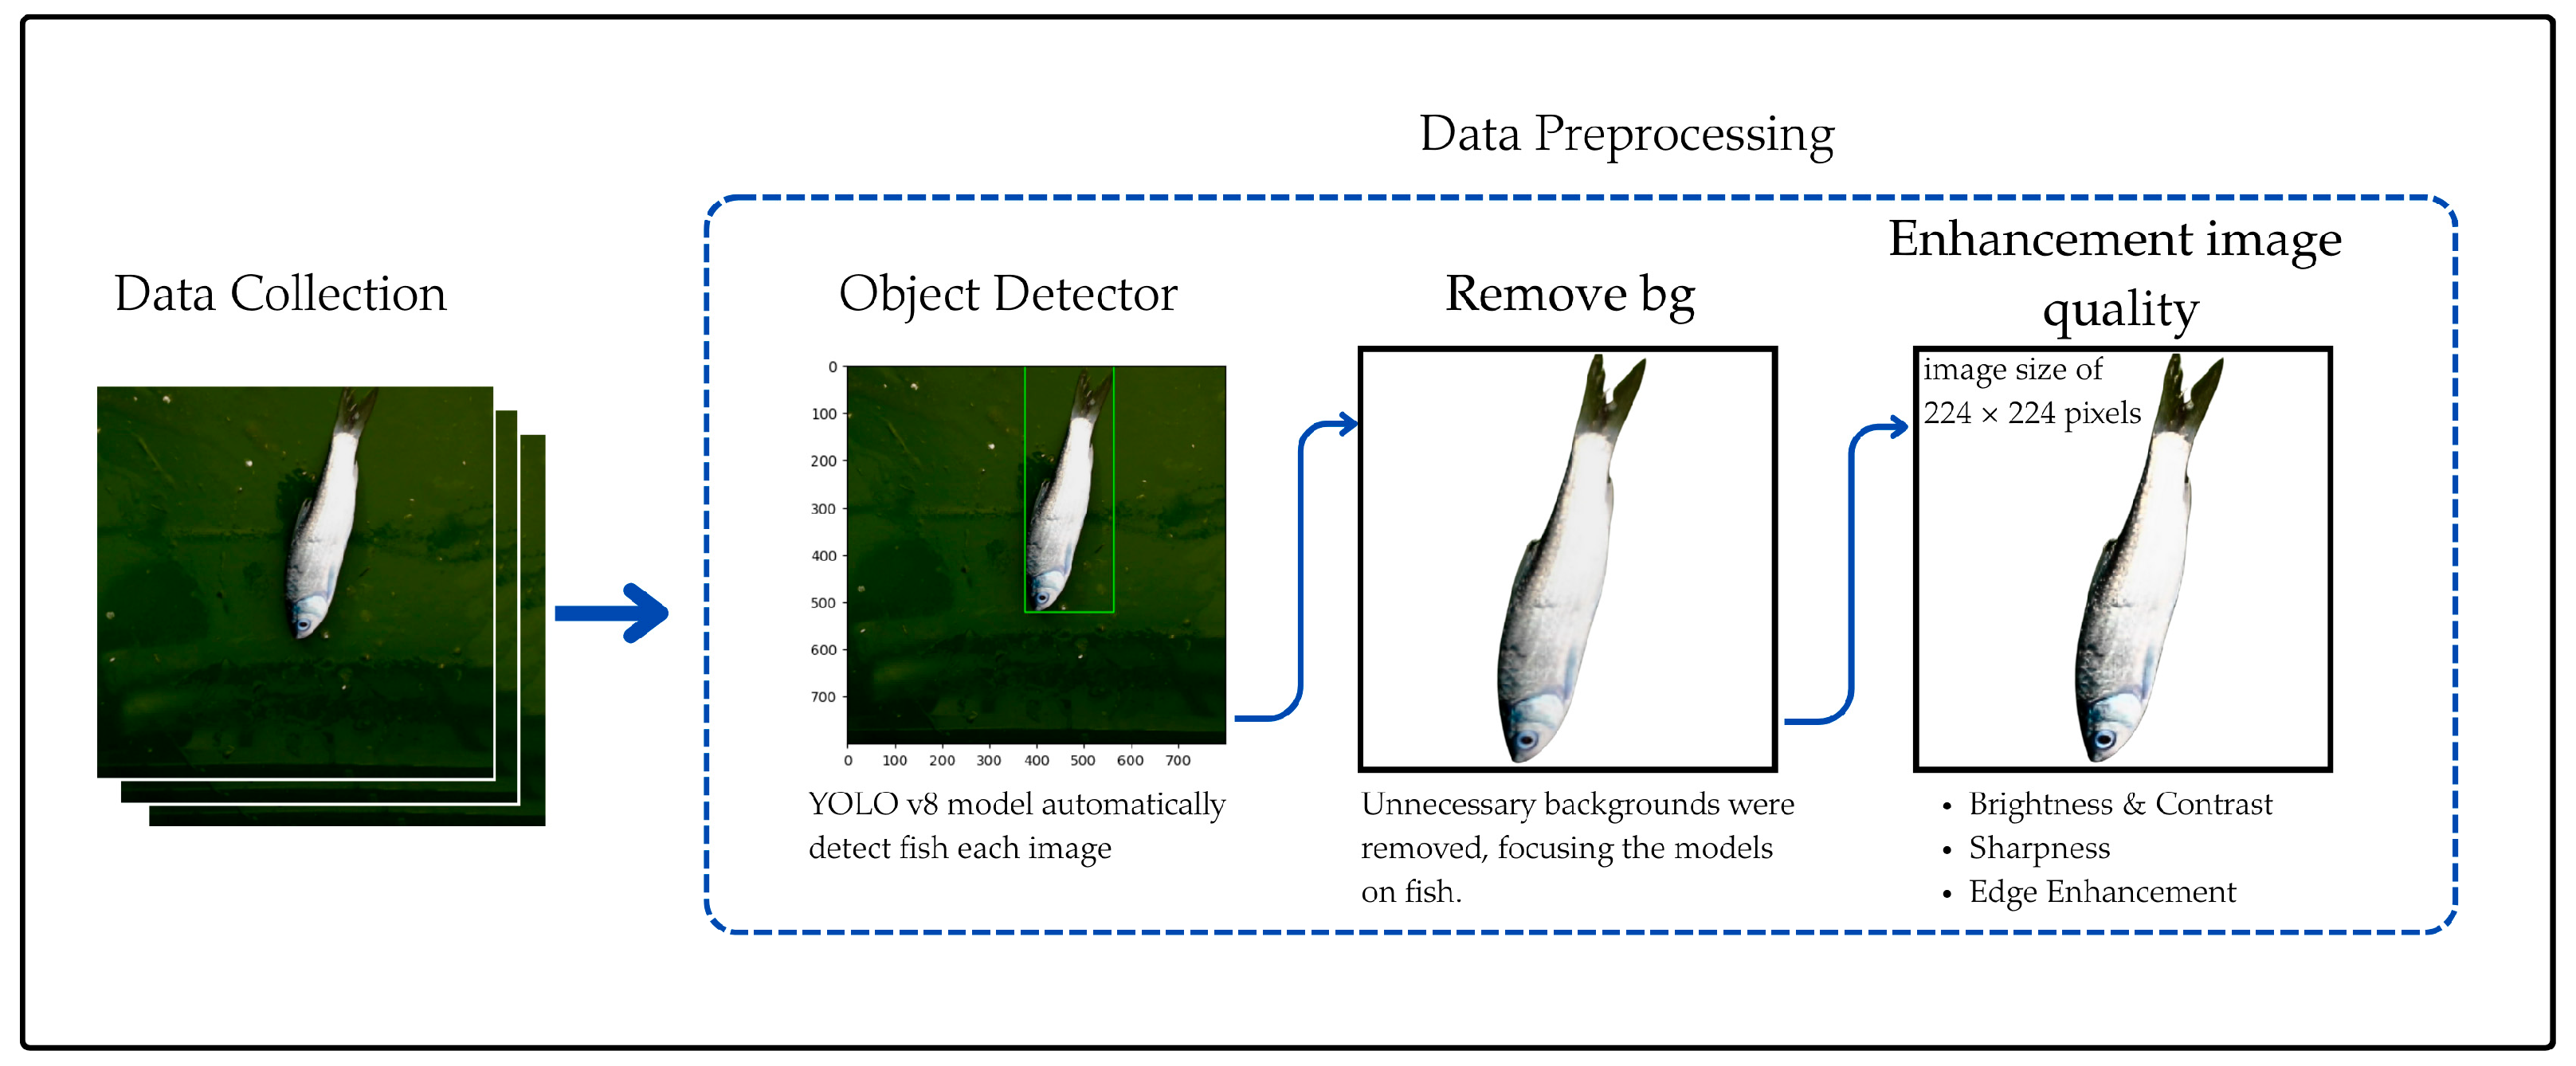
In contrast, the With Preprocessing approach implemented a series of advanced steps to refine image quality and emphasize salient features relevant to fish freshness. The process began by using the YOLOv8 model to detect and extract fish objects in each image, ensuring that only pertinent regions were included. All extracted fish were then uniformly cropped to 224 × 224 pixels, thereby standardizing the input size and reducing variability across samples. Background elements were efficiently removed to mitigate visual clutter, enabling the models to concentrate solely on the fish.
Subsequently, additional image enhancement techniques were applied to further improve classification performance. Brightness and contrast adjustments were introduced to optimize visibility of key features, while sharpness enhancement brought out fine textural details, such as scales, eyes, and fins. Furthermore, edge enhancement techniques were utilized to delineate contours more effectively, ensuring that the fish silhouette remained distinct from the background. Collectively, these preprocessing measures maximized the extraction of meaningful features, resulting in more accurate and dependable classification outcomes.
2.3. Model Development
To effectively classify fish freshness in a resource-constrained environment, this study focused on three lightweight Convolutional Neural Network (CNN) architectures that have proven efficient in mobile or edge computing applications: MobileNetV2 (M1), MobileNetV3 (M2), and EfficientNet Lite2 (M3). Each was explored under varying parameter sizes, Small (S), Medium (M), and Large (L), and under two distinct data-processing pipelines (With Preprocessing (P) and Without Preprocessing (NP)), resulting in a total of 18 model configurations.
2.3.1. Overview of the Model Architectures
- (1)
MobileNetV2 (M1)
MobileNetV2 is an efficient deep learning architecture designed for resource-constrained platforms, such as mobile devices and single-board computers like the Raspberry Pi. Its optimized design allows for real-time fish freshness classification while maintaining low computational costs. The key innovations include:
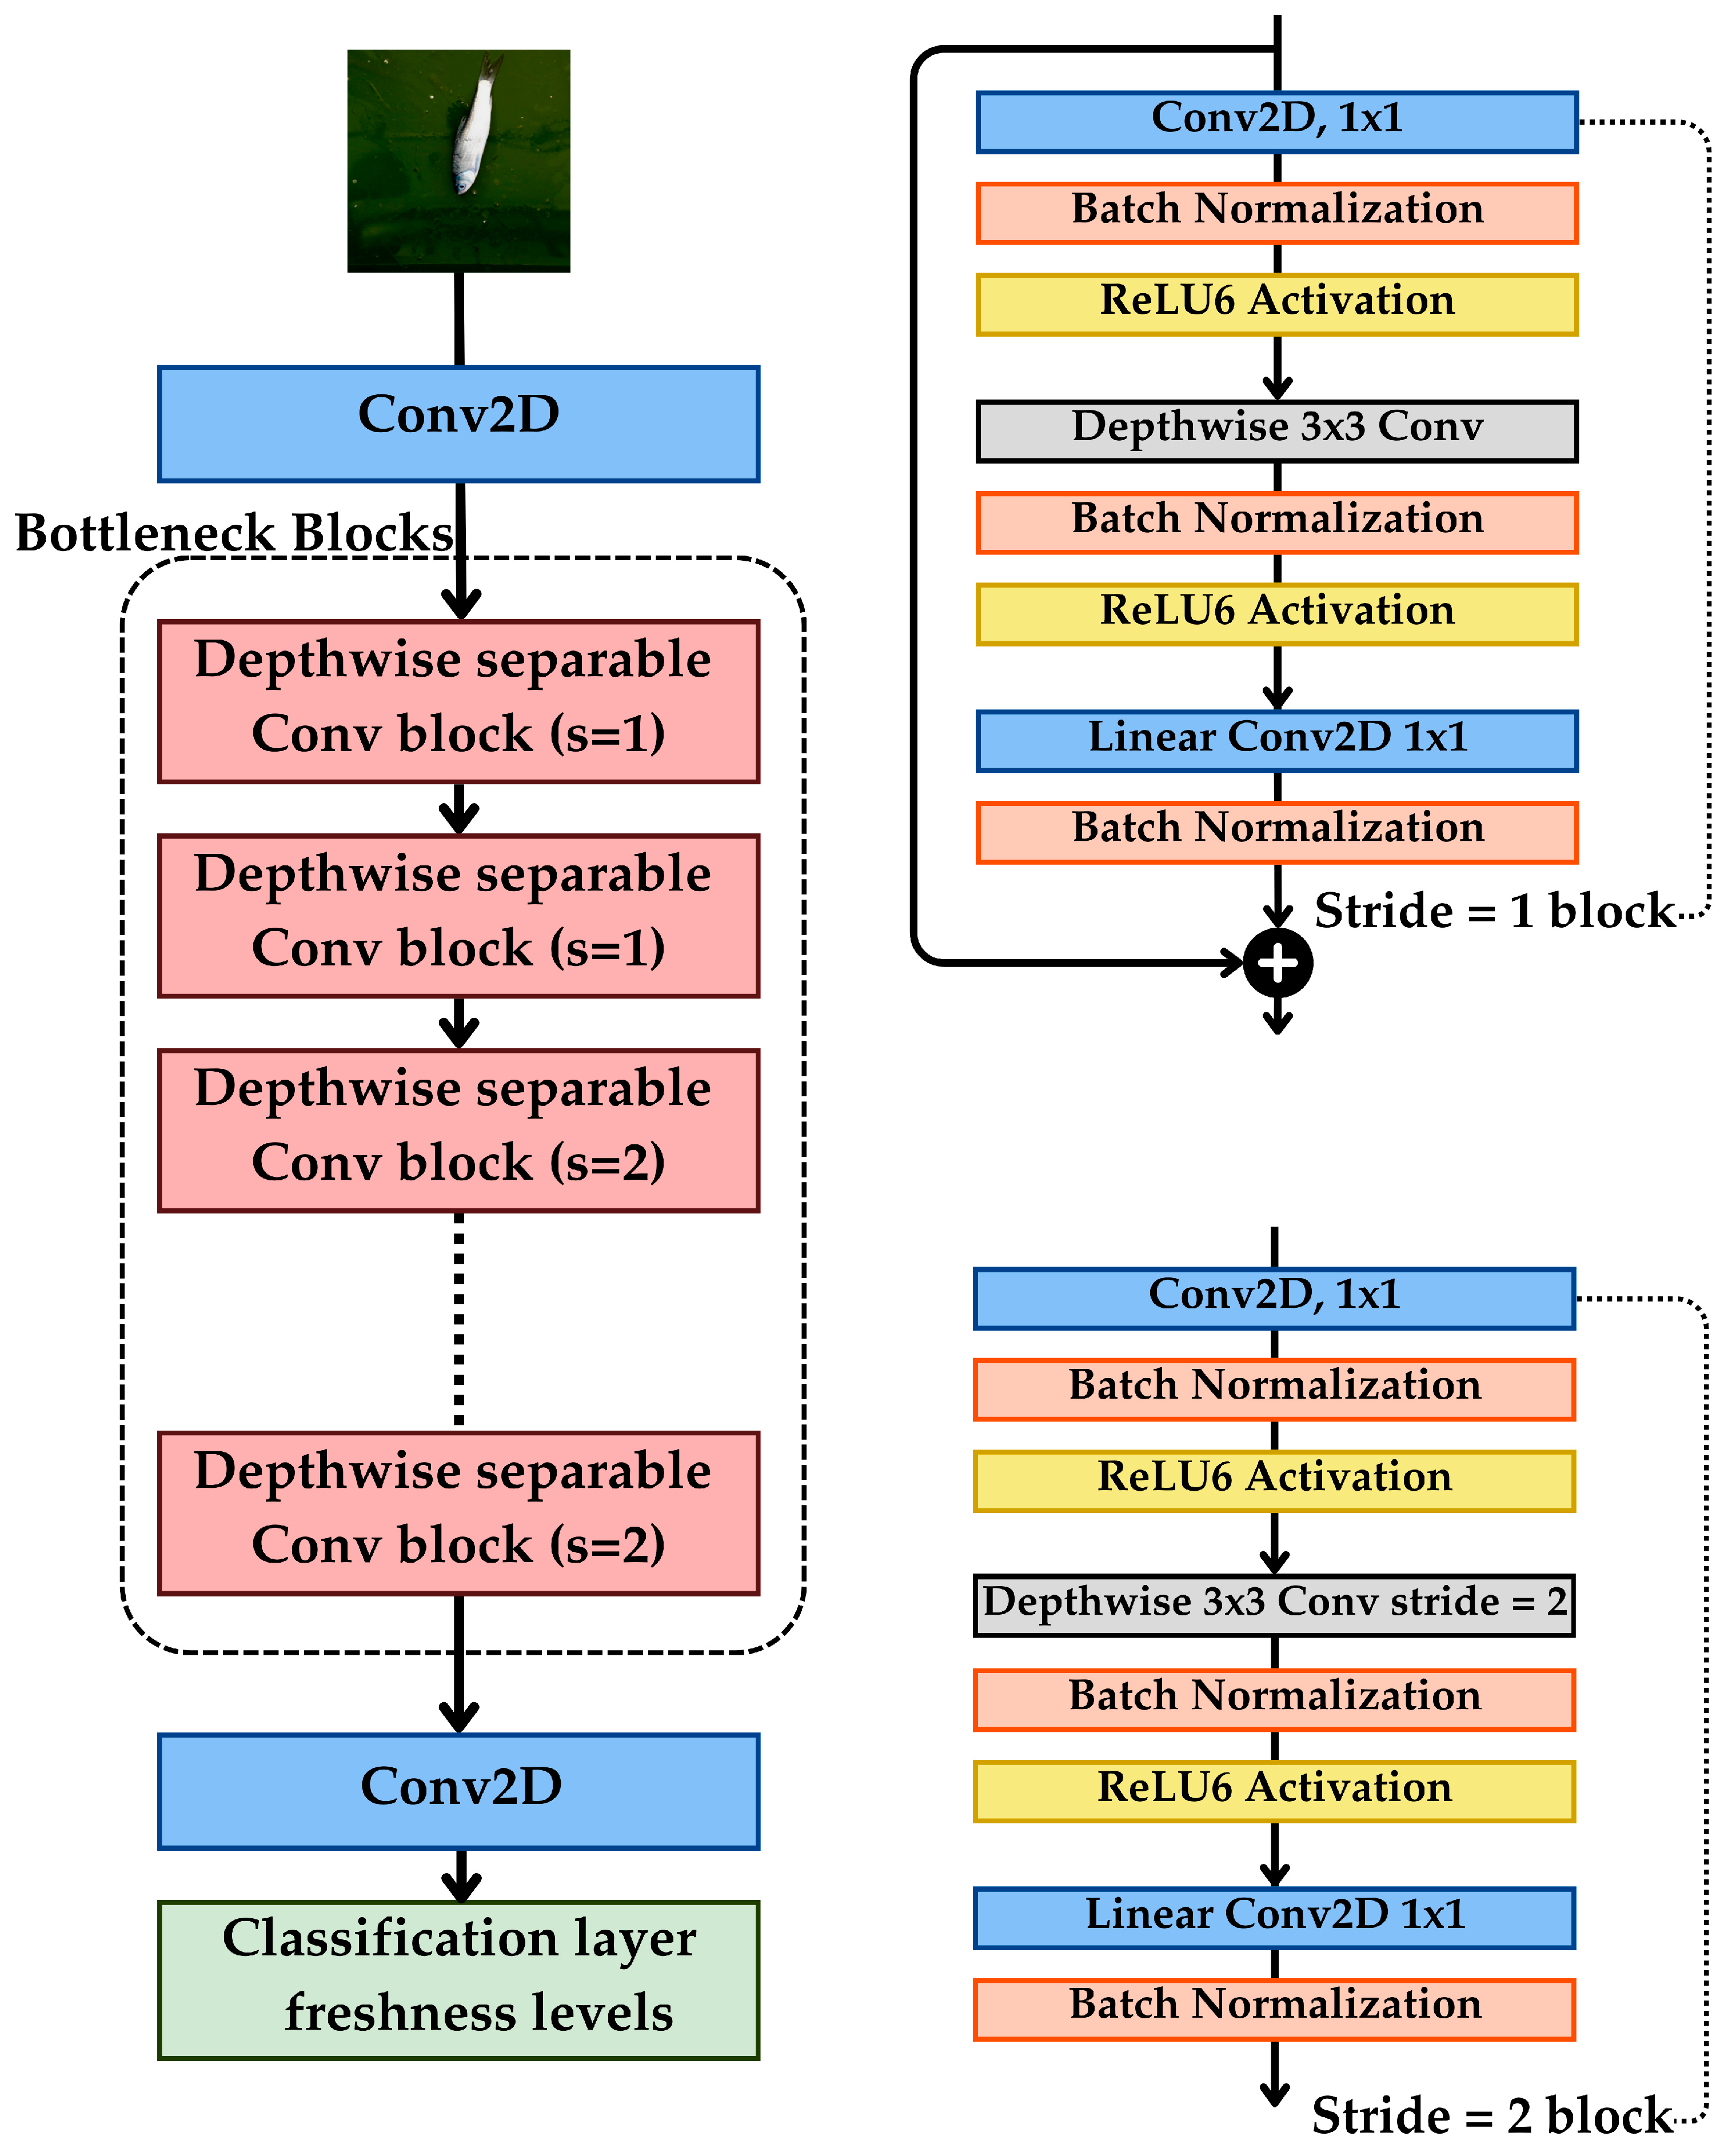
Depthwise Separable Convolutions: Rather than performing a full 2D convolution, MobileNetV2 factorizes the operation into depthwise and pointwise convolutions, drastically reducing computation and model size.
Inverted Residual Blocks: These blocks employ a thin bottleneck layer followed by an expanded intermediate representation, minimizing parameter count while preserving representational power.
Linear Bottleneck: By stripping non-linearities in the bottleneck layers, MobileNetV2 reduces information loss from activation functions in lower-dimensional feature spaces.
Figure 3 illustrates the MobileNetV2 architecture for fish freshness classification. The input image undergoes initial convolution (Conv2D), followed by bottleneck residual blocks, where depthwise separable convolutions extract essential features while reducing redundancy. The stride = 1 blocks refine features, while stride = 2 blocks perform downsampling, balancing detail retention and computational efficiency. Finally, the extracted features pass through the classification layer, predicting fish freshness levels.
- (2)
MobileNetV3 (M2)
MobileNetV3 improves upon MobileNetV2 by incorporating platform-aware Neural Architecture Search (NAS) optimizations, making it more efficient for real-time fish freshness classification on embedded systems. It introduces several key enhancements for improved accuracy and computational efficiency. Its defining features include the following:
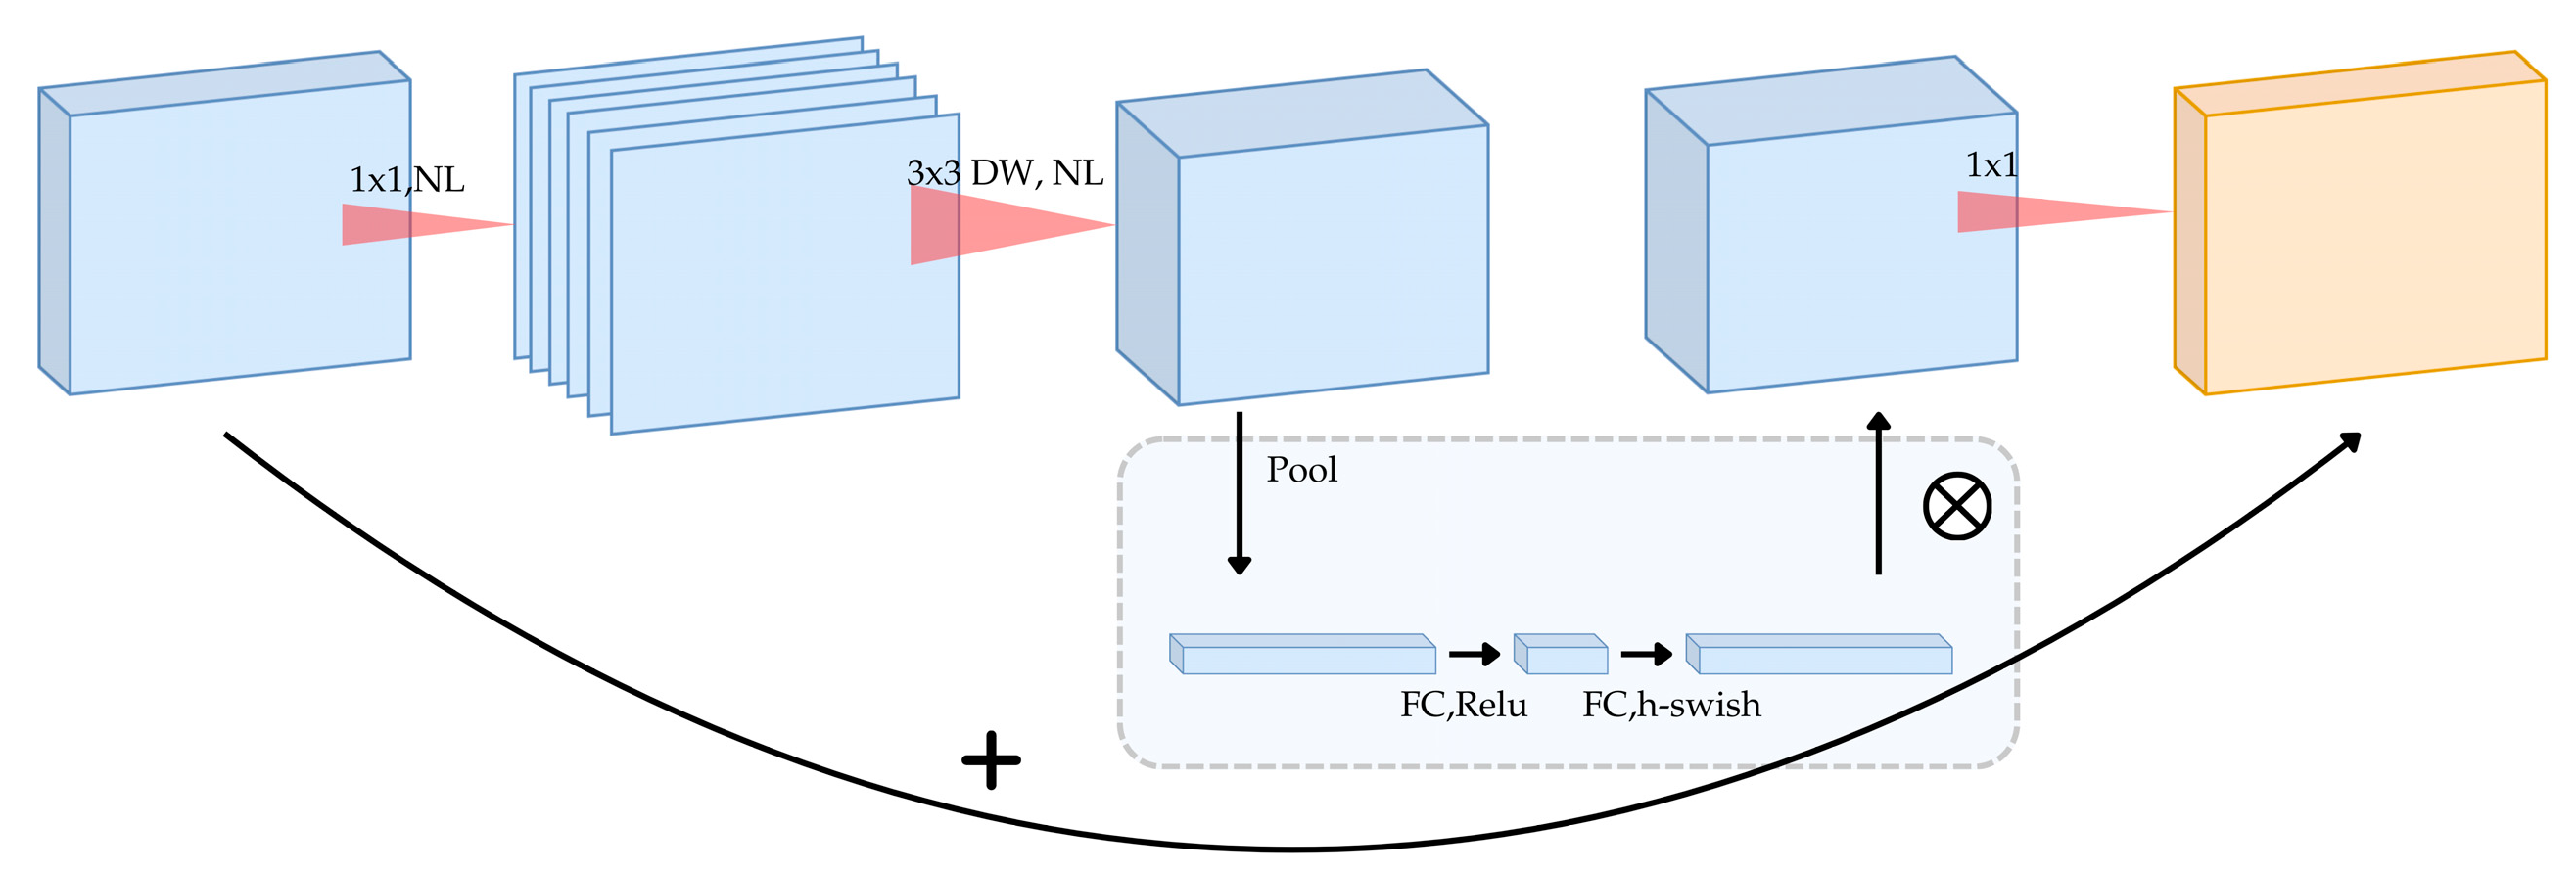
Squeeze-and-Excitation (SE) Blocks: Incorporated into the inverted residual blocks to adaptively recalibrate channel-wise feature responses, enhancing important features for classification tasks.
Hard-Swish Activation: A computationally cheaper yet high-performing activation function that further reduces floating-point operations while maintaining accuracy.
Reduced Parameter Footprint: Despite improved representational power, MobileNetV3 often has fewer parameters than similar-accuracy models, making it particularly attractive for battery-powered or embedded scenarios.
Figure 4 illustrates the MobileNetV3 architecture, showcasing its optimized feature extraction process. The model begins with a 1 × 1 convolutional layer, followed by a 3 × 3 depthwise separable convolution for spatial feature extraction. The SE block, represented in the inset, applies global pooling followed by fully connected (FC) layers and the h-swish activation function, dynamically reweighting channels for improved classification. The final 1 × 1 convolution reduces dimensionality before the output classification layer predicts fish freshness levels.
- (3)
EfficientNet Lite2 (M3)
EfficientNet Lite2 is a mobile-optimized variant of the EfficientNet family, designed for real-time classification on edge devices. It applies compound scaling, systematically adjusting depth, width, and resolution to balance performance and computational efficiency. Key architectural enhancements include the following:
Compound Scaling: By systematically increasing network depth, width, and input resolution, EfficientNet Lite2 balances performance gains against hardware constraints.
Memory-Efficient Swish: Uses a faster, lower-memory activation in place of the full Swish function.
Reduced Precision and Fewer FLOPs: In many cases, EfficientNet Lite variants are compatible with integer (e.g., INT8) quantization, making them even more efficient on embedded devices.
Figure 5 illustrates EfficientNet Lite2’s architecture, where the input passes through an initial 3 × 3 convolution followed by a series of Mobile Inverted Bottleneck Convolution (MBConv) layers with varying kernel sizes (3 × 3, 5 × 5). These layers progressively down sample and extract hierarchical features while maintaining computational efficiency. The final 7 × 7 convolutional layer refines the extracted features before classification.
2.3.2. Parameter Sizes and Model Configurations
Each of the three models, MobileNetV2 (M1), MobileNetV3 (M2), and EfficientNet Lite2 (M3), was trained in Small (S), Medium (M), and Large (L) parameter-size variants:
Small (S): Designed to keep the number of parameters and operations minimal, optimizing for higher inference speed at the potential cost of lower accuracy.
Medium (M): Balanced scaling that moderately increases the model’s depth or width compared to (S), seeking a compromise between speed and accuracy.
Large (L): Highest capacity among the three sizes, aiming to maximize accuracy, albeit at the cost of increased memory usage and slower inference.
Additionally, each model-size combination was trained and evaluated under two data-preprocessing scenarios:
Without Preprocessing (NP): Raw images as collected, allowing the model to learn robustness in the presence of unrefined data (including irrelevant background elements).
With Preprocessing (P): Fish regions were automatically detected and cropped using YOLO v8, resized to a uniform 224 × 224 resolution, and subjected to background noise removal. This step reduces input variability and highlights relevant anatomical features to facilitate classification.
Thus, for each architecture (M1, M2, M3), we produced six variants ([S, NP], [S, P], [M, NP], [M, P], [L, NP], and [L, P]), totaling 18 models.
Table 1 in
Section 3.4 summarizes these configurations alongside their respective performance metrics.
2.3.3. Training Details
All models were trained on the dataset of 1200 Silver Barb images (400 per freshness level), described in
Section 2.1. Training was performed on a workstation with a modern GPU, with the following hyperparameters (unless otherwise stated):
Optimizer: Adam or SGD with momentum (depending on pilot experiments).
Learning Rate: Ranged between 0.0001 and 0.001, adaptively tuned via a learning-rate scheduler.
Batch Size: 16–32, adjusted based on GPU memory constraints.
Number of Epochs: 50–100, or until validation accuracy plateaued for several epochs.
Data augmentation (random flips, minor color jitter) was also applied to improve model robustness, especially for the NP configurations where the model had to cope with background clutter and lighting variations.
2.3.4. Real-Time Deployment Constraints
Because the final target platform for the freshness-sorting system was a Raspberry Pi (
Section 3.3), each model’s inference speed (frames per second) was of primary importance. Larger architectures can show higher accuracy but risk slowing down throughput on the embedded hardware. Consequently, we systematically compared all 18 configurations (
Section 3.4) using both accuracy and inference speed as the principal criteria for selection, later applying the TOPSIS-LP method (
Section 2.5) to rank and identify the configuration that best balances high accuracy and real-time feasibility.
2.4. Model Evaluation
After training, the models underwent a comprehensive evaluation based on multiple performance metrics, including classification accuracy and inference speed. These metrics were selected to ensure that the chosen model not only demonstrated high performance in controlled environments but also had the ability to generalize effectively to real-world scenarios. This approach aligns with previous studies that emphasize the importance of balancing accuracy and speed for real-time applications in fish image classification [
31,
32].
Classification accuracy was determined by calculating the proportion of correctly classified fish images relative to the total number of test samples, using the standard formula, as outlined in Equation (1).
where True Positive (
TP) represents correctly classified instances for each class, and True Negative (
TN) denotes correctly classified instances that do not belong to the current class. False Positive (
FP) refers to misclassified instances assigned to the wrong class, while False Negative (
FN) indicates instances incorrectly assigned to a different class than their actual category. This method of accuracy calculation is widely adopted in fish classification systems [
33,
34].
Inference speed, measured in frames per second (fps), was evaluated by determining the number of images processed per second under a given hardware configuration. This metric is particularly critical for real-time applications, such as automated fish sorting, where rapid classification is essential for operational efficiency. The inference speed was computed as outlined in Equation (2).
where the total inference time represents the cumulative duration required to classify all test images. Additionally, computational efficiency was considered to ensure that the selected model maintained a balance between accuracy and processing speed without imposing excessive hardware demands. Studies have demonstrated the effectiveness of using efficient neural networks for real-time fish classification tasks [
35,
36,
37].
Furthermore, a detailed error analysis was conducted to identify challenges encountered by the models, including difficulties in distinguishing subtle differences in freshness levels and managing variations in lighting conditions across different samples. This analysis provided deeper insights into each model’s strengths and limitations, guiding the selection process to ensure an optimal trade-off between classification accuracy and real-time processing capability for seamless integration into an automated fish quality sorting system. Recent research supports this approach by highlighting the significance of error analysis in optimizing classification models for aquaculture applications.
2.5. Model Selection
To select the most optimal model, the TOPSIS method was applied. This advanced multi-criteria decision-making approach ranks the models by evaluating their proximity to an ideal solution, which represents the highest performance across all metrics. By simultaneously considering multiple criteria, TOPSIS ensures a balanced and holistic evaluation.
This section employs the TOPSIS-LP model to calculate the relative closeness co-efficient (CC), aiming to prioritize alternative tourism routes developed in the preceding phase. This evaluation is conducted under various pertinent decision criteria. The procedure for determining the relative proximity coefficient using the TOPSIS model includes the following steps:
In the decision-making process, it is crucial to comprehensively assess all viable alternatives. This study incorporates results from all potential travel routes identified in Phase 1. The selection of criteria should be relevant, measurable, and comprehensive, directly connected to the goal of pinpointing the most appropriate travel route that meets the established criteria. The pertinent decision criteria identified for this research are as follows: inference speed (frames per second) (C1), and accuracy (C2).
All potential alternatives along with the associated decision criteria will be utilized to construct the decision matrix, as outlined in Equation (3).
In this model, Ai (where i = 1, 2, …, m) denotes the alternatives, Cj (where j = 1, 2, …, n) represents the criteria associated with the performance of these alternatives, and xij indicates the inputs (or outputs) of alternative i concerning criterion j.
The normalized decision matrix, referred to as the Y matrix, guarantees that each criterion contributes equally to the decision-making process, as delineated in Equation (4).
The normalized performance of alternative
i with respect to criterion
j is denoted by
yij. Equations (5) and (6) are used to compute the normalized performance of alternative
i for beneficial and cost criteria, respectively.
The TOPSIS-LP model is formulated by incorporating each alternative
i with a set of criteria
j within the normalized decision matrix, represented as
yji. The weights assigned to the relevant criteria are denoted by
wj and are determined based on decision makers. The variables
and
signify the optimal weights for calculating the distances between the ideal solution in the negative case and the ideal solution in the positive case, considering alternative
i. For each criterion
j,
and
represent the negative and positive ideal values, respectively, where
and
, for
j = 1, 2, 3, …,
n. The relative closeness coefficient value (
CCi) for a set of alternatives
i (where 1 ≤
i ≤
n) is defined by Equation (7) [
15].
The CCi, or relative closeness coefficient, quantifies the proximity of each alternative or route to the ideal solution. An alternative with a higher CCi value is considered superior and will be ranked more favorably.
3. Results
This section presents a structured analysis of the experimental results, including a detailed comparison of different model configurations, their performance, and key observations. The results are interpreted to highlight the efficiency, accuracy, and computational performance of each tested model. Additionally, the findings provide insights into the impact of preprocessing on classification performance and processing time, leading to informed conclusions about the most suitable model for fish freshness classification.
3.1. The Results for Data Preprocessing
The dataset was processed using two distinct approaches to optimize classification performance: without preprocessing and with preprocessing.
In this approach, the raw images were used directly without any modifications. The classification models processed the dataset as collected, without enhancements to improve image quality or highlight specific features. While this method maintained the original image characteristics, it relied entirely on the model’s ability to handle unprocessed data. This approach posed potential challenges, such as increased sensitivity to noise and inconsistencies in image quality, which could negatively impact classification accuracy.
This approach involved a series of advanced preprocessing steps designed to enhance image quality and isolate fish-specific features for improved classification performance. YOLOv8 was chosen for object detection due to its superior Mean Average Precision (mAP), enabling more precise fish localization, which is crucial for distinguishing subtle details such as texture and color changes in freshness assessment. The model’s ConvNeXt-based backbone further enhances its ability to capture fine details, ensuring accurate detection even under varying lighting conditions. Once detected, the fish regions were automatically extracted, excluding irrelevant background content and retaining only the essential features for further analysis. The extracted images were then cropped and resized to 224 × 224 pixels, ensuring uniform input dimensions across the dataset. This standardization reduced computational overhead, eliminating inconsistencies caused by varying image sizes and improving model training consistency. To further refine image clarity, background noise removal techniques were applied, effectively eliminating elements such as shadows, reflections, and environmental artifacts that could obscure critical freshness indicators. Additionally, brightness and contrast adjustments were made where necessary to enhance the visibility of key attributes such as scales, eyes, and fins, allowing the model to detect fine nuances essential for distinguishing fish freshness levels. Furthermore, sharpness and edge enhancement techniques were employed to intensify the contrast between the fish and its surroundings, making it easier to identify minor discolorations or surface texture changes, which are key indicators of freshness. By focusing on these essential features, the preprocessing pipeline preserved the most informative visual cues, ensuring that the deep learning models received high-quality input data for accurate classification. Collectively, these preprocessing steps, including YOLOv8-based object detection, uniform cropping, resolution standardization, noise reduction, and targeted enhancements, significantly improved image quality while reducing irrelevant background information.
Figure 6 illustrates the complete preprocessing workflow, from initial image capture to the production of refined input images. This comprehensive process enabled the trained deep learning models to classify fish freshness with greater accuracy, consistency, and reliability, making the system more robust for real-world deployment.
3.2. The Results for Model Development
The development of an automated fish quality sorting system for Silver Barb aims to enhance productivity and operational efficiency in community-based fishery enterprises. As illustrated in the system configuration (
Figure 7), this sorting machine integrates deep learning models with a Raspberry Pi, a Programmable Logic Controller (PLC), and pneumatic actuators to achieve accurate freshness classification in real-time. The system is designed to detect and sort fish automatically, utilizing proximity sensors along a motor conveyor to trigger a USB camera that captures high-resolution images. These images are processed by deep learning models deployed on the Raspberry Pi, which then communicates with the PLC via the Modbus RTU protocol to control pneumatic cylinders that actuate sorting gates. This approach ensures precise and continuous sorting of fish into designated bins, enhancing operational efficiency.
However, deploying deep learning models on the Raspberry Pi presents significant challenges due to its limited computational power and memory. While larger models generally achieve higher accuracy, they require substantial processing power, leading to slower inference speeds and increased power consumption. This trade-off is particularly problematic in real-time sorting systems, where delays in classification can disrupt the flow of fish on the conveyor, reducing the system’s overall efficiency. Additionally, power constraints in community-based settings necessitate an energy-efficient solution that maintains high classification accuracy without overloading the hardware. These limitations highlight the importance of developing lightweight models that optimize both accuracy and inference speed, ensuring effective operation in resource-constrained environments.
To address these challenges, three lightweight deep learning models were selected: MobileNetV2 (M1), MobileNetV3 (M2), and EfficientNet Lite2 (M3). These models were tested under 18 different conditions, derived from combinations of model architectures, parameter sizes (Small, Medium, Large), and preprocessing methods (With and Without Preprocessing). This comprehensive evaluation allowed for a balanced assessment of classification accuracy and inference speed, ensuring that the models are not only accurate but also capable of real-time processing on the Raspberry Pi. By optimizing the models for speed and efficiency, this study contributes to the development of a scalable and effective solution for automated fish freshness assessment, supporting sustainable economic growth in fishery-based community enterprises.
3.3. The Results for Model Evaluation
The experimental results are presented in
Table 1, which provides a detailed comparison of the performance of various deep learning model configurations for fish freshness classification. The table summarizes key performance metrics, including Inference Speed (fps) and Accuracy Rate (%), offering insights into the trade-offs between processing efficiency and classification accuracy.
The models evaluated include three architectures: MobileNetV2 (M1), MobileNetV3 (M2), and EfficientNet Lite2 (M3). Each model was tested with different parameter sizes, Small (S), Medium (M), and Large (L), and under two preprocessing conditions: Pre-processed (P) and Non-pre-processed (NP). This comprehensive approach allowed for an in-depth analysis of how parameter size and preprocessing techniques impact model performance.
Table 1 presents the performance evaluation of the 18 model configurations, organized as a decision matrix for fish freshness classification. The table compares inference speed (fps) and accuracy rate (%) across three model architectures, MobileNetV2 (M1), MobileNetV3 (M2), and EfficientNet Lite2 (M3) tested under varying parameter sizes (small, medium, large) and preprocessing conditions (pre-processed, non-pre-processed). This decision matrix serves as the foundation for applying the TOPSIS-LP method, which ranks the models based on multiple performance criteria. The structured presentation of performance metrics allows for a clear comparison of trade-offs between inference speed and accuracy, facilitating the selection of the most optimal model configuration for integration into an automated fish quality sorting system.
3.4. The Results for Model Selection
The experimental results are presented in
Table 1, which provides a detailed comparison of the performance of various deep learning model configurations for fish freshness classification. The table summarizes key performance metrics, including inference speed (fps) and accuracy rate (%), offering insights into the trade-offs between processing efficiency and classification accuracy.
Based on the principle of TOPSIS, the defined criteria are categorized into two main types: beneficial criterion and cost criterion. The beneficial criterion includes inference speed (fps) or (C1), measured in seconds, while the cost criterion consists of the accuracy rate (%) or (C2), expressed as a percentage. These criteria form the decision matrix, as presented in
Table 2.
After constructing the decision matrix, the next step involves generating the normalized decision matrix using Equations (4)–(6) of the TOPSIS-LP method. This process of normalization changes the values to a standard scale. This makes it possible to compare performance metrics fairly and makes sure that no one factor unfairly affects the overall ranking. The criterion weights are assigned by a team of researchers and decision-makers with over ten years of experience in image processing, aiming to develop an optimal model by integrating multiple approaches for practical application. However, the specific weighting of these criteria may be adjusted based on input from the experts involved, ensuring that the model selection process aligns with real-world requirements and priorities. This process ultimately results in a comprehensive normalized decision matrix, as illustrated in
Table 2.
Upon obtaining the relevant parameters displayed in
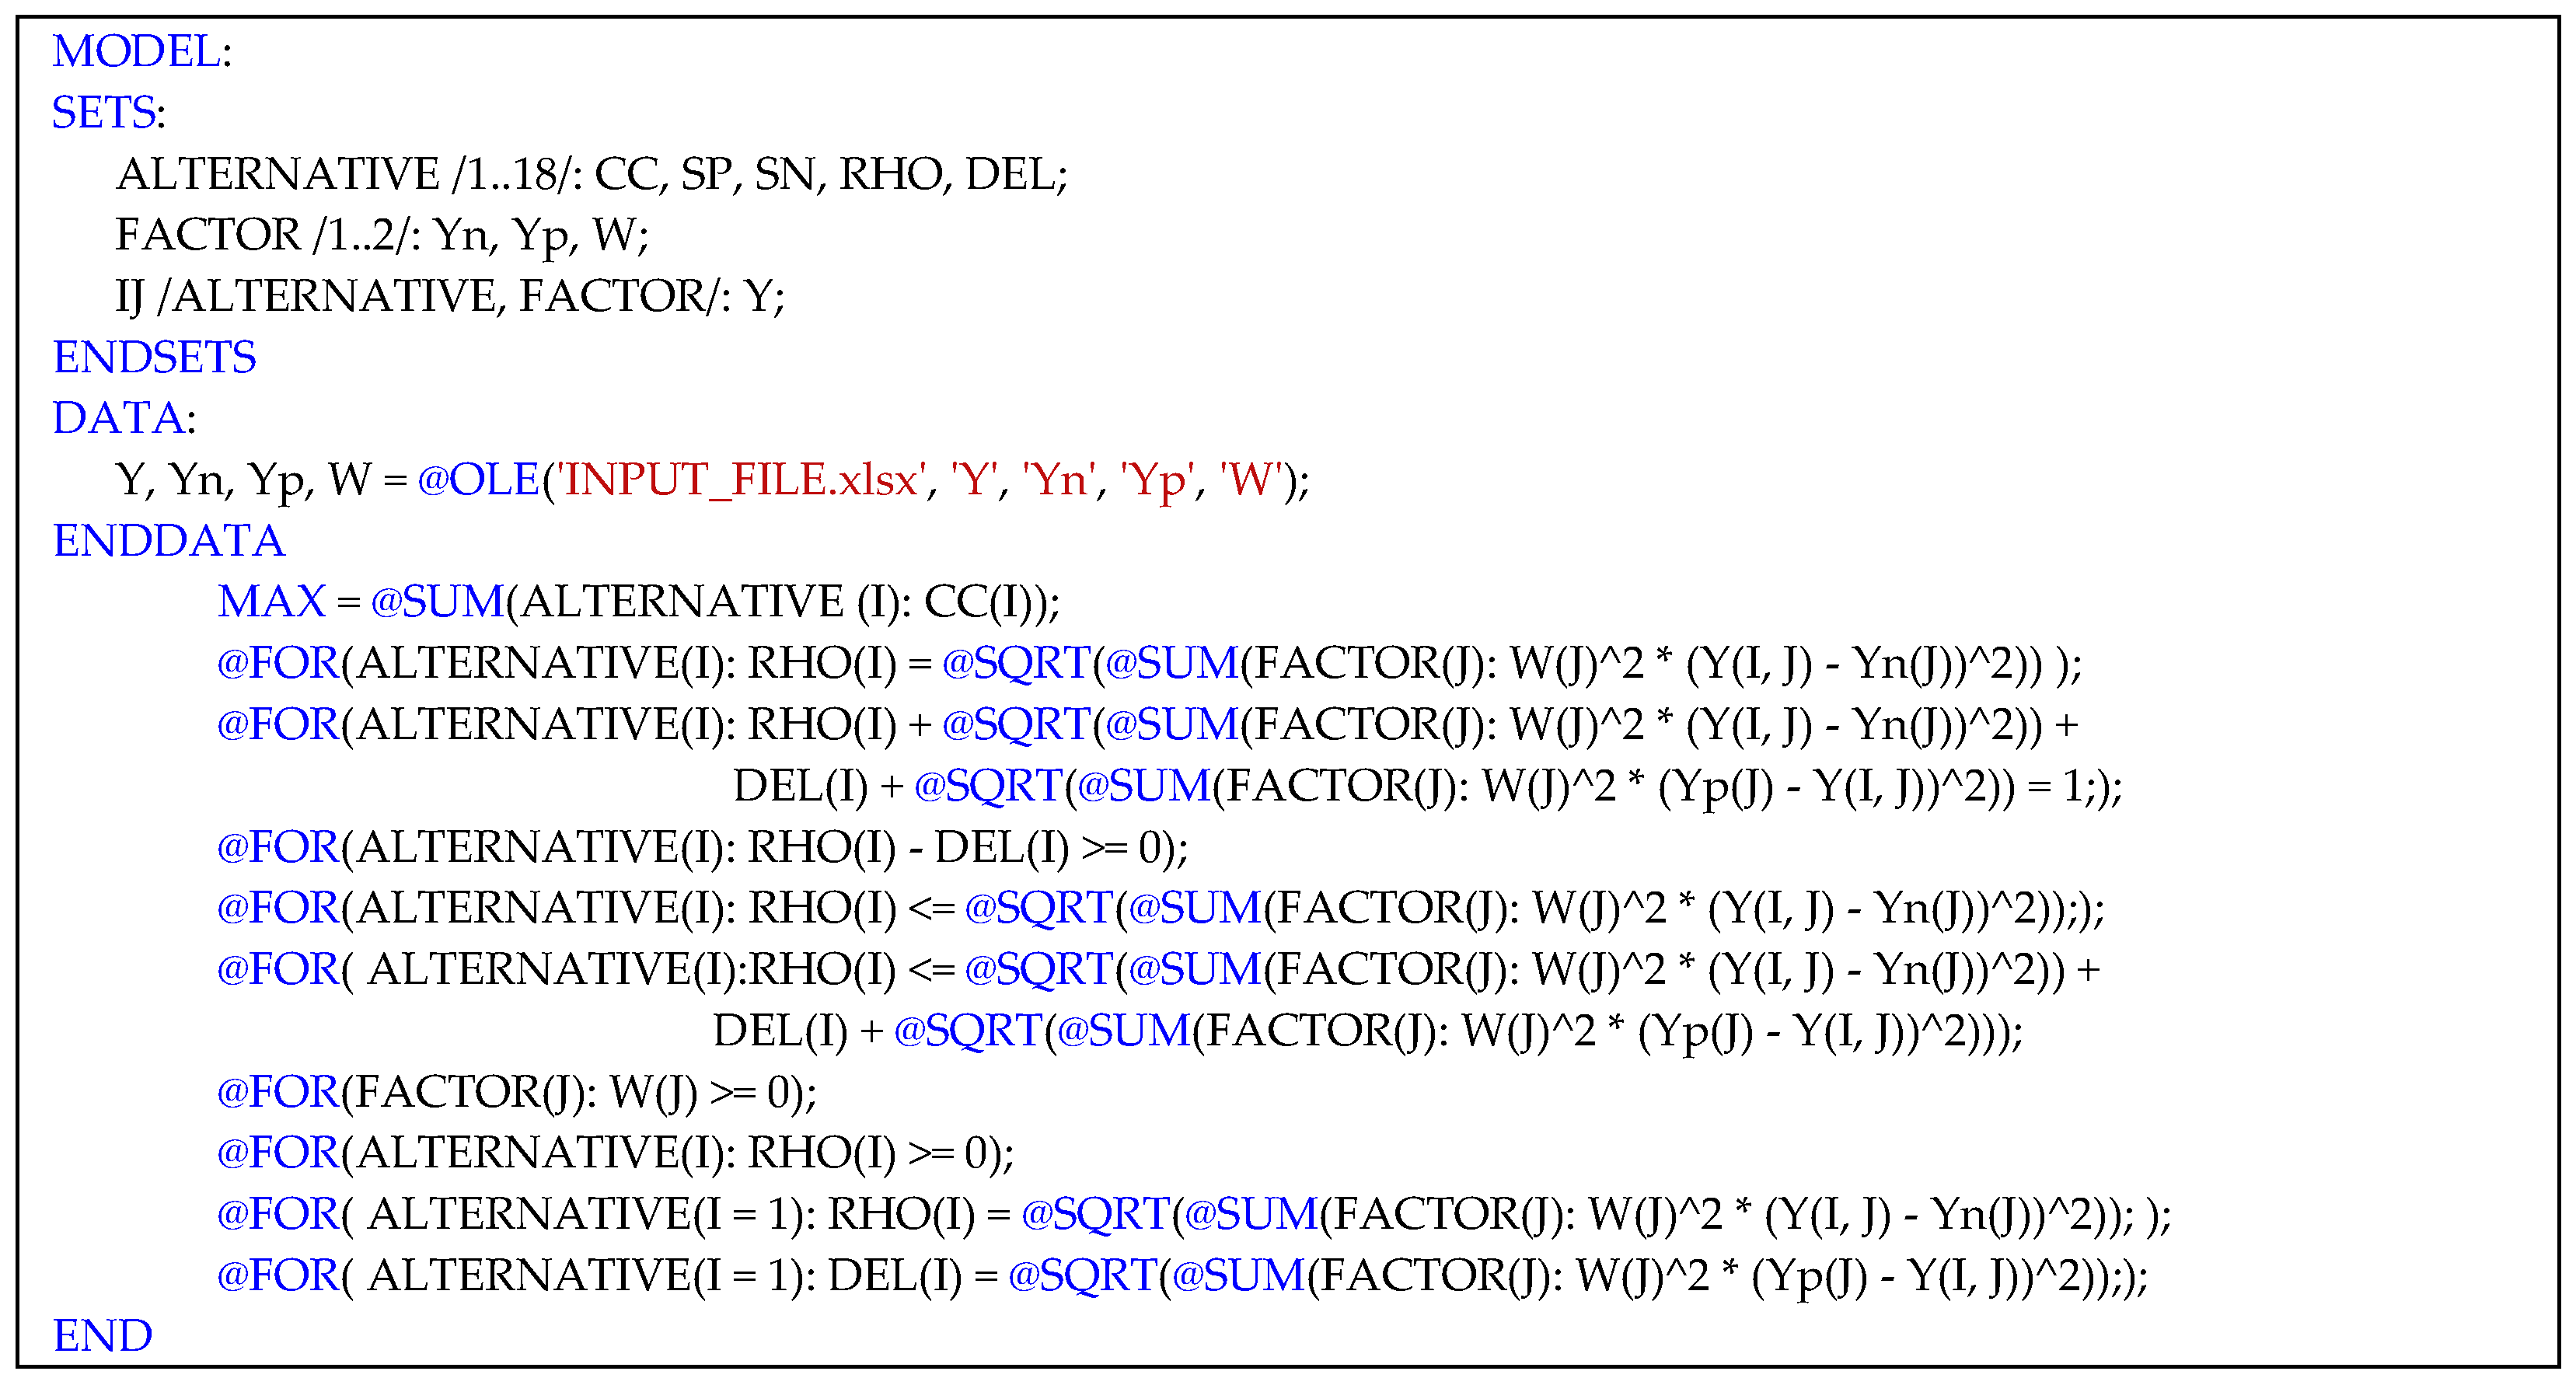
Table 2, the associated parameter values are input into the TOPSIS-LP model, as indicated by Equation (7), and subsequently computed using Lingo software version 13. Details of the Lingo code are shown in
Figure 8.
Figure 8 presents the core linear programming formulation that integrates TOPSIS with an optimization perspective. It creates sets and variables (like RHO and DEL) to measure how far away each model configuration is from the best solutions. It then uses weights to balance criteria (like speed and accuracy) and aims to get the highest possible sum of Closeness Coefficients (CC). By systematically enforcing constraints on distance relationships and non-negativity, the solver identifies the most desirable alternative among 18 model configurations. Once solved, higher CC values indicate configurations that are both near the positive ideal and distant from the negative ideal, providing a robust, data-driven basis for selecting the optimal fish freshness classification model.
The resulting values, including the relative closeness coefficients and rankings, are displayed in Column 4 and Column 5 of
Table 2, respectively. The M2-PL-P model achieves the highest Closeness Coefficient (0.610) and is ranked 1st, indicating the most optimal balance between inference speed and accuracy.
However, to ensure robustness and confidence in achieving accurate decision-making, this study conducts a sensitivity analysis, which is detailed in the following section. This analysis examines the impact of varying criterion weights on the overall rankings, providing a comprehensive understanding of how changes in decision-maker preferences influence the selection of the optimal model configuration. By doing so, the study enhances the reliability and credibility of the decision-making process, ensuring that the chosen model remains effective under different scenarios and stakeholder priorities.
3.5. Analysis of Sensitivity
Sensitivity analysis is widely employed to ensure the reliability and stability of solutions. This study presents a two-phase sensitivity analysis process. In the first phase, four scenarios are developed to examine the impact of varying criterion weights. The second phase applies different Multiple Attribute Decision-Making (MADM) techniques to perform a comparative analysis.
In the first phase, the weight adjustment method is implemented across nine scenarios, as outlined below:
Case 1: 20% assigned to Frame per Second (FPS) (C1) and 80% to Accuracy Rate (C2).
Case 2: 15% assigned to Frame per Second (FPS) (C1) and 85% to Accuracy Rate (C2).
Case 3: 20% assigned to Frame per Second (FPS) (C1) and 90% to Accuracy Rate (C2).
Case 4: 5% assigned to Frame per Second (FPS) (C1) and 95% to Accuracy Rate (C2).
Table 3 provides a comprehensive comparison of the ranking positions assigned to various model alternatives across four different cases.
Table 3 presents the rankings of various models across four different cases, highlighting the impact of varying criterion weight distributions on their performance. The results demonstrate significant ranking fluctuations, indicating that model performance is highly sensitive to changes in the prioritization of Frame per Second (FPS) (C1) and Accuracy Rate (C2). Among the models, M2-PL-P consistently ranks the highest, securing the top position in Cases 2, 3, and 4, and maintaining a strong performance in Case 1 (rank 6), suggesting its adaptability to different weight distributions. Similarly, M1-PL-P performs well, ranking within the top 10 across all cases and securing 2nd place in Cases 3 and 4. Additionally, M2-PL-NP and M1-PL-NP exhibit competitive rankings, placing within the top 5 in Cases 1, 2, and 3, though their performance declines in Case 4. Conversely, several models, such as M1-PS-NP, M1-PS-P, and M2-PS-NP, experience significant rank fluctuations, with M1-PS-NP dropping from 2nd in Case 1 to 18th in Cases 3 and 4, indicating their high dependency on specific weight distributions. Similarly, M2-PS-NP performs well in Case 1 (1st place) but declines significantly in Cases 3 and 4 (14th and 17th place, respectively), suggesting that these models perform best when FPS is prioritized. M3 models generally rank lower, with M3-PL-NP and M3-PL-P consistently positioned in the lower half of the rankings. The sensitivity of the M1 and M2 models to weight distribution changes underscores the importance of carefully considering weight assignments in decision-making. If accuracy is the priority (high C2 weighting, Cases 3 and 4), M2-PL-P and M1-PL-P are the best options. However, if FPS is emphasized (Case 1), M2-PS-NP and M1-PS-NP perform better but decline significantly when accuracy is prioritized. Some models, such as M1-PM-P and M2-PM-P, maintain relatively stable performance across all cases, making them viable balanced options. The findings highlight the need for sensitivity analysis to understand the impact of weight distributions on rankings. M2-PL-P is the most consistent and robust model, suitable for real-world use, while M1-PL-P and M2-PL-NP also perform well. Balancing FPS and accuracy are crucial for optimal model selection.
In the second phase, various MADM techniques were employed to perform a comparative analysis
Figure 9 shows the comparison of the proposed TOPSIS-LP model with other MADM approaches: MOORA [
38], WASPAS [
39], and ARAS [
40].
Figure 9 presents a comprehensive comparative analysis of the performance achieved by the proposed TOPSIS-LP model against three alternative MADM methodologies, MOORA, WASPAS, and ARAS in evaluating and ranking 18 distinct deep learning model configurations developed for classifying fish freshness. The assessment specifically targets the automated quality sorting of Silver Barb, a commercially significant fish species. The results clearly indicate that the proposed TOPSIS-LP model outperforms other considered methodologies by offering more consistent, stable, and clearly differentiated rankings across the evaluated configurations. In particular, the MobileNetV3 architecture with large parameter size and preprocessing (designated M2-PL-P) consistently achieved the highest rank across all methods, demonstrating its superior ability to accurately distinguish between high-performing and lower-performing configurations. In contrast, the MOORA and WASPAS methods showed considerable fluctuations in their rankings, especially noticeable within configurations that involved medium and large parameter sizes. Such variability suggests sensitivity to minor variations in performance metrics, potentially leading to ambiguity or instability in the decision-making process when these methods are applied. Meanwhile, the ARAS method, although offering smoother ranking transitions, was less effective in differentiating between configurations with closely matched performance, thereby reducing its practical utility in clearly distinguishing between superior and inferior model alternatives. Overall, the TOPSIS-LP method exhibited enhanced robustness, reliability, and discriminatory power, particularly emphasizing the superiority of the MobileNetV3 Large model combined with preprocessing techniques (M2-PL-P configuration). This configuration consistently achieved top rankings across all methods, underscoring its capability to effectively balance classification accuracy and inference speed. Consequently, TOPSIS-LP emerges as the preferred method for selecting optimal deep learning models for practical deployment in automated fish quality sorting systems. Its robustness and reliability make it a highly recommended approach for ensuring both precision and operational efficiency, thereby enhancing productivity and scalability within fishery-based community enterprises.


 ,
, 


