Abstract
Dam safety control is a multifaceted activity that requires analysis, monitoring, and structural behavior prediction. It entails interpreting vast amounts of data from sensor networks integrated into dam structures. The application of extended reality technologies for situated immersive analysis allows data to be contextualized directly over the physical referent. Such types of visual contextualization have been known to improve analytical reasoning and decision making. This study presents DamVR, a virtual reality tool for off-site, proxied situated structural sensor data visualization. In addition to describing the tool’s features, it evaluates usability and usefulness with a group of 22 domain experts. It also compares its performance with an existing augmented reality tool for the on-site, immediate situated visualization of structural data. Participant responses to a survey reflect a positive assessment of the proxied situated approach’s usability and usefulness. This approach shows a decrease in performance (task completion time and errors) for more complex tasks but no significant differences in user experience scores when compared to the immediate situated approach. The findings indicate that while results may depend strongly on factors such as the realism of the virtual environment, the immediate physical referent offered some advantages over the proxied one in the contextualization of data.
1. Introduction
Dams are an excellent example of engineering expertise. They serve a crucial role in managing water resources. These infrastructures fulfill various functions, including water storage, flood mitigation, and hydroelectric power generation. Concrete dams, in particular, are engineered to endure considerable water pressures and maintain long-term stability [1]. Characterized by their unique structural features, concrete dams possess high resistance to erosion, corrosion, and seismic forces, vital in ensuring the safety of communities downstream. Preserving their integrity and ensuring their safety are critical concerns [2].
Dam safety control is a multifaceted process that includes detailed analysis, continuous monitoring, and predictive modeling of various dam components [3]. This process is critical for ensuring the dam’s safety and optimal functionality. It involves systematically tracking a range of parameters, each vital to the dam’s stability and performance [4]. These parameters can encompass water levels, structural and foundational stresses, displacements within the dam and its foundation, movements in joints and cracks, as well as the measurement of environmental factors like air temperature. Additionally, it can include monitoring concrete strains, foundation uplift pressures, and dynamic accelerations [5].
The control of dam safety frequently involves the abstraction and interpretation of extensive datasets encompassing structural, hydraulic, and geotechnical parameters. These datasets originate from sensor networks strategically placed within dam structures and their adjacent areas [6]. The analysis of this data is typically abstracted in two-dimensional charts [7,8] and conducted using conventional displays, keyboards, and mice. However, these traditional methods often present the data in isolation, without visual contextualization with the relevant dam region. Such an approach may limit understandability [9].
Using technologies such as virtual reality (VR) or augmented reality (AR) for visualizing dam data may have advantages over conventional means, especially when allied with realistic digital models. It can enable immersive situated analysis, where the data are framed within the visual context of the object being examined (the dam). In that scope, Satriadi et al. [10] classified situated visualization as proxied situated visualization (also designated proxsituated) and immediate situated visualization depending on the type of situatedness perceived by the user. The first uses technologies like VR to enable data visualization over a proxied representation of the physical referent (the dam) and the surrounding environment. The second uses technologies like AR or mixed reality (MR) to represent data directly over the real/immediate physical referent. Both of these situatedness modalities offer an increased analysis contextualization, which can potentially improve analytical reasoning and decision making [11].
Desktop visualization and analysis have been deeply embedded in the workflows of dam safety control professionals. While desktop 3D analytical programs allow for interactive analysis, the visual contextualization they offer consists, in the most optimistic scenario, of displaying spatial information superimposed on a 3D representation of the dam on a 2D screen. Such an approach limits the depth and spatial relationship perception [12]. VR has been acknowledged [13] for offering increased depth and spatial perception. As such, it can be used as a complement or alternative to traditional visualization to improve how dam experts interpret and relate spatial information to the physical structure of dams. In that scope, immersive analytics [14] (the analysis of data in immersive environments) has been known to support engagement and decision making and improve contextual understanding of the data compared to conventional analysis [11,15].
This work presents DamVR, an interactive proof-of-concept VR prototype tool that takes the first steps to proxied situated data visualization in dam safety control. This tool was developed at the Institute of Systems and Computer Engineering: Research and Development in Lisbon (INESC-ID) in cooperation with the Concrete Dams Department (CDD) at the Portuguese National Laboratory for Civil Engineering (LNEC). INESC-ID is a research and development organization in the fields of computer science and electrical and computer engineering. LNEC is responsible for the safety control of most of the Portuguese concrete dams. One is the Cabril Dam, a double-curvature concrete arch dam in the Zêzere River in Portugal. This dam was used as a case study for evaluating DamVR.
The tool was designed to facilitate the visualization of the temporal progression of dam structural behavior, encompassing occurrences such as seismic events. It is targeted towards structural engineers and other professionals engaged in dam safety control activities. The tool offers these professionals an immersive platform for the proxied situated exploration of time-dependent data. This capability allows for the in-depth analysis of dam behavior without requiring physical presence at the dam site.
The exploration process is conducted within visual representations that accurately reflect dam contexts, featuring, preferentially, realistic three-dimensional digital models of dams and their surrounding landscapes. This tool allows users to virtually traverse dam structures, including access to their internal components and sensor networks from which the data originate. It allows selecting specific sensors, such as accelerometers or plumblines, enabling users to visualize and analyze the chronological evolution of key metrics, like horizontal displacements, that are recorded with these devices (Figure 1).
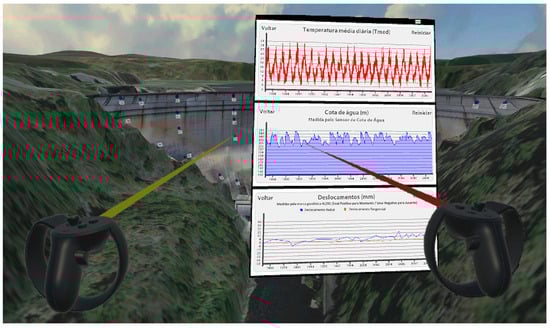
Figure 1.
Overview of DamVRs’ interface (mockup) exemplified for the Cabril Dam. Users can visualize the sensor networks in dam structures. When they select a specific device, floating panels with the evolution of measured values over time, air temperatures, and water levels are shown. Translation to English (from Portuguese) of text in panels: ‘Temperatura média diária’: ‘Average air temperature’, ‘Voltar’: ‘Back’, ‘Reiniciar’: ‘Reset’ (top panel); ‘Cota de água’: ‘Water height’, ‘Medida pelo Sensor de Cota de Água’: ‘Measured by the Water Height Sensor’ (middle panel); ‘Deslocamentos’: ‘Displacements’, ‘Medidos pela marca geodésica KL295 (Sinal Positivo para Montante/Sinal Negativo para Jusante)’: ‘Measured by the geodetic mark KL295 (Positive Sign to Upstream/Negative Sign to Downstream)’, ‘Deslocamento Radial’: ‘Radial Displacement’, ‘Deslocamento Tangencial’: ‘Tangential Displacement’ (bottom panel).
Apart from presenting DamVR, this work addresses the evaluation of the tool’s performance and usability by 22 domain experts. Furthermore, it extends prior research by Verdelho Trindade et al. [16,17,18] and Leitão [19] by comparing the performance of DamVR to an existing AR tool (DamAR) for on-site visualization, with similar features, in similar tasks. This comparison enables the assessment of the performance differences between a proxied situated approach that uses VR and an immediate situated approach that uses AR. As it will be addressed in Section 2.1, existing research work primarily focuses on comparing situated approaches (either proxied situated or immediate situated) with non-situated ones. Unlike this existing research, the present study reports on a comparison between the two different modalities of situatedness in similar tasks concerning sensor data visualization. As such, this study’s contributions include a novel tool that represents a first step towards developing a fully-fledged immersive proxied situated analysis system for dam safety control. They also include a performance comparison between proxied and immediate situated tools in the context of dam safety control data visualization.
2. Related Work
The growing demand for robust safety control mechanisms has largely influenced recent developments in dam engineering. There has been a significant focus in scholarly research on improving dam-related data’s visualization, abstraction, and analysis, employing extended reality (XR) technologies [20]. Central to these studies is the situated visualization of dam-specific data. Consequently, much of this research involves the creation of detailed models and simulations of dams and their corresponding hydrographic basins. Advanced techniques such as using unmanned aerial vehicles (UAVs) and light detection and ranging (LiDAR) are frequently employed for precise spatial data collection. Moreover, these models are often designed to integrate seamlessly with building information modeling (BIM) systems and extensively use data derived from sensors [21]. This section begins by reviewing the relevant literature that addresses the core concepts of situatedness in immersive data visualization. It then proceeds to explore previous research that has applied these concepts specifically to the visualization of dam-related data.
2.1. Situated Visualization
Immersive situated visualization consists of the visual representation of data in their spatial and semantic contexts [22]. This representation is carried out in the form of virtual elements integrated into or superimposed directly on the object being observed [23,24] (or on a virtual representation of that object [10]). The theme of situated visualization has been the focus of multiple research works in recent years [25,26,27,28]. ElSayed et al. [29,30] addressed how AR technologies could be used for situated analysis in applications where data embedded in the physical environment were relevant. They focused on interaction and visualization techniques that could better scope results within the object of analysis. They also came up with a context-aware model [31,32] that allowed a seamless transition between the physical space and the information being analyzed. Furthermore, ElSayed et al. [31] evaluated this model in the context of shopping analytics tasks. They showed that the situated approach had advantages in terms of speed and accuracy compared to conventional non-situated means. Abao et al. [33] also addressed the usefulness of situated analytics in shopping scenarios. They designed a mobile AR application that allows users to view nutritional characteristics superimposed on food products in a supermarket. The application allows us to personalize the analysis for users with health conditions, like diabetes, to allow them to select healthier products.
An AR tool that provides professional aid for farmers’ daily fieldwork was proposed by Zheng and Campbell [34]. The mobile AR tool offers an analytics environment that allows users to visualize soil condition data superimposed on real agricultural terrain. Alallah et al. [35] addressed situated video analytics. They focused on developing visualization and interaction techniques that would allow a more effective exploration of video data in situated contexts. Berger [36] explored situated analytics in the context of the visualization of air-quality record datasets. They studied how using audio and sonification techniques could better convey information by improving data perception.
An MR toolkit for in situ temporal data analysis was developed by Buschel et al. [37]. The toolkit is directed at the situated analysis of user interactions and trajectory data. The visualization is carried out using 3D virtual trails and heatmaps. A similar open-source toolkit for situated analytics was presented by Fleck et al. [38]. The analysis of trajectories in situated immersive environments was also addressed by Lin et al. [39]. They compared co-located and situated real-time visualizations in basketball free-throw training. With that objective, they developed a system that allows immediate visual feedback on a player’s shot performance. Their results show that situated visualization can help athletes refine shots better. Guarese et al. [40] addressed the situated analysis of electromagnetic radiation data for detecting external interferences or anomalies. They developed a prototype that allows users to visualize 3D field topologies of different radiation frequencies inside an anechoic chamber.
The process of adapting existing analytics desktop systems to situated analytics mobile platforms was discussed by Zhao et al. [41]. They focused on how interaction and view management techniques could be effectively translated into an AR environment. For that purpose, they compared the effectiveness of situated AR and conventional desktops in scatterplot and storyline visualizations. Ens and Irani [42] discussed how situated analytics could enable everyday analysis tasks to be performed in situ at a convenient place and time. They addressed the most effective ways that information could be superimposed into reality using virtual windows in AR environments. Likewise, Wen et al. [43] examined the effects of different data view layout representations on situatedness by conducting a comparative user study. Moreover, Kurzhals et al. [44] discussed the advantages of using eye tracking in evaluating situated visualizations as an extension of gaze-based methodologies. They propose that such a technique can provide new insights into users’ perceptions and interactions in AR.
Situated analysis environments do not necessarily mandate the use of AR. Realistic virtual proxies for physical referents can effectively be used in VR environments for mimicking the real object of analysis, as explained by Satriadi et al. [10]. Such an example of proxsituated visualization is the immersive analytics VR system developed by Nouri et al. [15]. The system is directed at the situated analysis of building facade durability. It allows users to analyze in a situated virtual environment how biocide availability is affected by rain, the facade’s geometric structure, or the building’s orientation.
The previously presented work primarily analyzes and compares situated approaches versus non-situated ones. For the comparison, they use either proxied situated or immediate situated approaches. As stated earlier, the present study differentiates these by comparing the two distinct modalities of situatedness.
2.2. Extended Reality in Dam Engineering
Previous research has explored the application of immersive environments to enhance engagement and participation in the context of dam-related activities. For instance, Spero et al. [45] conducted a study focusing on the realistic modeling and simulation of dam failures. They aimed to convey dam safety risks to the general public and policymakers. They recreated historical dam disasters using precise hydraulic and structural simulation models supplemented by spatial data acquired through drone technology to achieve this. Janovsky et al. [46] also contributed to this field by employing VR to demonstrate the landscape impact of dam projects to the public. They utilized historical maps to create an immersive environment representing a 1670 km2 basin, simulating its geomorphic changes over 60 years. Furthermore, Macchione et al. [47] investigated the use of VR for risk communication in scenarios involving urban flood hazards due to dam failures. They developed a detailed simulation of a hydrographic basin grounded in LiDAR data. This model, designed for use within an immersive environment, aims to foster the active participation of stakeholders in flood management planning.
Several studies have concentrated on effectively transferring data from engineering design components to immersive environments. A notable example is the research conducted by Lin and Chen [48], who devised a method to streamline the conversion of technical CAD drawings of gravity dams into three-dimensional models for VR applications. Similarly, Zhao and Zhang’s work [49] focused on developing VR models to simulate the construction process of dams. Their approach utilized technical drawings to replicate various construction phases precisely, including foundation excavation stages. The synergy between BIM and three-dimensional models for XR was explored by Wang et al. [50]. They proposed a framework to transform technical drawings into virtual elements suitable for immersive environments. This system was tested in the context of inspecting a steel slit dam. Additionally, the visualization of experimental data pertaining to groundwater flow in scaled-down dam models was investigated by Marques et al. [51]. They employed AR to overlay flow lines, computed using the finite element method, onto physical models. This technique effectively demonstrates the seepage phenomena [52] in embankment dams.
The application of XR for enhancing data visualization in inspecting and managing dam construction has been extensively studied. Lin et al. [53] investigated the use of XR technologies in the quality control of earth and rockfill dam construction. They developed an AR system to assess the quality of earth compaction in real time, utilizing data from positional sensors on compaction roller machines. Wang et al. [54] explored productivity management in dam construction projects, specifically focusing on cable cranes. They adopted an AR-based method to track and optimize the movement of crane buckets, aiming to reduce operational costs. Ren et al. [55] examined the use of AR in inspecting dam construction, particularly in the context of concrete arch dams. Their approach involved structural feature extraction and matching to identify positional discrepancies. The system enables inspectors with AR headsets to view the construction overlaid with the project’s design plan. Zhong et al. [56] employed AR to simulate the construction schedule of core rockfill dams. Their method overlaps digital models of the various construction phases, as per the design plans, onto the physical site to detect discrepancies. This technique was applied in a large-scale hydropower project in southwest China.
Recent research has also emphasized the utilization of XR technologies for monitoring dam safety. Wang et al. [57] explored the application of VR in the monitoring of dams, both during the construction phase and post-construction. They developed an immersive VR environment enabling users to navigate the dam’s structure. This system provides a visual representation of the location of structural sensors and allows for the tracking of the data recorded. The employment of AR for maintaining dam components, such as pipework, valves, and appurtenant structures, was investigated by Goff et al. [58]. They created a mobile AR system designed to aid inspectors in locating equipment, recording measurements, and documenting incidents. Verdelho Trindade et al. [16,17] concentrated on the on-site visualization of structural health monitoring data, overlaying them onto the actual structure of the dam using AR technologies. Their approach included displaying sensor networks on the dam face and visualizing the progression of the structural displacements measured. Additionally, Leitão [19] developed a VR tool offering similar functionalities. However, unlike the on-site tool addressed by Verdelho Trindade, this tool is directed at off-site visualization. It allows dam engineers to visualize structural data contextualized within realistic representations of dams without having to travel to the site. These latter two tools formed the foundation of the current study.
In the context of dam engineering information visualization, technologies like AR and MR allow the superimposition of relevant data to the object of analysis in the real world. In contrast, VR allows dam engineers to visualize and contextualize data in an off-site virtual representation of the real world without having to travel to often remote locations. Realistic virtual environments are associated with an increased sense of presence (the feeling of ‘being there’) [59], hardly attainable using conventional tools like 2D screens. This sense of presence has been known to improve understandability [60,61]. As already mentioned, such immersive environments have also been associated with improved depth and spatial relationship perception [12,13], which can be relevant in obtaining insights concerning the relation between the data and the physical constructs of the dam.
3. System Overview
The system proposed, named DamVR, is a VR prototype tool developed for situated immersive data analysis specifically targeted towards dam safety control. Its primary objective is to visualize the evolving structural behavior of dams, including the response to seismic events. The prototype is aimed at professionals engaged in dam safety control activities, such as civil and structural engineers. It focuses on integrating data visualization within the visual context of the object of analysis (the dam).
Within the virtual environment, users can navigate dam structures and surrounding areas. The system lets users control the visibility of different sensor networks, which are then highlighted on dam structures. An ‘X-ray’ feature is also incorporated, allowing users to render specific sections of the structure semi-transparent, thereby revealing the internal sensors (Figure 2).
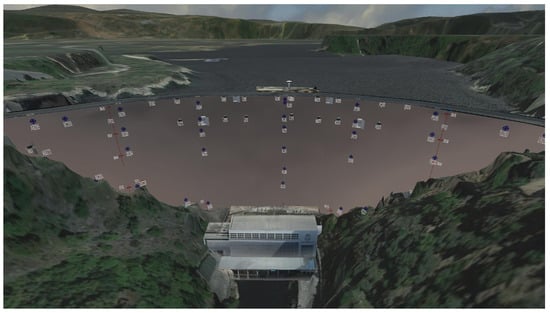
Figure 2.
DamVR’s ‘X-ray’ overview of the sensor network inside the structure of the Cabril Dam.
DamVR can encompass a variety of sensor networks, including geodetic marks, plumblines and their coordinometer bases, GNSS antennas, uniaxial and triaxial accelerometers, leveling marks, and water elevation sensors [5]. Such types of sensors are widely used in concrete dams to register structural displacements, accelerations, and water levels [62]. These sensors are depicted using realistic representations of their typical geometry. For our case study, the Cabril Dam, the sensors were arranged to have precise orientation and positioning relative to the structure. For now, the DamVR prototype functionality is restricted to the types of sensors mentioned above. While the representation of different sensor networks (e.g., strain meters) would be feasible, it would imply the creation of new 3D sensor representations and modifying the existing idioms/charts (or creating new ones if idiom chart types other than line charts were needed). Upon selecting one of these sensors, the system displays panels containing detailed information, including visual representations of the temporal evolution of the sensor’s recorded data.
This section elaborates on the system’s general architecture, detailing its implementation and outlining the features and functionalities of its user interface.
3.1. Architecture
The DamVR system was developed utilizing the Unity game engine and programmed in the C# language. These technological choices ensured maximal compatibility across various VR headset models. The architecture of DamVR, as illustrated in Figure 3, comprises several key components:
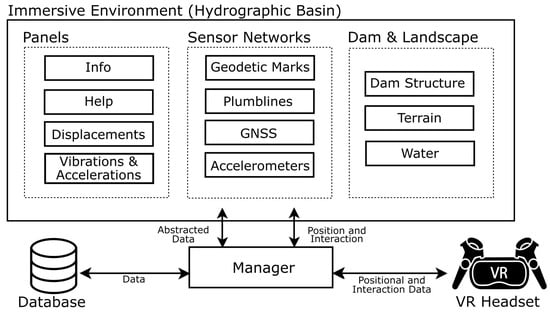
Figure 3.
DamVR system architecture.
- An immersive environment replicating hydrographic basins, allowing free user movement. This environment serves as a spatial reference during data analysis;
- Detailed representations of dams and their surrounding landscape, which includes the primary structure, the terrain, and bodies of water;
- Sensor network models, encompassing geodetic marks, plumblines, GNSS equipment, and accelerometers.
- An array of floating panels within the VR environment. These panels display charts of displacements, vibrations, and accelerations and provide information about selected elements;
- A database containing structural health monitoring information as well as model geometrical and positional data;
- A VR headset with controllers;
- A management module tasked with interpreting data from the database. This module also translates the positional data from the VR equipment into the immersive environment and ensures consistent synchronization between the dam models, the sensor networks, and the informational panels.
The positional and interaction data are transmitted between the VR device (headset and controllers) worn by the user and the management module. This module maps the user’s input to a corresponding interaction in the immersive environment, setting its position and orientation in the virtual world. Within the DamVR system, as users engage with the sensor networks and select individual sensors, the management module initiates a process to retrieve and interpret the relevant data from the database. These extracted data are subsequently visualized on the designated panels, primarily through charts depicting the measured values’ temporal progression. Further interaction with these panels, such as selecting a specific time frame on the charts, prompts the management module to adjust the temporal scope of the data. It achieves this by requesting a specific subset of data from the database corresponding to the selected time frame. This functionality ensures that the information presented to the user is contextually appropriate and temporally accurate.
3.2. User Interface
In the virtual environment of DamVR, users are positioned within digital replicas of hydrographic basins, enabling interaction with sensor arrays inside and outside dam structures. They have the freedom to navigate the environment using controller-based locomotion [63]. Additionally, for traversing longer distances within the virtual space, DamVR incorporates a teleportation-based locomotion feature.
Selection within the immersive environment is carried out using raycasting [64]. This technique is materialized with the projection of visible beams from the VR controllers. Users can direct these beams towards the interface components they wish to select and engage with. For instance, in the context of teleportation, users can aim the beam emanating from the right controller to a desired location within the model to initiate their transport to that position. The user interface within DamVR consists of several key elements: the model of the dam and its surroundings, the sensor networks, floating informational panels, and idiom panels. A comprehensive description of these interface components is presented below.
3.2.1. Model
The model comprises three primary elements: the dam, the surrounding terrain, and the water bodies (Figure 4). Unlike the model, other system components, like sensor networks, can be easily adapted to different dams by directly modifying their corresponding values in the database. Likewise, the water bodies, namely the reservoir (upstream) and the river (downstream), can be adapted to different dams directly by configuring their geometrical and positional characteristics in the database. The river is represented by a static plane, while the reservoir, with its variable water level, requires a more intricate geometry. A programmatically generated flat mesh is used to dynamically adapt the reservoir’s intersection with the dam structure, accounting for fluctuating water levels.
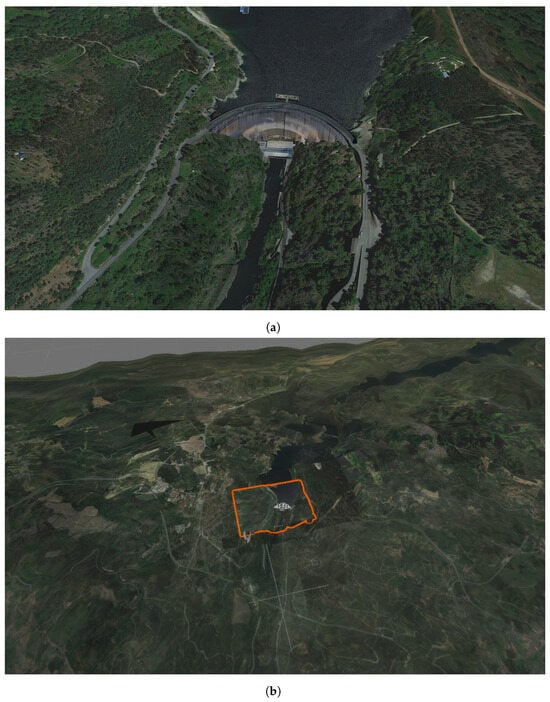
Figure 4.
The representation of the Cabril Dam in DamVR (a) and an overview of the large-scale terrain surrounding the dam (highlighted in orange is the immediate area of the Cabril Dam) (b).
However, creating a model of a dam structure and surrounding terrain requires a more elaborate process. This process includes, in general, the following steps: data acquisition, data preparation and cleaning, 3D mesh creation, texture mapping, material application, and integration of the model in the Unity environment. The database must also be configured with the model’s dimensional limits and positional characteristics. These steps are described for our specific case study, the Cabril Dam, below.
The virtual model of the Cabril Dam, our case study, was derived from a point cloud obtained through 3D scanning field campaigns conducted by LNEC. The acquired point cloud data underwent additional processing to eliminate noise, outliers, and artifacts, enhancing the data’s quality and accuracy. The next phase involved surface reconstruction. A mesh of the dam structure was generated through surface-based reconstruction methods [65]. The mesh underwent additional refinement to improve its quality, including smoothing, decimation, and hole filling. The next step entailed texture application to the 3D model. This texture was created from a photo mosaic, assembled using images captured by a multisensor laser scanner. The texture mapping process then involved assigning these photographic textures to the 3D object.
The completed model was subsequently imported into the graphical engine. Its positional characteristics were then configured to reflect real-world settings. The modeling of the surrounding landscape followed a similar methodology. An initial terrain mesh was created using elevation data, which was then adjusted to align seamlessly with the dam model using Unity’s terrain tools. For the terrain texture, a mosaic of aerial photographs was used. This base layer of texture aimed to mimic the real-world terrain hues closely. A secondary layer comprising 3D elements like trees, bushes, and rocky outcrops was added.
3.2.2. Sensors
Within the immersive environment, the representation of sensor networks is a crucial aspect of user interaction. The prototype includes an extensive variety of sensors and measuring devices. Unlike some existing XR applications [16,17] that opt for symbolic representations of sensors, DamVR adopts a different approach by depicting this equipment realistically. This representation method ensures a more detailed and authentic simulation of the sensor networks, enriching the overall user experience within the virtual environment.
The prototype incorporates three distinct categories of sensing equipment: sensors for measuring structural displacements, sensors for detecting accelerations, and sensors for monitoring water levels. The first category encompasses geodetic marks, plumblines, GNSS equipment, and leveling marks. The second category consists of uniaxial and triaxial accelerometers, along with data acquisition units. The third category is represented by water elevation sensors (Figure 5).
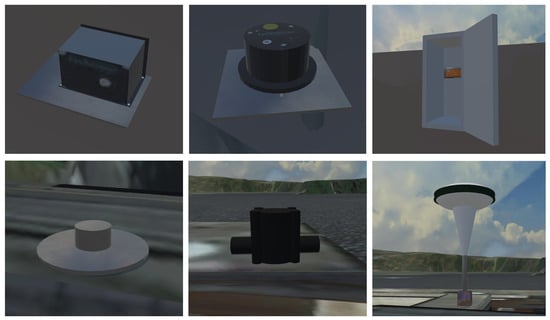
Figure 5.
Models of different elements of the sensor network: uniaxial accelerometer (top left), triaxial accelerometer (top center), data acquisition unit (top right), leveling marks (bottom left), water elevation sensors (bottom center), and GNSS equipment (bottom right).
Certain sensors, located externally to the dam structure, are constantly visible to users positioned in front of the dam’s downstream face. Others, located within the structure, are initially not visible. These occluded sensors can be revealed using an ‘X-ray’ feature (Figure 2), which is activated by directing the selection beam towards a specific section of the structure. This action renders the targeted portion semi-transparent, thereby exposing the embedded sensors. When a sensor is highlighted by the selection beam, it is visually accentuated with a bright color. This visual cue signifies that the sensor is ready to be selected. This interactive approach allows for a comprehensive and detailed exploration of the sensor networks integrated within dam structures.
3.2.3. Panels
Upon selecting a particular sensor within the DamVR environment, the system shows an interactive panel that provides detailed information about the chosen sensor (Figure 6). The data presented on this panel encompasses several key attributes of the sensor. These attributes include the sensor’s identification name (for example, ‘FPI4’), its type (such as ‘plumb line’), its orientation (e.g., ‘inverted’), and its relative position within the structure (for instance, ‘position 4’). Additionally, the panel features toggle buttons that allow users to access various sets of information. These include the sensor’s operational data, additional descriptive details about the sensor, and instructions for navigating the interface.
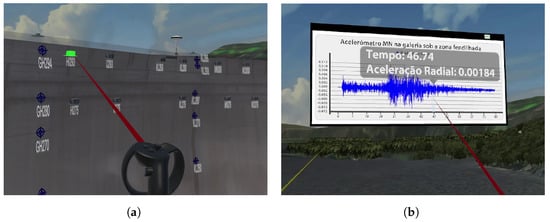
Figure 6.
Selecting a triaxial accelerometer located inside the structure of the Cabril Dam in DamVR (a) and navigating the corresponding idiom. Translation to English (from Portuguese) of text in panel: ‘Acelerómetro MN na galeria sob a zona fendilhada’: ‘MN accelerometer located in the gallery below the cracked area’ (header); ‘Tempo’: ‘Time’, ‘Aceleração Radial’: ‘Radial Acceleration’ (tooltip) (b).
Activating the sensor readings button within DamVR initiates the display of a new panel in the immersive environment. This panel features a collection of interactive two-dimensional idioms that graphically represent the temporal evolution of measured physical quantities. Selecting the option for additional information provides insights into the types of physical quantities measured by the selected sensor, including the most recent recorded value for each quantity and the corresponding date of recording. This panel also shows the dates and epicenters of any recorded earthquakes for accelerometers. The help panel offers straightforward instructions for user interaction with the system. It includes diagrams that clarify the function of each controller button, covering various aspects of navigating the immersive environment and manipulating different panels.
The panels are designed with consistent interaction features. When a user points the selection beam at a panel, its border becomes highlighted, indicating its readiness for interaction. Users can then engage with the panel in various ways. For instance, pressing the trigger button on the controller while aiming at the panel allows users to grab and reposition it within their surrounding space, tailoring the virtual environment to their preferences and needs. The dragging mechanism for panels is designed to maintain a constant distance between the panel and the user. Additionally, the panel is programmed to automatically orient itself so that its front side continuously faces the user, enhancing readability. While a panel is being actively dragged, the user can change its distance relative to themselves and the panel.
3.2.4. Idioms
Upon activation of the sensor readings panel in DamVR, users are presented with a series of interactive two-dimensional idioms that depict the evolution of physical quantities measured over time. For all sensors except accelerometers, this includes a vertical arrangement of three different idioms: a line chart for average daily air temperature evolution, an area chart for upstream water level, and a line chart for radial and tangential displacements. In the specific case of the accelerometers, the panel displays a unique idiom. This is a line chart that represents sensor readings across various time-localized seismic events. The chart shows a single line indicating radial acceleration for uniaxial accelerometers, while for triaxial accelerometers, it includes lines for radial, tangential, and vertical accelerations (Figure 6b).
The idioms are designed with multiple interactive features. For instance, users can aim the selection beam at a point on a chart to request detailed information about a particular measurement, such as the value of horizontal displacement at a specific time. This action triggers a tooltip displaying the relevant timestamp and physical quantity value. Additionally, the charts are equipped with functionalities for both panning and zooming. Users can also zoom into a precise timeframe using a specialized brush-like interaction tool.
A crucial aspect of these idioms is that they share a common timeline on their horizontal axis. This shared timeline is instrumental for dam engineers as it allows for correlating specific measurements with concurrent water level and air temperature conditions. Isolated data, like a single displacement reading, gain increased interpretive value when considered in tandem with these additional parameters. Furthermore, the bound nature of the timelines across the idioms ensures that interactions such as panning or zooming in one chart are concurrently reflected in the other charts.
4. Evaluation
The prototype was evaluated through a user study with 22 participants from whom informed consent was obtained. This study aimed to assess the system’s performance. With that objective, domain experts tested the prototype by carrying out a set of predefined tasks (Figure 7). They were requested to complete a feedback questionnaire assessing the prototype’s usability and usefulness characteristics. During the test sessions, quantitative and qualitative data were recorded. The results were analyzed and compared with the ones obtained in an existing study pertaining to an AR tool, DamAR, with similar functionalities [16,17]. This existing tool uses mobile touch devices (like smartphones and tablets) to display on-site using screen-based visualization, sensor data superimposed on the dam. DamAR represents an immediate situated approach as it uses the physical referent. In opposition, DamVR represents a proxied situated approach as it uses a representation of the physical referent. The methodology adopted for the evaluation also matched the one used by Verdelho Trindade et al. in the existing study.
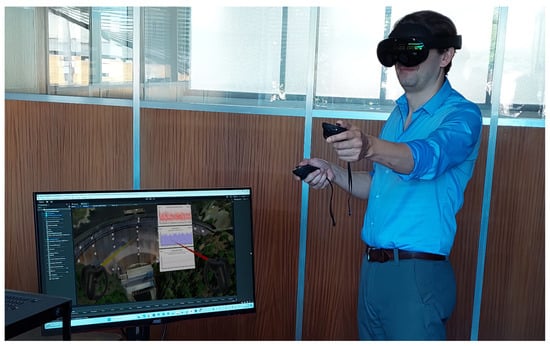
Figure 7.
Domain expert user interacting with DamVR using a VR headset and controllers.
4.1. Materials and Methods
The study was conducted with an experimental group of dam engineering experts from LNEC. It took place at CDD facilities. Initially, the participants filled out a consent form and a characterization questionnaire with demographic information and their professional experience regarding the safety control of dams. They were then asked to perform predefined tasks using the VR prototype. The hardware setup consisted of a Meta Quest/Oculus VR headset connected to a desktop computer. This computer had an Intel Core i7-8700 CPU @ 3.20 GHz processor, 16 GB of RAM, and an NVIDIA GeForce GTX 1060 3 GB graphics card. A monitor, keyboard, and mouse were also used (for filling out questionnaires).
Each participant was asked to perform a set of two tasks. To ensure the relevance of the study to practical scenarios, the proposed tasks were modeled after routine activities carried out by CDD engineers. The first task (T1) had a broad scope, allowing the user to interact with the different interface levels. For that task, the participants were asked to determine the displacement value measured in a specific type of sensor at a specific position. It required the participant to find the sensor by navigating through the environment, find the correct position for that sensor, browse the panels, and explore the idioms to determine the asked value. The second task (T2) had a narrower scope. It focused on evaluating the visibility of the sensors in the virtual environment and determining the ease of recognizing and differentiating each type of sensor. In this task, the user was asked to determine the designation of a sensor located at a recognizable position of the dam.
During the tests, a set of objective metrics was registered. They included the time required to complete each task (measured in seconds) and the number of errors made by the participants. A time limit for completing each task was set, representing the time that a dam engineer would predictably take to complete the same task using a more conventional method (a desktop computer, monitor with keyboard and mouse). It was established from interviews with domain experts. As participants interacted with the prototype, they were encouraged to adopt the think-aloud verbal protocol [66] by expressing their thoughts while performing the tasks. These metrics were registered using screen and audio recordings. After finishing the tasks, the participants removed the VR equipment and were asked to complete a final questionnaire composed of system usability and dam safety control suitability (usefulness) questions. The questionnaire had 22 questions and used a five-level Likert scale for agreement (1: Strongly disagree and 5: Strongly agree) (Appendix A). This custom (non-standard) questionnaire was tailored to address both general and specific characteristics of the prototype. It was designed to obtain relevant insights concerning aspects such as the interface adequacy or the sensors’ and charts’ representation effectiveness. The possible limitations of this questionnaire are addressed in Section 4.3.
4.2. Results and Discussion
The group of 22 domain experts was composed mainly of dam engineers (86%), and 14% were structural engineers. From the dam engineers, 42% belonged to the Modelling and Rock Mechanics Unit, 26% to the Applied Geodesy Unit, 21% to the Monitoring Unit, and 11% to other dam-related research units outside the CDD. All the participants currently worked or had been involved in safety control activities. Only 32% of the participants had former contact with VR, and a mere 14% had used VR in a professional scope.
The results obtained from the individual user-experience questionnaire responses were framed in seven categories: visual quality of the models (C1), intuitiveness of the interface (C2), discernibility of the different sensors (C3), immersive sensation (C4), usefulness in the field of dam safety control (C5), realism of the environment (C6), and comfort of use (C7). These reflect the different system usability and dam safety control suitability aspects that were addressed. The obtained scores for each category (M (SE); Mdn (IQR)) were close: C1: 4.74 (0.021), 5.00 (0.20); C2: 4.67 (0.025), 5.00 (0.69); C3: 4.66 (0.025), 5.00 (0.88); C4: 4.55 (0.027), 5.00 (1.00); C5: 4.48 (0.031), 5.00 (1.00); C6: 4.45 (0.032), 5.00 (1.00); and C7: 4.45 (0.029), 4.80 (1.00). These results are shown in Figure 8.
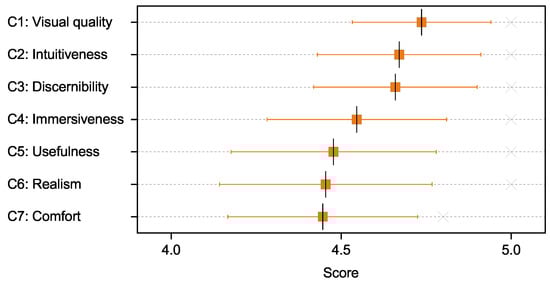
Figure 8.
Distribution of participants’ scores for each user-experience category (horizontal axis values restricted to 4–5 for improved visibility of the differences between category scores).
The high scores obtained across all categories ( = 4.57; = 5.00) support the prototype’s positive usability and usefulness. The result obtained in the ‘intuitiveness’ category may indicate a small interface learning curve, even for inexperienced VR users (68%). The scores in the ‘visual quality’ and ‘realism’ categories highlight the potential benefits of immersive situated visualization in safety control analysis. Such benefits are possibly a result of the ability to frame the data within the visual context of the dam.
Regarding objective metrics, the time necessary to complete T1 was significantly higher than the time to complete T2 ( = 97, = 47.75 (s); = 16, = 12.25 (s)). This difference can be explained by the fact that T1 had a broader scope and a significantly higher expected interaction time. However, more users (95%) completed T1 successfully than T2 (91%) (within the time limit of 200 s for T1 and 30 s for T2).
We wanted to find out if the participants’ varying degrees of familiarity with VR had influenced their performance. With that objective, Spearman correlation coefficients were computed to assess the monotonic relationship between the familiarity of participants and both the time spent and number of errors (in tasks T1, T2). We found mostly weak correlations between the pairs of variables, apart from a moderate [67] positive correlation between familiarity and T1 time ([familiarity, T1 time], (22) = 0.431, p = 0.045; [familiarity, T2 time], (22) = −0.09, p = 0.69; [familiarity, T1 errors], (22) = 0.014, p = 0.95; [familiarity, T2 errors], (22) =−0.047, p = 0.835). As such, the results on the influence of familiarity with VR on participants’ performance are inconclusive. Further research is needed to determine the exact nature of this relationship. Moderate correlations (Spearman) were also found between the age of participants and aspects of their performance ([age, T1 time], (22) = 0.471, p = 0.027; [age, T2 errors], (22) = −0.492, p = 0.153), but only weak correlations for other aspects ([age, T2 time], (22) = −0.315, p = 0.69; [age, T1 errors], (22) = 0.179, p = 0.424).
One of this study’s main objectives was to compare the results obtained with the proxied situated approach and those obtained in the previous immediate situated/screen-based visualization study. Although the groups that evaluated the two prototypes shared most of their participants (they were mostly made of dam experts working in the same department at LNEC), the tests were carried out at a significant temporal distance [16]. So, we first wanted to address their statistical similarity. With that objective, we carried out Mann–Whitney and Levene tests to address the statistical similarity and the homogeneity of variances between the groups of participants. We considered age, education, gender, and familiarity using XR technologies as the relevant variables for these tests. The results show that there are not enough statistically significant differences between the two groups (U = 238, p < 0.930 (age); U = 240, p < 0.970 (education); U = 231, p < 0.743 (gender); U = 223, p < 0.611 (XR familiarity)). The results also show that the groups are similar in terms of variance (the assumption of homogeneity of variances is met) (F = 0.068, p = 0.796 (age); F = 3.904, p = 0.055 (education); F = 0.465, p = 0.499 (gender); F = 0.053, p = 0.818 (XR familiarity)).
Given that the experimental samples had no statistically significant differences, we wanted to compare the proxied situated/VR and immediate situated/screen-based visualization approaches in relevant aspects of user experience. With that objective, five of the previously defined categories were addressed: C1, C2, C3, C5, and C7. ‘Immersiveness’ and ‘realism’ (C4, C6) were left out of the comparison because of their lack of relevancy in the scope of the immediate situated/screen-based visualization approach. In addition to the scores obtained with the proxied situated approach (shown above), the results obtained for each relevant category with the immediate situated approach (M (SE); Mdn (IQR)) were: comfort (4.59 (0.016); 4.60 (0.40)), usefulness (4.60 (0.019); 4.67 (0.67)), intuitiveness (4.82 (0.013); 5.00 (0.33)), discernibility (4.76 (0.018); 5.00 (0.33)), and visual quality (4.84 (0.012); 5.00 (0.17)). The results show similar scores in both reality/situatedness modalities, with a marginally but consistently higher score for the immediate situated/screen-based visualization approach across the considered categories (Figure 9). To understand the statistical significance of category score differences between prototypes, Wilcoxon Signed-Rank tests were carried out, with a prior assessment of the distribution non-normality (using a Shapiro–Wilk test). The results offer no evidence against the supposition of no statistically significant difference between the sets of category scores (C1: p = 0.434 (W = 59.5); C2: p = 0.534 (W = 55.5); C3: p = 0.503 (W = 30.0); C5: p = 0.413 (W = 39.0); C7: p = 0.509 (W = 41.5)).
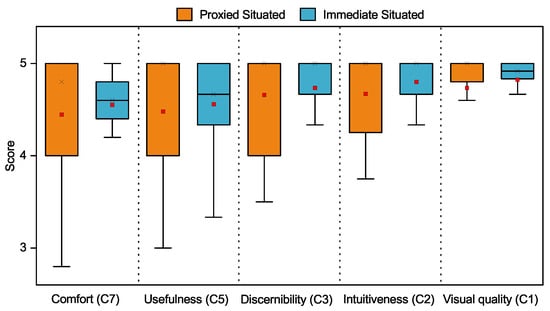
Figure 9.
Comparison of the distributions of participants’ scores for each user-experience category with the proxied situated/VR and the immediate situated/screen-based visualization prototypes (vertical axis values restricted to 3–5 for improved visibility of the differences between modalities).
The linear relationship between the scores of different categories in each modality was also assessed. With that objective, Pearson correlation coefficients were computed. Strong [67] positive correlations were found between the five categories in the proxied situated approach (r(22) = [0.88, 0.96], p < 0.001) and moderate to strong correlations were found in the immediate situated/screen-based visualization approach (r(22) = [0.43, 0.82], p < 0.001, 0.05).
Regarding the comparison of objective metrics, for T1, the comparison of the registered times with the ones obtained in the previous immediate situated study (Figure 10) shows significantly higher task completion times for the proxied situated study ( = 97, = 47.75 (s); = 20, = 9.00 (s)). For T2, the completion times were similar ( = 16, = 12.25 (s); = 16, = 10.00 (s)). To understand the statistical significance of T1 completion time differences between approaches, a Wilcoxon Signed-Rank test was carried out, with a prior assessment of the distribution non-normality (using a Shapiro-Wilk test). The results offer evidence against the supposition of no statistically significant difference between the two sets of completion times, with p < 0.001 (W = 254).
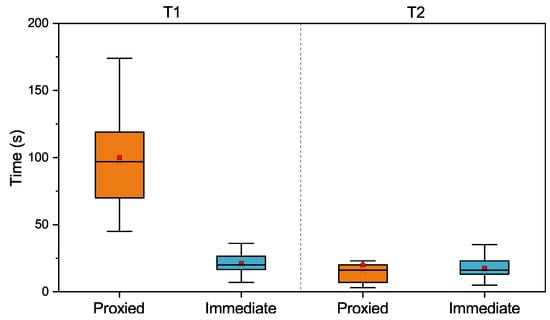
Figure 10.
Comparison between the time participants took to complete T1 and T2 both with the proxied situated/VR and immediate situated/screen-based visualization prototypes.
The significant deviation between the performance of the proxied situated and the immediate situated/screen-based visualization approaches for T1 may be attributed to a multiplicity of factors. Such factors include the distinct situatedness modalities (proxied vs. immediate), reality types, interaction modality differences (touch vs. tracked controllers) or the different levels of immersiveness, among others. The immediate situated/screen-based approach offers advantages in the contextualization of data (even if the realism and immersiveness of the proxied situated prototype were highlighted by the participants).
Concerning the number of errors made by the participants, T1 had a higher number of errors than T2. Less than half (48%) of the participants completed T1 without making any mistakes. In contrast, 95% of the participants completed T2 without any errors. Furthermore, 42% of the participants completed both tasks without making mistakes. The comparison of the registered number of errors with the previous immediate situated/screen-based visualization study (Figure 11) shows a higher number of errors for the proxied situated study for both tasks.
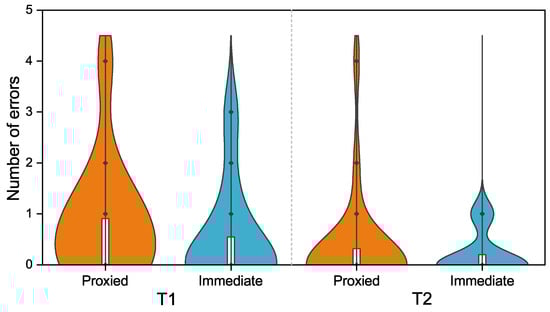
Figure 11.
Number of errors/mistakes that participants made in T1 and T2, both with the proxied situated and immediate situated/screen-based visualization prototypes.
4.3. Limitations and Future Work
This study’s interpretation of results must be contextualized within the scope of its methodological constraints and the reasoning behind specific decisions. A primary limitation is the relatively small sample size. The study was confined to a narrow scope, potentially expandable to a broader range of participants (for instance, engineers from fields beyond dam engineering). However, the choice was made to maintain a controlled experimental environment with a smaller yet more homogeneous sample of domain experts.
A methodological limitation is the adoption of a non-standard protocol for the user-experience survey. Employing a widely recognized questionnaire, such as the System Usability Scale (SUS)—despite the survey used being quite similar—would have facilitated more straightforward generalization and comparison of the results. A notable limitation lies in comparing the results of the VR prototype with those from another study conducted earlier at a significant temporal distance. Despite the temporal gap, it is noteworthy that both prototypes shared a similar experimental user sample. The interfaces of the two prototypes also exhibit significant differences, reflecting their distinct reality modalities and interaction mechanisms.
It is also essential to recognize that this VR prototype represents just an initial step towards creating an advanced immersive proxied situated analysis system for dam safety control. Future research directions could address the limitations mentioned above and explore further enhancements. These enhancements might include the development of photorealistic dam models, deeper integration with BIM, and the establishment of collaborative, sensor-rich environments for more comprehensive safety control data analysis.
5. Conclusions
This study presents DamVR, a novel prototype tool for immersive proxied situated analysis specifically tailored for dam safety control. It examines the tool’s diverse features, application contexts, advantages, and limitations. Furthermore, it discusses the assessment of the prototype by domain experts through an individual survey aimed at evaluating user experience. The results of this survey indicate that DamVR is intuitive and comfortable to use, even for individuals without prior experience in VR. It also reveals that the prototype successfully creates a realistic and immersive environment, which is advantageous for contextualizing dam safety control tasks. Additionally, its performance results are compared with findings from a previous study on an immediate situated/screen-based visualization tool. This comparative analysis shows that while DamVR achieves similar task completion times for simpler tasks, it encounters performance challenges with more complex tasks. Likewise, its usage shows no improvements in the number of user mistakes compared to the immediate situated/screen-based visualization version. The results also show that the proxied situated approach used in the VR tool had a slight decrease in scores across all relevant user experience categories compared to the immediate situated/screen-based approach. The findings indicate that while results may depend strongly on factors such as the realism of the virtual environment, the immediate physical referent offered some advantages over the physical referent proxy in the contextualization of data. However, differences between approaches were slender in several aspects, suggesting that introducing features like environment photorealism in the proxied situated approach may further reduce such differences. The current proof-of-concept version of DamVR transposed some of the features of 3D analytical programs to immersive environments by leveraging recent advancements in VR technology. Future developments will focus on implementing advanced analytics functionalities. These can take advantage of aspects that are not easily attainable using traditional visualization means. Such aspects include spatial annotations, hands-free natural manipulation, and haptic feedback cues, offering a richer multi-sensory data analysis experience.
Author Contributions
Conceptualization, N.V.T., S.O. and A.F.; methodology, N.V.T., S.O. and A.F.; software, N.V.T. and P.L.; validation, N.V.T., D.G., S.O. and A.F.; formal analysis, N.V.T.; investigation, N.V.T., P.L., S.O. and A.F.; resources, N.V.T., S.O. and A.F.; data curation, P.L.; writing—original draft preparation, N.V.T.; writing—review and editing, N.V.T.; visualization, N.V.T.; supervision, N.V.T., D.G., S.O. and A.F.; project administration, N.V.T., D.G., S.O. and A.F.; funding acquisition, N.V.T., D.G., S.O. and A.F. All authors have read and agreed to the published version of the manuscript.
Funding
This work was supported by national funds through FCT, Fundação para a Ciência e a Tecnologia, under projects UIDB/50021/2020 (https://doi.org/10.54499/UIDB/50021/2020) and PDTC/ECI-ECG/5332/2020 and grant 2021.07266.BD.
Institutional Review Board Statement
This study did not involve medical research with human subjects.
Data Availability Statement
Data are contained within the article.
Acknowledgments
This paper uses the work of Leitão [19] and Verdelho Trindade et al. [16,17,18] as a base and expands it by considering additional factors and conducting substantively different analyses and assessments.
Conflicts of Interest
The authors declare no conflicts of interest.
Appendix A. Questionnaire Questions
This appendix includes the set of questionnaire questions given to participants, translated into the English language. The original (in Portuguese) can be found in Leitão [19], pp. 88–90. The questionnaire has 22 questions and uses a five-level Likert scale for agreement (1: Strongly disagree and 5: Strongly agree).
Feedback Form
This questionnaire lasts approximately 2 min, and aims to record your opinion about the test you just carried out, as well as the general functioning of the prototype. All information obtained from this questionnaire will be treated confidentially and will be used solely for academic purposes. We appreciate your availability and time to participate.
| Regarding the prototype: (select only one option on each line) | |||||
| 1-Strongly disagree | 2 | 3 | 4 | 5-Strongly agree | |
| It has a friendly interface | ○ | ○ | ○ | ○ | ○ |
| It’s comfortable to use | ○ | ○ | ○ | ○ | ○ |
| It’s easy to use | ○ | ○ | ○ | ○ | ○ |
| I consider the prototype useful for sensor data analysis | ○ | ○ | ○ | ○ | ○ |
| I see potential in this prototype to be useful in the future in supporting dam safety control tasks | ○ | ○ | ○ | ○ | ○ |
| Regarding the tasks: (select only one option on each line) | |||||
| 1-Strongly disagree | 2 | 3 | 4 | 5-Strongly agree | |
| It was easy to perform task A (comparing the values in the graph) | ○ | ○ | ○ | ○ | ○ |
| It was easy to perform task B (identify geodetic mark) | ○ | ○ | ○ | ○ | ○ |
| Regarding the sensors: (select only one option on each line) | |||||
| 1-Strongly disagree | 2 | 3 | 4 | 5-Strongly agree | |
| It’s easy to distinguish between each type of sensor | ○ | ○ | ○ | ○ | ○ |
| It’s easy to distinguish between different sensors of the same type | ○ | ○ | ○ | ○ | ○ |
| It’s easy to select each sensor | ○ | ○ | ○ | ○ | ○ |
| It’s easy to identify the name/reference of sensors | ○ | ○ | ○ | ○ | ○ |
| The sensors have adequate dimensions | ○ | ○ | ○ | ○ | ○ |
| Regarding the interactive menu: (select only one option on each line) | |||||
| 1-Strongly disagree | 2 | 3 | 4 | 5-Strongly agree | |
| It’s easy to use | ○ | ○ | ○ | ○ | ○ |
| It has adequate colors and icons | ○ | ○ | ○ | ○ | ○ |
| It has adequate dimensions | ○ | ○ | ○ | ○ | ○ |
| Regarding the data charts: (select only one option on each line) | |||||
| 1-Strongly disagree | 2 | 3 | 4 | 5-Strongly agree | |
| The charts are easy to read | ○ | ○ | ○ | ○ | ○ |
| It was easy to find the desired information | ○ | ○ | ○ | ○ | ○ |
| The colors and dimensions are adequate | ○ | ○ | ○ | ○ | ○ |
| The data visualization features (zoom and pan) are easy to use | ○ | ○ | ○ | ○ | ○ |
| Immersiveness and realism: (select only one option on each line) | |||||
| 1-Strongly disagree | 2 | 3 | 4 | 5-Strongly agree | |
| The representation of the Cabril Dam is realistic | ○ | ○ | ○ | ○ | ○ |
| The representation of the area surrounding the dam is realistic | ○ | ○ | ○ | ○ | ○ |
| I felt immersed in the experience | ○ | ○ | ○ | ○ | ○ |
References
- Gu, C.; Cui, X.; Gu, H.; Yang, M. A New Hybrid Monitoring Model for Displacement of the Concrete Dam. Sustainability 2023, 15, 9609. [Google Scholar] [CrossRef]
- Carvalho, E.; Matsinhe, B.; Mendes, P.; Oliveira, S.; Alegre, A.; Ciudad-Real, M.; Skolnik, D.; El-Idrissi, M. SSHM Systems for Dams: 12 Years’ Experience in Cahora Bassa Dam. Equipment, Software, and Main Results. In Experimental Vibration Analysis for Civil Engineering Structures; Limongelli, M.P., Giordano, P.F., Quqa, S., Gentile, C., Cigada, A., Eds.; Springer Nature Switzerland: Cham, Switzerland, 2023; Volume 432, pp. 273–282. [Google Scholar] [CrossRef]
- de Castro, A.T.; Mata, J.; Barateiro, J.; Miranda, P. Information Management Systems for Dam Safety Control. The Portuguese Experience. In Proceedings of the 54º Congresso Brasileiro Do Concreto-CBC, Maceió, Brazil, 8–11 October 2012; pp. 1–13. [Google Scholar]
- Oliveira, S.; Alegre, A.; Carvalho, E.; Mendes, P.; Proença, J. Seismic and Structural Health Monitoring Systems for Large Dams: Theoretical, Computational and Practical Innovations. Bull. Earthq. Eng. 2022, 20, 4483–4512. [Google Scholar] [CrossRef]
- Oliveira, S.; Silvestre, A. Barragem do Cabril-Sistema para Monitorização de Vibrações em Contínuo-Medição e Análise Automática da Resposta Dinâmica sob Excitação Ambiente/Operacional e sob Ações Sísmicas; Technical Report 205/2017–DBB/NMMR; Laboratório Nacional de Engenharia Civil (LNEC): Lisbon, Portugal, 2017. [Google Scholar]
- Pereira, D.G.; Martins, F.G. Barragem do Cabril—Inspeção à Estrutura e ao Sistema de Observação Efetuada em Abril de 2015; Technical Report 78/2016 – DBB/NO, LNEC; Laboratório Nacional de Engenharia Civil (LNEC): Lisbon, Portugal, 2016. [Google Scholar]
- Qu, P.; Chai, J.; Xu, Z. Three-Dimensional Static and Dynamic Analyses of an Embedded Concrete-Face Rockfill Dam. Water 2023, 15, 4189. [Google Scholar] [CrossRef]
- Li, B.; Yang, J.; Hu, D. Dam Monitoring Data Analysis Methods: A Literature Review. Struct. Control. Health Monit. 2020, 27, e2501. [Google Scholar] [CrossRef]
- Alpay, L. Can Contextualization Increase Understanding During Man-Machine Communication? A Theory-Driven Study. Open Med. Inform. J. 2008, 2, 82–91. [Google Scholar] [CrossRef] [PubMed]
- Satriadi, K.A.; Cunningham, A.; Smith, R.T.; Dwyer, T.; Drogemuller, A.; Thomas, B.H. ProxSituated Visualization: An Extended Model of Situated Visualization Using Proxies for Physical Referents. In Proceedings of the 2023 CHI Conference on Human Factors in Computing Systems, Hamburg, Germany, 23–28 April 2023; pp. 1–20. [Google Scholar] [CrossRef]
- Skarbez, R.; Polys, N.F.; Ogle, J.T.; North, C.; Bowman, D.A. Immersive Analytics: Theory and Research Agenda. Front. Robot. AI 2019, 6, 82. [Google Scholar] [CrossRef] [PubMed]
- Guo, M.; Yue, K.; Hu, H.; Lu, K.; Han, Y.; Chen, S.; Liu, Y. Neural Research on Depth Perception and Stereoscopic Visual Fatigue in Virtual Reality. Brain Sci. 2022, 12, 1231. [Google Scholar] [CrossRef]
- Vienne, C.; Masfrand, S.; Bourdin, C.; Vercher, J.L. Depth Perception in Virtual Reality Systems: Effect of Screen Distance, Environment Richness and Display Factors. IEEE Access 2020, 8, 29099–29110. [Google Scholar] [CrossRef]
- Marriott, K.; Schreiber, F.; Dwyer, T.; Klein, K.; Riche, N.; Itoh, T.; Stuerzlinger, W.; Thomas, B. Immersive Analytics; Lecture Notes in Computer Science; Springer International Publishing: Berlin/Heidelberg, Germany, 2018. [Google Scholar]
- Nouri, N.; Kalamkar, S.; Farzinnejad, F.; Biener, V.; Schick, F.; Kalkhof, S.; Grubert, J. Improving Understanding of Biocide Availability in Facades through Immersive Analytics. In Proceedings of the 2022 IEEE International Symposium on Mixed and Augmented Reality Adjunct (ISMAR-Adjunct), Singapore, 17–21 October 2022; pp. 98–103. [Google Scholar] [CrossRef]
- Verdelho Trindade, N.; Ferreira, A.; Oliveira, S. DamAR: Augmented Reality in Dam Safety Control. Int. J. Hydropower Dams 2019, 26, 7. [Google Scholar]
- Verdelho Trindade, N.; Ferreira, A.; Oliveira, S. Extended Reality in the Safety Control of Dams. In Proceedings of the Fourth International Dam World Conference-DW2020, Lisbon, Portugal, 22–24 September 2020; Volume 1, Paper 169. pp. 71–89. [Google Scholar]
- Verdelho Trindade, N.; Leitão, P.; Gonçalves, D.; Oliveira, S.; Ferreira, A. Immersive Situated Analysis of Dams’ Behavior. In Proceedings of the Fifth International Conference on Graphics and Interaction-ICGI 2023, Tomar, Portugal, 2–3 November 2023; pp. 105–112. [Google Scholar]
- Leitão, P. Dam Health Monitoring with Virtual Reality. Master’s Thesis, Instituto Superior Técnico, Lisbon, Portugal, 2023. [Google Scholar]
- Mata, J.; Santos, J.; Barateiro, J. Using Emergent Technologies on the Structural Health Monitoring and Control of Critical Infrastructures. In Industry 4.0 for the Built Environment; Bolpagni, M., Gavina, R., Ribeiro, D., Eds.; Springer International Publishing: Cham, Switzerland, 2022; Volume 20, pp. 541–567. [Google Scholar] [CrossRef]
- Rahimian, F.P.; Goulding, J.S.; Abrishami, S.; Seyedzadeh, S.; Elghaish, F. Industry 4.0 Solutions for Building Design and Construction: A Paradigm of New Opportunities, 1st ed.; Routledge: London, UK, 2021. [Google Scholar]
- White, S.; Feiner, S. SiteLens: Situated Visualization Techniques for Urban Site Visits. In Proceedings of the SIGCHI Conference on Human Factors in Computing Systems, Boston, MA, USA, 4–9 April 2009; pp. 1117–1120. [Google Scholar] [CrossRef]
- White, S.; Feiner, S.; Kopylec, J. Virtual Vouchers: Prototyping a Mobile Augmented Reality User Interface for Botanical Species Identification. In Proceedings of the 3D User Interfaces (3DUI’06), Alexandria, VA, USA, 25–26 March 2006; pp. 119–126. [Google Scholar] [CrossRef]
- Willett, W.; Jansen, Y.; Dragicevic, P. Embedded Data Representations. IEEE Trans. Vis. Comput. Graph. 2017, 23, 461–470. [Google Scholar] [CrossRef]
- Thomas, B.H.; Welch, G.F.; Dragicevic, P.; Elmqvist, N.; Irani, P.; Jansen, Y.; Schmalstieg, D.; Tabard, A.; ElSayed, N.A.M.; Smith, R.T.; et al. Situated Analytics. In Immersive Analytics; Marriott, K., Schreiber, F., Dwyer, T., Klein, K., Riche, N.H., Itoh, T., Stuerzlinger, W., Thomas, B.H., Eds.; Springer International Publishing: Cham, Switzerland, 2018; Volume 11190, pp. 185–220. [Google Scholar] [CrossRef]
- Martins, N.C.; Marques, B.; Alves, J.; Araújo, T.; Dias, P.; Santos, B.S. Augmented Reality Situated Visualization in Decision-Making. Multimed. Tools Appl. 2022, 81, 14749–14772. [Google Scholar] [CrossRef]
- Bressa, N.; Korsgaard, H.; Tabard, A.; Houben, S.; Vermeulen, J. What’s the Situation with Situated Visualization? A Survey and Perspectives on Situatedness. IEEE Trans. Vis. Comput. Graph. 2022, 28, 107–117. [Google Scholar] [CrossRef]
- Shin, S.; Batch, A.; Butcher, P.W.S.; Ritsos, P.D.; Elmqvist, N. The Reality of the Situation: A Survey of Situated Analytics. IEEE Trans. Vis. Comput. Graph. 2023, 1–19. [Google Scholar] [CrossRef]
- ElSayed, N.; Thomas, B.; Marriott, K.; Piantadosi, J.; Smith, R. Situated Analytics. In Proceedings of the 2015 Big Data Visual Analytics (BDVA), Hobart, Australia, 22–25 September 2015; pp. 1–8. [Google Scholar] [CrossRef]
- ElSayed, N.A.M.; Thomas, B.H.; Smith, R.T.; Marriott, K.; Piantadosi, J. Using Augmented Reality to Support Situated Analytics. In Proceedings of the 2015 IEEE Virtual Reality (VR), Arles, France, 23–27 March 2015; pp. 175–176. [Google Scholar] [CrossRef]
- ElSayed, N.A.M.; Smith, R.T.; Marriott, K.; Thomas, B.H. Blended UI Controls for Situated Analytics. In Proceedings of the 2016 Big Data Visual Analytics (BDVA), Sydney, Australia, 22–25 November 2016; pp. 1–8. [Google Scholar] [CrossRef]
- ElSayed, N.A.; Smith, R.T.; Marriott, K.; Thomas, B.H. Context-Aware Design Pattern for Situated Analytics: Blended Model View Controller. J. Vis. Lang. Comput. 2018, 44, 1–12. [Google Scholar] [CrossRef]
- Abao, R.P.; Malabanan, C.V.; Galido, A.P. Design and Development of FoodGo: A Mobile Application Using Situated Analytics to Augment Product Information. Procedia Comput. Sci. 2018, 135, 186–193. [Google Scholar] [CrossRef]
- Zheng, M.; Campbell, A.G. Location-Based Augmented Reality In-Situ Visualization Applied for Agricultural Fieldwork Navigation. In Proceedings of the 2019 IEEE International Symposium on Mixed and Augmented Reality Adjunct (ISMAR-Adjunct), Beijing, China, 10–18 October 2019; pp. 93–97. [Google Scholar] [CrossRef]
- Alallah, F.; Sakamoto, Y.; Irani, P. Exploring the Need and Design for Situated Video Analytics. In Proceedings of the Symposium on Spatial User Interaction, Virtual Event, 9–10 November 2020; pp. 1–11. [Google Scholar] [CrossRef]
- Berger, M. Egocentric Sonification of Continuous Spatial Data in Situated Analytics. In Proceedings of the 2020 IEEE Conference on Virtual Reality and 3D User Interfaces Abstracts and Workshops (VRW), Atlanta, GA, USA, 22–26 March 2020; pp. 658–659. [Google Scholar] [CrossRef]
- Büschel, W.; Lehmann, A.; Dachselt, R. MIRIA: A Mixed Reality Toolkit for the In-Situ Visualization and Analysis of Spatio-Temporal Interaction Data. In Proceedings of the 2021 CHI Conference on Human Factors in Computing Systems, Yokohama, Japan, 8–13 May 2021; pp. 1–15. [Google Scholar] [CrossRef]
- Fleck, P.; Calepso, A.S.; Hubenschmid, S.; Sedlmair, M.; Schmalstieg, D. RagRug: A Toolkit for Situated Analytics. IEEE Trans. Vis. Comput. Graph. 2023, 29, 3281–3297. [Google Scholar] [CrossRef]
- Lin, T.; Singh, R.; Yang, Y.; Nobre, C.; Beyer, J.; Smith, M.A.; Pfister, H. Towards an Understanding of Situated AR Visualization for Basketball Free-Throw Training. In Proceedings of the 2021 CHI Conference on Human Factors in Computing Systems, Yokohama, Japan, 8–13 May 2021; pp. 1–13. [Google Scholar] [CrossRef]
- Guarese, R.; Andreasson, P.; Nilsson, E.; Maciel, A. Augmented Situated Visualization Methods towards Electromagnetic Compatibility Testing. Comput. Graph. 2021, 94, 1–10. [Google Scholar] [CrossRef] [PubMed]
- Zhao, M.; Su, Y.; Zhao, J.; Chen, S.; Qu, H. Mobile Situated Analytics of Ego-Centric Network Data. In Proceedings of the SIGGRAPH Asia 2017 Symposium on Visualization, Bangkok, Thailand, 27–30 November 2017; pp. 1–8. [Google Scholar] [CrossRef]
- Ens, B.; Irani, P. Spatial Analytic Interfaces: Spatial User Interfaces for In Situ Visual Analytics. IEEE Comput. Graph. Appl. 2017, 37, 66–79. [Google Scholar] [CrossRef] [PubMed]
- Wen, Z.; Zeng, W.; Weng, L.; Liu, Y.; Xu, M.; Chen, W. Effects of View Layout On Situated Analytics for Multiple-View Representations in Immersive Visualization. IEEE Trans. Vis. Comput. Graph. 2022, 29, 440–450. [Google Scholar] [CrossRef]
- Kurzhals, K.; Becher, M.; Pathmanathan, N.; Reina, G. Evaluating Situated Visualization in AR with Eye Tracking. In Proceedings of the 2022 IEEE Evaluation and Beyond-Methodological Approaches for Visualization (BELIV), Oklahoma City, OK, USA, 17 October 2022; pp. 77–84. [Google Scholar] [CrossRef]
- Spero, H.R.; Vazquez-Lopez, I.; Miller, K.; Joshaghani, R.; Cutchin, S.; Enterkine, J. Drones, Virtual Reality, and Modeling: Communicating Catastrophic Dam Failure. Int. J. Digit. Earth 2022, 15, 585–605. [Google Scholar] [CrossRef]
- Janovský, M.; Tobiáš, P.; Cehák, V. 3D Visualisation of the Historic Pre-Dam Vltava River Valley—Procedural and CAD Modelling, Online Publishing and Virtual Reality. ISPRS Int. J. Geo-Inf. 2022, 11, 376. [Google Scholar] [CrossRef]
- Macchione, F.; Costabile, P.; Costanzo, C.; De Santis, R. Fully-Hydrodynamic Modelling Supporting Flood Hazard Assessment and Communication: A Reference Framework. Ital. J. Eng. Geol. Environ. 2018, 1, 101–121. [Google Scholar] [CrossRef]
- Lin, S.; Chen, S. 3D Design of Gravity Dam Based on Virtual Reality CAD Dynamic Interactive System. Comput. Aided Des. Appl. 2021, 19, 11–20. [Google Scholar] [CrossRef]
- Zhao, J.; Zhang, J. Application of Multimedia Technology in Water Conservancy and Hydropower Engineering. J. Vis. Commun. Image Represent. 2020, 71, 102707. [Google Scholar] [CrossRef]
- Wang, K.C.; Wang, S.H.; Kung, C.J.; Weng, S.W.; Wang, W.C. Applying BIM and Visualization Techniques to Support Construction Quality Management for Soil and Water Conservation Construction Projects. In Proceedings of the 34th International Symposium on Automation and Robotics in Construction, Taipei, Taiwan, 28 June–1 July 2018. [Google Scholar] [CrossRef]
- Marques, J.C.; Rodrigues, J.; Restivo, M.T. Augmented Reality in Groundwater Flow. In Proceedings of the 2014 11th International Conference on Remote Engineering and Virtual Instrumentation (REV), Porto, Portugal, 1–3 March 2014; pp. 399–400. [Google Scholar] [CrossRef]
- Rehamnia, I.; Benlaoukli, B.; Jamei, M.; Karbasi, M.; Malik, A. Simulation of Seepage Flow through Embankment Dam by Using a Novel Extended Kalman Filter Based Neural Network Paradigm: Case Study of Fontaine Gazelles Dam, Algeria. Measurement 2021, 176, 109219. [Google Scholar] [CrossRef]
- Lin, W.; Cui, B.; Tong, D.; Wang, J.; Wang, X.; Zhang, J. Development and Application of Three-Dimensional Intelligent Monitoring System for Rolling Quality of Earth-Rock Dam under BS Framework. J. Hohai Univ. 2022, 50, 18. [Google Scholar] [CrossRef]
- Wang, D.; Wang, X.; Ren, B.; Wang, J.; Zeng, T.; Kang, D.; Wang, G. Vision-Based Productivity Analysis of Cable Crane Transportation Using Augmented Reality–Based Synthetic Image. J. Comput. Civ. Eng. 2022, 36, 04021030. [Google Scholar] [CrossRef]
- Ren, B.; Lu, X.; Wang, X.; Wang, D.; Wang, J.; Yu, J. Mobile Augmented Reality Visualization of High Arch Dam Construction Simulations Based on Simultaneous Localization and Mapping Optimization. J. Hydroelectr. Eng. 2021, 40, 115–128. [Google Scholar] [CrossRef]
- Zhong, D.; Wang, Z.; Guan, T.; Wang, D.; Yan, Y. Visual Simulation of Construction Schedule for Core Rock-Fill Dam Based on Augmented Reality. J. Tianjin Univ. Sci. Technol. 2018, 51, 1072–1085. [Google Scholar] [CrossRef]
- Wang, W.; Li, X.; Deng, Z. The Development and Application of 3-D Visual Display Platform for Safety Monitoring Information of Hydropower Project. IOP Conf. Ser. Earth Environ. Sci. 2018, 189, 022050. [Google Scholar] [CrossRef]
- Goff, C.A.; Atyeo, M.S.; Gimeno, O.; Wetton, M.N. Dealing with Data: Innovation in Monitoring and Operation and Maintenance of Dams. Dams Reserv. 2016, 26, 5–12. [Google Scholar] [CrossRef]
- Dengel, A.; Mägdefrau, J. Presence Is the Key to Understanding Immersive Learning. In Immersive Learning Research Network; Beck, D., Peña-Rios, A., Ogle, T., Economou, D., Mentzelopoulos, M., Morgado, L., Eckhardt, C., Pirker, J., Koitz-Hristov, R., Richter, J., et al., Eds.; Springer International Publishing: Cham, Switzerland, 2019; Volume 1044, pp. 185–198. [Google Scholar] [CrossRef]
- Lønne, T.F.; Karlsen, H.R.; Langvik, E.; Saksvik-Lehouillier, I. The Effect of Immersion on Sense of Presence and Affect When Experiencing an Educational Scenario in Virtual Reality: A Randomized Controlled Study. Heliyon 2023, 9, e17196. [Google Scholar] [CrossRef] [PubMed]
- Checa, D.; Bustillo, A. A Review of Immersive Virtual Reality Serious Games to Enhance Learning and Training. Multimed. Tools Appl. 2020, 79, 5501–5527. [Google Scholar] [CrossRef]
- Adamo, N.; Al-Ansari, N.; Sissakian, V.; Laue, J.; Knutsson, S. Dam Safety: Use of Instrumentation in Dams. J. Earth Sci. Geotech. Eng. 2020, 11, 145–202. [Google Scholar] [CrossRef]
- Boletsis, C.; Chasanidou, D. A Typology of Virtual Reality Locomotion Techniques. Multimodal Technol. Interact. 2022, 6, 72. [Google Scholar] [CrossRef]
- Kim, W.; Xiong, S. ViewfinderVR: Configurable Viewfinder for Selection of Distant Objects in VR. Virtual Real. 2021, 26, 1573–1592. [Google Scholar] [CrossRef]
- Berger, M.; Tagliasacchi, A.; Seversky, L.M.; Alliez, P.; Guennebaud, G.; Levine, J.A.; Sharf, A.; Silva, C.T. A Survey of Surface Reconstruction from Point Clouds. Comput. Graph. Forum 2017, 36, 301–329. [Google Scholar] [CrossRef]
- Güss, C.D. What Is Going Through Your Mind? Thinking Aloud as a Method in Cross-Cultural Psychology. Front. Psychol. 2018, 9, 1292. [Google Scholar] [CrossRef]
- Dancey, C.P.; Reidy, J. Statistics without Maths for Psychology, 4th ed.; Pearson Prentice Hall: Harlow, UK, 2008. [Google Scholar]


Disclaimer/Publisher’s Note: The statements, opinions and data contained in all publications are solely those of the individual author(s) and contributor(s) and not of MDPI and/or the editor(s). MDPI and/or the editor(s) disclaim responsibility for any injury to people or property resulting from any ideas, methods, instructions or products referred to in the content. |
© 2024 by the authors. Licensee MDPI, Basel, Switzerland. This article is an open access article distributed under the terms and conditions of the Creative Commons Attribution (CC BY) license (https://creativecommons.org/licenses/by/4.0/).