Article

A Performance Study of CNN Architectures for the Autonomous Detection of COVID-19 Symptoms Using Cough and Breathing

1
Autonomous Systems and Biomechatronics Laboratory (ASBLab), Department of Mechanical and Industrial Engineering, University of Toronto, 5 King’s College Rd, Toronto, ON M5S 3G8, Canada
2
Toronto Rehabilitation Institute, 550 University Ave, Toronto, ON M5G 2A2, Canada
3
Rotman Research Institute, Baycrest Health Sciences, 3560 Bathurst St, North York, ON M6A 2E1, Canada
*
Authors to whom correspondence should be addressed.
Computers 2023, 12(2), 44; https://doi.org/10.3390/computers12020044
Submission received: 3 January 2023 / Revised: 7 February 2023 / Accepted: 13 February 2023 / Published: 17 February 2023
(This article belongs to the Special Issue e-health Pervasive Wireless Applications and Services (e-HPWAS'22))

Abstract

:
Deep learning (DL) methods have the potential to be used for detecting COVID-19 symptoms. However, the rationale for which DL method to use and which symptoms to detect has not yet been explored. In this paper, we present the first performance study which compares various convolutional neural network (CNN) architectures for the autonomous preliminary COVID-19 detection of cough and/or breathing symptoms. We compare and analyze residual networks (ResNets), visual geometry Groups (VGGs), Alex neural networks (AlexNet), densely connected networks (DenseNet), squeeze neural networks (SqueezeNet), and COVID-19 identification ResNet (CIdeR) architectures to investigate their classification performance. We uniquely train and validate both unimodal and multimodal CNN architectures using the EPFL and Cambridge datasets. Performance comparison across all modes and datasets showed that the VGG19 and DenseNet-201 achieved the highest unimodal and multimodal classification performance. VGG19 and DensNet-201 had high F1 scores (0.94 and 0.92) for unimodal cough classification on the Cambridge dataset, compared to the next highest F1 score for ResNet (0.79), with comparable F1 scores to ResNet for the larger EPFL cough dataset. They also had consistently high accuracy, recall, and precision. For multimodal detection, VGG19 and DenseNet-201 had the highest F1 scores (0.91) compared to the other CNN structures (≤0.90), with VGG19 also having the highest accuracy and recall. Our investigation provides the foundation needed to select the appropriate deep CNN method to utilize for non-contact early COVID-19 detection.

1. Introduction

The COVID-19 pandemic has profoundly impacted global health and society, highlighting the need for continued research and innovative solutions, such as artificial intelligence, to address its challenges. DL has been widely used for audio analysis of human paralinguistics in a number of different healthcare applications, including for the diagnosis of (1) cold and flu symptoms using speech [1], (2) asthma using both speech and breathing [2], and (3) COVID-19 utilizing cough and breathing [3,4]. Additionally, convolutional neural network (CNN) architectures, including AlexNet, SqueezeNet, and ResNet18 [5], and generative adversarial networks (GAN) [6] have been used to detect COVID-19 using X-rays, CT scans, and/or ultrasound images of patients’ chests [7].
COVID-19 has different symptoms, including fever, sore throat, dry cough, muscle aches, headaches, and shortness of breath [8]. However, there is no established method for detecting COVID-19 through multiple symptoms while considering their different prevalence levels. Additionally, while deep learning has been utilized for COVID-19 detection, there has not been a comprehensive evaluation to determine which CNN structures offer the most accurate performance for non-contact COVID-19 detection.
To be more precise, when investigating clinically obtained statistical datasets for COVID-19, it has been found that varying symptoms have different prevalences [9]. Namely, the MIT clinical dataset, which consists of various symptoms of people who have tested positive for COVID-19 from over 160 clinical studies in different countries (including China, the USA, Japan, Singapore, and Italy), found that respiratory symptoms such as dry cough and shortness of breath are the most common among all the COVID-19 symptoms [9,10].
To date, only a handful of DL methods have been used for unimodal detection [11,12,13,14,15] of COVID-19 using the aforementioned respiratory symptoms. Furthermore, to the authors’ knowledge, there is only one existing multimodal DL detection method [3]. Namely, researchers have trained and tested different DL structures on specific COVID-19 datasets. However, they have not compared the various CNN structures with each other to determine which DL method provides the highest performance accuracy for non-contact-based detection. Furthermore, the prevalence weight of the symptoms has not been taken into account, and all symptoms are given equal importance as input to the structures for training. In general, both the type of CNN structure [16] and the size of the dataset [17] are important factors contributing to the classification accuracy of such audio signals.
In this paper, our objective is to present the first performance study of various deep CNN architectures for autonomous preliminary COVID-19 detection of cough and/or breathing symptoms. This unique comparison study provides the foundation needed in selecting the appropriate DL method for non-contact early COVID-19 detection using cough and breathing symptoms. Our main contributions are:
  • The first comprehensive performance comparison study of state-of-the-art deep CNN structures (ResNets, VGGs, AlexNet, DenseNet, SqueezeNet) and a custom multimodal CIdeR [3] structure for autonomous COVID-19 detection on the EPFL [18] and Cambridge [19] cough and breathing datasets. We investigate the classification measures of these methods for both unimodal and multimodal detection.
  • The investigation of the effect of the dataset size on the COVID-19 detection process.
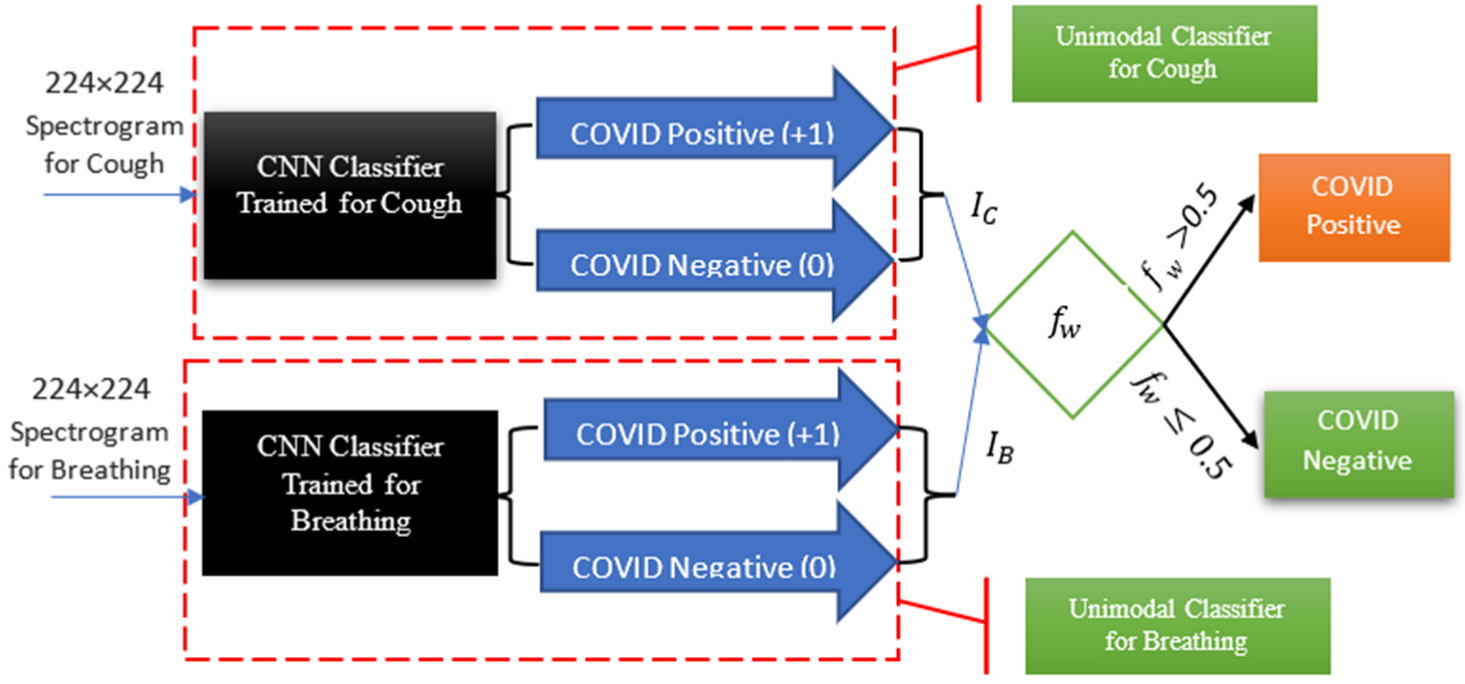
  • For the multimodal investigation, explicitly taking into account the impact and prevalence of cough and breathing recordings in detecting COVID-19 through the use of our multimodal weighting function, allowing for more accurate detection of the virus.
The paper is organized as follows. Section 2 provides a review of the related works in both unimodal and multimodal COVID-19 detection using DL techniques. Section 3 introduces the deep CNN architectures we have investigated and compared, as well as the datasets we have used in the comparison. Section 4 describes our multimodal classification methodology, including our multimodal weighting function, and Section 5 discusses our procedure for the training of the CNN architectures for COVID-19 classification. Section 6 provides our experimental procedure and comparison results with respect to the performance metrics of accuracy, recall, precision, and F1 score. Lastly, Section 7 provides concluding remarks and insights for future work.

2. Related Works

Both unimodal and multimodal DL approaches have been used for the detection of COVID-19, incorporating various symptoms. These approaches are discussed in detail below.

2.1. Unimodal Detection of COVID-19

Since COVID-19 infection can cause changes in the human respiratory system, people with COVID-19 produce distinct cough and breathing sounds [3]. These sounds have been mainly used for unimodal COVID-19 detection using different CNN structures [20]. For example, in [21], a convolutional neural network was combined with bi-directional long short-term memory (CNN-BiLSTM) to detect COVID-19 using smartphone-based breathing recordings. These recordings were taken from the Coswara dataset containing breathing recordings collected via worldwide crowdsourcing using a website application [22]. In both [11,19], ResNet-50 was used for COVID-19 detection using cough recordings from the EPFL [18] and diagnosing COVID-19 using acoustics (DiCOVA) challenge [23] datasets, respectively. In [13], a CNN architecture consisting of one Poisson biomarker layer and three pre-trained ResNet50 in parallel was used to detect COVID-19 using cough recordings of the Opensigma dataset. In [24], breathing, cough, or speech data recordings were used for unimodal COVID-19 detection with ResNet-50. The results showed that transfer learning using the larger dataset without COVID-19 labels led to improved performance and better generalization to unseen test data.
Different versions of VGG, including VGG-13 [13,14] and VGG-16 [25], have also been used for COVID-19 detection using cough recordings from the DiCOVA challenge dataset. In [26], DenseNet was used for COVID-19 detection using speech recordings from the Cambridge dataset [19].
In one study [27], a hybrid ML and genetic algorithm method was used for unimodal COVID-19 detection using cough recordings. The hybrid method had higher accuracy compared to individual ML models, including logistic regression, linear discriminant analysis, K -nearest neighbors, decision tree regression, Gaussian naive Bayes, and support vector machines. In [28], a literature review on the existing ML-based and DL-based methods, such as Resnet50, SVM, and DensNet-201, for using images such as CT Scans and X-rays in the detection of COVID-19 was discussed, and the importance of obtaining high-quality medical datasets with large sample sizes for accurate COVID-19 forecasts and diagnosis was highlighted.

2.2. Multimodal Detection of COVID-19

Multimodal COVID-19 detection can be used to enhance the accuracy of virus detection (by approximately 15%) by incorporating the effects of different symptoms, such as dry cough and shortness of breath [25]. In general, there are two main approaches used for multimodal detection: (1) concatenating different mode samples together as the multimodal input to the CNN structure [3], or (2) first performing unimodal detection of each symptom individually and then combining the results with a weighting function [9].
In [3], a new deep CNN structure, COVID-19 identification ResNet (CIdeR), was developed for the classification of joint breath and cough audio recordings. The structure was trained and tested on the Cambridge dataset [19]. An area under the receiver operating characteristic curve (AUCROC) of 84% was obtained. If a new mode is to be added, the CNN requires retraining. Therefore, combing the predictions of unimodal models by using weighting functions, such as in [10] and [25], can be used to incorporate more symptoms while avoiding retraining the entire CNN structure for the detection process.
In [25], individual support vector machine (SVM) classifiers were used to classify cough, breathing, and speech recordings. Then, an equal weighting function combined the output of these classifiers for overall COVID-19 detection. In [10], we proposed a novel probability-based weighted function that considered symptom prevalence in order to combine the output of each mode classifier. The classifier used in [10] was CIdeR. However, any binary or DL classifier could be used for this architecture. Our results showed a 55.4% improvement in the probability of early detection of COVID-19 when compared to only using an equal weighting function, as in [25].
In [28], audio data, including cough, breathing, and voice, were used to monitor COVID-19 progression and recovery, with a DL-based tracking tool developed using gated recurrent units (GRUs). They trained and tested their algorithm on a small dataset including only 212 users in total (106 COVID-positive and 106 COVID-negative) and obtained an AUCROC of 79%. The study concluded that audio-based COVID-19 monitoring has the potential for telemonitoring respiratory diseases for recovery trend predictions.
In the aforementioned papers, different deep learning methods using CNN structures have been used for unimodal or multimodal detection of cough, breathing, and/or speech. In many of these implementations, the rationale behind the choice of CNN structure utilized for detection is not discussed, nor are other structures compared for performance analysis to determine the DL methods that will provide the highest performance accuracy for COVID-19 detection. Furthermore, it has been noted that in none of the multimodal studies were the relevance and relative weight of symptoms taken into account during the training and evaluation phases utilizing multimodal techniques. Moreover, the current approach of providing respiratory audio as a single input to a deep learning structure is deemed inapplicable for the multimodal approach that aims to integrate multiple symptoms, including both audio and self-reported symptoms such as headache, as self-declared symptoms cannot be solely represented within the audio input for a deep learning structure.
Finally, Table 1 presents a comprehensive comparison of the most relevant above-mentioned studies in the field of COVID-19 detection with the work presented in this paper. The table is designed to provide a clear and concise overview of the comparison and highlight the significance of the present study. The papers listed in Table 1 were carefully selected based on their relevance and contribution to the field of COVID-19 detection. This table helps to ease the comparison between the state-of-the-art studies (reviewed in Section 2.1 and Section 2.2) and the work presented in this paper.

3. Deep Learning Networks for COVID-19 Symptom Detection

Herein, we introduce the CNN architectures we have investigated and compared with respect to addressing the problem of autonomous early COVID-19 detection. Namely, we compare the different structures for both unimodal and multimodal detection using cough or/and breathing. We also introduce the weighting function utilized to achieve multimodal COVID-19 detection.

3.1. Deep CNN Structures

The deep CNN structures used include (1) ResNets [29], (2) DenseNet [30], (3) AlexNet [31], (4) SqueezeNet [32], (5) VGGs [33], and (6) CIdeR [3]. Deep CNN structures pretrained on ImageNet have shown to be strong baseline networks for audio classification, including when using spectrograms [16]. VGGs, ResNet-50 and DenseNet, have already been used for unimodal COVID-19 detection, and CIdeR has been used for multimodal detection with accuracies ranging from 84% to 95%. Our rationale for choosing these networks is as follows. VGGs are a top five classifier for ImageNet, and AlexNet has obtained the lowest test error in the ImageNet Large Scale Visual Recognition Challenge [31]. Furthermore, SqueezeNet has achieved similar accuracy to AlexNet on ImageNet [32]. However, SqueezeNet is more efficient in terms of memory usage [32]. Moreover, it has been reported in the literature that ResNet, VGGs, DenseNet, and CIdeR have all shown good performance for COVID-19 detection using different input modes such as X-rays, cough, or breathing [3,5,24]. The below provides a short description of the investigated CNN structures.
(1)
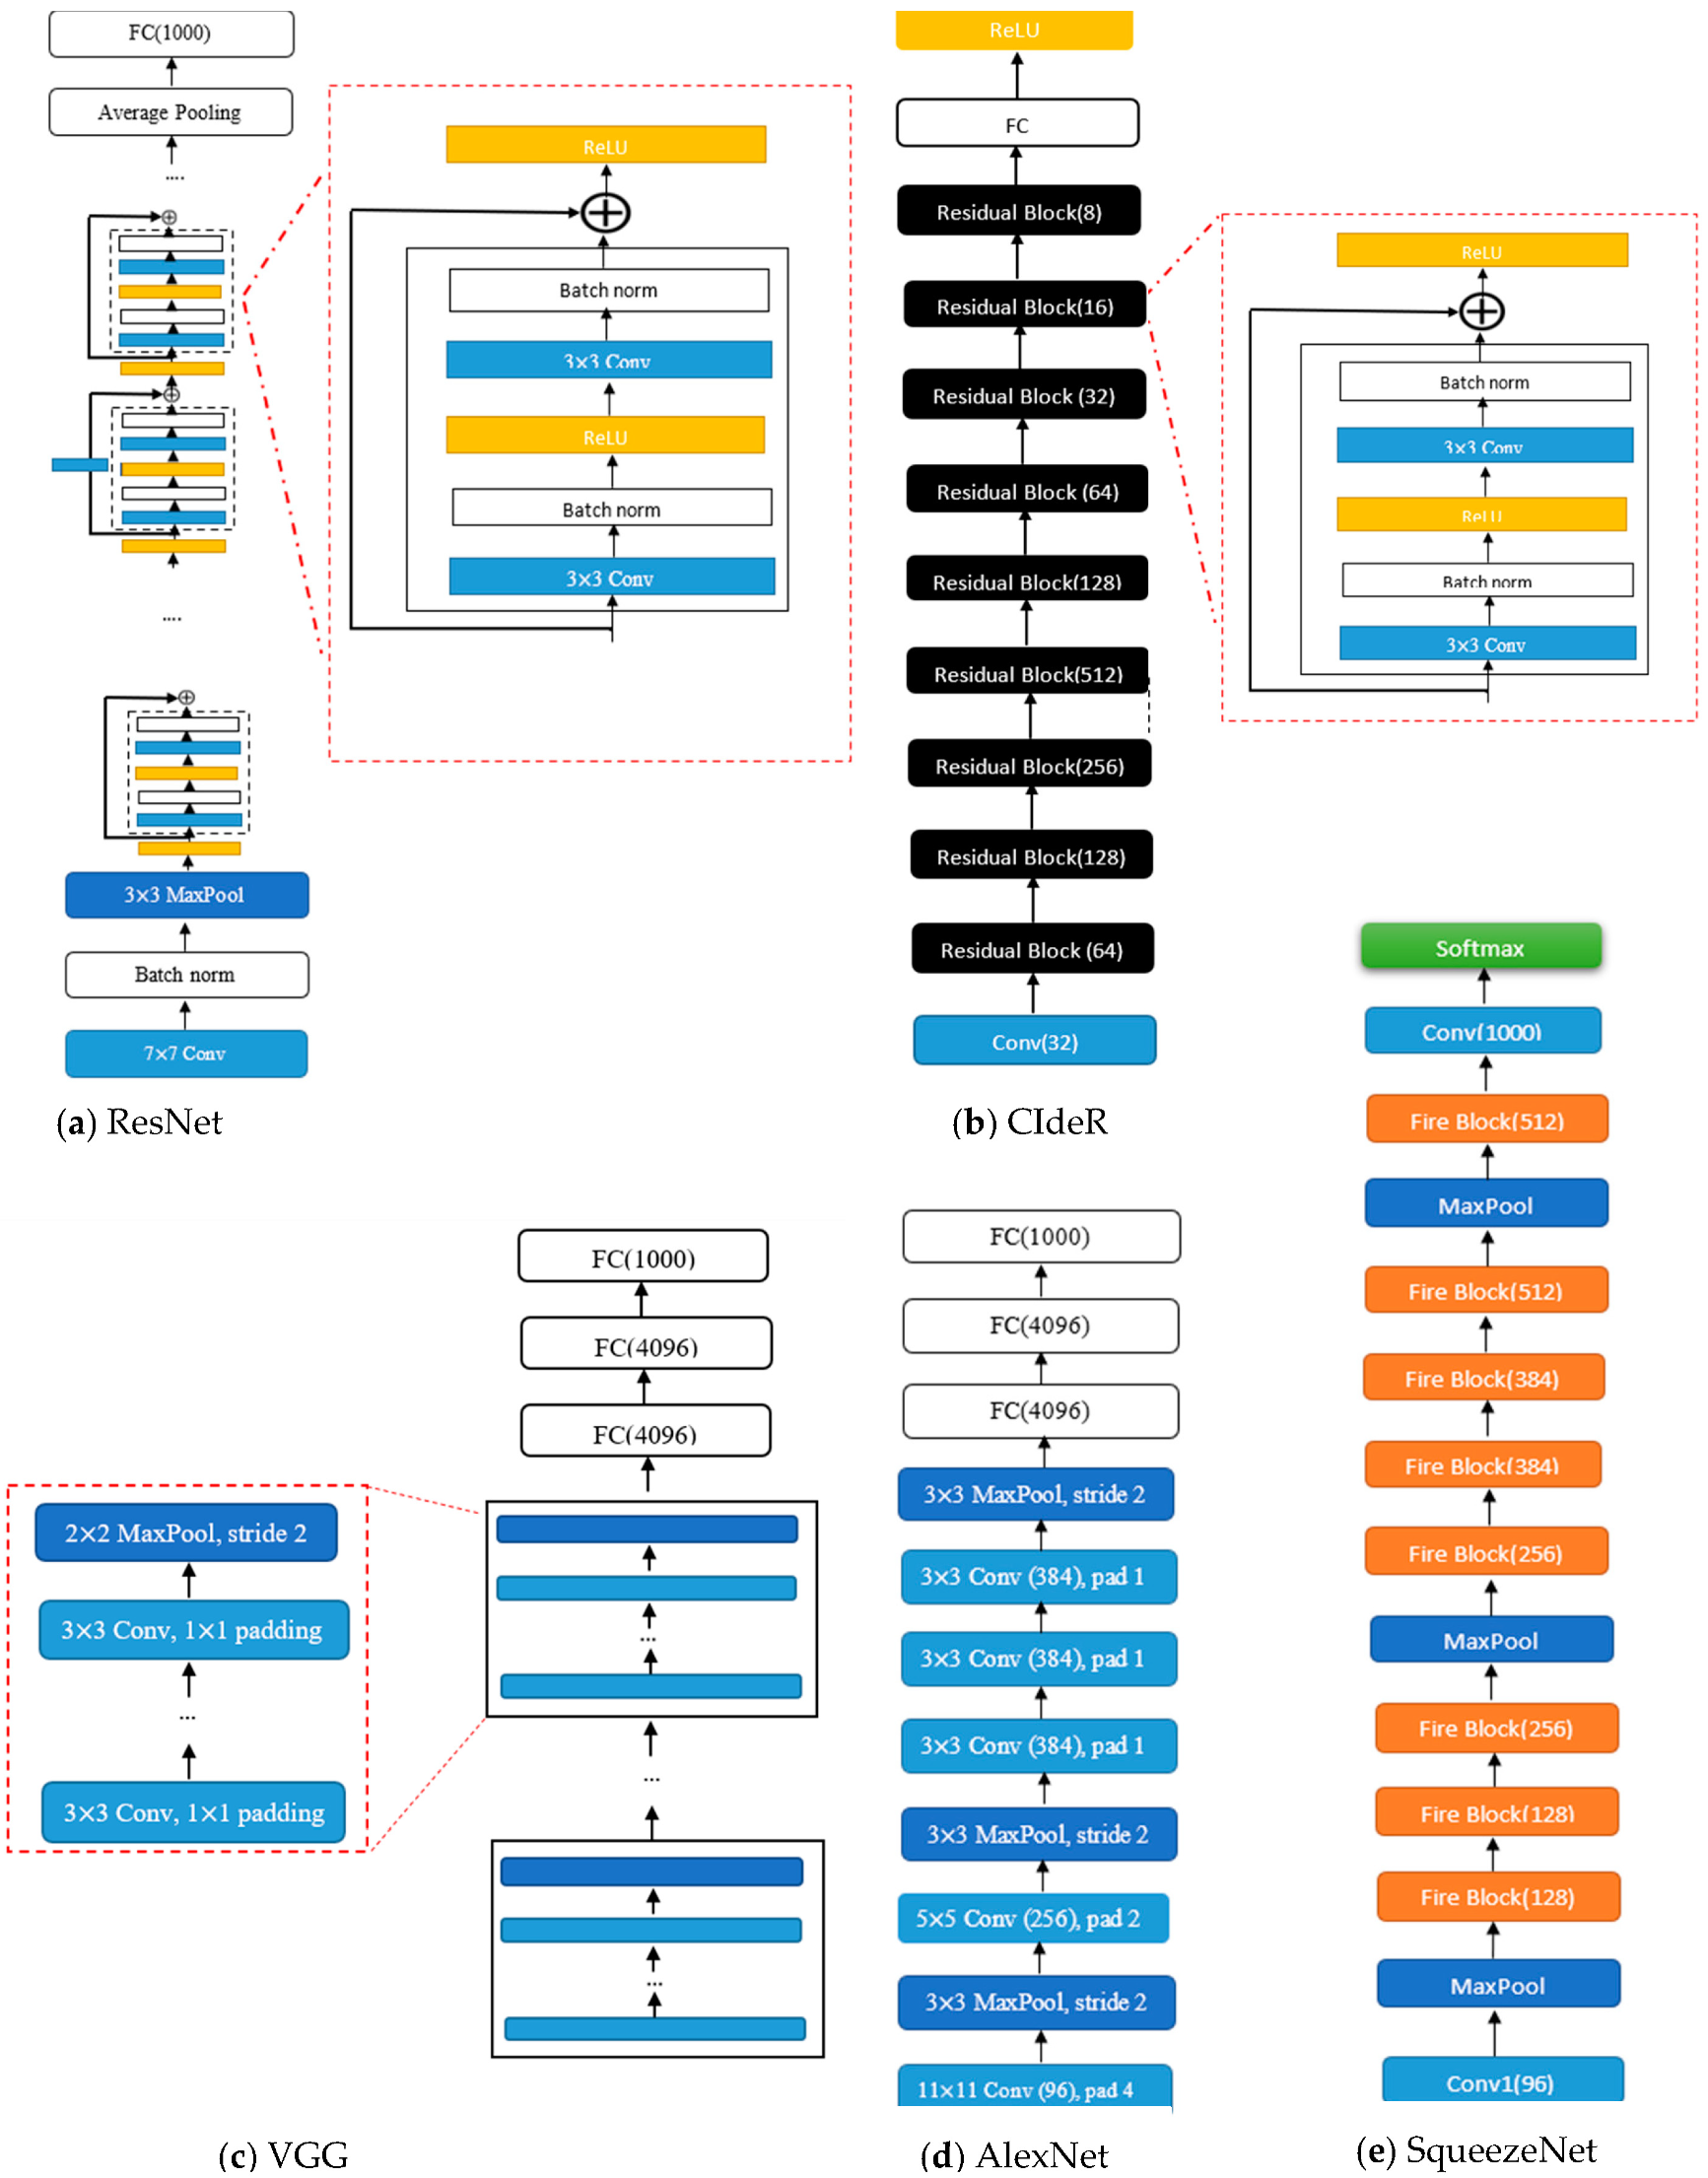
ResNet: ResNet (see Figure 1) structures [29] are designed using residual blocks. Each residual block has two 3 × 3 convolutional layers with the same number of output channels. Each layer is followed by a batch normalization layer and a rectified linear activation unit (ReLU) activation function. The first two layers of ResNets are a 7 × 7 convolutional layer followed by a 3 × 3 maximum pooling layer. In ResNet, there are also residual skips for the blocks [29]. This structure has one average pooling layer and a fully connected layer. There are two main reasons that these skips are added to the network. They help to address the vanishing gradient or degradation (accuracy saturation) problem that exists in other deep CNN structures. Namely, when more layers are added to the structure, higher training errors will be obtained. However, ResNet structures have solved this issue by skipping several layers [29].
(2)
DenseNet: The DenseNet architecture [30] focuses on making the deep learning networks deeper and, at the same time, more efficient to train. The DenseNet structure simplifies the connectivity between the layers by eliminating the need to learn redundant feature maps. Hence, the structure needs fewer parameters compared to the equivalent traditional CNNs, which results in higher computational and memory efficiency. DenseNet-201 has 98 dense blocks, followed by a global average pool and a fully connected layer [30]. Each dense block includes both 1 × 1 and 3 × 3 convolutional layers. Due to the intricate nature of these structures, it is advisable to see the primary reference [30] to obtain a comprehensive and accurate visual representation of the DenseNet architecture.
(3)
VGG: The visual geometry group (VGG) (see Figure 1) structures [33] are built by blocks. One block for VGG consists of a sequence of convolutions with 3 × 3 kernels with 1 × 1 padding and 2 × 2 maximum pooling with a stride of 2. After the final pooling layer, there are fully connected (FC) layers [33].
(4)
AlexNet: AlexNet (see Figure 1) [31] was the first convolutional network that used a GPU to boost performance. Its architecture includes five convolutional layers, three max-pooling layers, and fully connected layers [31].
(5)
SqueezeNet: The SqueezeNet (see Figure 1) architecture [32] is comprised of “squeeze” and “expand” layers. The structure consists of a convolutional layer [32], followed by eight fire blocks and, finally, a final convolutional layer. A fire module consists of a squeeze convolutional layer (which has a 1 × 1 filter) and an expand layer that includes 1 × 1 and 3 × 3 convolutional filters [32].
(6)
CIdeR: CIdeR (see Figure 1) [3] is based on the ResNet-50 structure. It has one input layer and nine residual blocks (each consisting of a convolutional layer followed by a batch normalization and ReLU). This structure has an output fully connected layer followed by a ReLU. CIdeR can be used for unimodal detection by training on only one input mode (i.e., breathing or cough).

3.2. Datasets

The datasets used for both training and testing are the Cambridge dataset [19] and the EPFL (COUGHVID) dataset [18]. The Cambridge dataset includes 459 crowdsourced labeled cough and breathing audio recordings from 355 participants in the WebM format [18]. The samples were recorded using a microphone through Android and web applications. Sixty-two of the participants had tested positive for COVID-19 based on the utilization of, for example, PCR tests. The EPFL (COUGHVID) dataset provides 20,000 crowdsourced recordings for cough only. A wide range of participant ages, genders, and geographic locations was included. The participants self-declared their COVID-19 status (positive or negative), which was used to label the data. The recordings were gathered through microphones using a Web application deployed on a server located at EPFL [18].
As people around the world still need to wear masks in public places, including in healthcare centers, transit, and education facilities as per regional COVID-19 rules, we also created a small dataset, named the Autonomous Systems and Biomechatronics Laboratory (ASBLab) dataset, to test the performance of the trained CNN models for real-world application of COVID-19 screening in public places with people wearing masks. The ASBLab dataset includes both breathing and cough recordings of 10 random people over the course of a week from the autonomous systems and biomechatronics laboratory in a public space, all wearing masks. Namely, the dataset includes a total of 46 breathing and cough recordings recorded using the ReSpeacker USB microphone array (https://www.robotshop.com/en/respeaker-usb-microphone-array.html; accessed on 10 November 2022). This omnidirectional microphone consists of four high-performance digital microphones with a sensitivity of −26 dBFS. The participants’ self-declared screening was used to label the data. All declared COVID-negative status. Ethics approval was obtained from the University of Toronto Ethics committee.

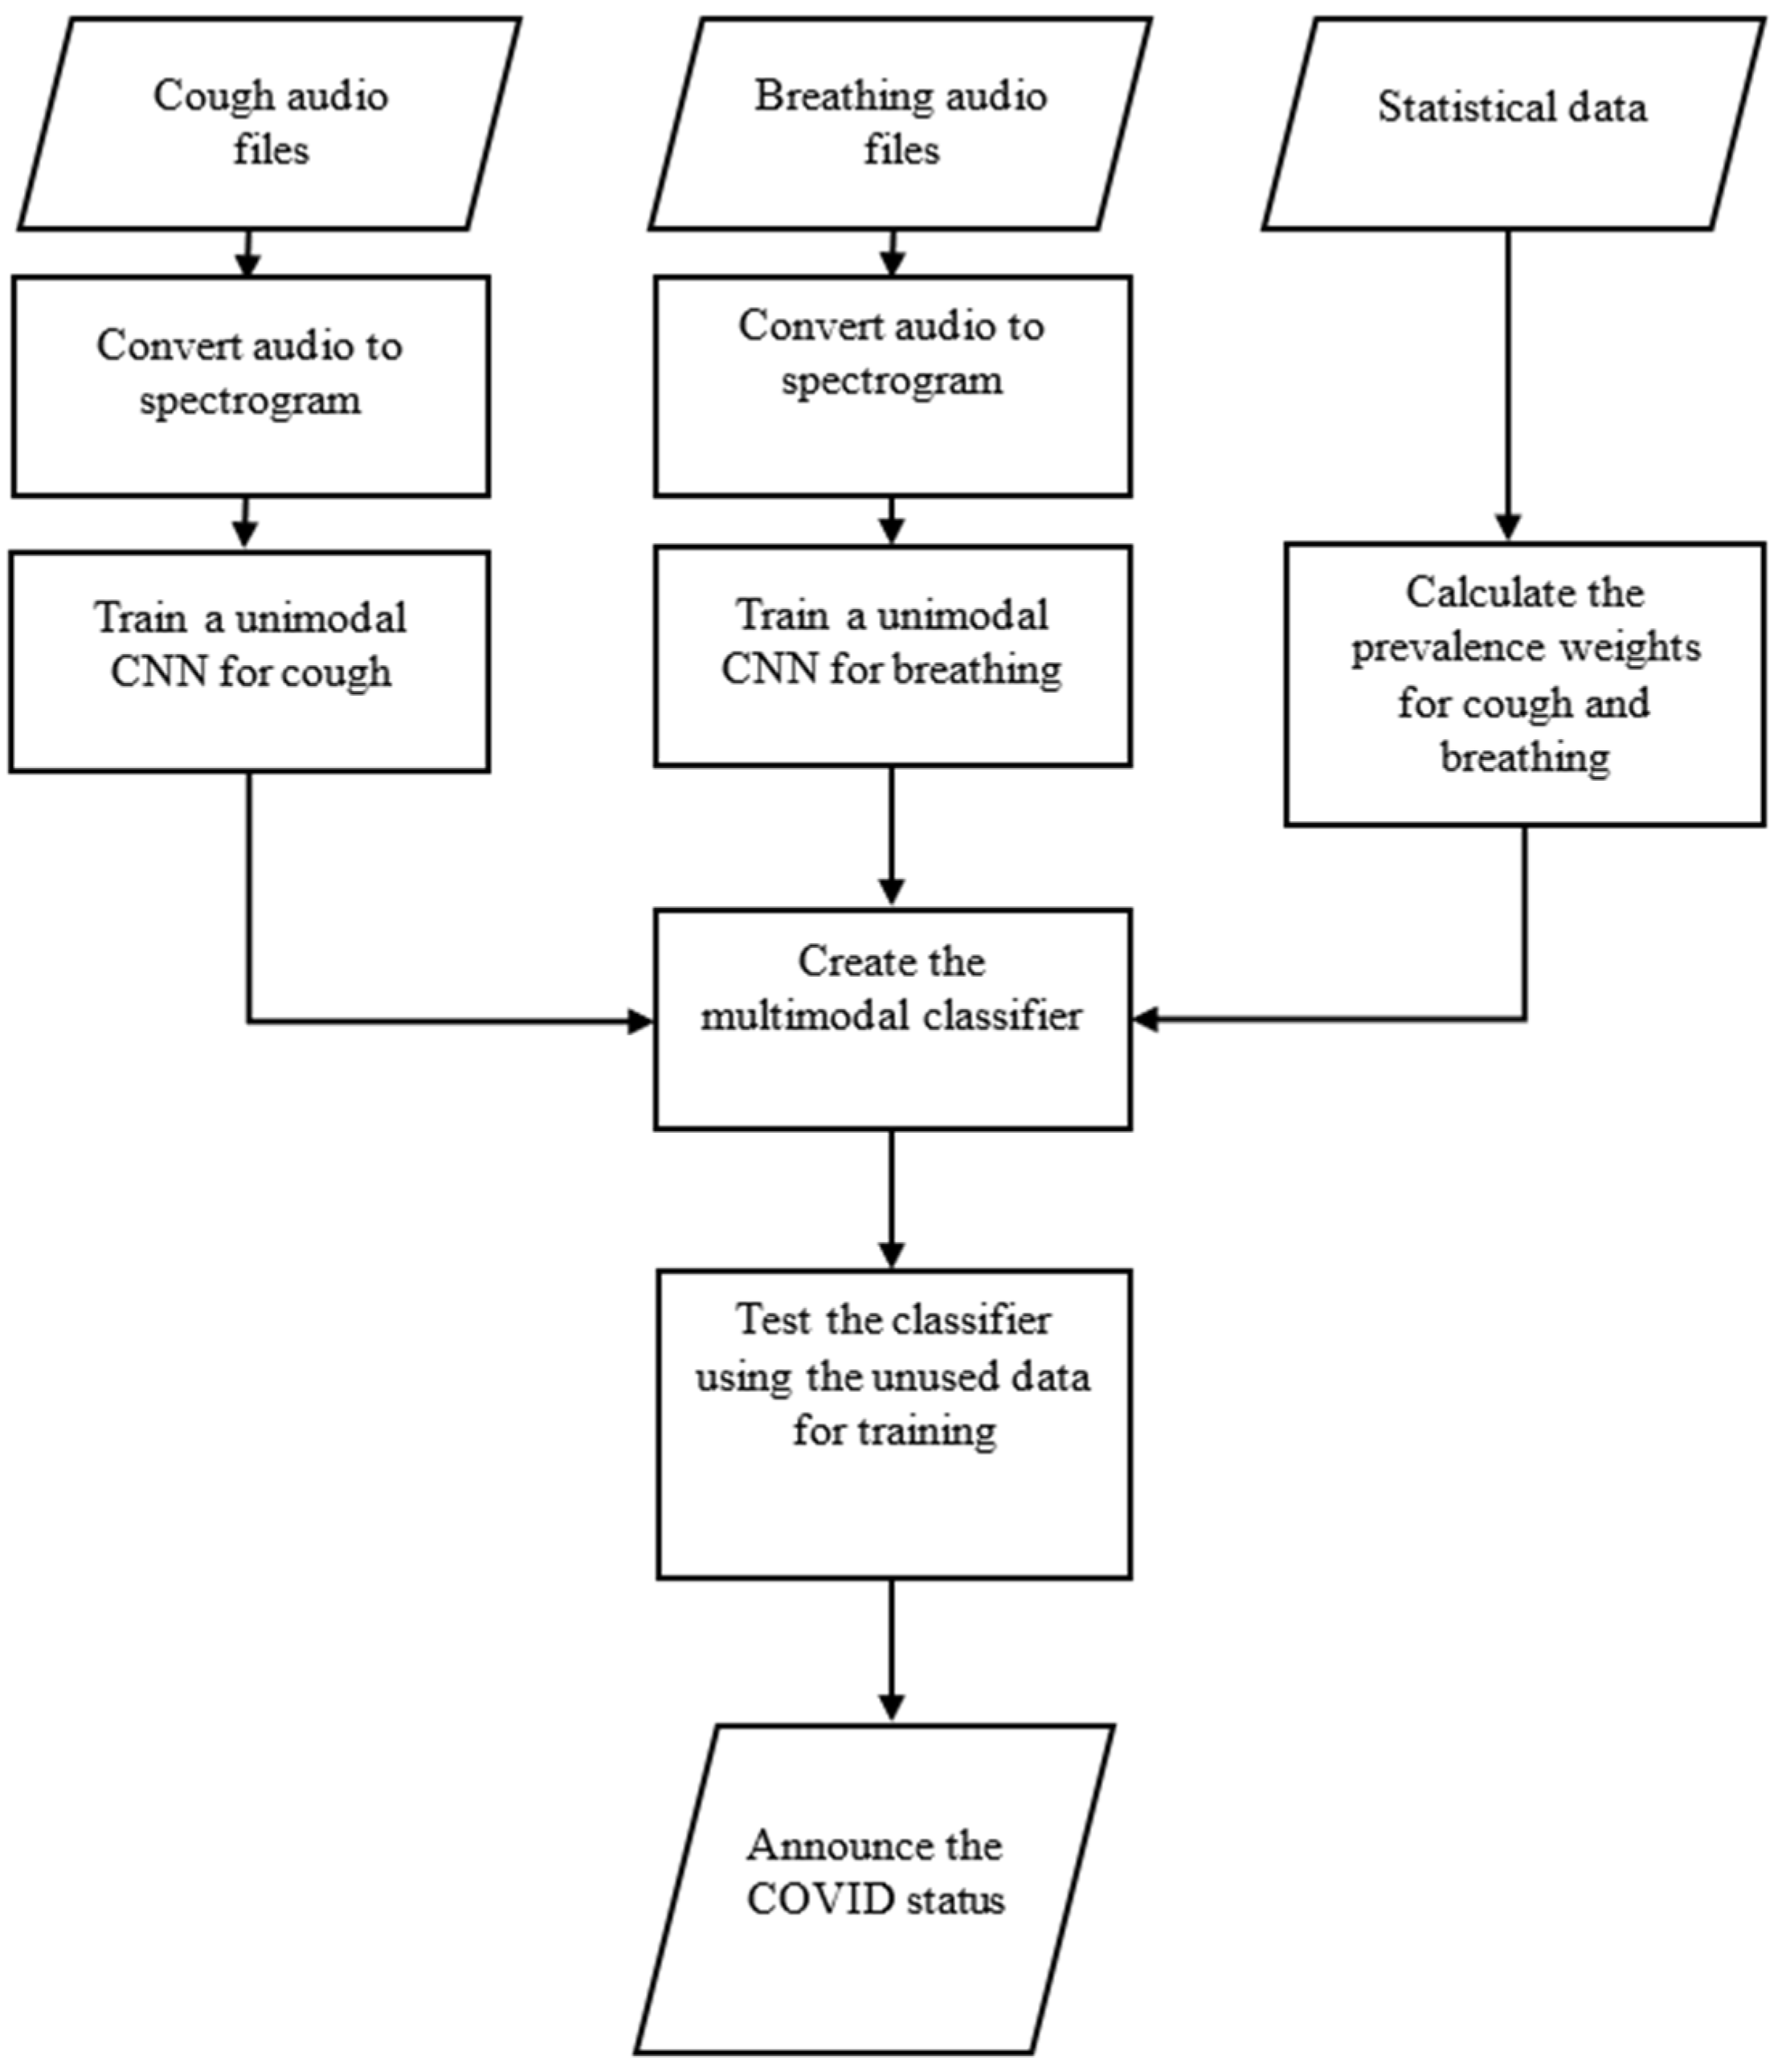
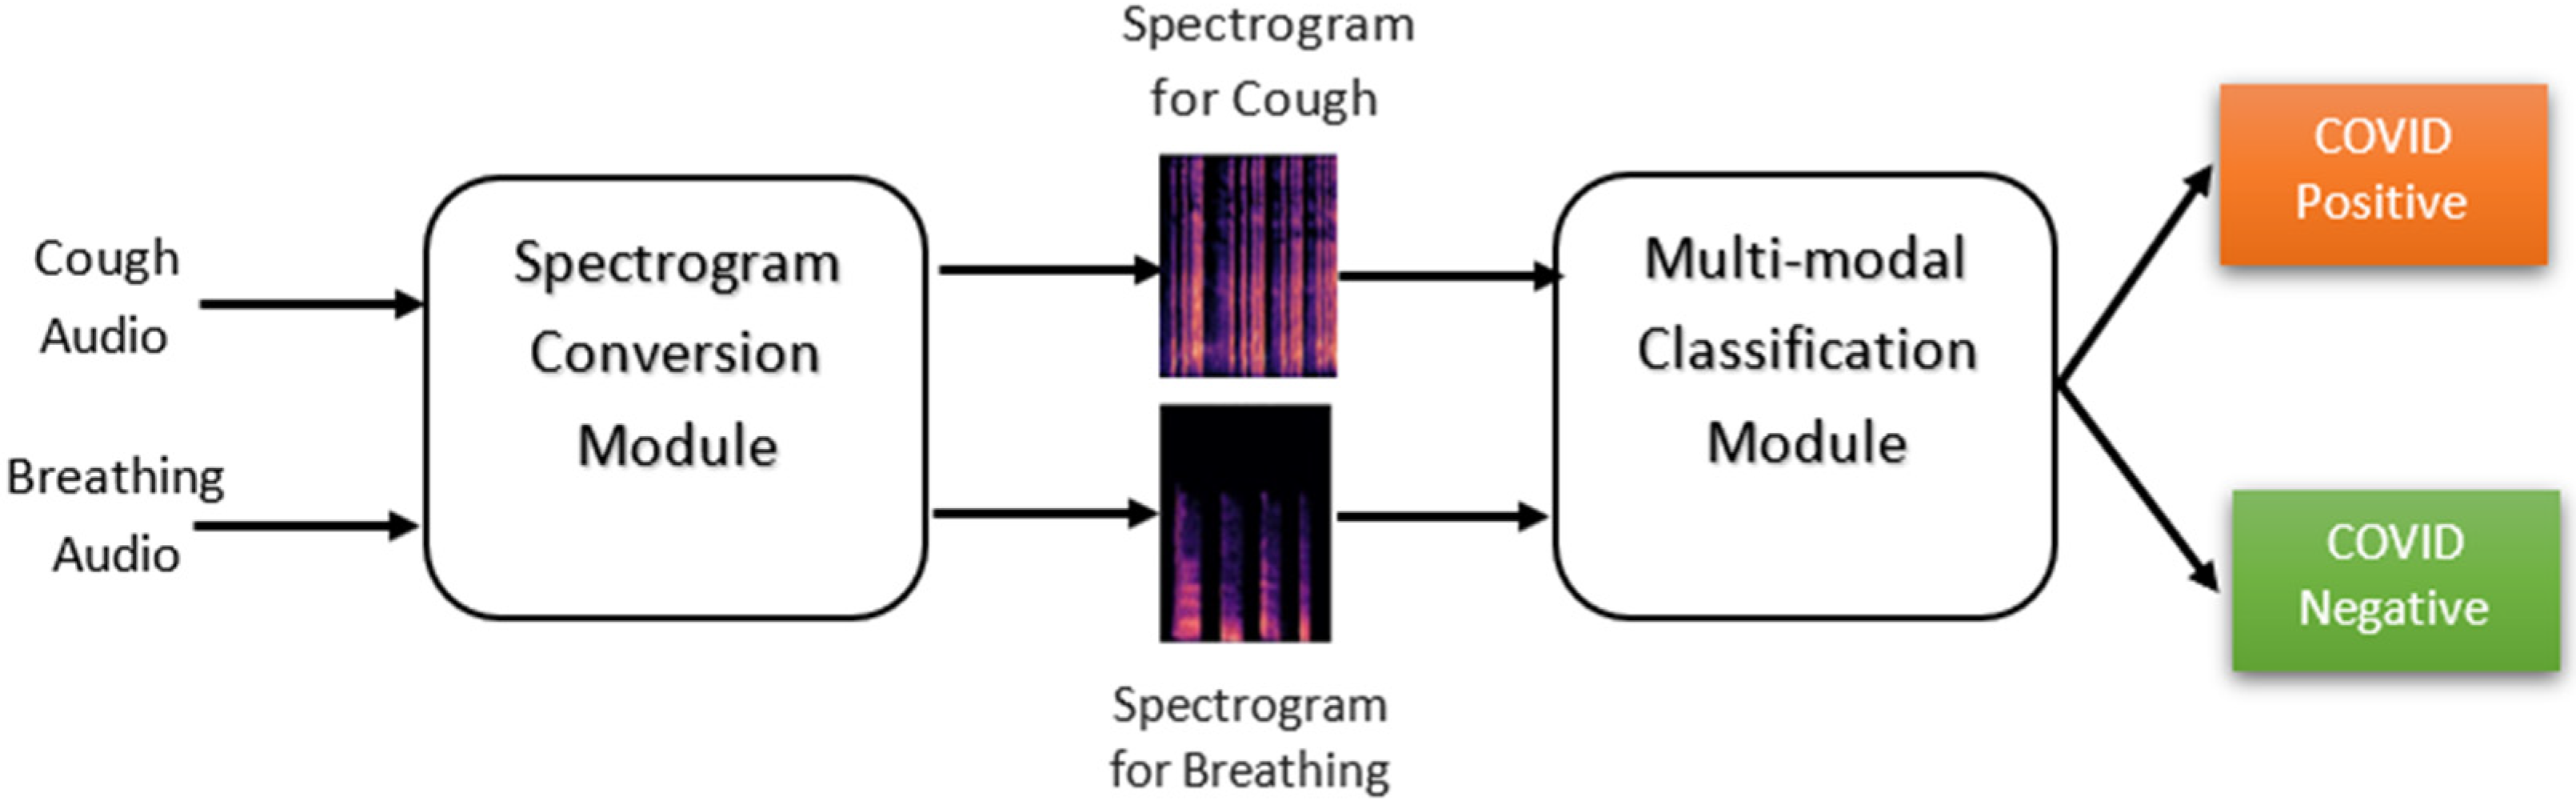
4. CNN-Based COVID-19 Classification Methodology

The overall flow of the methodology in this work is presented in Figure 2. Detailed information regarding each component of the diagram is provided in the relevant sub-section or section of the paper. The following provides a brief overview of the flow diagram, indicating the sections in which each component is thoroughly described.
As shown in Figure 2, the first step involves converting cough and breathing audio files into spectrograms, which are then utilized as separate inputs to train the related unimodal CNN structures. The training process is described in Section 5 (Training) of this paper. The statistical MIT dataset [9], explained in the Introduction section, is employed to calculate the prevalence weights for the cough and breathing audio files and the weighting function. The calculation process and related equations are presented in this section. The trained CNN structures and calculated weighting function are then utilized to create the multimodal classifier depicted in Figure 3, Figure 4 and Figure 5 of this section. The multimodal classifier is further tested on unseen data, and the results are reported and evaluated in Section 6 (Experiments and Results) of this paper.
The following explains the process by which the cough and breathing audio files are initially transformed into their corresponding spectrograms and then used as inputs to the classification module.
The classification architecture, as depicted in Figure 3, comprises two key components: the “Spectrogram Conversion” module and the “Multi-modal Classification” module. The primary function of the “Spectrogram Conversion” module is to convert audio inputs into their corresponding spectrograms. The “Multi-modal Classification” module then utilizes these spectrograms to classify individuals with either the COVID-positive or COVID-negative status.
Spectrogram Conversion Module: to generate spectrograms for all recordings, the WebM audio is first converted to WAV format. It is noted that the recordings in the EPFL dataset are represented in audio WebM format, and the Cambridge and ASBLab datasets contain WAV format. Then, by taking the short-time Fourier transform (STFT) of the WAV files, the corresponding spectrogram, Figure 4, that presents the visual form of the audio frequencies with respect to time for each of the WAV files is obtained. A log transformation is used to convert the amplitude of STFT outputs into decibels using the Librosa [34] Python package. The fast Fourier transform (FFT) length and the sampling rate (kHz) that were used to obtain the spectrograms are 2048 and 48,000, respectively.
Multi-modal Classification Module: the primary function of this module is to classify the spectrograms generated from the audio inputs into either the COVID-positive or COVID-negative category. This module, as illustrated in Figure 5, encompasses both the trained CNN models, the implementation of which will be described in subsequent sections, and our weighting function for multimodal detection.
A probability-based weighting function is used for multimodal COVID-19 detection, Figure 5. As shown in the figure, the outputs of the unimodal cough and breathing classifiers are provided as inputs into our multimodal weighting function ( f w ), Equation (1) below. In [10], we introduce the following novel weighting function, ( f w ) , which takes into account the importance of different symptoms ( S i ,   i     1 ,   , n ) through using their clinically obtained weights, for the multimodal COVID-19 detection.
f w = i = 1 n I S i w s i ,
where I S i (i   1 ,   , n ) , as defined in Equation (2), represents the binary output of each unimodal classifier for detecting COVID-19 through individual symptoms. A value of 1 indicates that the symptom has been classified as positive for COVID-19, while a value of 0 indicates that it has been classified as negative for COVID-19.
I S i = 1 ,   classified   COVID positive 0 ,   classified   COVID negative .
The weights in f w (Equation (1)), which was defined as a weighting function to incorporate different symptoms by taking into account their weights and the related unimodal CNN classifier binary outputs, are defined below in Equation (3):
w S i = p i j = 1 n p j ,
where j    1 ,   , n . p i and p j are the prevalence of each symptom. The p i and p j values represent the probability that a person who tested positive for COVID-19 has the considered symptom. To obtain p i and p j , the clinical MIT dataset [9] is utilized. This statistical dataset contains the study population and symptoms prevalence (in percentages). These symptoms include both cough and shortness of breath. By using Equation (1) and the MIT dataset, by firstly obtaining the wights of the symptoms using the MIT dataset and then incorporating them into the f w in Equation (1), the relationship in Equation (4) is obtained for the weighting function:
f w = 0.67 I C + 0.33 I B
where I C and I B are the outputs of the classifiers for cough and breathing recordings, respectively. The output of f W provides the probability of COVID-positivity.
In the cases where the recordings of both coughs and breathing are combined together in a dataset and cannot be separated, the audio for both cough and breathing for each person can be given as one input into the CNN structure. The corresponding coefficient ( w C , B ) will be utilized in the weighting function ( f w ). w C , B represents the combined weight of cough ( w C ) and breathing ( w B ) symptoms. This can be obtained by taking the average of the cough and breathing weights, i.e., w C , B = w C + w B 2 . It is noted that w C and w B are obtained using Equation (3). The corresponding I C , B (see Equation (2)), which is the output of a CNN classifier trained for the combined cough and breathing recordings, and the calculated w C , B will be implemented in Equation (1) to determine f w .

5. Training

The deep CNN structures were trained and validated using the Cambridge and EPFL datasets. We use a 70–30% split for training and validation. The trained models were also tested as a proof-of-concept for COVID-19 screening of individuals in public places using the cough and breathing recordings of the ASBLab dataset to evaluate their performance. The weights of the CNN models were updated through training on the EPFL and Cambridge datasets. The number of epochs, batch size, and learning rate were 100, 5, and 1 × 10⁻⁴, respectively. The number of training and validation recordings used from the Cambridge dataset were 321 and 137, whereas the number of training and validation recordings utilized from the larger EPFL dataset were 8347 and 2627, respectively.

6. Comparison of Deep CNN Structures for Multimodal Detection: Experiments and Results

Experiments were performed on the validation sets to compare the classification accuracy of the deep CNN structures. Namely, we conducted two sets of experiments: (a) the unimodal detection of COVID-19 using separate breathing and cough symptoms, and (b) the multimodal detection of COVID-19 using both breathing and cough symptoms together.

6.1. Unimodal Detection of COVID-19

We use classification accuracy as a metric for the comparison of the different CNN structures on similar datasets [16]. The classification accuracies for unimodal detection are presented in Table 2 for both the EPFL and Cambridge datasets. The highest classification accuracies for cough were obtained by (1) VGG19 with a classification accuracy of 91% for the Cambridge dataset and (2) ResNet-34 and ResNet-152 with an accuracy of 93% for the EPFL dataset.
With respect to breathing, the highest classification accuracy was 86% and was obtained by VGG16 for the Cambridge dataset. Similar to cough, a VGG structure had the highest classification accuracy on this dataset. The lowest accuracy of 41% was obtained by ResNet-34. However, other ResNet structures with more layers (such as ResNet-152 and ResNet-101) had improved performance, 76% or 77%, respectively. In general, ResNet structures with a higher number of layers will have better performance on small datasets such as the Cambridge dataset.

6.2. Multimodal Detection of COVID-19

We also compared the classification accuracy of multimodal detection using the different CNN structures. The classification accuracy results for the Cambridge dataset are reported in Table 2, as the EPFL dataset did not contain the breathing mode. As can be seen from the table, the highest classification accuracy of 89% was for VGG19. In other words, the VGG-19 and DenseNet-201 structures showed a 13% and 12% increase in accuracy, respectively, compared to the average accuracy of 76% (as seen in Table 2) for the multimodal COVID-19 detection. The VGG structures also had the highest accuracy on the Cambridge dataset with respect to the individual modes.
In the multimodal detection of COVID-19, our proposed weighting function ( f w ) has been shown to be effective. CIdeR [35], which is the only designed DL for multimodal COVID-19 detection, achieved the maximum accuracy of 79% in ref. [35]. As demonstrated in Table 2, the use of our f w resulted in an accuracy of 89% for the multimodal COVID-19 detection, which shows a 10% increase in the multimodal classification detection. This is a marked improvement over the state-of-the-art approaches. This comparison highlights the potential of f w as a tool in the ongoing fight against the COVID-19 pandemic.

6.3. Statistical Significance between CNN Structures

We conducted non-parametric Kruskal–Wallis H tests to determine if there was statistical significance between the classification accuracies of the CNN structures. The results are presented in Table 3. As can be seen from the table, there is a statistically significant difference between the classification accuracies for the unimodal breathing recordings of the Cambridge dataset (p < 0.001). Therefore, we performed post hoc Dunn tests to determine which structures provide significantly different accuracies. The Dunn test results showed that ResNet-34 had a statistically lower classification accuracy than all the other structures (p < 0.001). It is noteworthy that the results of the Dunn test for ResNet-34 demonstrate the maximum and minimum p-values for ResNet-152 and VGG16, respectively, with p-values of 2.22 × 10 6 and 1.17 × 10 9 . These findings confirm the results reported in Table 2.
However, the tests did not confirm that VGG16 had a statistically higher classification accuracy than the other CNN structures for breathing.

6.4. Precision, Recall, and F1 Scores

As statistical significance was not determined for the top-performing CNN structures for both unimodal and multimodal detection, we further investigated their precision, recall, and F1 scores. Namely, we compared the VGG19, DenseNet-201, ResNet-34, and ResNet-152 structures for unimodal COVID detection using cough recordings. VGG19 and DenseNet-201 had the highest accuracies for the Cambridge dataset (90% and higher), and ResNet-34 and ResNet-152 both had the highest accuracy on the EFPL dataset (93%), with VGG19 and DenseNet-201 also having over 90% accuracy on the EFPL dataset. The results are presented in Table 4.
For the breathing mode, we compared precision, recall, and F1 scores for the top-performing structures of CIdeR, VGG16, VGG19, AlexNet, and DenseNet-201, which all had classification accuracies of over 80%. The results are presented in Table 5.
In Table 6, the precision, recall, and F1 scores of CIdeR, ResNet-34, ResNet-101, SqueezeNet1_0, VGG19, and DenseNet-201 are presented. These are the top-performing multimodal COVID-19 detection CNN structures with a classification accuracy of 80% or higher.
VGG19 and Densnet-201 have consistently high F1 scores across the two datasets for unimodal cough classification as well as consistently high accuracy, recall, and precision. VGG-16, VGG-19, and AlexNet obtained the highest F1 scores on the Cambridge dataset for breathing when also comparing the other evaluation metrics. With respect to the F1 scores for multimodal detection using both cough and breathing, VGG19 and DenseNet-201 had the highest scores, with VGG19 also having the highest accuracy and recall.
Therefore, across the unimodal and multimodal CNN structures, VGG19 and DensNet-201 can both be selected as the top-performing structures based on their F1 scores. We further evaluate these two CNN structures on the ASBLab dataset. The results are summarized in Table 7.
It should be noted that one limitation of CNN architectures is that they require a large amount of data to train, which may be difficult to obtain in the case of COVID-19 detection. Although the ASBLab dataset is a small dataset, including only 46 cough and breathing recordings of random people with COVID-negative status, the results show the potential of using deep CNN structures, which are trained on crowdsourced datasets, on real-world scenarios for COVID-19 screening when people are wearing masks.
In general, the accuracy of the multimodal VGG-19 and DenseNet-201 structures represent improvements of 13% and 12% over the average accuracy of 76% (Table 2). They also had the highest F1 scores (0.91) compared to the other CNN structures (≤0.90), with VGG19 having the highest accuracy and recall. Furthermore, VGG19 and DenseNet-201 had high F1 scores (0.94 and 0.92) for unimodal cough classification compared to the next highest F1 score for ResNet (0.79) for the Cambridge dataset, an improvement of 15% and 13%, respectively. Their F1 score (0.94) for the EPFL cough dataset was comparable to the F1 score of ResNet-34 and ResNet-152 (0.95). This comparison study demonstrates the effectiveness of the VGG-19 and DenseNet-201 deep learning models for multimodal and unimodal COVID-19 detection. The better performance of VGG-19 is due to its use of small convolutional filters and multiple layers, which allow for the extraction of both fine and coarse audio features. The use of dense connections in DenseNet-201 provides enhanced efficiency by alleviating the vanishing gradient problem, maintaining accuracy even as the number of layers increases, and reducing the number of parameters in the network. Therefore, these architectural features in VGG19 and DenseNet-201 allow for more effective feature extraction and improved accuracy in audio classification tasks, such as COVID-19 detection using cough and breathing symptoms.

7. Conclusions

In this paper, we present the first performance comparison of deep CNN structures for unimodal and multimodal COVID-19 detection using breathing and/or cough recordings. Pretrained CNN models including ResNets (ResNets-18, ResNets-34, ResNets-50, ResNets-101, ResNets-152), VGGs (VGG16 and VGG19), AlexNet, DenseNet-201, SqueezeNet1_0, and the CIdeR structure were trained and validated on the EPFL and Cambridge datasets. Comparison experiments were conducted to determine the performance of these deep CNN structures across modes and datasets. The results showed that both VGG19 and DenseNet-201 outperformed the other CNN structures and achieved high unimodal and multimodal classification performance. Namely, they both had consistently high accuracy, recall, precision, and F1 scores. In particular, VGG19 and DenseNet-201 had an F1 score of 0.94 and 0.92 for unimodal cough classification on the smaller Cambridge dataset, compared to the next highest F1 score of 0.79 for ResNet-34 and ResNet-152, and they both had comparable F1 scores to ResNet-34 and ResNet-152 for the larger EPFL cough dataset. With respect to unimodal breathing, another VGG model with 16 layers (VGG16) obtained the highest classification accuracy with a comparable F1 score to VGG19. For multimodal detection, VGG19 and DenseNet-201 both had the highest F1 scores of 0.91, compared to the other CNN structures (≤0.90), with VGG19 also obtaining the highest recall and accuracy.
We also tested these two top-performing deep CNN structures on our small ASBLab multimodal cough and breathing dataset consisting of people wearing masks in a public space to show their potential in real-world scenarios.
Our deep CNN methodology has the capability of combining numerous different modes and symptoms to improve the accuracy of COVID-19 detection. Hence, it requires separate training data to be available for each mode to obtain symptom prevalence a priori.
Our future work will include building a large dataset of masked people with both COVID-negative and COVID-positive status that can be used for real-time deep learning-based screening in public places. Furthermore, we aim to incorporate additional modes for detection, such as body temperature and self-reported symptoms such as sore throat and sneezing.

Author Contributions

Conceptualization, M.E. and G.N.; methodology, M.E. and G.N.; software, M.E.; validation, M.E. and G.N.; writing—original draft preparation, M.E. and G.N.; writing—review and editing, M.E. and G.N.; supervision, G.N.; project administration, G.N.; funding acquisition, G.N. All authors have read and agreed to the published version of the manuscript.

Funding

The authors would like to acknowledge AGE-WELL Inc., the Natural Sciences and Engineering Research Council of Canada (NSERC), the NSERC CREATE HeRo fellowship, and the Canada Research Chairs (CRC) Program for funding support of this work.

Institutional Review Board Statement

The study was approved by the Institutional Review Board (or Ethics Committee) of the University of Toronto (protocol code 41193 and approval date of 2022-11-21).

Informed Consent Statement

Informed consent was obtained from all subjects involved in the study.

Data Availability Statement

Data sharing is not applicable to this article.

Acknowledgments

The authors would like to thank the University of Cambridge for sharing their COVID-19 dataset, and EPFL for their publicly available COUGHVID dataset. The authors would also like to thank the participants in the ASBLab dataset.

Conflicts of Interest

The authors declare no conflict of interest.

References

  1. Albes, M.; Ren, Z.; Schuller, B.W.; Cummins, N. Squeeze for Sneeze: Compact Neural Networks for Cold and Flu Recognition. INTERSPEECH 41 2020, 4546–4550. [Google Scholar]
  2. Nallanthighal, V.S.; Strik, H. Deep sensing of breathing signal during conversational speech. INTERSPEECH 2019, 4110–4114. [Google Scholar] [CrossRef] [Green Version]
  3. Coppock, H.; Gaskell, A.; Tzirakis, P.; Baird, A.; Jones, L.; Schuller, B. End-to-end convolutional neural network enables COVID-19 detection from breath and cough audio: A pilot study. BMJ Innov. 2021, 7, 356–362. [Google Scholar] [CrossRef] [PubMed]
  4. Effati, M.; Nejat, G. Deep Learning-Based Multi-modal COVID-19 Screening by Socially Assistive Robots Using Cough and Breathing Symptoms. In Proceedings of the Social Robotics: 14th International Conference, ICSR 2022, Florence, Italy, 13–16 December 2022; Springer: Berlin/Heidelberg, Germany, 2023. Part II. pp. 217–227. [Google Scholar]
  5. Khalifa, N.E.M.; Taha, M.H.N.; Hassanien, A.E.; Elghamrawy, S. Detection of coronavirus (COVID-19) associated pneumonia based on generative adversarial networks and a fine-tuned deep transfer learning model using chest X-ray dataset. arXiv 2020, arXiv:2004.01184. [Google Scholar]
  6. Motamed, S.; Rogalla, P.; Khalvati, F. RANDGAN: Randomized generative adversarial network for detection of COVID-19 in chest X-ray. Sci. Rep. 2021, 11, 1–10. [Google Scholar] [CrossRef]
  7. Soldati, G.; Smargiassi, A.; Inchingolo, R.; Buonsenso, D.; Perrone, T.; Briganti, D.F.; Perlini, S.; Torri, E.; Mariani, A.; Mossolani, E.E. Is there a role for lung ultrasound during the COVID-19 pandemic? J. Ultrasound Med. 2020, 37, 1459–1462. [Google Scholar] [CrossRef] [Green Version]
  8. Yuki, K.; Fujiogi, M.; Koutsogiannaki, S. COVID-19 pathophysiology: A review. Clin. Immunol. 2020, 215, 108427. [Google Scholar] [CrossRef]
  9. Bertsimas, D.; Bandi, H.; Boussioux, L.; Cory-Wright, R.; Delarue, A.; Digalakis, V.; Gilmour, S.; Graham, J.; Kim, A.; Kitane, D.L. An Aggregated Dataset of Clinical Outcomes for COVID-19 Patients. 2020. Available online: http://www.covidanalytics.io/datasetdocumentation (accessed on 1 December 2022).
  10. Effati, M.; Sun, Y.-C.; Naguib, H.E.; Nejat, G. Multimodal Detection of COVID-19 Symptoms using Deep Learning & Probability-based Weighting of Modes. In Proceedings of 2021 17th International Conference on Wireless and Mobile Computing, Networking and Communications (WiMob), Bologna, Italy, 11–13 October 2021; pp. 151–156. [Google Scholar]
  11. Fakhry, A.; Jiang, X.; Xiao, J.; Chaudhari, G.; Han, A.; Khanzada, A. Virufy: A Multi-Branch Deep Learning Network for Automated Detection of COVID-19. arXiv 2021, arXiv:2103.01806. [Google Scholar]
  12. Banerjee, A.; Nilhani, A. A Residual Network based Deep Learning Model for Detection of COVID-19 from Cough Sounds. arXiv 2021, arXiv:2106.02348. [Google Scholar]
  13. Laguarta, J.; Hueto, F.; Subirana, B. COVID-19 artificial intelligence diagnosis using only cough recordings. IEEE Open J. Eng. Med. Biol. 2020, 1, 275–281. [Google Scholar] [CrossRef]
  14. Rao, S.; Narayanaswamy, V.; Esposito, M.; Thiagarajan, J.J.; Spanias, A. COVID-19 detection using cough sound analysis and deep learning algorithms. Intell. Decis. Technol. 2021, 15, 655–665. [Google Scholar] [CrossRef]
  15. Rao, S.; Narayanaswamy, V.; Esposito, M.; Thiagarajan, J.; Spanias, A. Deep Learning with hyper-parameter tuning for COVID-19 Cough Detection. In Proceedings of 2021 12th International Conference on Information, Intelligence, Systems & Applications (IISA), Chania Crete, Greece, 12–14 July 2021; pp. 1–5. [Google Scholar] [CrossRef]
  16. Tsalera, E.; Papadakis, A.; Samarakou, M. Comparison of Pre-Trained CNNs for Audio Classification Using Transfer Learning. J. Sens. Actuator Netw. 2021, 10, 72. [Google Scholar] [CrossRef]
  17. Luo, C.; Li, X.; Wang, L.; He, J.; Li, D.; Zhou, J. How does the data set affect cnn-based image classification performance? In Proceedings of 2018 5th International Conference on Systems and Informatics (ICSAI), Nanjing, China, 10–12 November 2018; pp. 361–366. [Google Scholar] [CrossRef]
  18. Orlandic, L.; Teijeiro, T.; Atienza, D. The COUGHVID crowdsourcing dataset, a corpus for the study of large-scale cough analysis algorithms. Sci. Data 2021, 8, 1–10. [Google Scholar] [CrossRef] [PubMed]
  19. Brown, C.; Chauhan, J.; Grammenos, A.; Han, J.; Hasthanasombat, A.; Spathis, D.; Xia, T.; Cicuta, P.; Mascolo, C. Exploring automatic diagnosis of covid-19 from crowdsourced respiratory sound data. arXiv 2020, arXiv:2006.05919. [Google Scholar]
  20. Imran, A.; Posokhova, I.; Qureshi, H.N.; Masood, U.; Riaz, M.S.; Ali, K.; John, C.N.; Hussain, M.I.; Nabeel, M. AI4COVID-19: AI enabled preliminary diagnosis for COVID-19 from cough samples via an app. Inform. Med. Unlocked 2020, 20, 100378. [Google Scholar] [CrossRef]
  21. Alkhodari, M.; Khandoker, A.H. Detection of COVID-19 in smartphone-based breathing recordings: A pre-screening deep learning tool. PLoS ONE 2022, 17, e0262448. [Google Scholar] [CrossRef]
  22. Sharma, N.; Krishnan, P.; Kumar, R.; Ramoji, S.; Chetupalli, S.R.; Ghosh, P.K.; Ganapathy, S. Coswara--A Database of Breathing, Cough, and Voice Sounds for COVID-19 Diagnosis. arXiv 2020, arXiv:2005.10548. [Google Scholar]
  23. Muguli, A.; Pinto, L.; Sharma, N.; Krishnan, P.; Ghosh, P.K.; Kumar, R.; Bhat, S.; Chetupalli, S.R.; Ganapathy, S.; Ramoji, S. DiCOVA Challenge: Dataset, task, and baseline system for COVID-19 diagnosis using acoustics. arXiv 2021, arXiv:2103.09148. [Google Scholar]
  24. Pahar, M.; Klopper, M.; Warren, R.; Niesler, T. COVID-19 detection in cough, breath and speech using deep transfer learning and bottleneck features. Comput. Biol. Med. 2022, 141, 105153. [Google Scholar] [CrossRef]
  25. Chetupalli, S.R.; Krishnan, P.; Sharma, N.; Muguli, A.; Kumar, R.; Nanda, V.; Pinto, L.M.; Ghosh, P.K.; Ganapathy, S. Multi-modal Point-of-Care Diagnostics for COVID-19 Based On Acoustics and Symptoms. arXiv 2021, arXiv:2106.00639. [Google Scholar]
  26. Schuller, B.W.; Batliner, A.; Bergler, C.; Mascolo, C.; Han, J.; Lefter, I.; Kaya, H.; Amiriparian, S.; Baird, A.; Stappen, L. The INTERSPEECH 2021 computational paralinguistics challenge: COVID-19 cough, COVID-19 speech, escalation & primates. arXiv 2021, arXiv:2102.13468. [Google Scholar]
  27. Hemdan, E.E.-D.; El-Shafai, W.; Sayed, A. CR19: A framework for preliminary detection of COVID-19 in cough audio signals using machine learning algorithms for automated medical diagnosis applications. J. Ambient Intell. Humaniz. Comput. 2022, 1–13. [Google Scholar] [CrossRef] [PubMed]
  28. Vinod, D.N.; Prabaharan, S. COVID-19-The Role of Artificial Intelligence, Machine Learning, and Deep Learning: A Newfangled. Arch. Comput. Methods Eng. 2023, 1–16. [Google Scholar] [CrossRef] [PubMed]
  29. He, K.; Zhang, X.; Ren, S.; Sun, J. Deep residual learning for image recognition. In Proceedings of the IEEE Conference on Computer Vision and Pattern Recognition, Las Vegas, NV, USA, 26 June–1 July 2016; pp. 770–778. [Google Scholar] [CrossRef] [Green Version]
  30. Huang, G.; Liu, Z.; Van Der Maaten, L.; Weinberger, K.Q. Densely connected convolutional networks. In Proceedings of Proceedings of the IEEE Conference on Computer Vision and Pattern Recognition; Honolulu, HI, USA, 21–26 July 2017, pp. 4700–4708. [CrossRef] [Green Version]
  31. Krizhevsky, A.; Sutskever, I.; Hinton, G.E. Imagenet classification with deep convolutional neural networks. Adv. Neural Inf. Process. Syst. 2012, 25, 1097–1105. [Google Scholar] [CrossRef] [Green Version]
  32. Iandola, F.N.; Han, S.; Moskewicz, M.W.; Ashraf, K.; Dally, W.J.; Keutzer, K. SqueezeNet: AlexNet-level accuracy with 50x fewer parameters and< 0.5 MB model size. arXiv 2016, arXiv:1602.07360. [Google Scholar]
  33. Simonyan, K.; Zisserman, A. Very deep convolutional networks for large-scale image recognition. arXiv 2014, arXiv:1409.1556. [Google Scholar]
  34. McFee, B.; Raffel, C.; Liang, D.; Ellis, D.P.; McVicar, M.; Battenberg, E.; Nieto, O. librosa: Audio and music signal analysis in python. In Proceedings of the 14th Python in Science Conference, Austin, TX, USA, 6–12 July 2015; pp. 18–25. [Google Scholar] [CrossRef] [Green Version]
  35. Akman, A.; Coppock, H.; Gaskell, A.; Tzirakis, P.; Jones, L.; Schuller, B.W. Evaluating the covid-19 identification resnet (cider) on the interspeech covid-19 from audio challenges. Front. Digit. Health 2022, 4, 789980. [Google Scholar] [CrossRef]
Figure 1. (a) ResNet structure, (b) CIdeR CNN structure, (c) VGG structure, (d) AlexNet structure, (e) SqueezeNet structure. It is noted that “Conv”, “pad”, and “norm” are abbreviations for convolution, padding, and normalization, respectively.
Computers 12 00044 g001
Figure 2. The flow diagram of the methodology.
Computers 12 00044 g002
Figure 3. Flowchart for the proposed multimodal classification architecture.
Computers 12 00044 g003
Figure 4. Spectrogram representation of a cough sample from the ASBLab dataset.
Computers 12 00044 g004
Figure 5. Symptom classification and probability-based weighting function architecture for multimodal COVID-19 detection using both cough and breathing classification.
Computers 12 00044 g005
Table 1. Comparison of most relevant publications to our work. Checkmark (✔) indicates that the publication/work has worked on the mentioned feature. Additionally, “N/A” is an abbreviation for not applicable, and used for the publications in which the considered feature in the table should not be considered as a criterion to be compared with other works. For instance, for ref. [10], the feature of “Comparison to other Multimodal Approaches” is not applicable because only one symptom, “cough”, is considered. Cross sign (✗) shows that in the related paper, they have not worked on the feature.
ReferenceDL StructureUnimodal ApproachMultimodal ApproachConsidering the Prevalence of SymptomsComprehensive Comparison to Other Unimodal ApproachesComparison to
Other
Multimodal
Approaches
[11,19] ResNet-50N/AN/A
[13,14,25]VGGsN/AN/A
[26]DenseNetN/AN/A
[3] CIdeR
[28]GRU
Our WorkResNets,
VGGs,
DenseNet,
AlexNet,
SqueezeNet,
CIdeR
Table 2. Classification accuracy of deep CNN structures for unimodal and multimodal COVID- 19 detection using cough and breathing recordings.
CoughBreathingCough and Breathing
DatasetCambridge EPFL Cambridge Cambridge
CNN
Structure
CIdeR81% 83% 84% 82%
ResNet-1876% 92% 76% 76%
ResNet-3475% 93% 41% 80%
ResNet-5076% 92% 76% 69%
ResNet-10182% 92% 77% 85%
ResNet-15277% 93% 76% 74%
VGG1686% 91% 86% 74%
VGG1991% 92% 84% 89%
AlexNet69% 92% 84% 60%
DenseNet-20190% 91% 81% 88%
SqueezeNet1_079% 90% 76% 84%
Average80% 91% 76% 76%
Table 3. Kruskal–Wallis H test results for the CNN structures.
Dataset/Data TypeHp-Value
Cambridge/Cough12.640.24
EPFL/Cough2.110.99
Cambridge/Breathing56.32<0.001
Cambridge/Cough and Breathing15.460.12
Table 4. Classification metrics for the top-performing CNN structures for unimodal cough. The best metrics in each column are highlighted in yellow.
EPFLCambridge
MeasureAccuracyRecallPrecisionF1AccuracyRecallPrecisionF1
Structure
ResNet-340.930.980.930.950.750.840.740.79
ResNet-1520.930.980.920.950.770.830.760.79
VGG190.920.970.920.940.910.960.910.94
DenseNet-2010.910.990.910.940.900.950.900.92
Table 5. Classification metrics for the top-performing CNN structures for unimodal breathing. The best metrics in each column are highlighted in yellow.
MeasureAccuracyRecallPrecisionF1
Structure
CIdeR0.840.880.890.88
VGG160.860.830.990.90
VGG190.840.900.880.89
AlexNet0.840.880.90.89
DenseNet-2010.810.880.80.84
Table 6. Classification metrics for the top-performing CNN structures for multimodal cough and breathing. The best metrics in each column are highlighted in yellow.
MeasureAccuracyRecallPrecisionF1
Structure
CIdeR0.820.850.810.83
ResNet-340.800.870.800.83
ResNet-1010.850.910.820.86
SqueezeNet1_00.840.830.980.90
VGG190.890.930.900.91
DenseNet-2010.880.910.920.91
Table 7. Classification accuracy for the two top-performing CNN structures on the ASBLab dataset.
CoughBreathingCough and Breathing
DatasetASBLabASBLabASBLab
Structure
VGG1997%92%61%
DenseNet-20195%89%83%
Disclaimer/Publisher’s Note: The statements, opinions and data contained in all publications are solely those of the individual author(s) and contributor(s) and not of MDPI and/or the editor(s). MDPI and/or the editor(s) disclaim responsibility for any injury to people or property resulting from any ideas, methods, instructions or products referred to in the content.

