Simple Summary
Poor survival rates of squamous cell carcinomas (SCCs) are due in part to a limited number of reliable biomarkers and molecular targets. NAD+ metabolism plays a relevant role in SCC chemoprevention and therapy and is found dysregulated in several tumors. Therefore, the aim of our study was to identify new biomarkers based on NAD+ metabolism-related gene (NMRG) expression. Our findings indicate that NAD+ metabolism-related gene profiles can be an important source of SCC biomarkers and potential therapeutic targets. These findings agree with SCC preclinical and clinical studies using NAD+ precursors. Further in-depth studies on identified NMRGs may provide additional insights into SCC pathogenesis and improve therapeutic choice.
Abstract
Poor survival rates of squamous cell carcinomas (SCCs) are associated with high recurrence, metastasis, and late diagnosis, due in part to a limited number of reliable biomarkers. Thus, the identification of signatures improving the diagnosis of different SCC types is mandatory. Considering the relevant role of NAD+ metabolism in SCC chemoprevention and therapy, the study aimed at identifying new biomarkers based on NAD+ metabolism-related gene (NMRG) expression. Gene expression of 18 NMRGs and clinical-pathological information for patients with head and neck SCC (HNSCC), lung SCC (LuSCC), and cervix SCC (CeSCC) from The Cancer Genome Atlas (TCGA) were analyzed by several bioinformatic tools. We identified a 16-NMRG profile discriminating 3 SCCs from 3 non-correlated tumors. We found several genes for HNSCC, LuSCC, and CeSCC with high diagnostic power. Notably, three NMRGs were SCC-type specific biomarkers. Furthermore, specific signatures displayed high diagnostic power for several clinical-pathological characteristics. Analyzing tumor-infiltrating immune cell profiles and PD-1/PD-L1 levels, we found that NMRG expression was associated with suppressive immune microenvironment mainly in HNSCC. Finally, the evaluation of patient survival identified specific genes for HNSCC, LuSCC, and CeSCC with potential prognostic power. Therefore, our analyses indicate NAD+ metabolism as an important source of SCC biomarkers and potential therapeutic targets.
1. Introduction
Squamous cell carcinoma (SCC) is an epithelial tumor that occurs in organs covered with squamous epithelium, such as skin, lips, mouth, esophagus, urinary tract, prostate, lungs, vagina, and cervix [1]. The SCC incidence is different across tissues as risk factors vary in relation to the site-specific protective function of the epithelia [1]. Three of the major SCC types are head and neck SCC (HNSCC), SCC of the lung (LuSCC), and cervix SCC (CeSCC). HNSCC is the sixth most common cancer worldwide and consists of a group of tumors that arise from squamous mucosal surfaces, including nasal and oral cavities, the nasopharynx, the oropharynx, the hypopharynx, and the larynx. Primary risk factors for HNSCC include tobacco and alcohol use, alpha-type human papillomavirus (HPV) infection, age, and genetic predisposition [1,2]. LuSCC is a type of non-small cell lung cancer (NSCLC) and occurs in the central part of the lung or the main airway. The main risk factor for LuSCC is tobacco smoke. Other risk factors include age, family history, exposure to asbestos or air pollution, and genetic factors [1,3]. CeSCC is the most common gynecological tumor and the fourth leading cause of cancer-related death in women. The primary risk factor for CeSCC is persistent infections with alpha-type HPVs [3,4].
SCCs are characterized by local invasive patterns, high recurrence, and metastasis. Therefore, the treatment of SCC is comparable across the different anatomical sites [1]. Standard treatments include surgery, chemotherapy, or radiotherapy in early and advanced curable disease, whereas targeted systemic therapies or immunotherapy are used in locally advanced and metastatic tumors [5,6]. However, late diagnosis, recurrence, and metastases are associated with poor survival rates. Despite advances in diagnostic methods and combined treatments, the survival rate has not significantly improved over the last 30 years due in part to a lack of reliable early diagnostic biomarkers and a limited number of molecular targets for patients with advanced disease [1,7,8].
SCCs from different body sites exhibit similar histopathological features [3]. SCC development is a multistep process involving the accumulation of multiple genetic alterations modulated by genetic predisposition and environmental insults. SCCs share many phenotypic and molecular characteristics (e.g., mutations in genes involved in squamous cell differentiation and cell adhesion) that distinguish SCC from other cancer types. However, mutations of some genes appear more frequent or potentially specific to a given SCC type [1,7,8]. Thus, the identification of new diagnostic biomarkers or specific signatures that correlate with pathophysiological characteristics can improve therapeutic choice.
Energy metabolism reprogramming is one of the hallmarks of cancer [9]. Nicotinamide adenine dinucleotide (NAD+) and its metabolites play a key role in the control of energy homeostasis, enabling the cells to adapt to environmental changes, including nutrient perturbation, genotoxic factors, infections, inflammation, and xenobiotics. Therefore, NAD+ depletion can be involved in many critical steps of tumorigenesis, such as genome instability, metabolic changes, cell growth, inflammation, and immune response [10,11]. Preclinical studies indicate that the increase of NAD+ levels restores the bioenergetics, redox balance, and signaling pathways, ameliorating the adverse effects of pathophysiological conditions and offering a promising option for therapy [10,11,12]. NAD+ levels could be restored by dietary NAD+ precursors (e.g., nicotinamide (NAM), nicotinamide mononucleotide (NMN) and nicotinamide riboside (NR)), inhibitors of NAD+-consuming enzymes, management of the NAD+ biosynthesis via controlling NAD+-biosynthesis enzymes or improving NAD+ bioavailability through caloric restriction or exercise [11]. Clinical trials indicate that NAM oral administration displays chemopreventive effects against skin SCC development and recurrence in high-risk immunocompetent [13] and in immunocompromised patients [14]. Moreover, NAM improved the efficacy of radiotherapy against HNSCC and laryngeal SCC [15,16]. Trials assessing the efficacy of NAM when prescribed synergistically with targeted therapies in advanced NSCLC patients are ongoing [12].
Given the growing evidence of the relevant roles that NAD+ metabolism plays in cancer initiation and progression, the aim of the present study was to identify molecular profiles based on NAD+ metabolism-related gene (NMRG) expression from The Cancer Genome Atlas (TCGA) showing diagnostic or prognosis power for HNSCCs, LuSCCs, and CeSCCs and, thus, can be considered potential therapeutic targets.
2. Materials and Methods
2.1. Data Source
Gene expression profiles, clinical characteristics, and survival information for 504 patients with HNSCC, 501 with LuSCC, and 306 with CeSCC, and corresponding normal specimens (44, 49, and 3 samples, respectively) were extracted from The Cancer Genome Atlas (TCGA) database (https://portal.gdc.cancer.gov/, accessed on 15 November 2022). Due to the small number of normal samples in the TCGA CeSCC database, we further integrated TCGA and Genotype-Tissue Expression (GTEx) databases (https://gtexportal.org/home/datasets, accessed on 15 November 2022) to obtain 22 normal samples.
Low or undetectable ENPP3 expression is observed in the majority of HNSCC tumor samples (93%). Likewise, NMRK2 expression is low or undetectable in HNSCC, LuSCC, and CeSCC samples. Due to this issue, ENNP3 and NMRK2 were excluded from all analyses restricted to tumor samples.
- Receiver Operating Characteristic (ROC) curve analysis
ROC curves were generated on GraphPad Prism 9. The area under the curve (AUC) is plotted as sensitivity% (True Positive Rate) vs. 100%—specificity% (False Positive Rate).
2.2. Principal Component Analysis (PCA)
The PCA analysis was performed for 504 HNSCC, 501 LuSCC, 306 CeSCC, 537 Kidney Renal clear cell Carcinoma (KIRC), 168 Glioblastoma (GBM), and 263 Sarcoma (SARC) TCGA patients. TCGA expression (log2 of TPM) of 16 selected genes of nicotinamide metabolism or of glycolysis was used to calculate the principal components.
2.3. Immune Microenvironment Analysis
Correlation of NMRG expression with immune infiltration level in HNSCCs, LuSCCs, and CeSCCs (TCGA) was performed using the Tumor IMmune Estimation Resource (TIMER) web application (https://cistrome.shinyapps.io/timer/, accessed on 15 November 2022) [17,18]. The purity-corrected partial Spearman’s rho value and statistical significance were calculated.
2.4. Correlation with PD-1 and PD-L1
The correlation coefficient between PD-1 or PD-L1 and genes involved in nicotinamide metabolism was calculated by Spearman’s Rho test using TIMER2.0 (http://timer.cistrome.org/, accessed on 15 November 2022) [19]. Purity adjustment of TCGA HNSCC, LuSCC, and CeSCC was performed before the Spearman calculation.
2.5. Survival Analysis
Mantel-Cox analysis was performed between NMRGs with high or low expression and overall survival (OS) in 504 HNSCC, 501 LuSCC, and 306 CeSCC patients. High or low expression was defined as relating to the mean of the log2(TPM) in the tumor samples of each tumor type.
2.6. Statistical Analysis
All data processing steps and statistical analyses were performed using GraphPad Prism 9.
Statistical significance of differential gene expression levels in tumor samples compared to control specimens and in patients’ stratification was calculated by a two-tailed Mann-Whitney test. Multiple logistic regression was performed to generate multiple ROC curves on combined expression values in patients’ stratification. A Pearson correlation index and statistical significance were calculated to perform a correlation analysis of NMRGs involved in patients’ survival with immune checkpoint expression.
3. Results
3.1. NMRGs and Their Ability as SCC-Type Discriminating Biomarkers
NAD+ is an essential metabolite for cellular homeostasis and its metabolism is characterized by a balance of synthesis, consumption, and regeneration. NAD+ acts as a co-enzyme for multiple redox reactions as well as a substrate for NAD+-consuming enzymes (i.e., sirtuins, PARPs, and cADPRSs such as CD38) that coordinate genomic stability, epigenetic status, and inflammation [10].
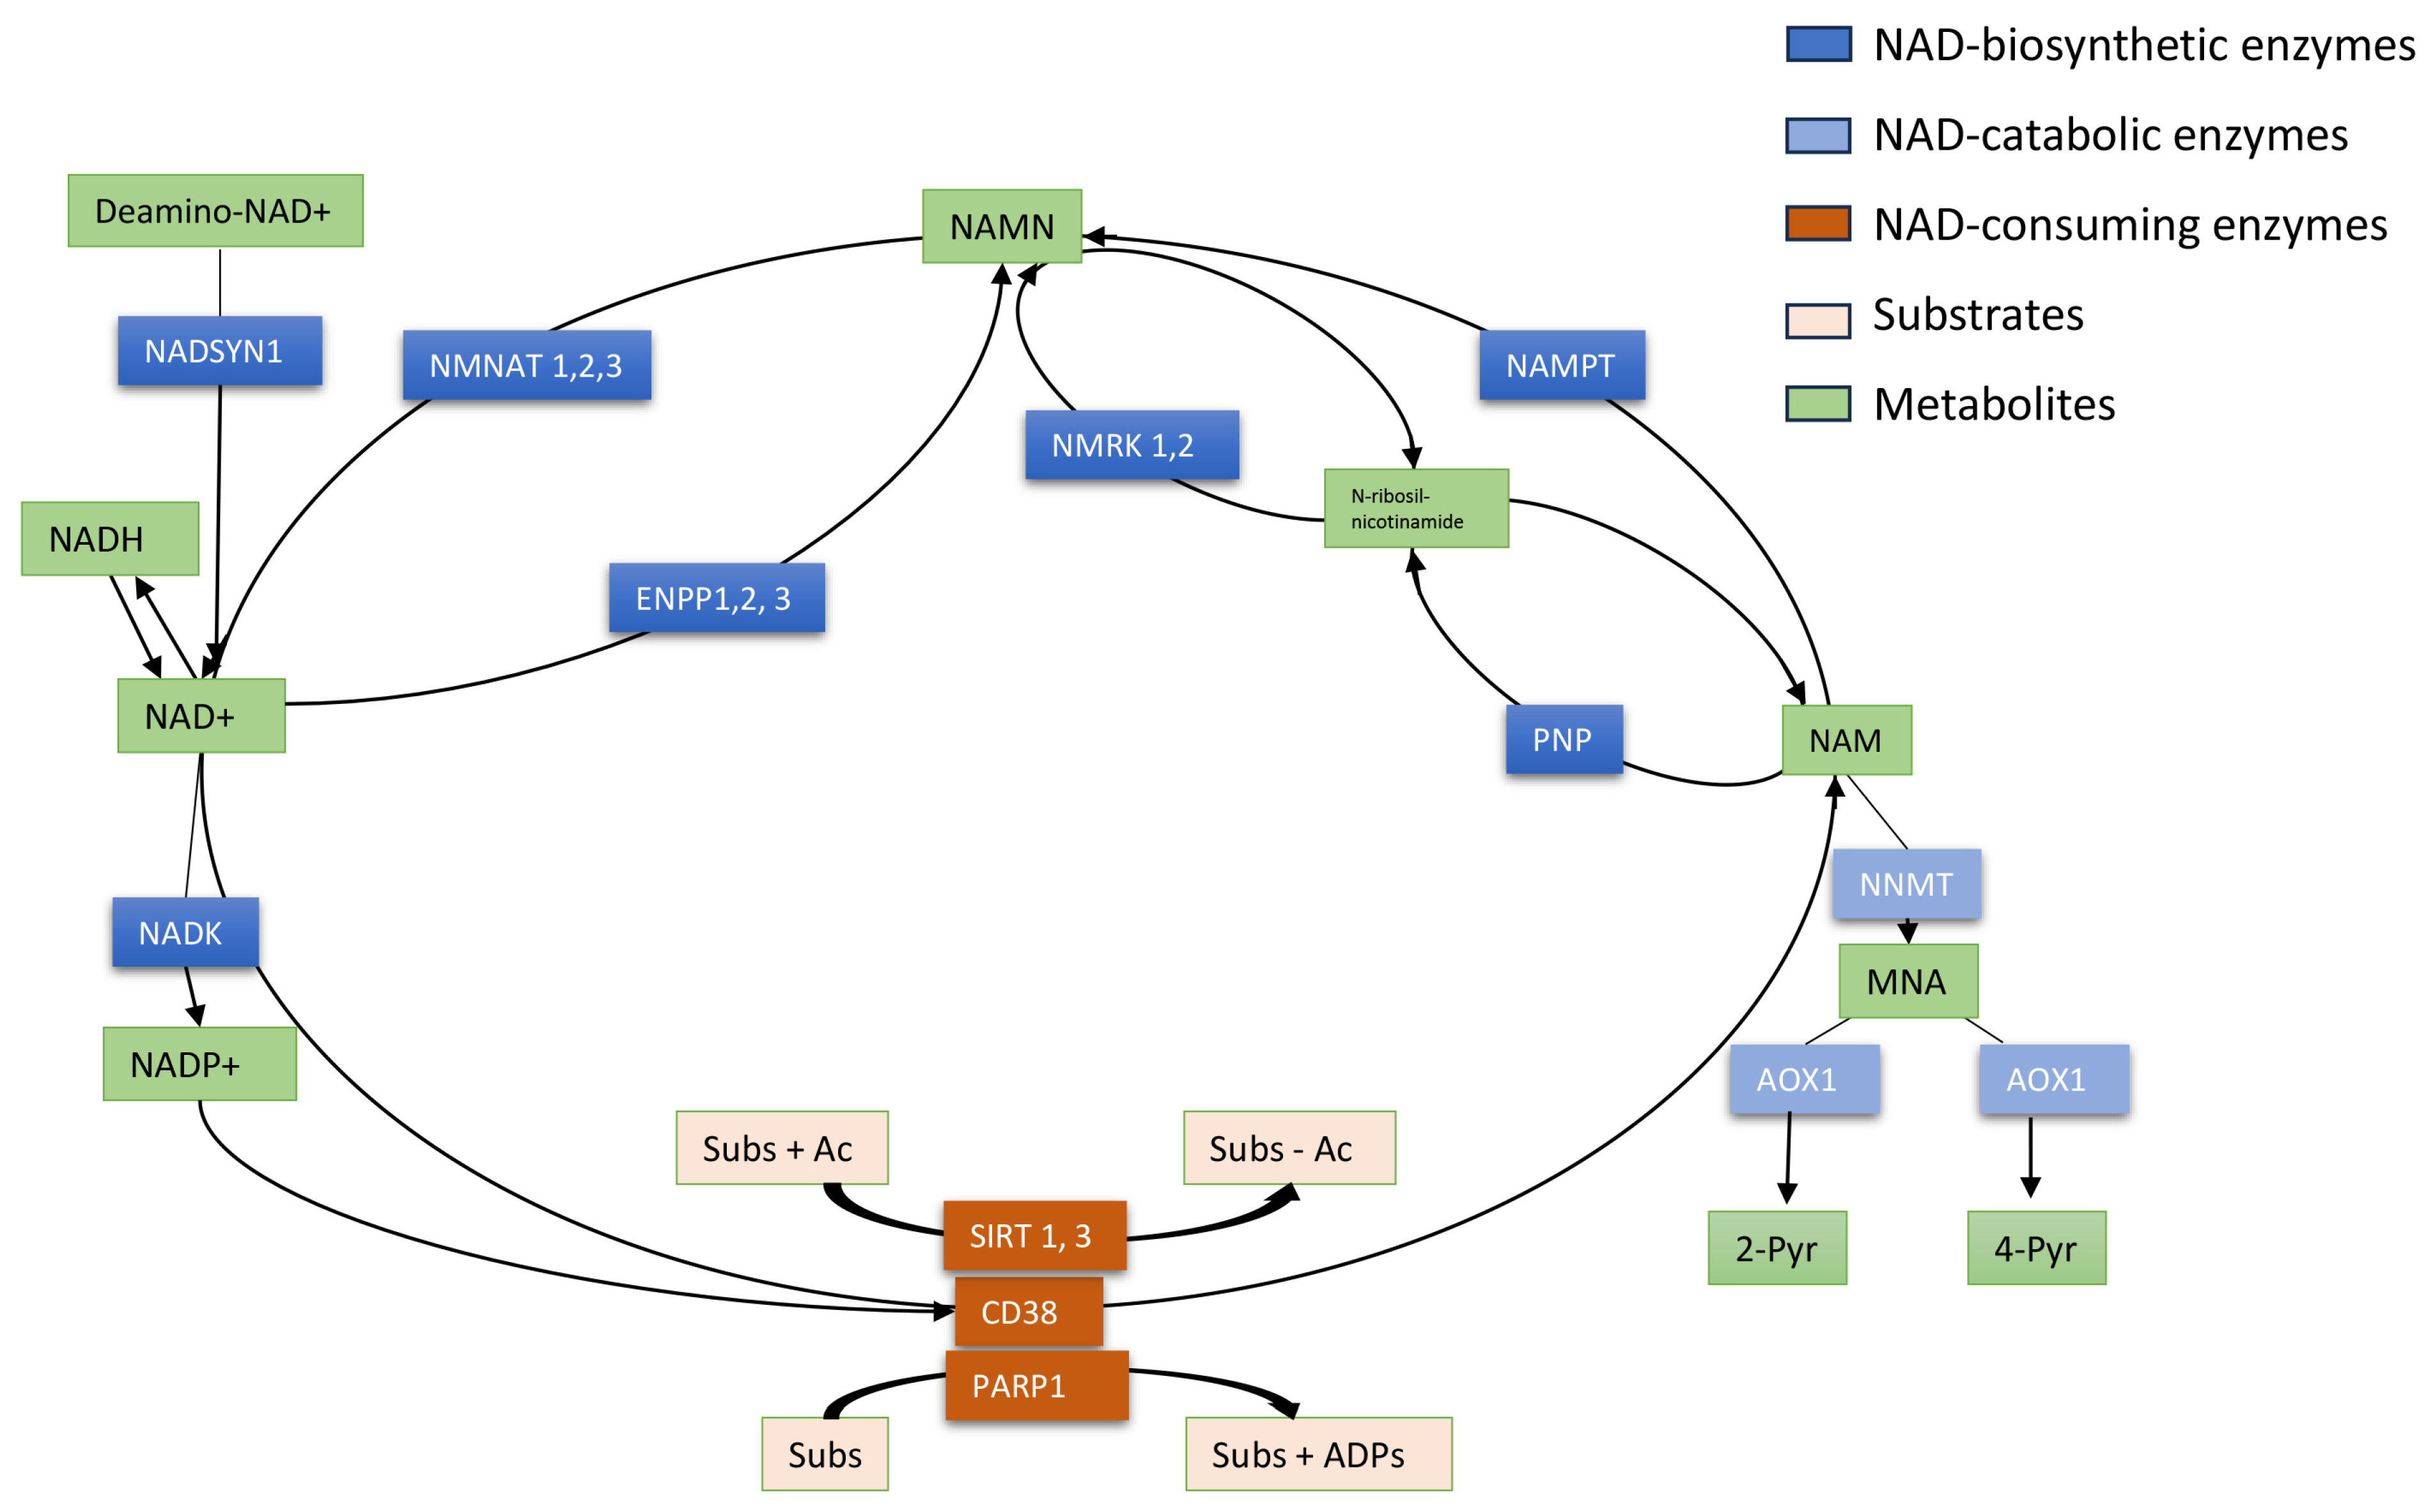
We investigated the gene expression of the foremost NMRGs (Figure 1) in specimens of HNSCC, LuSCC, and CeSCC using the TCGA dataset to assay their ability to discriminate cancer samples from normal controls. Namely, AOX1, NNMT, NAMPT, NMNAT1, NMNAT2, NMNAT3, ENPP1, ENPP2, ENPP3, NMRK1, NMRK2, PNP, NADK, NADSYN1, SIRT1, SIRT3, CD38, and PARP1 were investigated in each SCC type.

Figure 1.
Schematic representation of NAD+ metabolism. NAD+ is an essential coenzyme of redox reactions for the production of adenosine triphosphate (ATP) and is involved in several metabolic processes. Nicotinamide (NAM) is converted to NAD+ via the salvage pathway, which represents the major pathway of NAD+ biosynthesis in mammals. NAM phosphoribosyltransferase (NAMPT) is the “rate-limiting” enzyme that catalyzes the first step in the biosynthesis of NAM mononucleotide (NAMN) from NAM. NMN adenyltransferases (NMNATs) utilize ATP to generate NAD+, which can also be directly converted into NADP+ by NAD kinase (NADK). NAMN can also be synthesized by NMRKs from N-ribosil-nicotinamide which is metabolized by PNP from NAM. In a consuming way, the cyclic ADP-ribose synthase (cADPRS) CD38 hydrolyzes NAD+ to NAM. Poly-ADP-ribose-polymerases (PARPs) use NAD+ as a co-substrate to “ADP-ribosylate” target proteins (Sub), generating NAM. Sirtuins (SIRT) depend on NAD+ to deacetylate specific substrates (Sub) generating NAM. At least, in the catabolic way NAM is methylated to 1-methyl-NAM (MNA) by NAM-N-methyltransferase (NNMT) and then oxidized to l-methyl-2-pyridone-5-carboxamide (2-Pyr) and l-methyl-4-pyridone- 5-carboxamide (4-Pyr).
Numerous cancer samples and corresponding controls for each SCC type are reported in Table S1 which describes the clinicopathologic characteristics of analyzed patients. The distribution of clinicopathologic parameters in the paired cohorts was comparable. Due to the small number of normal CeSCC samples in the TCGA database, TCGA and GTEx data were integrated for further analysis.
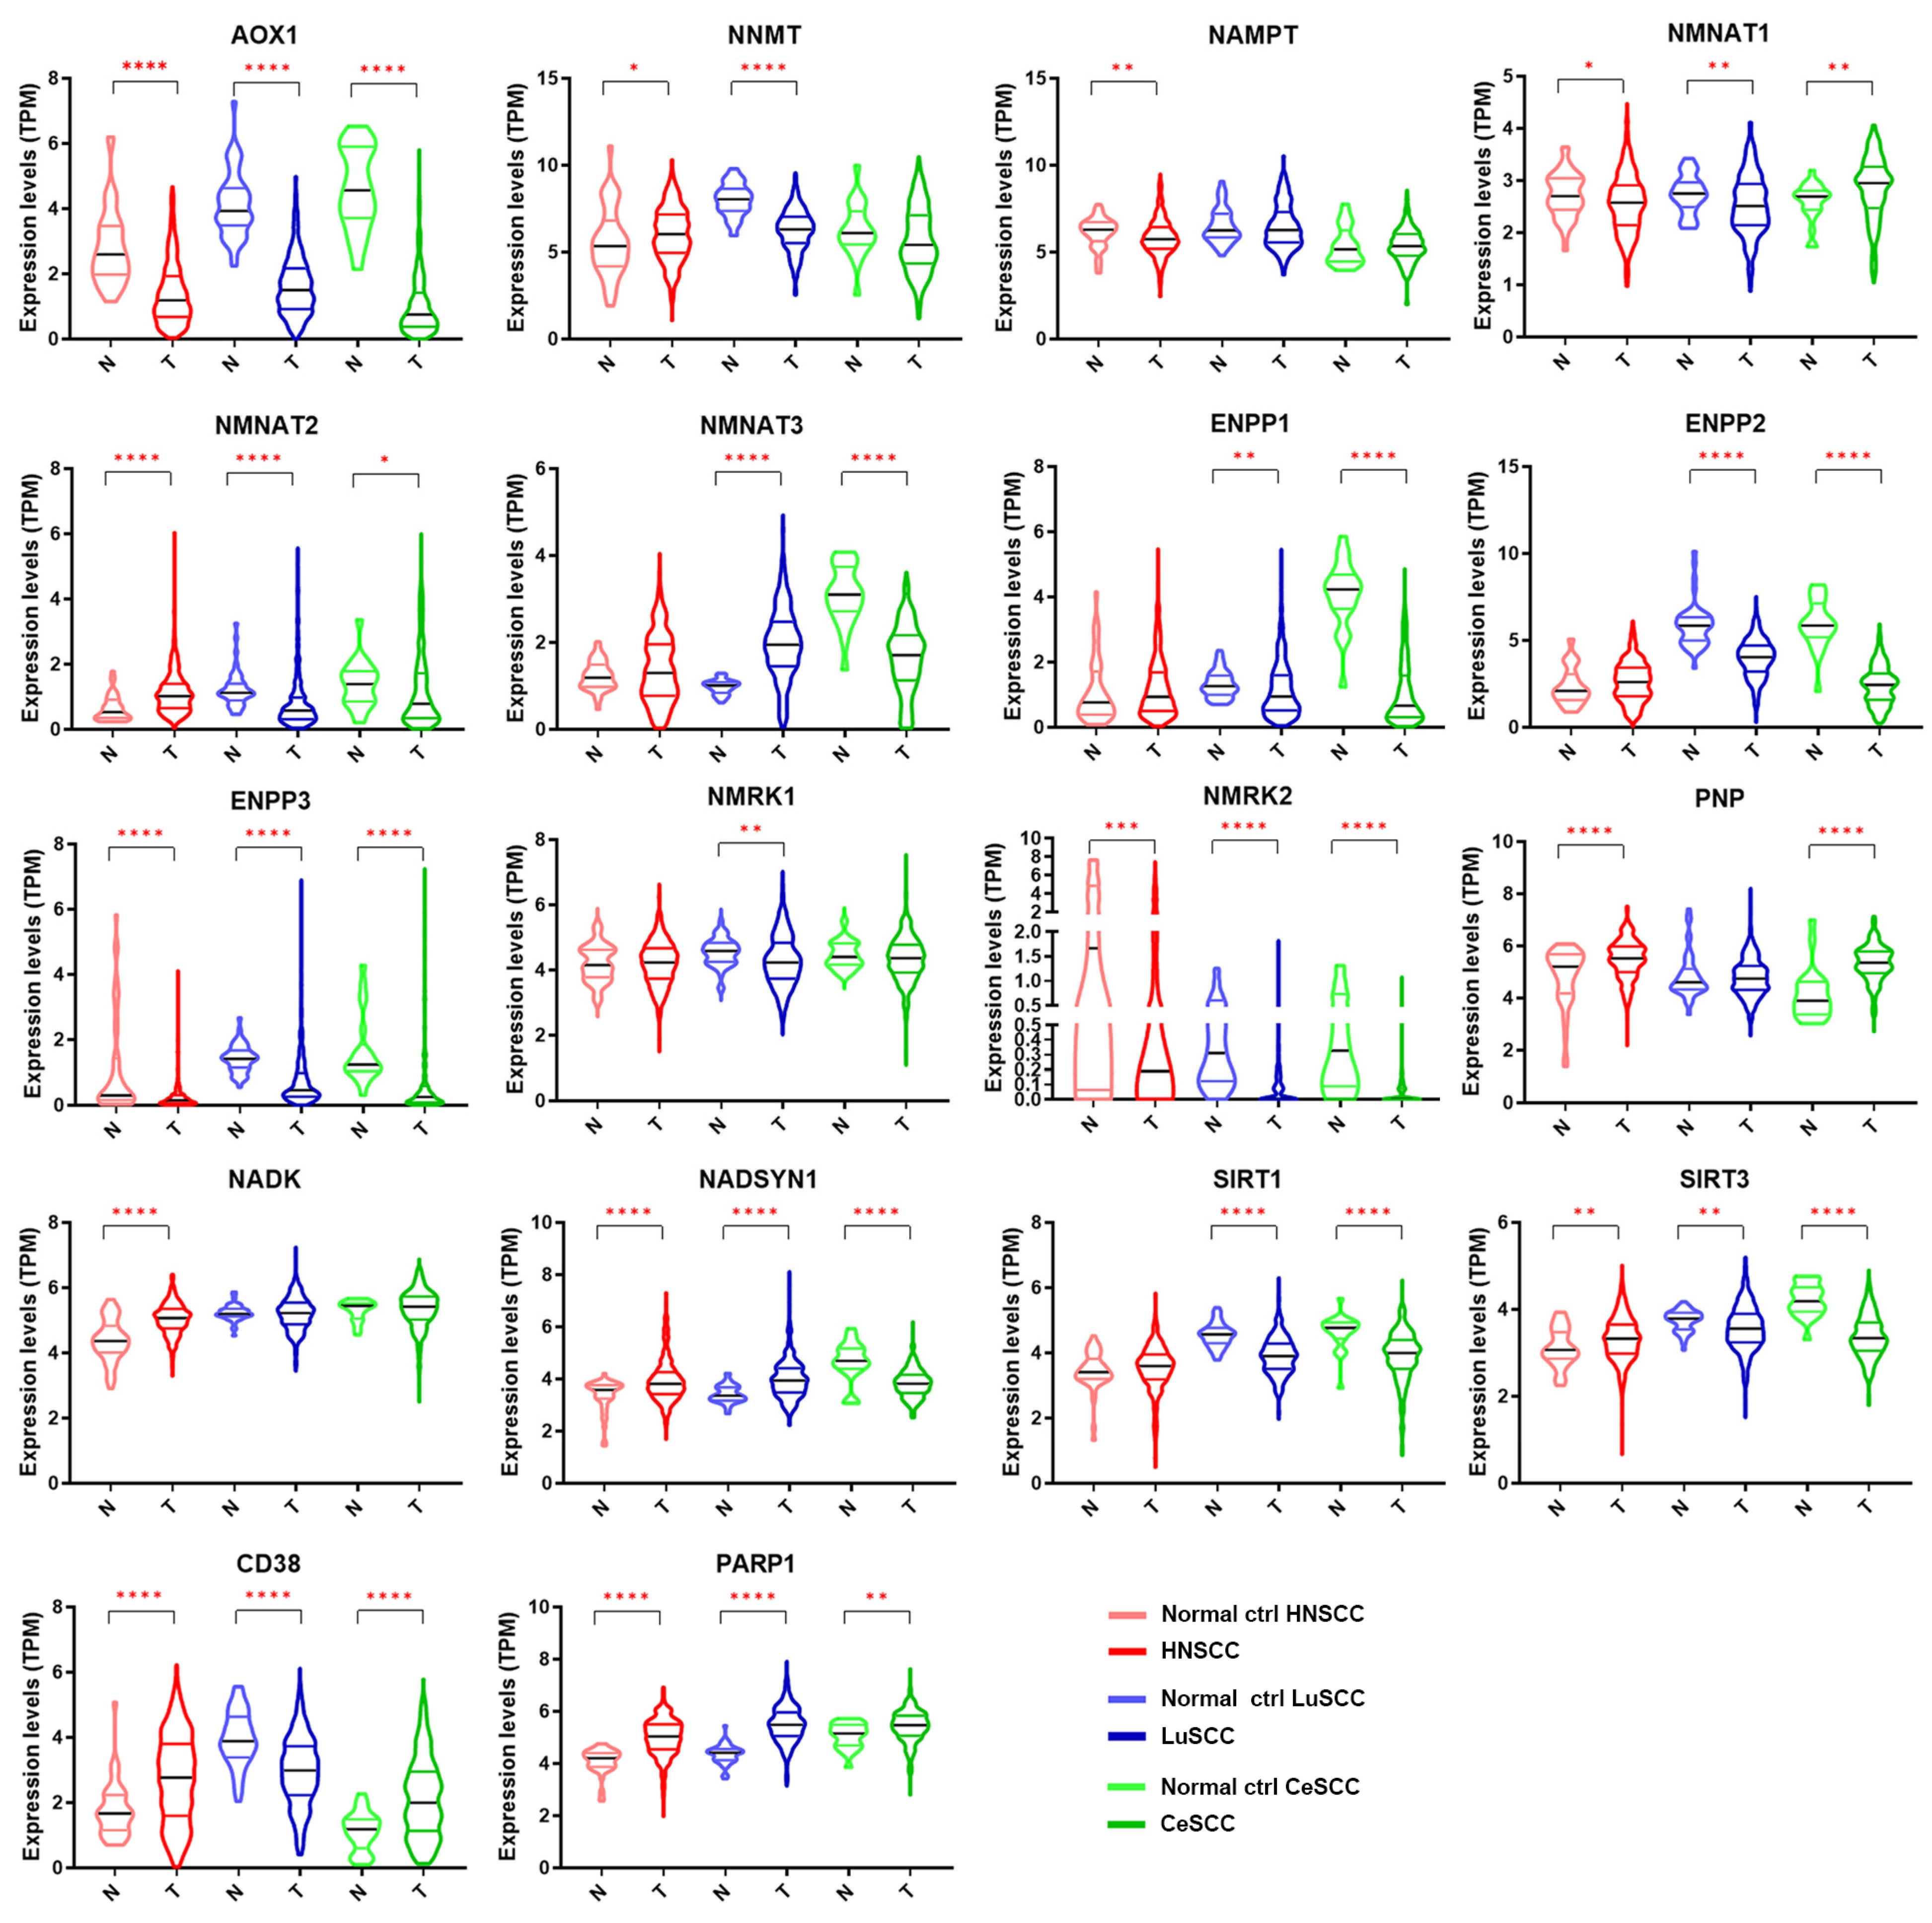
The expression levels of each NMRG in 504 patients with HNSCC, 501 with LuSCC, and 306 with CeSCC compared to corresponding normal specimens (44, 49, and 22 samples, respectively) are shown in Figure 2. The modulation of different NMRGs based on SCC types is reported in Figure S2. Different expression patterns between patient tumor specimens and corresponding normal controls were observed for most genes. Specifically, some genes were significantly modulated in all three tumors in the same way: AOX1, ENPP3, and NMRK2 were down-modulated in tumor specimens, whereas PARP1 was up-regulated. On the contrary, some genes were specifically modulated in a single tumor type. In fact, HNSCC was characterized by a significant decrease of NAMPT and an increase of NADK whereas LuSCC was characterized by a decrease of NMRK1. Although ENPP1 was down-modulated in two tumor types, the differential expression was more significant in CeSCC.
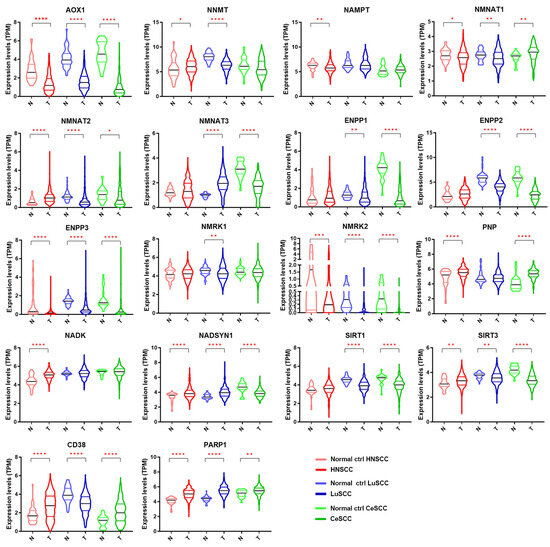
Figure 2.
Gene expression levels of 18 NMRGs in HNSCC, LuSCC, and CeSCC compared to corresponding controls. Violin plots representing the gene expression data of AOX1, NNMT, NAMPT, NMNAT1, NMNAT2, NMNAT3, ENPP1, ENPP2, ENPP3, NMRK1, NMRK2, PNP, NADK, NADSYN1, SIRT1, SIRT3, CD38, and PARP1 from the TCGA-HNSCC, TCGA-LuSCC, and TCGA-CeSCC plus endo- and ectocervix from GTEx datasets. Values on the y-axis represent the log2 of the normalized mRNA sequencing counts (TPM) for each NMR gene. On the x-axis, normal (N) and primary tumors (T) are indicated. Different colors represent tumor types and normal tissues. p Values were calculated using a two-tailed Mann-Whitney test. * p ≤ 0.05, ** p ≤ 0.01, *** p ≤ 0.001, **** p ≤ 0.0001. HNSCC: head and neck squamous cell carcinoma; LuSCC: lung squamous cell carcinoma; CeSCC: cervix squamous cell carcinoma; N: control specimens; T: tumor samples.
Other genes were modulated in a different way in all three SCCs (NMNAT1, NMNAT2, NADSYN1, SIRT3, and CD38) or in two tumor types (NNMT, NMNAT3, ENPP2, PNP, and SIRT1). Although NNMT1 was modulated in two tumor types, the differential expression was highly significant in LuSCC.
Receiver operating characteristic (ROC) analysis is used in clinical epidemiology to quantify how accurately diagnostic assays can discriminate between two patient states (e.g., “diseased” and “nondiseased”). Specifically, the area under the curve (AUC) has a meaningful interpretation for discrimination. AUC values range from 0.5 to 1, with 1 indicating 100% ability to discriminate “diseased” from “undiseased” cases.
To investigate the diagnostic power of NMRGs in discriminating each SCC type from corresponding controls, the AUC was calculated for each gene and reported in Tables S2–S4. The AUC comparison based on each NMRG and on the SCC type is shown in Figure 3 and Figure S3, respectively.
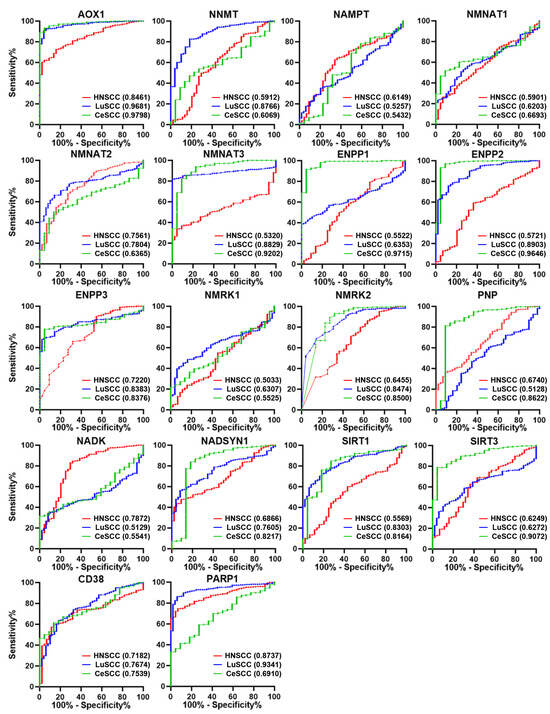
Figure 3.
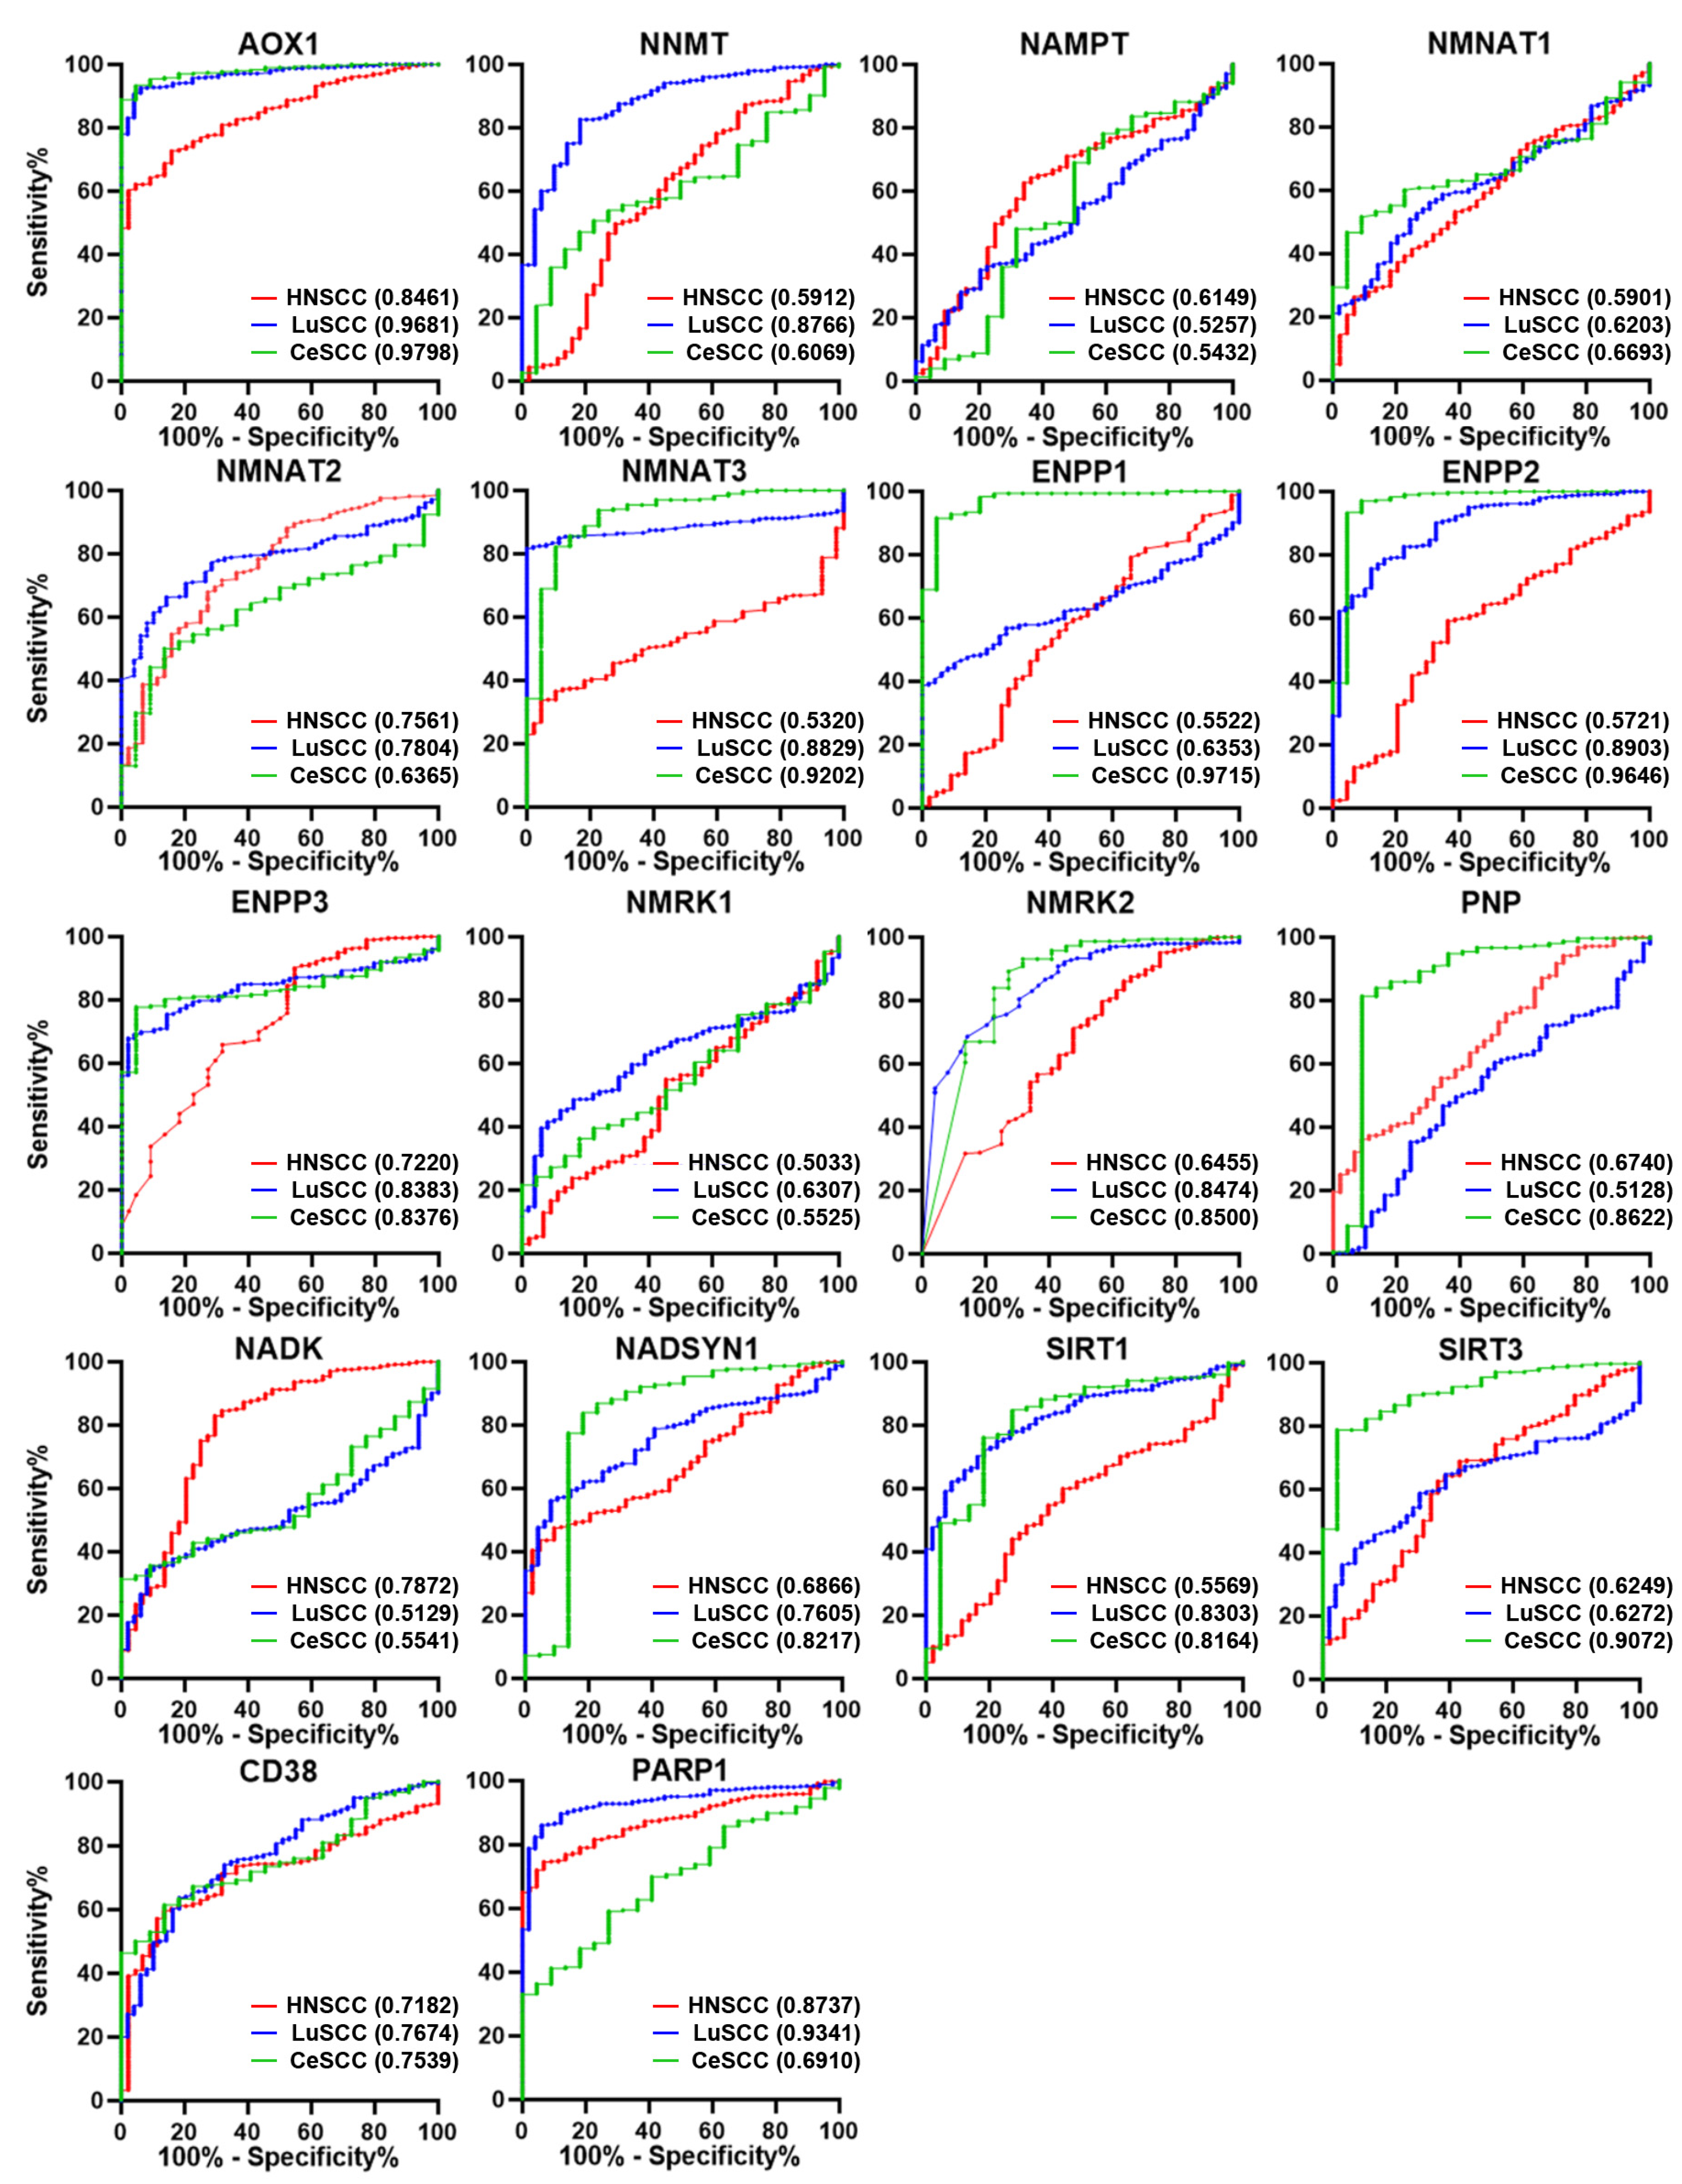
ROC analysis on the expression values of the 18 NMRGs. Overlapped ROC curves based on AOX1, NNMT, NAMPT, NMNAT1, NMNAT2, NMNAT3, ENPP1, ENPP2, ENPP3, NMRK1, NMRK2, PNP, NADK, NADSYN1, SIRT1, SIRT3, CD38, and PARP1 gene expression values for the three SCC types are represented in the same plot for each gene. Red lines indicate HNSCC; blue lines indicate LuSCC; green lines indicate CeSCC. The area under the curve (AUC) is plotted as sensitivity% vs. 100%—specificity%. AUC and p values are reported for each gene highlighted with the tumor’s corresponding color. HNSCC: head and neck squamous cell carcinoma; LuSCC: lung squamous cell carcinoma; CeSCC: cervix squamous cell carcinoma.
Considering genes with AUC > 0.7 and p ≤ 0.0001, we found 6 genes for HNSCC (AOX1, NMNAT2, ENPP3, NADK, CD38, and PARP1), 11 genes for LuSCC (AOX1, NNMT, NMNAT2, NMNAT3, ENPP2, ENPP3, NMRK2, NADSYN1, SIRT1, CD38, and PARP1), and 11 genes for CeSCC (AOX1, NMNAT3, ENPP1, ENPP2, ENPP3, NMRK2, PNP, NADSYN1, SIRT1, SIRT3, and CD38) with a good ability to differentiate each SCC from control samples (Tables S2–S4 and Figure S3).
Interestingly, some discriminating genes were typical of a SCC type (Figure 3). NADK was able to discriminate HNSCC from healthy controls (AUC = 0.7872; p < 0.0001) but not LuSCC (AUC = 0.5129; p = 0.7660) or CeSCC (AUC = 0.5541; p = 0.3962). Likewise, NNMT (AUC = 0.8766; p < 0.0001) discriminated LuSCC from controls but not HNSCC (AUC = 0.5912; p < 0.0448) or CeSCC (AUC = 0.6069; p = 0.0940). Furthermore, CeSCC was well discriminated by ENPP1 (AUC = 0.9715; p < 0.0001), PNP (AUC = 0.8622; p < 0.0001), and SIRT3 (AUC = 0.9072; p < 0.0001), different from HNSCC (ENPP1:AUC = 0.5522; p = 0.2505; PNP:AUC = 0.6740; p = 0.001; SIRT3:AUC = 0.6249; p = 0.006) and LuSCC (ENPP1:AUC = 0.6353; p = 0.0018; PNP:AUC = 0.5128; p = 0.7671; SIRT3: AUC = 0.6272; p = 0.0033).
Considering both differential expression and ROC analysis, three differentially expressed NMRGs are able to discriminate tumors from control samples selectively in each SCC type. Thus, a significant increase of NADK, a decrease of NNMT1, and a decrease of ENPP1 can be considered relevant specific biomarkers for HNSCC, LuSCC, or CeSCC, respectively.
3.2. NMRGs and Their Ability as SCC Discriminating Biomarkers
As SCCs share histological features and many molecular characteristics [8], we investigated whether the NMRG profile was typical of SCC or was common to several tumors.
This hypothesis was verified using principal component analysis (PCA) with the combined expression data of 16 NMRGs (AOX1, NNMT, NAMPT, NMNAT1, NMNAT2, NMNAT3, ENPP1, ENPP2, NMRK1, PNP, NADK, SIRT1, SIRT3, CD38, and PARP1) on samples from three SCC and three non-correlated tumors. Specifically, we considered kidney renal clear cell carcinoma (KIRC), which is a non-squamous epithelial tumor, sarcoma (SARC), and glioblastoma (GBM) (Figure 4A). The NMRG profile allowed a clear separation of SCCs from other tumors, mainly KIRK and SARC, indicating that such a profile seems specific for SCC.
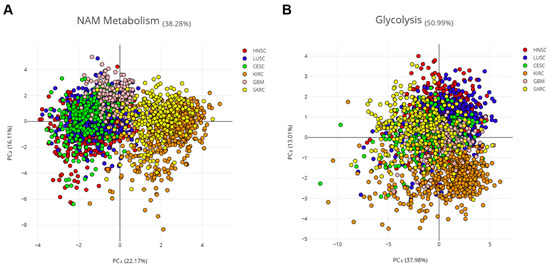
Figure 4.
PCA on three SCC and three non-correlated tumors. Principal component analysis (PCA) of six cancer types, three SCCs (HNSCC, LUSCC, and CESCC), and three non-correlated tumors (KIRC, SARC, and GBM). Log2 of the normalized mRNA sequencing counts (TPM) of 16 NMRGs (A) or 16 glycolysis-related genes (B) was used to perform the PCA. ENPP3 and NMRK2 were excluded from this analysis which considers only the expression in tumor samples, since low or undetectable ENPP3 expression is observed in the majority of HNSCC tumor samples and low or undetectable NMRK2 expression is observed in the majority of HNSCC; LuSCC and CeSCC tumor samples.
Aerobic glycolysis is persistently activated in tumor cells and several cancers are characterized by glycolysis-related gene signature [20]. Thus, 16 genes from the glycolysis pathway (i.e., PKM, TPI1, PFKP, PGAM1, PFKM, FOXK1, ENO1, ALDOA, ENO2, ENO3, FOXK2, GPI, HK1, PFKL, PGK1, and GAPDH) were used as the control (Figure 4B). PCA analysis showed that the glycolysis-related profile is not able to cluster patients with different tumors, indicating that such a profile seems common for all six tumors.
Therefore, the NMRG profile can be considered a relevant biomarker of SCC which is able to discriminate these tumors from KIRC, SARC, and GBM.
3.3. NMRG Expression and Risk Factors
Beyond site-specific risk factors, age, and gender are common determinants for SCC tumors [1].
In Figure S1, NMRGs with significant differential expression in age and gender groups of SCC patients are reported. NNMT1 was significantly up-regulated in HNSCC patients aged 81–100 years old compared to young patients (21–40 years), whereas NADSYN1 was more expressed in patients aged 41–60 years old. In keeping with the literature data, CD38 expression significantly increased with the age of HNSCC patients and probably was related to reported tissue NAD+ depletion [21,22]. AOX1 and ENPP2 displayed a significant differential expression between LuSCC patients aged 41–60 years old and 61–80 years old. An age-related increased expression was observed for ENPP3 in LuSCC patients. In CeSCC, an age-related decreased and increased expression was found for NNMT1 and NMNAT3, respectively. NMNAT1 significantly increased only in the 61–80-year-old patient group, whereas NMNAT2 significantly decreased in the 81–100-year-old group.
Males with HNSCC displayed a significantly increased expression of NMNAT3 and PARP1 with respect to females, whereas males with LuSCCs showed increased levels of NAMPT.
Thus, only a few NMRGs can be considered age- or gender-related in those SCC samples.
3.4. NMRGs as Diagnostic Biomarkers for Patient Stratification
SCCs are classified according to histological features (e.g., stage, grade), anatomical site, and, in some types, HPV status (Table S1). Staging and grading of SCC are established prerequisites for management as they influence risk stratification and treatment planning. The TNM system is based on an assessment of the size of the primary tumor (T), involvement of locoregional lymph nodes (N), and metastasis (M). HNSCC staging displays values from 1 to 4, which represent the most advanced forms.
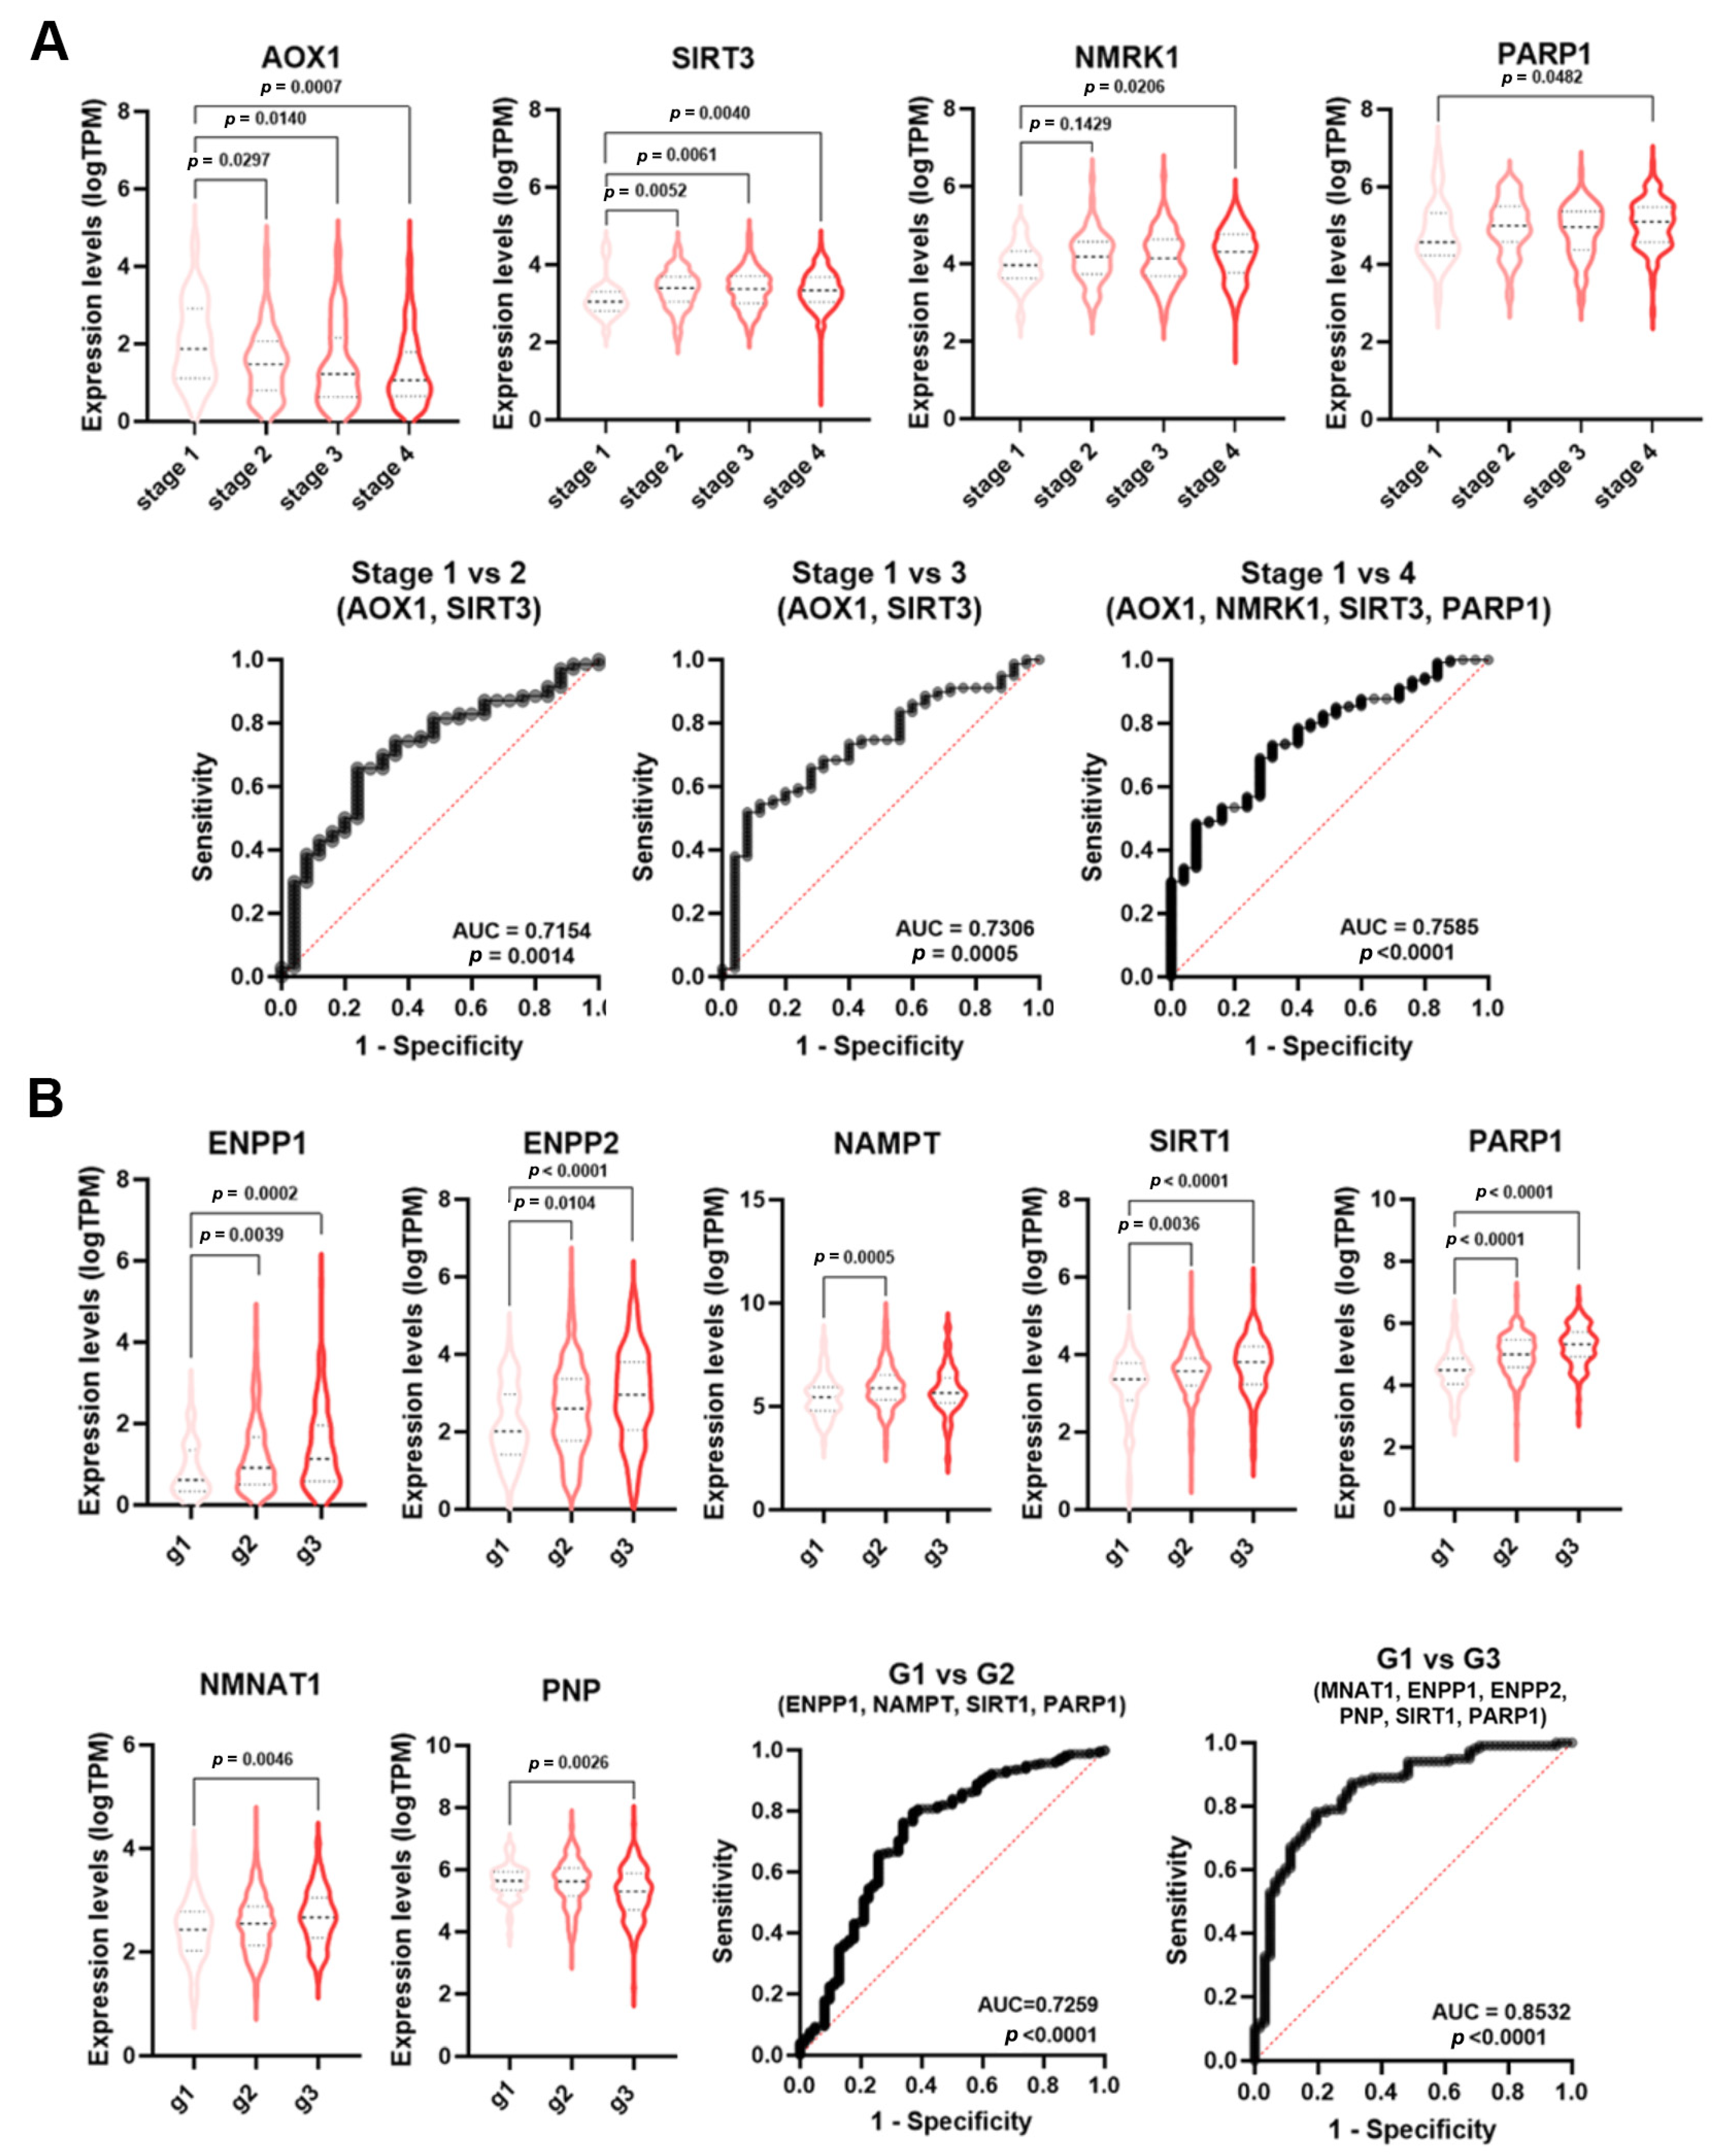
As reported by ROC analysis, some single genes displayed a low diagnostic power (AUC < 0.7) for HNSCC staging (Table S2). However, NMRGs with significant AUC values (AOX1, SIRT3, NMRK1, PARP1) were differentially expressed among tumor stages (Figure 5A). Thus, multiple logistic analysis and ROC analysis were carried out on the combined expression profile of these NMRGs with significant AUC values to identify a diagnostic signature.
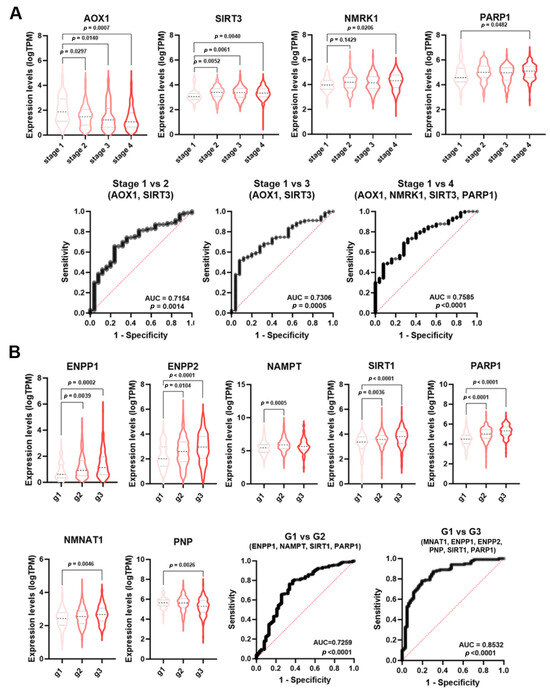
Figure 5.
NMRGs as diagnostic biomarkers for HNSCC staging and grading. Differential gene expression levels of selected genes (violin plots) and ROC curve on their combined expression values for HNSCC patients staging (A) and grading (B). HNSCC: head and neck squamous cell carcinoma.
As shown in Figure 5A, the signature combining the expression values of AOX1 and SIRT3 was able to discriminate stage 1 from stage 2 HNSCC samples (AUC = 0.7154, p = 0.0014) and stage 1 from stage 3 (AUC = 0.730, p = 0.0005). The signatures AOX1, NMRK1, SIRT3, and PARP1 were able to discriminate stage 1 from stage 4 HNSCC (AUC = 0.7585; p < 0.0001). No single NMRG or specific signature was able to discriminate LuSCC stages (Table S3).
Histopathological grading is based on the differences in tumor differentiation. Low-grade or grade 1 HNSCC are well-differentiated tumors, whereas high-grade or grade 3 HNSCC are poor or undifferentiated lesions. Likewise staging, single genes displayed a low diagnostic power for HNSCC grading (Table S2). However, NMRGs with significant AUC values (ENPP1, ENPP2, NAMPT, SIRT1, PARP1, NMNAT1, and PNP) were differentially expressed among tumor grades (Figure 5B). Multiple logistic analysis and ROC analysis on the combined expression profile of these genes with significant AUC value (Table S2) identified a diagnostic signature (NAMPT, ENPP1, SIRT1, and PARP1) able to discriminate grade 1 from grade 2 HNSCC (AUC = 0.7259; p < 0.0001). Furthermore, the signature NMNAT1, ENPP1, ENPP2, PNP, SIRT1, and PARP1 were able to discriminate grade 1 from grade 3 HNSCC (AUC = 0.8532; p < 0.0001). No single NMRG or specific signature was able to discriminate CeSCC grade (Table S4).
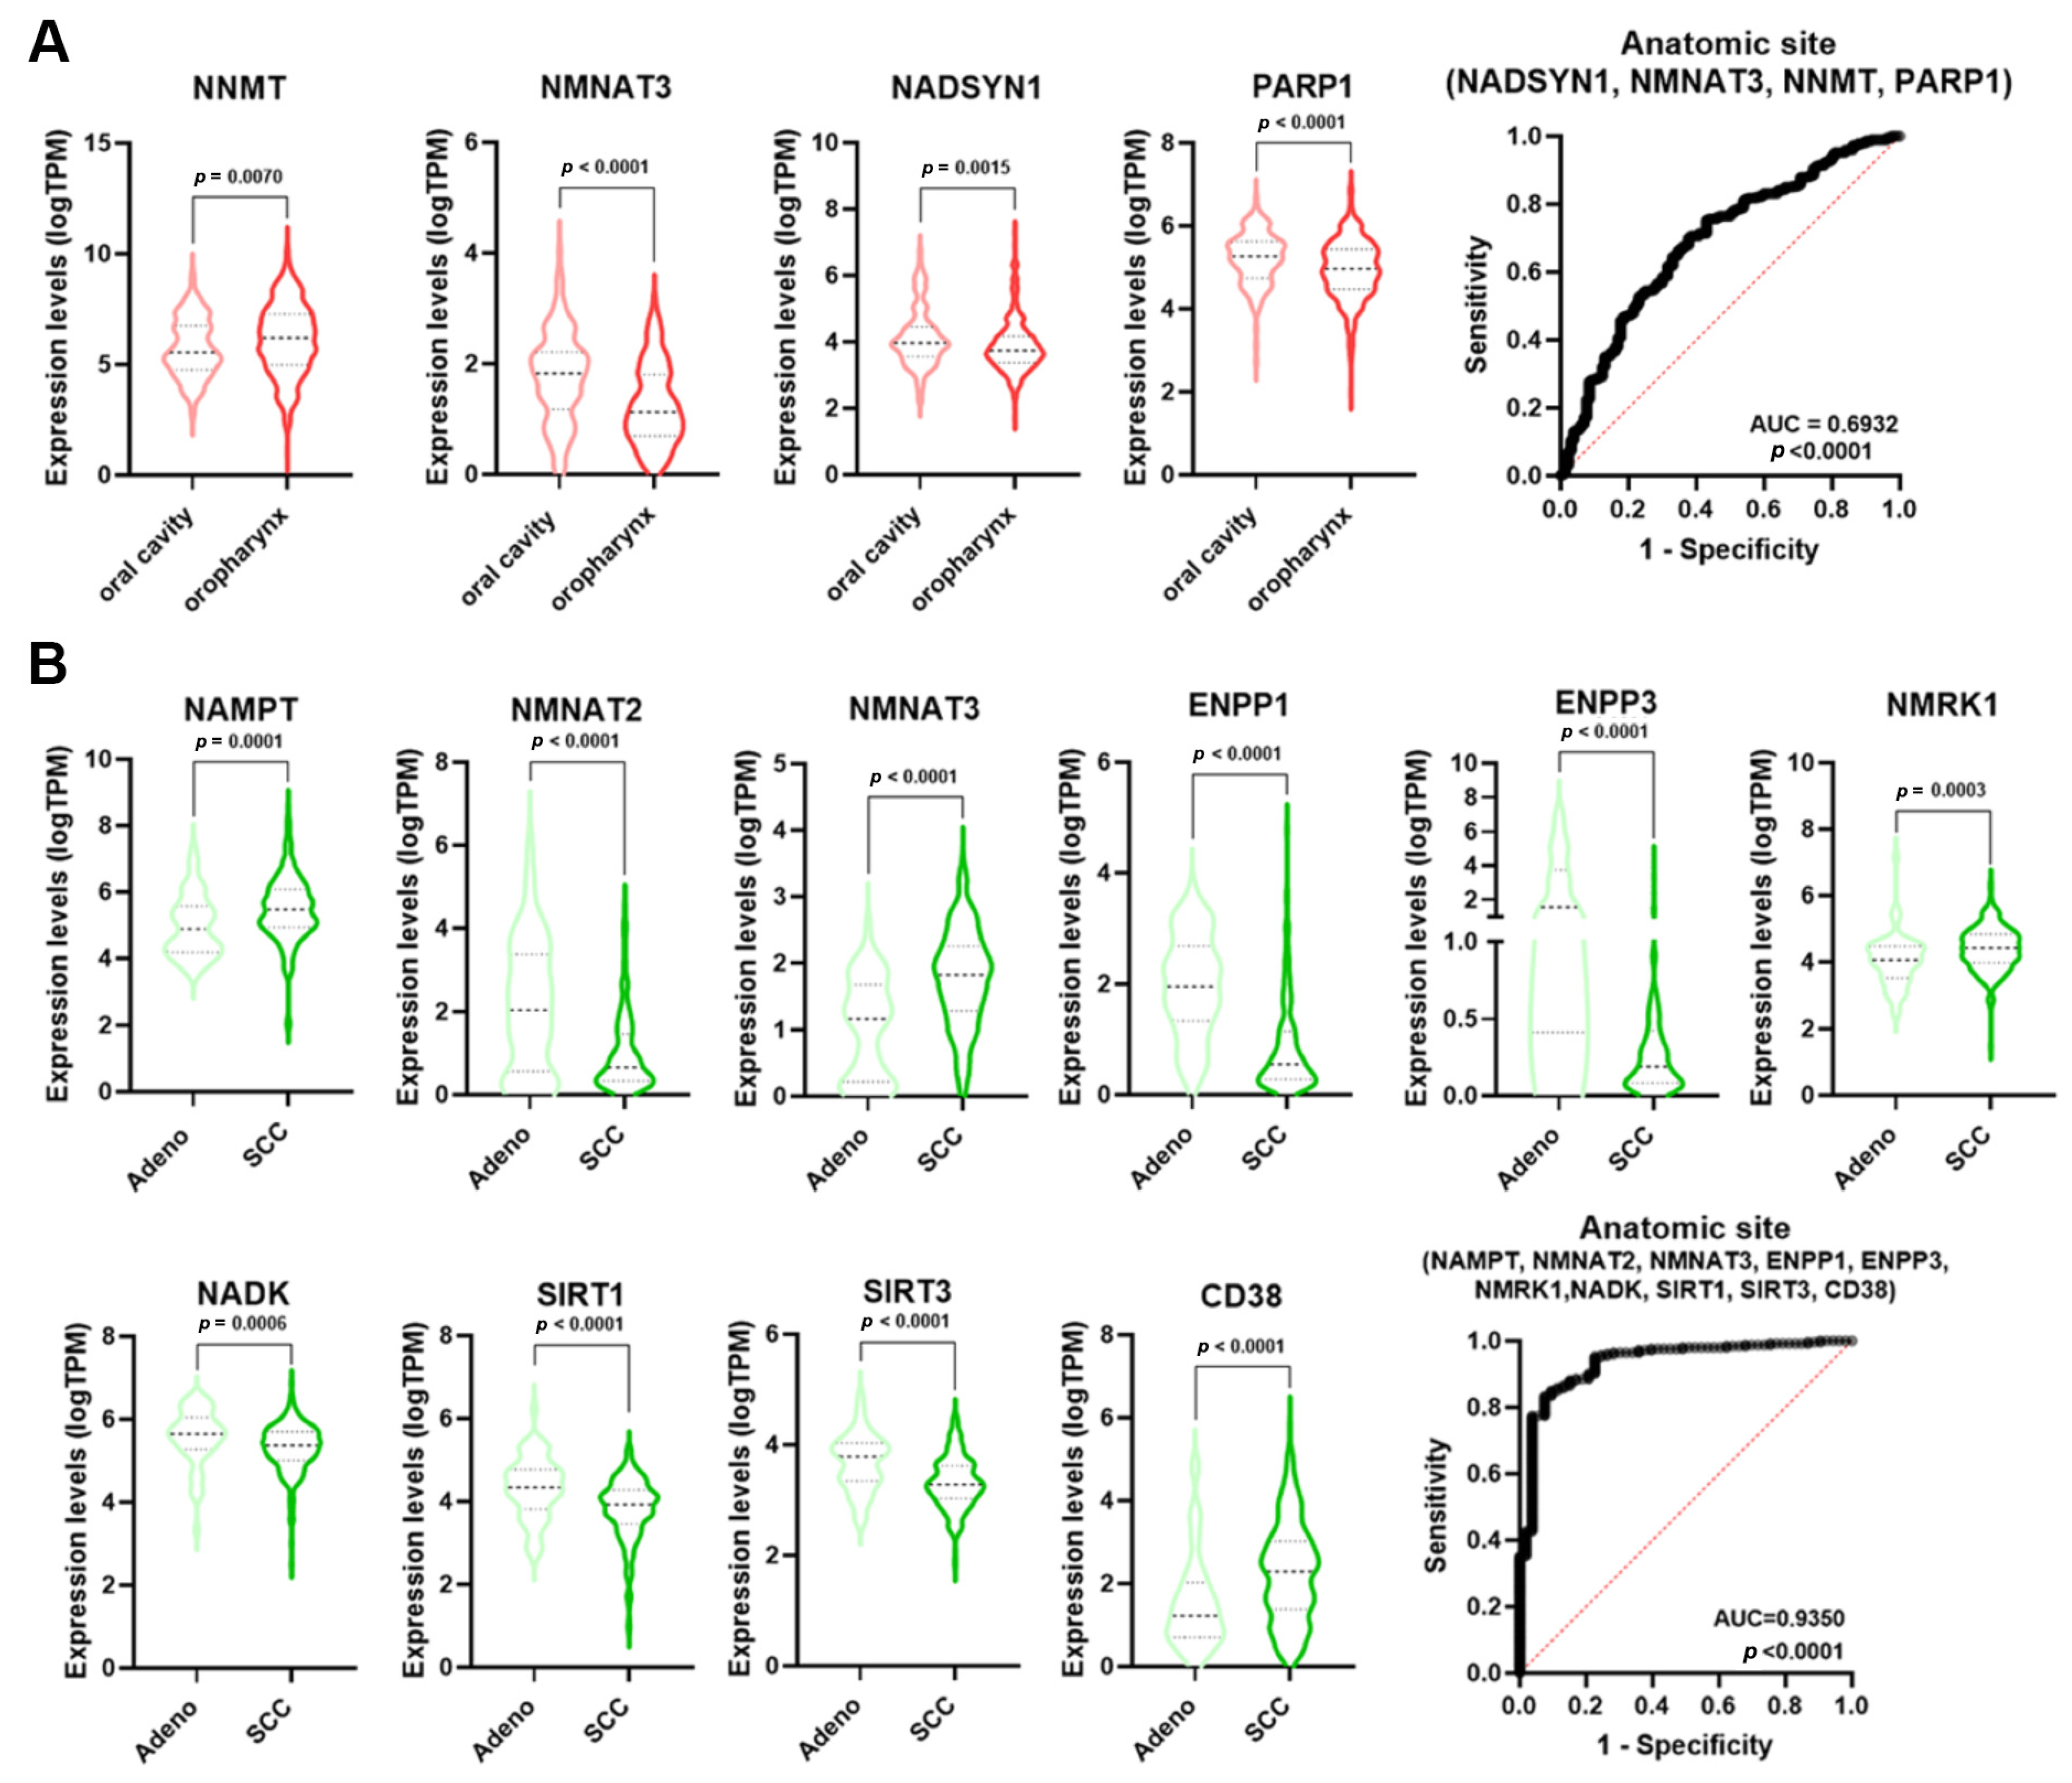
The incidence of HNSCC greatly varies depending upon the anatomic region [23]. Single NMRGs displayed a low diagnostic power for discriminating the oropharynx specimens from those of the oral cavity (Table S2). However, NMRGs with significant AUC values (NNMT, NMNAT3, NADSYN1, and PARP1) were differentially expressed between these anatomic regions (Figure 6A). Notably, multiple logistic analysis and ROC analysis on the combined expression profile of these genes indicated that the signature had a high diagnostic power for discriminating the oropharynx from oral cavity HNSCCs (AUC = 0.6932; p < 0.0001).
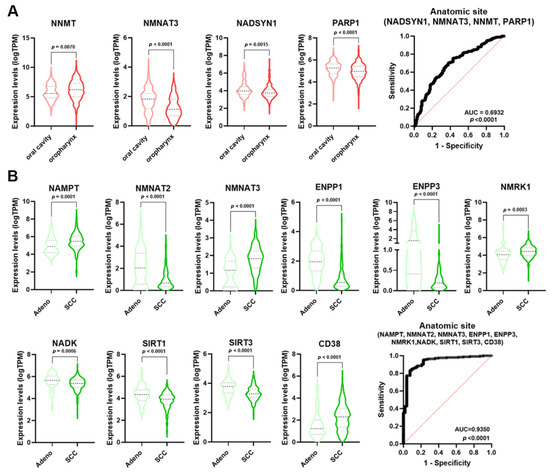
Figure 6.
NMRGs as diagnostic biomarkers for HNSCC and CeSCC anatomic site. Differential gene expression levels of selected genes (violin plots) and ROC curves on their combined expression values for HNSCC (A) and CeSCC (B) anatomic site. HNSCC stratification violin plots are colored in different shades of red; CeSCC stratification violin plots are colored in different shades of green. HNSCC: head and neck squamous cell carcinoma; CeSCC: cervix squamous cell carcinoma.
Considering the histological type of CeSCC, single NMRGs displayed a low diagnostic power for discriminating the adenocarcinoma from SCC (Table S4). However, NMRGs with significant AUC values (NAMPT, NMNAT2, NMNAT3, ENPP1, ENPP3, NMRK1, NADK, SIRT1, SIRT3, and CD38) were differentially expressed between histological types (Figure 6B). Multiple logistic analysis and ROC analysis on the combined expression profile of these genes identified that signature as a discriminant for adenocarcinoma from SCC of the cervix (AUC = 0.935; p < 0.0001).
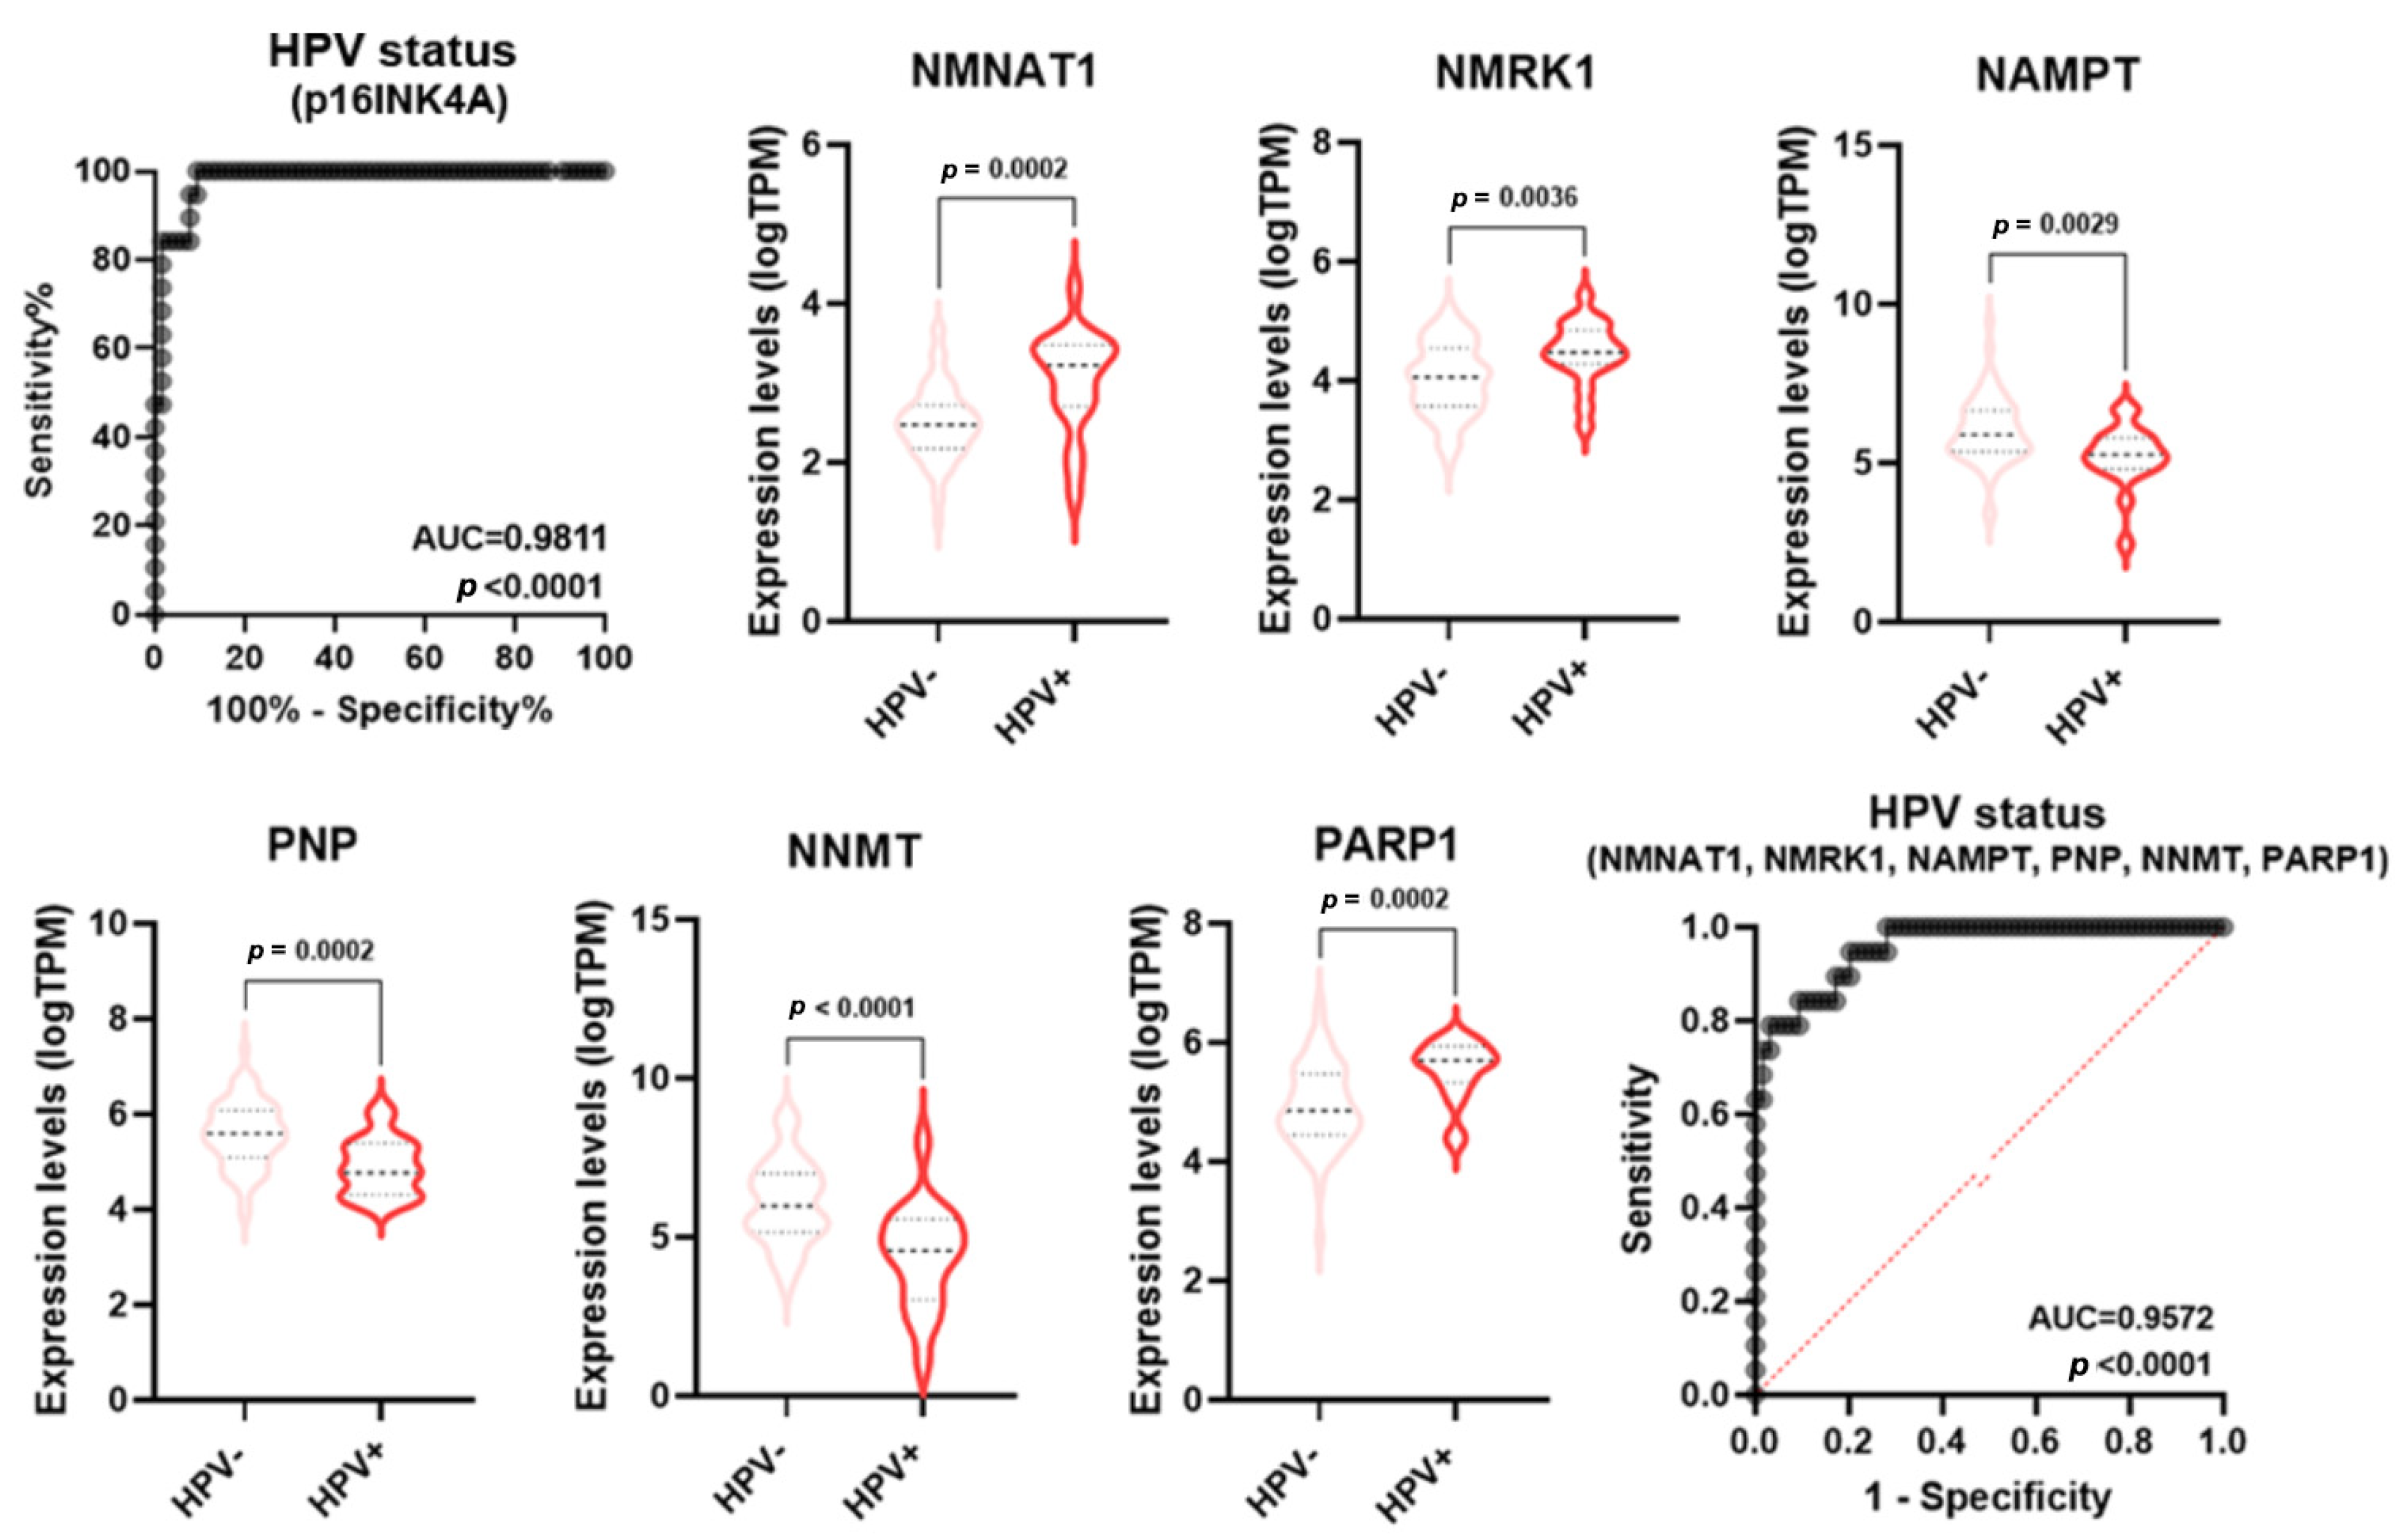
Numerous pieces of evidence indicate molecular and clinical differences in mutations, gene expression regulation, treatment responses, and patient survival rates between HPV-negative and HPV-positive HNSCC [23]. Specifically, HPV-positive tumors usually display a better prognosis than HPV-negative tumors. p16 (INK4A) staining is a widely used and generally accepted surrogate tool to identify HPV association and, therefore, to classify HNSCC as either associated or not associated with the viral infection [23]. In keeping with the literature data, the ROC analysis of p16 expression in HPV positive vs negative samples displayed an AUC = 0.9811 (p < 0.0001) (Figure 7). Some single NMRGs (NNMT, NAMPT, NMNAT1, NMRK1, PNP, and PARP1) displayed a good diagnostic power for discriminating HPV status of HNSCC (Table S2) and were differentially expressed between HPV-negative and HPV-positive groups (Figure 7). Furthermore, the signature combining these NMRGs displayed a very high diagnostic power (AUC = 0.9572; p < 0.0001) similar to what was measured with the p16 expression (Figure 7).
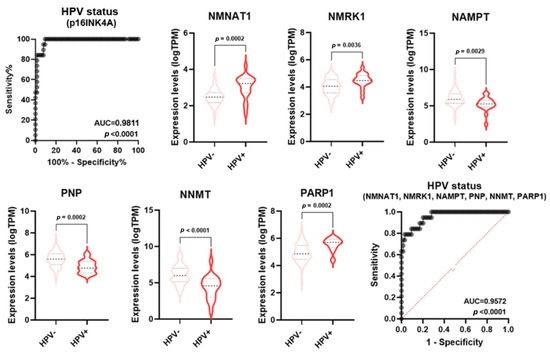
Figure 7.
NMRGs as diagnostic biomarkers for HPV infection status. Differential gene expression levels of selected genes (violin plots) and ROC curve on their combined expression values for HPV infection status in HNSCC specimens. HNSCC: head and neck squamous cell carcinoma.
Therefore, specific NMRG signatures display high diagnostic power for several clinical-pathological characteristics and their validation may be helpful for diagnosis and personalized treatments.
3.5. NMRGs and Immune Microenvironment Characterization
Current staging and grading systems are centered on the tumor per se rather than stroma and host responses. Thus, they are informative for prognosis but not exhaustive, as the immune microenvironment highly influences SCC development and the response to immunotherapy [24,25]. Comprehensive characterization of tumor-infiltrating immune (TII) cells in solid tumors has been increasingly recognized as a novel and robust prognostic factor. Notably, NAD+ metabolism may regulate the function of innate and adaptive immune cells, which can act as tumor suppressors or promoters, and, therefore, contribute to inflammatory response [26]. Therefore, the characterization of the SCC immune microenvironment can help the treatment stratification, especially for the new immunotherapeutic drugs.
The amount of six TII cell types (B cells, CD4 T cells, CD8 T cells, neutrophils, macrophages, and dendritic cells) in the tumor microenvironment of HNSCC, LuSCC, and CeSCC was estimated using Tumor IMmune Estimation Resource (TIMER), a web resource for the evaluation of clinical relevance of tumor-immune infiltration. The correlation of NMRG expression with immune infiltration level was further evaluated (Table 1). The data revealed that although TII cells examined were found in all SCC types, the best correlations with NMRG expression were observed in HNSCC. On the contrary, poor correlations were observed in CeSCC.

Table 1.
Correlation of NMRG expression with immune infiltrates and checkpoints. Red spots indicate a significant positive correlation, blue spots indicate a significant negative correlation and grey spots indicate no correlation. Data obtained with genes displaying low or undetectable expression in tumor samples are in grey.
Considering HNSCC, CD4+ T cells were the most relevant immune cells positively correlated with NMRG expression (13/16 genes). The expression of seven NMRGs (i.e., AOX1, ENPP1, ENPP2, NADK, SIRT1, CD38, and PARP1) was positively correlated to infiltrating levels of all TII cells. On the contrary, PNP and SIRT3 expression displayed significantly negative correlations with TII amount.
Considering LuSCC, the levels of neutrophils, macrophages, and CD8+ T cells were significantly positively associated with most of the NMRGs (10/17, 10/17, and 9/17 genes, respectively). The expression of seven NMRGs (i.e., AOX1, NNMT, ENPP1, ENPP2, ENPP3, SIRT1, and CD38) positively correlated with an increase of all TII cells.
Considering CeSCC, the levels of B cells, CD4+ T cells, and macrophages were significantly positively associated with most of the NMRGs (7/17, 7/17, and 5/17, respectively). Only ENPP2 had a significantly positive correlation with the increase of all TII cells.
Our results suggest a potential role of NMRGs in the tumor immune microenvironment changes mainly in HNSCC.
3.6. NMRGs and Immune Checkpoints
Immunotherapy treatments are based on the activation or inhibition of molecules that orchestrate the host immune response and display impressive results in different cancer types, increasing survival with less severe side effects. The most important inhibitory targets are CTL4, PD-1 (PDCD1), and its ligand PD-L1 (CD-274) [27]. Notably, NAD+ metabolism drives IFNγ-induced PD-L1 expression to lead to tumor immune evasion [28].
The correlation between NMRGs and PD-1 or PD-L1 expression in HNSCC, LuSCC, and CeSCC was evaluated using TIMER2.0. The Spearman’s Rho correlation values are reported in Table 1.
Similar to what was observed for TII cells, the best correlations of NMRGs with PD-1 or PD-L1 expression were mainly observed in HNSCC. On the contrary, poor correlations were observed in CeSCC.
Our results indicate that NMRG is associated with a suppressive immune microenvironment mainly in HNSCC.
3.7. NMRGs as Prognostic Biomarkers
Several factors can affect patients’ prognosis, including a weakened immune system, tumor location, dimension and depth, and recurrence due to therapy resistance. Early diagnosis improves the survival of patients with SCCs. However, most patients cannot be screened early due to the lack of available biomarkers [1].
To investigate if NAD-metabolism genes may be prognostic markers or therapeutic targets, we analyzed how their expression relates to patient survival. Survival data are reported in Table S5. Expression levels were categorized as “high-level” (i.e., above the median value) and “low-level” (i.e., below the median value).
High-level expression of NNMT, NAMPT, and PNP was significantly associated with HNSCC’s poor prognosis (Table S5 and Figure 8A–C). Moreover, the down-regulation of NADSYN1 and up-regulation of AOX1 and NMNAT1 were associated with LuSCC and CeSCC poor prognosis, respectively (Table S5 and Figure 8D–F).
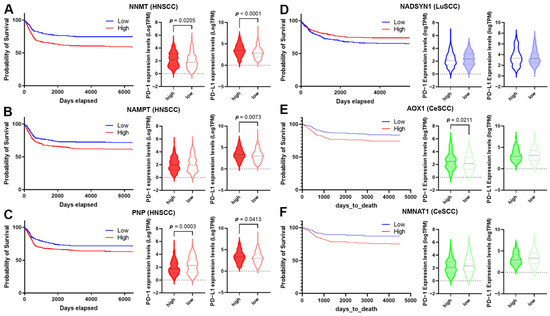
Figure 8.
Correlation of NMRG expression with immune infiltrates and checkpoints. (A–F) The survival curve is reported for each selected gene (blue lines indicate the probability of survival associated with low gene expression, whereas red lines indicate the probability of survival associated with high gene expression) in HNSCC (A–C); LuSCC (D) and CeSCC (E,F). Violin plots show differential immune checkpoint expression values between high- and low-risk groups for each gene. High-risk groups are represented by filled violins; low-risk groups are represented by empty violins. HNSCC: head and neck squamous cell carcinoma; LuSCC: lung squamous cell carcinoma; CeSCC: cervix squamous cell carcinoma.
The overall survival for HNSCCs and CeSCCs was also investigated using a combination of these specific NMRGs. Notably, the signature “NNMT, NAMPT, PNP” displayed an increased prognostic significance for HNSCCs with respect to single NMRGs (Figure S4). Likewise, the signature “AOX1, NMNAT1” had a higher prognostic power for CeSCC compared to that of single NMRGs (Figure S4).
To evaluate whether SCC’s poor prognosis was correlated to immune checkpoint alteration, we investigated the expression of PD-1 and PD-L1 biomarkers in high- and low-risk groups (Figure 8) and their correlation with NMRG levels (Table 2). PD-1 and PD-L1 were significantly up-regulated in high-risk HNSCC with high NNMT1 levels. In the low-risk group, NNMT1 levels positively correlated with PD-L1 expression (Figure 8A and Table 2). Considering high-risk HNSCC with high NAMPT, PD-L1 was significantly up-regulated. In the low-risk group, its expression significantly correlated with NAMPT levels. PD-1 expression did not vary between risk groups although in the high-risk group, their levels inversely correlated with NAMPT expression. In the low-risk group, NAMPT levels positively correlated with PD-L1 expression (Figure 8B and Table 2). Considering high-risk HNSCC with high PNP, PD-1, and PD-L1 were significantly down- and up-regulated, respectively. In the low-risk group, PD-1 and PD-L1 levels correlated with PNP expression in a negative or positive manner, respectively (Figure 8C and Table 2). PD-1 and PD-L1 did not vary between LuSCC risk groups. In the high-risk group, NADSYN1 levels positively correlated with PD-L1 expression (Figure 8D and Table 2). Considering high-risk CeSCC with high AOX1, PD-1 was significantly up-regulated. No correlations were found between AOX1 levels and PD-1 or PD-L1 expression (Figure 8E and Table 2). PD-1 and PD-L1 did not vary between CeSCC risk groups expressing NMNAT1. Furthermore, no correlations were found between NMNAT1 levels and PD-1 or PD-L1 expression (Figure 8F and Table 2).
Table 2.
Correlation data between NMRGs and immune checkpoint expression. * p ≤ 0.05, ** p ≤ 0.01, **** p ≤ 0.0001, ns = no significance.
4. Discussion
Given the broad range of tissues in which SCC arises, it represents the most common cancer worldwide [1]. SCCs share several features, including genetic and epigenetic alterations, and the impact of the microenvironment on tumor development and progression.
Several studies showed NAD+ metabolism dysregulation in tumors [10]. However, no NMRGs have been reported as diagnostic or prognostic biomarkers/signatures for HNSCC, LuSCC, and CeSCC.
Using the TCGA dataset, we identified an NMRG profile, composed of 16 genes, able to discriminate these SCC tumors from KIRC, SARC, and GBM specimens. Otherwise, a profile composed of 16 genes encoding for enzymes of the glycolysis did not display a discriminating power between different tumors. Therefore, the NMRG profile can be considered a relevant biomarker of SCCs underlying the significance of NAD+ metabolism in their pathogenesis. This finding agrees with preclinical and clinical studies that evidence a key role of NAD+ precursors in SCC prevention and therapy [10,12,13,14,15,16,29].
Furthermore, our analyses indicate that NAD+ metabolism can be an important source of SCC diagnostic biomarkers:
- (i)
- several differentially expressed NMRGs display good diagnostic power in discriminating tumors from control specimens. Specifically, we found 6 genes for HNSCC (AOX1, NMNAT2, ENPP3, NADK, CD38, and PARP1), 11 genes for LuSCC (AOX1, NNMT, NMNAT2, NMNAT3, ENPP2, ENPP3, NMRK2, NADSYN1, SIRT1, CD38, and PARP1) and 11 genes for CeSCC (AOX1, NMNAT3, ENPP1, ENPP2, ENPP3, NMRK2, PNP, NADSYN1, SIRT1, SIRT3, and CD38);
- (ii)
- three differentially-expressed NMRGs can be considered relevant SCC-type specific biomarkers;
- (iii)
- specific NMRG signatures display high diagnostic power for several clinical-pathological characteristics.
The identification of these biomarkers could also give insight into common or specific pathogenetic mechanisms. In fact, most differentially expressed NMRG biomarkers are common for two or three SCCs. AOX1, ENPP3, and NMRK2 were down-modulated in all analyzed tumor specimens, whereas PARP1 was up-regulated. AOX1 down-regulation in all SCCs underlines its potential importance in SCC pathogenesis. AOX1 encodes aldehyde oxidase 1 that is down-regulated in several tumors mainly as a consequence of hypermethylation [30,31,32]. This gene is implicated in the AKT pathway as well as NAD+ catabolism. For instance, decreased AOX1 activity can allow the accumulation of the MNAM catabolite. Notably, MNAM is metabolically active and can regulate posttranslational protein acetylation through Sirt1 modulation [33]. PARP1 up-regulation is a common feature of analyzed SCC. The enzyme has an important role in the repair of single-strand breaks, the most common type of DNA damage, and is a well-established therapeutic target for several tumors, including HNSCC. PARP inhibitors increase DNA damage, enhance immune priming, and induce adaptive upregulation of PD-L1 expression [34]. ENPP3 and NMRK2 encode enzymes that catalyze the biosynthesis of NAM mononucleotide (NAMN). These enzymes are up-regulated in colorectal and renal cancers representing specific biomarkers and therapeutic targets [35,36,37]. Thus, ENPP3 and NMRK2 down-regulation in all analyzed SCCs can strengthen the role of NAM replenishment in SCC prevention. Significant down-regulation of AOX1 and ENPP3 and up-regulation of PARP1 are also observed in cutaneous SCC (data from GSE datasets). Data regarding NMRK2 are not available. Therefore, the common modulation of these three genes can play a key role in SCC pathogenesis.
Between differentially expressed NMRGs, NADK up-regulation resulted in an HNSCC-specific diagnostic biomarker. NADK up-regulation can be due to gene mutations or activated oncogenic signaling [38,39]. NADK catalyzes the phosphorylation of NAD+ to NADP+ using ATP. The reduced form NADPH is high in proliferating tumor cells and acts as a cofactor for the synthesis of macromolecules as well as ROS scavengers [39]. Thionicotinamide and other NAM analogs are able to inhibit NADK by targeting its NAD+ binding site. They sensitize cells to chemotherapeutic agents by increasing ROS levels and inhibiting NADPH-dependent synthetic pathways [40].
NNMT down-regulation resulted in a LuSCC-specific diagnostic biomarker. NNMT is an intracellular methyltransferase that catalyzes N-methylation of NAM to form MNAM, in which S-adenosyl-L-methionine (SAM) is the methyl donor. MNAM is eventually excreted from the body. A growing body of evidence indicates that, beyond clearance of excess vitamin B3, NNMT is implicated in the regulation of multiple metabolic pathways in tumor cells by remodeling cellular epigenetic states and generating active metabolites. As NNMT has been found up- or down-regulated in different tumors, it seems to play a complex role in cancer progression and function in a tissue-specific manner [33,41,42,43]. The observed low expression of NNMT in LuSCC TCGA samples can induce an unbalance of NAM and SAM levels and, in turn, affect NAD+-dependent redox reactions as well as the regulation of the epigenetic landscape. For instance, the knockdown of NNMT in tumor cell lines increases the SAM/SAH ratio and global H3K9 and H3K27 trimethylation. Other molecules in addition to histones can be differentially methylated by changes in NNMT expression and SAM levels [41].
ENPP1 down-regulation resulted in a CeSCC-specific diagnostic biomarker. ENPP1 participates in the hydrolysis of different purine nucleotides in several processes, is frequently overexpressed in tumors, and is associated with poor prognosis and survival. ENPP1 promotes an immunosuppressive tumor microenvironment by the imbalance of ATP/adenosine and impairs the STING (stimulator of interferon genes) pathway immune response by the hydrolysis of the effector cGMP–AMP [44]. Thus, ENPP1 down-regulation can be unfavorable for creating an immunosuppressive landscape in CeSCC but could foster a strong interferon-mediated immune response.
Although further in vitro and in vivo experiments will be needed, AOX1 can be a potential common therapeutic target for SCC treatment, whereas NADK, NNMT, and ENPP1 can be for HNSCC, LuSCC, and CeSCC, respectively.
The current therapeutic SCC treatments are mostly based on the TNM staging system classification, leading to quite homogeneous treatment options for patients. Our bioinformatic analyses identified specific NMRG signatures that display high diagnostic power for discriminating patients on the basis of several clinical-pathological characteristics such as stage, grade, or HPV infection. Thus, the validation of these signatures may be helpful for diagnosis and personalized treatments.
The manipulation of NAD+ bioavailability represents a promising therapeutic strategy [10,12,29]. Preclinical studies indicated that NAM administration is tumor suppressive by disrupting several processes such as proliferation, apoptosis, invasion, and metastasis. Moreover, NAM administration can re-establish sensitivity to therapy in chemoresistant forms, inhibit T cell exhaustion, and increase T cell differentiation, and have important implications in immunotherapy [12,26]. The role of NAD+ in immunomodulation is context- and signaling-pathway-specific [26]. Our bioinformatic analyses indicate a potential SCC-type specific role of NMRGs in the tumor immune microenvironment changes. Indeed, the correlation between NMRG levels and TII cells or suppressive immune milieu is mainly observed in HNSCC samples. The lowest association is observed in CeSCCs.
Furthermore, the evaluation of the overall survival, based on NMRG expression levels in patients from the TCGA dataset, identified potential prognostic biomarkers or therapeutic targets. High-risk HNSCC patients are characterized by high levels of NNMT, NAMPT, or PNP. Notably, a signature based on these three genes displays good prognostic power. NNMT and NAMPT levels positively correlated with TII cells in the microenvironment, different from PNP. An NNMT increase is significantly associated with poor prognosis and immune suppressive microenvironment in many tumors [45]. We found that the high-risk group with high NNMT levels displays a significant increase in PD-1 and PD-L1. Also, NAMPT up-regulation is correlated with unfavorable overall survival in several tumors. NAMPT-mediated signaling plays a key role in tumor progression by modulating proliferation, cell plasticity, cytokine secretion, angiogenesis, metastasis, and in microenvironment modifications [46]. Indeed, NAMPT drives INFγ-induced PD-L1 expression and induces tumor immune evasion in a CD8+ T cell-dependent manner [28]. Moreover, NAMPT overexpression effects can also confer chemoresistance to anticancer drugs [46]. In keeping with the literature data, we found that the high-risk group of patients with high NAMPT levels shows a significant increase in PD-L1. The high-risk group with high PNP expression displays decreased levels of PD-1 and a slight increase of PD-L1. Up to now, data concerning an association between PNP increase and tumor survival have not been reported. However, the enzyme purine nucleoside phosphorylase may play a role in cancer chemoresistance by catalyzing the degradation of potentially cytotoxic purine analogs [47].
High-risk LuSCC patients are characterized by low levels of NADSYN1. Its levels negatively correlated with TII cells and no significant difference in PD-1 or PD-L1 expression was observed between high- and low-risk groups. Up to now, no data have been reported regarding NADSYN1 and tumor survival. NAD synthetase is an enzyme for NAD+ biosynthesis from tryptophane and, thus, is involved in NAD+ replenishment. Notably, NAM administration is able to suppress lung tumor formation in animal models [12].
High-risk CeSCC patients are characterized by high levels of AOX1 and NMNAT1. Of note, a signature based on these two NMRGs displays a good prognostic power. The expression level of AOX1 and NMNAT1 correlates with the infiltration of a few TII cell types. The high-risk group with high AOX1 levels displays a significant increase in PD-1 expression. No significant difference in PD-1 or PD-L1 expression was observed between high- and low-risk groups expressing NMNAT1. High levels of AOX1 are associated with better prognosis of bladder, renal, and pancreatic cancers [31,39], whereas high NMNAT1 expression is associated with poor survival in cancer patients with hepatocellular carcinoma [48]. Although NNMT1, NAMPT, and AOX1 are well-studied enzymes in several tumors, PNP, NADSYN, and NMNAT1 stand out as additional understudied enzymes that justify further validation as therapeutic targets.
5. Conclusions
Our study is focused on the bioinformatic investigation of an NMRG profile as a source of potential SCC biomarkers and therapeutic targets.
Beyond the well-established tumor marker PARP1, AOX1 can be a potential common therapeutic target for SCC treatment. The hypermethylation of the gene suggests that epigenetic drugs can be a promising tool to be assayed. The down-regulation of ENPP3 and NMRK2, found in all SCCs, can reduce NMAN bioavailability. Our findings agree with SCC preclinical and clinical studies using NAD+ precursors underlying their importance as a drug for chemoprevention and adjuvant therapy. Furthermore, the use of NAM analogs can be a promising strategy for synergizing with chemotherapy by NADK inhibition.
Therefore, future experimental studies concerning identified NMRGs and their validation on different populations may provide additional insights into pathogenetic mechanisms as well as improve the therapeutic choice.
Supplementary Materials
The following supporting information can be downloaded at: https://www.mdpi.com/article/10.3390/cancers16020309/s1, Figure S1. NMRGs with significant differential gene expression levels in age and gender groups of SCC patients. Violin plots show the significant differential expression of NMRGs between age-related groups (A) and (B) gender groups in HNSCC (red); LuSCC (blue) and CeSCC (green). HNSCC: head and neck squamous cell carcinoma; LuSCC: lung squamous cell carcinoma; CeSCC: cervix squamous cell carcinoma. Figure S2. Modulation of different NMRG expressions based on SCC types. HNSCC: head and neck squamous cell carcinoma; LuSCC: lung squamous cell carcinoma; CeSCC: cervix squamous cell carcinoma. Figure S3. AUC comparison for the 18 NMRGs based on SCC type. HNSCC: head and neck squamous cell carcinoma; LuSCC: lung squamous cell carcinoma; CeSCC: cervix squamous cell carcinoma. Figure S4. Overall survival for HNSCCs and CeSCCs using a combination of specific NMRGs signatures increased the prognostic significance with respect to single NMRGs. HNSCC: head and neck squamous cell carcinoma; CeSCC: cervix squamous cell carcinoma. Table S1. Clinicopathologic characteristics of patients. Table S2. Receiver Operating Characteristic (ROC) analysis on Head and Neck squamous cell carcinoma (HNSCC) specimens. Table S3. Receiver Operating Characteristic (ROC) analysis on Lung squamous cell carcinoma (LuSCC) specimens. Table S4. Receiver Operating Characteristic (ROC) analysis on Cervix squamous cell carcinoma (CeSCC) specimens. Table S5. Survival data.
Author Contributions
Y.A.M.: Data curation, Formal Analysis, Investigation, and Writing—review and editing; D.A.: Data curation, Formal Analysis, and Investigation, Writing—review and editing; E.D.: Conceptualization, Data curation, Formal Analysis, Funding acquisition, Investigation, Project administration, Resources, Supervision, Visualization, and Writing—original draft. The work reported in the paper has been performed by the authors unless clearly specified in the text. All Authors have agreed both to be personally accountable for the author’s own contributions and to ensure that questions related to the accuracy or integrity of any part of the work, even ones in which the author was not personally involved, are appropriately investigated, resolved, and the resolution documented in the literature. All authors have read and agreed to the published version of the manuscript.
Funding
This research was partially supported by grants from the Italian Ministry of Health (Ricerca finalizzata RF2016-02362541) (E.D.). Y.A.M. is the recipient of a Fondazione Veronesi fellowship.
Institutional Review Board Statement
Not applicable. All data analyzed in the present study come from public databases, therefore no ethical approval nor specific consent is necessary.
Informed Consent Statement
Not applicable.
Data Availability Statement
The datasets generated and/or analyzed during the current study are available in the TCGA and GTEx repositories, available at links clearly indicated in the manuscript.
Conflicts of Interest
The authors declare that they have no competing interests.
List of Abbreviations
| SCC | Squamous cell carcinoma |
| HNSCC | Head and Neck Squamous cell carcinoma |
| LuSCC | Head and Neck Squamous cell carcinoma |
| CeSCC | cervix Squamous cell carcinoma |
| HPV | human papillomavirus |
| NSCLC | non-small cell lung cancer |
| NAD+ | Nicotinamide adenine dinucleotide |
| NAM | nicotinamide |
| NMN | nicotinamide mononucleotide |
| NR | nicotinamide riboside |
| NMRG | NAD+ metabolism-related gene |
| TCGA | The Cancer Genome Atlas |
| GTEx | Genotype-Tissue Expression |
| ROC | Receiver Operating Characteristic |
| AUC | Area under the curve |
| PCA | Principal component analysis |
| KIRC | Kidney Renal clear cell Carcinoma |
| GBM | Glioblastoma |
| SARC | Sarcoma |
| TIMER | Tumor IMmune Estimation Resource |
| OS | overall survival |
| SAM | S-adenosyl-L-methionine |
| ATP | adenosine triphosphate |
| NAMPT | NAM phosphoribosyltransferase |
| NAMN | NAM mononucleotide |
| NMNATs | NMN adenyltransferases |
| NADK | NAD kinase |
| cADPRS | cyclic ADP-ribose synthase |
| PARPs | Poly-ADP-ribose-polymerases |
| SIRT | Sirtuins |
| Sub | substrates |
| MNA | 1-methyl-NAM |
| NNMT | NAM-N-methyltransferase |
| 2-Pyr | l-methyl-2-pyridone-5-carboxamide |
| 4-Pyr | l-methyl-4-pyridone- 5-carboxamide |
References
- Yan, W.; Wistuba, I.I.; Emmert-buck, M.R.; Erickson, H.S. SCC Highlights and Insights. Am. J. Cancer Res. 2011, 1, 275–300. [Google Scholar]
- Mäkitie, A.A.; Agaimy, A.; Almangush, A. Insight into Classification and Risk Stratification of Head and Neck Squamous Cell Carcinoma in Era of Emerging Biomarkers with Focus on Histopathologic Parameters. Cancers 2022, 14, 5514. [Google Scholar] [CrossRef]
- Guan, Y.; Wang, G.; Fails, D.; Nagarajan, P.; Ge, Y. Unraveling Cancer Lineage Drivers in Squamous Cell Carcinomas. Pharmacol. Ther. 2020, 206, 107448. [Google Scholar] [CrossRef]
- Campos-Parra, A.D.; Pérez-Quintanilla, M.; Martínez-Gutierrez, A.D.; Pérez-Montiel, D.; Coronel-Martínez, J.; Millan-Catalan, O.; De León, D.C.; Pérez-Plasencia, C. Molecular Differences between Squamous Cell Carcinoma and Adenocarcinoma Cervical Cancer Subtypes: Potential Prognostic Biomarkers. Curr. Oncol. 2022, 29, 4689–4702. [Google Scholar] [CrossRef]
- Solomon, B.; Young, R.J.; Rischin, D. Head and Neck Squamous Cell Carcinoma: Genomics and Emerging Biomarkers for Immunomodulatory Cancer Treatments. Semin. Cancer Biol. 2018, 52, 228–240. [Google Scholar] [CrossRef]
- Patel, R.; Chang, A.L.S. Immune Checkpoint Inhibitors for Treating Advanced Cutaneous Squamous Cell Carcinoma. Am. J. Clin. Dermatol. 2019, 20, 477–482. [Google Scholar] [CrossRef]
- Dotto, G.P. Multifocal Epithelial Tumors and Field Cancerization: Stroma as a Primary Determinant. J. Clin. Investig. 2014, 124, 1446–1453. [Google Scholar] [CrossRef]
- Dotto, G.P.; Rustgi, A.K. Squamous Cell Cancers: A Unified Perspective on Biology and Genetics. Cancer Cell 2016, 29, 622–637. [Google Scholar] [CrossRef]
- Hanahan, D.; Weinberg, R.A. Hallmarks of Cancer: The next Generation. Cell 2011, 144, 646–674. [Google Scholar] [CrossRef]
- Fania, L.; Mazzanti, C.; Campione, E.; Candi, E.; Abeni, D.; Dellambra, E. Role of Nicotinamide in Genomic Stability and Skin Cancer Chemoprevention. Int. J. Mol. Sci. 2019, 20, 5946. [Google Scholar] [CrossRef]
- Xie, N.; Zhang, L.; Gao, W.; Huang, C.; Huber, P.E.; Zhou, X.; Li, C.; Shen, G.; Zou, B. NAD+ Metabolism: Pathophysiologic Mechanisms and Therapeutic Potential. Signal Transduct. Target. Ther. 2020, 5, 227. [Google Scholar] [CrossRef] [PubMed]
- Nikas, I.P.; Paschou, S.A.; Ryu, H.S. The Role of Nicotinamide in Cancer Chemoprevention and Therapy. Biomolecules 2020, 10, 477. [Google Scholar] [CrossRef] [PubMed]
- Chen, A.C.; Martin, A.J.; Choy, B.; Fernández-Peñas, P.; Dalziell, R.A.; McKenzie, C.A.; Scolyer, R.A.; Dhillon, H.M.; Vardy, J.L.; Kricker, A.; et al. A Phase 3 Randomized Trial of Nicotinamide for Skin-Cancer Chemoprevention. N. Engl. J. Med. 2015, 373, 1618–1626. [Google Scholar] [CrossRef] [PubMed]
- Drago, F.; Ciccarese, G.; Cogorno, L.; Calvi, C.; Marsano, L.A.; Parodi, A. Prevention of Non-Melanoma Skin Cancers with Nicotinamide in Transplant Recipients: A Case-Control Study. Eur. J. Dermatol. 2017, 27, 382–385. [Google Scholar] [CrossRef]
- Janssens, G.O.; Rademakers, S.E.; Terhaard, C.H.; Doornaert, P.A.; Bijl, H.P.; van den Ende, P.; Chin, A.; Marres, H.A.; de Bree, R.; van der Kogel, A.J.; et al. Accelerated Radiotherapy with Carbogen and Nicotinamide for Laryngeal Cancer: Results of a Phase III Randomized Trial. J. Clin. Oncol. 2012, 30, 1777–1783. [Google Scholar] [CrossRef] [PubMed]
- Janssens, G.O.; Terhaard, C.H.; Doornaert, P.A.; Bijl, H.P.; van den Ende, P.; Chin, A.; Pop, L.A.; Kaanders, J.H. Acute Toxicity Profile and Compliance to Accelerated Radiotherapy plus Carbogen and Nicotinamide for Clinical Stage T2-4 Laryngeal Cancer: Results of a Phase III Randomized Trial. Int. J. Radiat. Oncol. Biol. Phys. 2012, 82, 532–538. [Google Scholar] [CrossRef]
- Li, T.; Fan, J.; Wang, B.; Traugh, N.; Chen, Q.; Liu, J.S.; Li, B.; Liu, X.S. TIMER: A Web Server for Comprehensive Analysis of Tumor-Infiltrating Immune Cells. Cancer Res. 2017, 77, e108–e110. [Google Scholar] [CrossRef] [PubMed]
- Li, B.; Severson, E.; Pignon, J.-C.; Zhao, H.; Li, T.; Novak, J.; Jiang, P.; Shen, H.; Aster, J.C.; Rodig, S.; et al. Comprehensive Analyses of Tumor Immunity: Implications for Cancer Immunotherapy. Genome Biol. 2016, 17, 174. [Google Scholar] [CrossRef]
- Li, T.; Fu, J.; Zeng, Z.; Cohen, D.; Li, J.; Chen, Q.; Li, B.; Liu, X.S. TIMER2.0 for Analysis of Tumor-Infiltrating Immune Cells. Nucleic Acids Res. 2020, 48, W509–W514. [Google Scholar] [CrossRef]
- Zhou, C.; Diao, P.; Wu, Y.; Wei, Z.; Jiang, L.; Zhang, W.; Li, Z.; Ye, J.; Song, X.; Wu, H.; et al. Development and Validation of a Seven-Immune-Feature-Based Prognostic Score for Oral Squamous Cell Carcinoma after Curative Resection. Int. J. Cancer 2020, 146, 1152–1163. [Google Scholar] [CrossRef]
- Chini, C.; Hogan, K.A.; Warner, G.M.; Tarragó, M.G.; Peclat, T.R.; Tchkonia, T.; Kirkland, J.L.; Chini, E. The NADase CD38 Is Induced by Factors Secreted from Senescent Cells Providing a Potential Link between Senescence and Age-Related Cellular NAD+ Decline. Biochem. Biophys. Res. Commun. 2019, 513, 486–493. [Google Scholar] [CrossRef] [PubMed]
- Covarrubias, A.J.; Kale, A.; Perrone, R.; Lopez-Dominguez, J.A.; Pisco, A.O.; Kasler, H.G.; Schmidt, M.S.; Heckenbach, I.; Kwok, R.; Wiley, C.D.; et al. Senescent Cells Promote Tissue NAD+ Decline during Ageing via the Activation of CD38+ Macrophages. Nat. Metab. 2020, 2, 1265–1283. [Google Scholar] [CrossRef] [PubMed]
- Johnson, D.E.; Burtness, B.; Leemans, C.R.; Lui, V.W.Y.; Bauman, J.E.; Grandis, J.R. Head and Neck Squamous Cell Carcinoma. Nat. Rev. Dis. Prim. 2020, 6, 92. [Google Scholar] [CrossRef] [PubMed]
- Lei, Q.; Wang, D.; Sun, K.; Wang, L.; Zhang, Y. Resistance Mechanisms of Anti-PD1/PDL1 Therapy in Solid Tumors. Front. Cell Dev. Biol. 2020, 8, 672. [Google Scholar] [CrossRef] [PubMed]
- Lim, Y.Z.; South, A.P. Tumour-Stroma Crosstalk in the Development of Squamous Cell Carcinoma. Int. J. Biochem. Cell Biol. 2014, 53, 450–458. [Google Scholar] [CrossRef] [PubMed]
- Fang, J.; Chen, W.; Hou, P.; Liu, Z.; Zuo, M.; Liu, S.; Feng, C.; Han, Y.; Li, P.; Shi, Y.; et al. NAD+ Metabolism-Based Immunoregulation and Therapeutic Potential. Cell Biosci. 2023, 13, 81. [Google Scholar] [CrossRef]
- Wu, M.; Huang, Q.; Xie, Y.; Wu, X.; Ma, H.; Zhang, Y.; Xia, Y. Improvement of the Anticancer Efficacy of PD-1/PD-L1 Blockade via Combination Therapy and PD-L1 Regulation; BioMed Central: London, UK, 2022; Volume 15, ISBN 1304502201. [Google Scholar]
- Lv, H.; Lv, G.; Chen, C.; Zong, Q.; Jiang, G.; Ye, D.; Cui, X.; He, Y.; Xiang, W.; Han, Q.; et al. NAD+ Metabolism Maintains Inducible PD-L1 Expression to Drive Tumor Immune Evasion. Cell Metab. 2021, 33, 110–127.e5. [Google Scholar] [CrossRef]
- Damian, D.L. Nicotinamide for Skin Cancer Chemoprevention. Australas. J. Dermatol. 2017, 58, 174–180. [Google Scholar] [CrossRef]
- Zhang, W.; Chai, W.; Zhu, Z.; Li, X. Aldehyde Oxidase 1 Promoted the Occurrence and Development of Colorectal Cancer by Up-Regulation of Expression of CD133. Int. Immunopharmacol. 2020, 85, 106618. [Google Scholar] [CrossRef]
- Xiong, L.; Feng, Y.; Hu, W.; Tan, J.; Li, S.; Wang, H. Expression of AOX1 Predicts Prognosis of Clear Cell Renal Cell Carcinoma. Front. Genet. 2021, 12, 683173. [Google Scholar] [CrossRef]
- Vantaku, V.; Putluri, V.; Bader, D.A.; Maity, S.; Ma, J.; Arnold, J.M.; Rajapakshe, K.; Donepudi, S.R.; von Rundstedt, F.-C.; Devarakonda, V.; et al. Epigenetic Loss of AOX1 Expression via EZH2 Leads to Metabolic Deregulations and Promotes Bladder Cancer Progression. Oncogene 2020, 39, 6265–6285. [Google Scholar] [CrossRef]
- Wang, W.; Yang, C.; Wang, T.; Deng, H. Complex Roles of Nicotinamide N-Methyltransferase in Cancer Progression. Cell Death Dis. 2022, 13, 267. [Google Scholar] [CrossRef]
- Moutafi, M.; Economopoulou, P.; Rimm, D.; Psyrri, A. PARP Inhibitors in Head and Neck Cancer: Molecular Mechanisms, Preclinical and Clinical Data. Oral Oncol. 2021, 117, 105292. [Google Scholar] [CrossRef] [PubMed]
- Doñate, F.; Raitano, A.; Morrison, K.; An, Z.; Capo, L.; Aviña, H.; Karki, S.; Morrison, K.; Yang, P.; Ou, J.; et al. AGS16F Is a Novel Antibody Drug Conjugate Directed against ENPP3 for the Treatment of Renal Cell Carcinoma. Clin. Cancer Res. 2016, 22, 1989–1999. [Google Scholar] [CrossRef] [PubMed]
- Ullah, S.; El-Gamal, M.I.; Zaib, S.; Anbar, H.S.; Zaraei, S.O.; Sbenati, R.M.; Pelletier, J.; Sévigny, J.; Oh, C.H.; Iqbal, J. Synthesis, Biological Evaluation, and Docking Studies of New Pyrazole-Based Thiourea and Sulfonamide Derivatives as Inhibitors of Nucleotide Pyrophosphatase/Phosphodiesterase. Bioorg. Chem. 2020, 99, 103783. [Google Scholar] [CrossRef]
- Chen, Y.; Yang, L.; Lu, Y.; Liu, N.; Ma, W.; Fan, H.; Hu, Q.; Han, X.; Gan, W.; Li, D. Up-Regulation of NMRK2 Mediated by TFE3 Fusions Is the Key for Energy Metabolism Adaption of Xp11.2 Translocation Renal Cell Carcinoma. Cancer Lett. 2022, 538, 215689. [Google Scholar] [CrossRef]
- Tedeschi, P.M.; Bansal, N.; Kerrigan, J.E.; Abali, E.E.; Scotto, K.W.; Bertino, J.R. NAD+ Kinase as a Therapeutic Target in Cancer. Clin. Cancer Res. 2016, 22, 5189–5195. [Google Scholar] [CrossRef]
- Schild, T.; McReynolds, M.R.; Shea, C.; Low, V.; Schaffer, B.E.; Asara, J.M.; Piskounova, E.; Dephoure, N.; Rabinowitz, J.D.; Gomes, A.P.; et al. NADK Is Activated by Oncogenic Signaling to Sustain Pancreatic Ductal Adenocarcinoma. Cell Rep. 2021, 35, 109238. [Google Scholar] [CrossRef]
- Oka, S.I.; Titus, A.S.; Zablocki, D.; Sadoshima, J. Molecular Properties and Regulation of NAD+ Kinase (NADK). Redox Biol. 2023, 59, 102561. [Google Scholar] [CrossRef]
- Pissios, P. Nicotinamide N-Methyltransferase: More than a Vitamin B3 Clearance Enzyme. Trends Endocrinol. Metab. 2017, 28, 340–353. [Google Scholar] [CrossRef]
- Zhu, X.-J.; Lin, Y.-J.; Chen, W.; Wang, Y.-H.; Qiu, L.-Q.; Cai, C.-X.; Xiong, Q.; Chen, F.; Chen, L.-H.; Zhou, Q.; et al. Physiological Study on Association between Nicotinamide N-Methyltransferase Gene Polymorphisms and Hyperlipidemia. Biomed Res. Int. 2016, 2016, 7521942. [Google Scholar] [CrossRef] [PubMed]
- Campagna, R.; Pozzi, V.; Sartini, D.; Salvolini, E.; Brisigotti, V.; Molinelli, E.; Campanati, A.; Offidani, A.; Emanuelli, M. Beyond Nicotinamide Metabolism: Potential Role of Nicotinamide N-methyltransferase as a Biomarker in Skin Cancers. Cancers 2021, 13, 4943. [Google Scholar] [CrossRef] [PubMed]
- Ruiz-Fernández de Córdoba, B.; Martínez-Monge, R.; Lecanda, F. ENPP1 Immunobiology as a Therapeutic Target. Clin. Cancer Res. 2023, 29, 2184–2193. [Google Scholar] [CrossRef]
- Liu, W.; Zhu, M.; Li, X.; Er, L.; Li, S. NNMT Is an Immune-Related Prognostic Biomarker That Modulates the Tumor Microenvironment in Pan-Cancer. Dis. Markers 2023, 2023, 9226712. [Google Scholar] [CrossRef] [PubMed]
- Lin, T. Updated Functional Roles of NAMPT in Carcinogenesis and Therapeutic Niches. Cancers 2022, 14, 2059. [Google Scholar] [CrossRef]
- Navas, L.E.; Carnero, A. NAD+ Metabolism, Stemness, the Immune Response, and Cancer. Signal Transduct. Target. Ther. 2021, 6, 2. [Google Scholar] [CrossRef]
- Nagy, Á.; Lánczky, A.; Menyhárt, O.; Győrffy, B. Validation of MiRNA Prognostic Power in Hepatocellular Carcinoma Using Expression Data of Independent Datasets. Sci. Rep. 2018, 8, 9227. [Google Scholar] [CrossRef]


Disclaimer/Publisher’s Note: The statements, opinions and data contained in all publications are solely those of the individual author(s) and contributor(s) and not of MDPI and/or the editor(s). MDPI and/or the editor(s) disclaim responsibility for any injury to people or property resulting from any ideas, methods, instructions or products referred to in the content. |
© 2024 by the authors. Licensee MDPI, Basel, Switzerland. This article is an open access article distributed under the terms and conditions of the Creative Commons Attribution (CC BY) license (https://creativecommons.org/licenses/by/4.0/).