


Internet of Things-Assisted Smart Skin Cancer Detection Using Metaheuristics with Deep Learning Model
 ,
,
Abstract
:Simple Summary
Abstract
1. Introduction
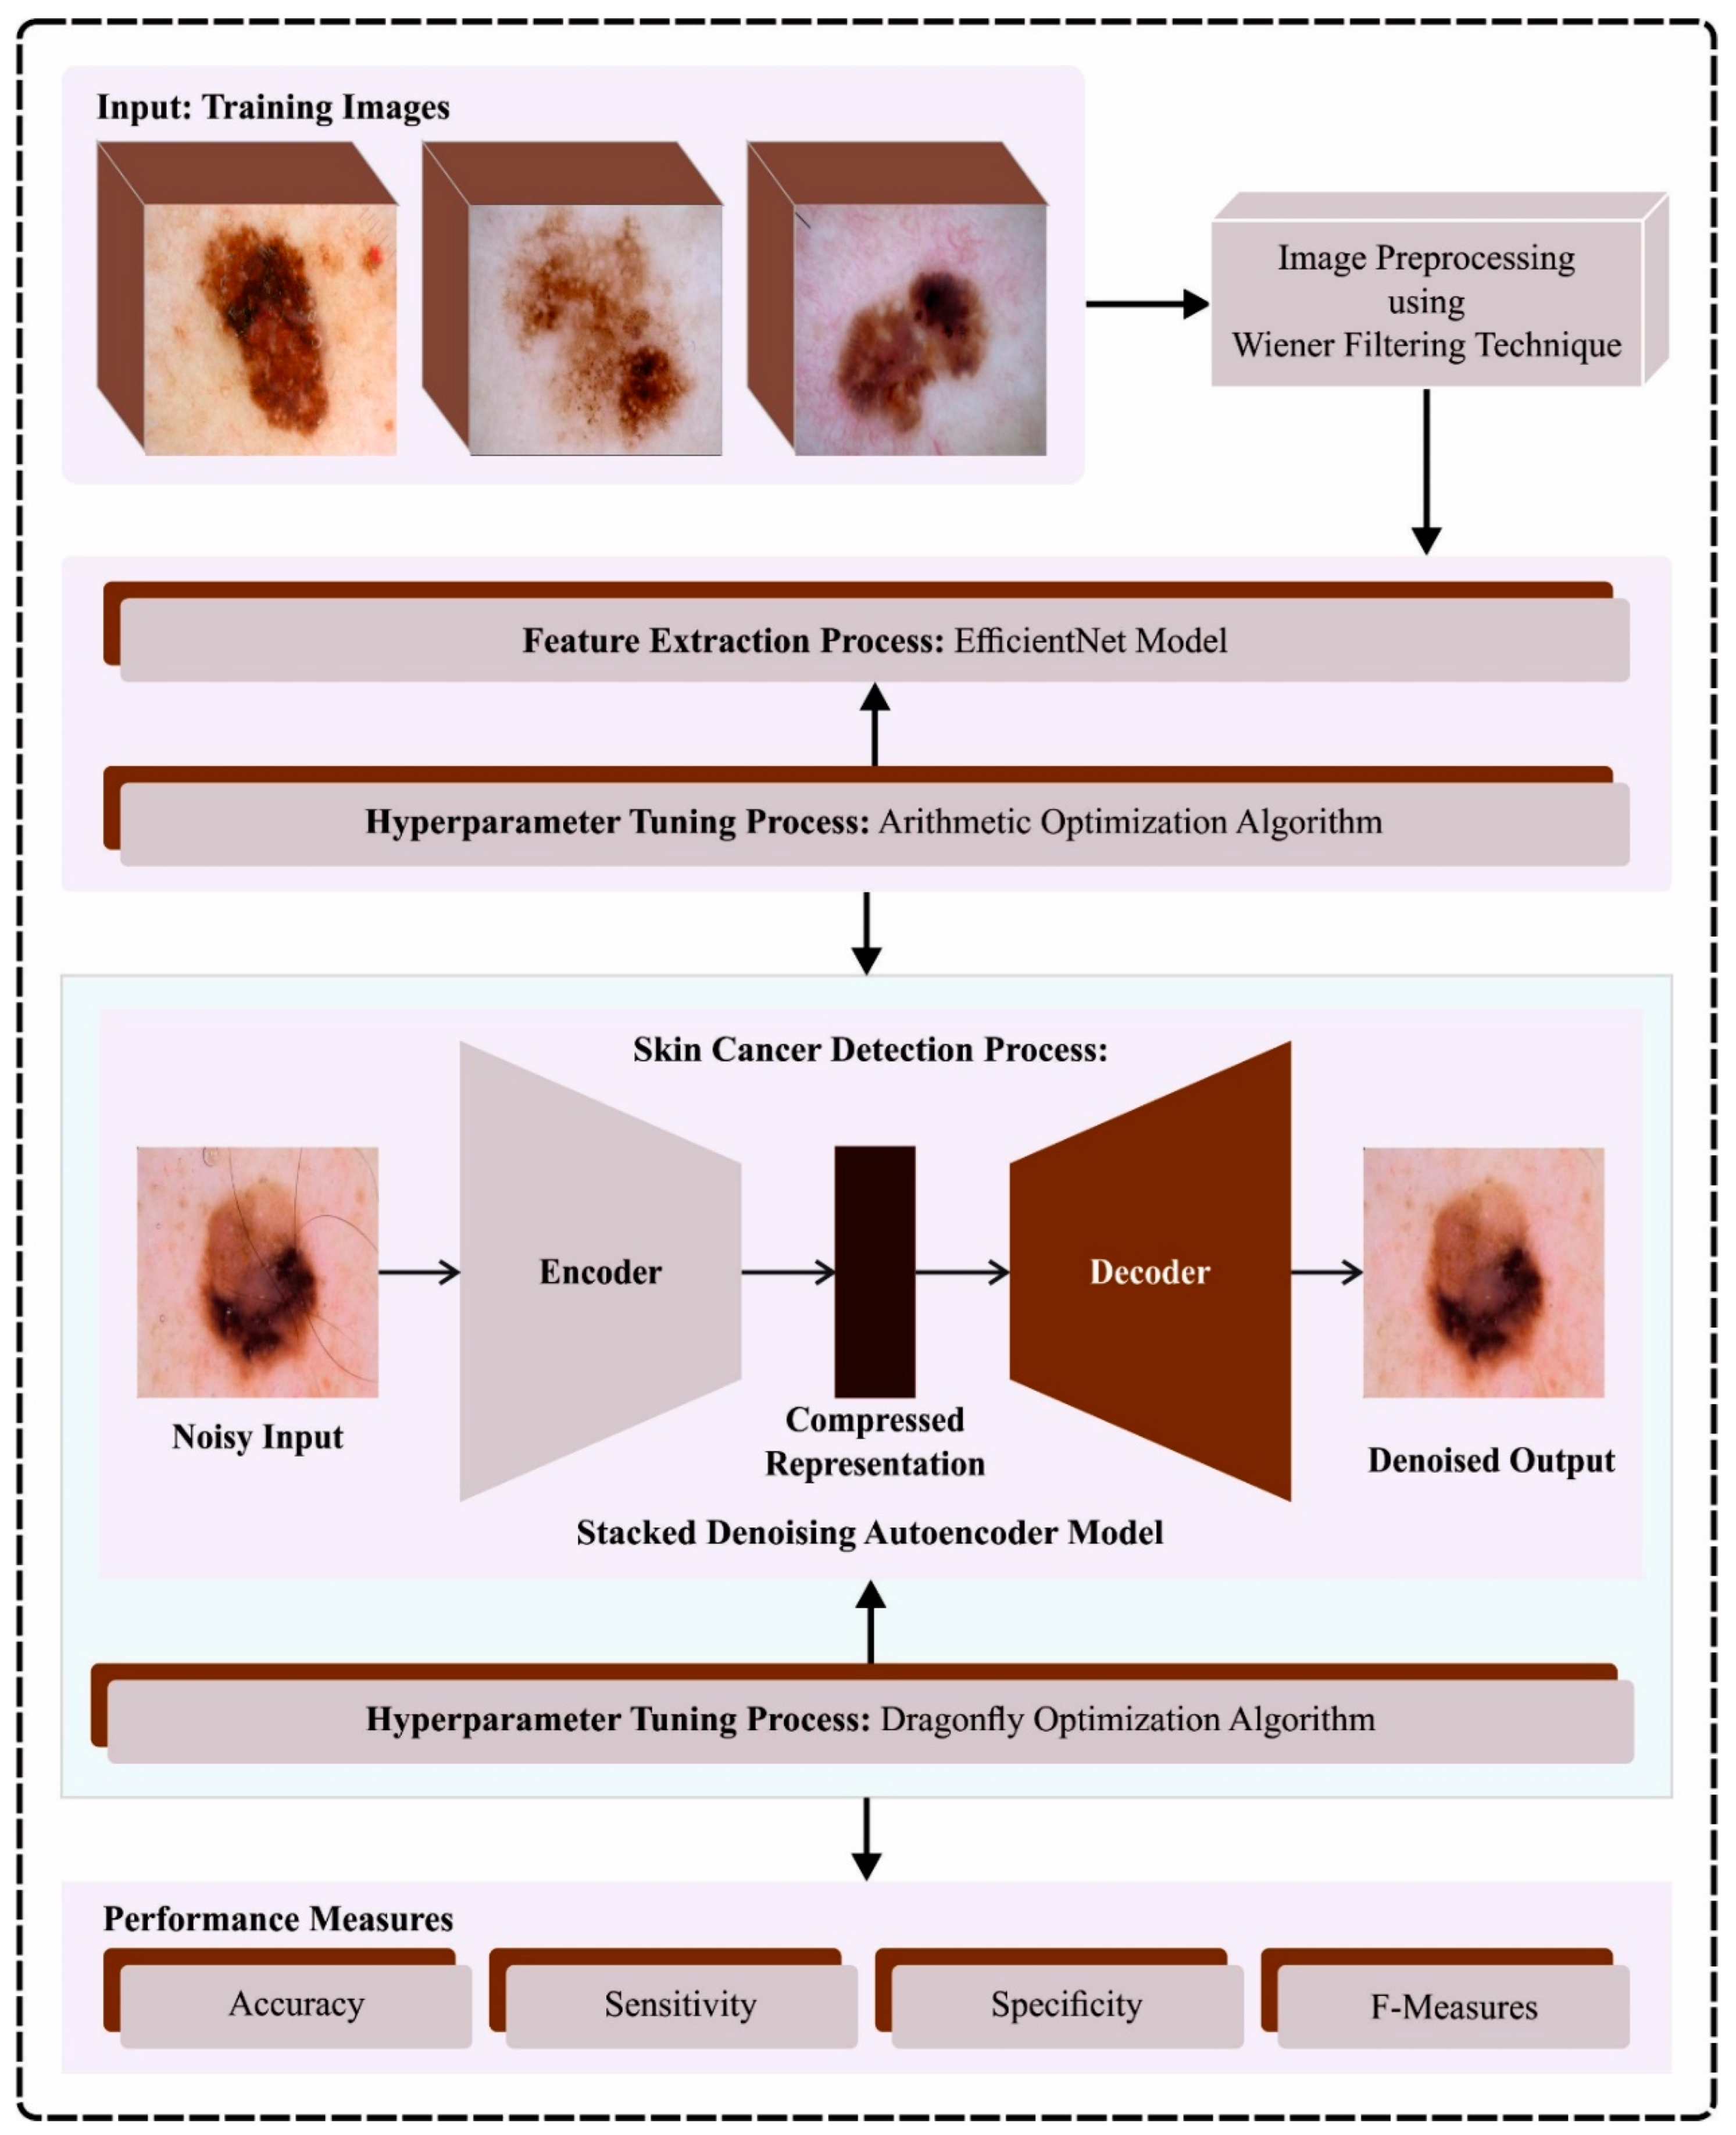
- Develop an automated ODL-SCDC technique comprising WF-based preprocessing, AOA with EfficientNet-based feature extraction, SDAE classifier, and DFA-based hyperparameter tuning. To the best of our knowledge, the proposed ODL-SCDC technique never existed in the literature.
- Propose AOA with the EfficientNet model for feature extraction, a critical aspect of skin cancer classification. The AOA-based fine-tuning process is crucial for optimizing the performance of the classification model.
- Present an SDAE classifier for skin cancer classification and DFA is employed for optimal hyperparameter selection of the SDAE model. Hyperparameter optimization of the SDAE model using DFA using cross-validation helps to boost the predictive outcome of the proposed model for unseen data.
2. Related Works
3. The Proposed Model
3.1. Image Preprocessing
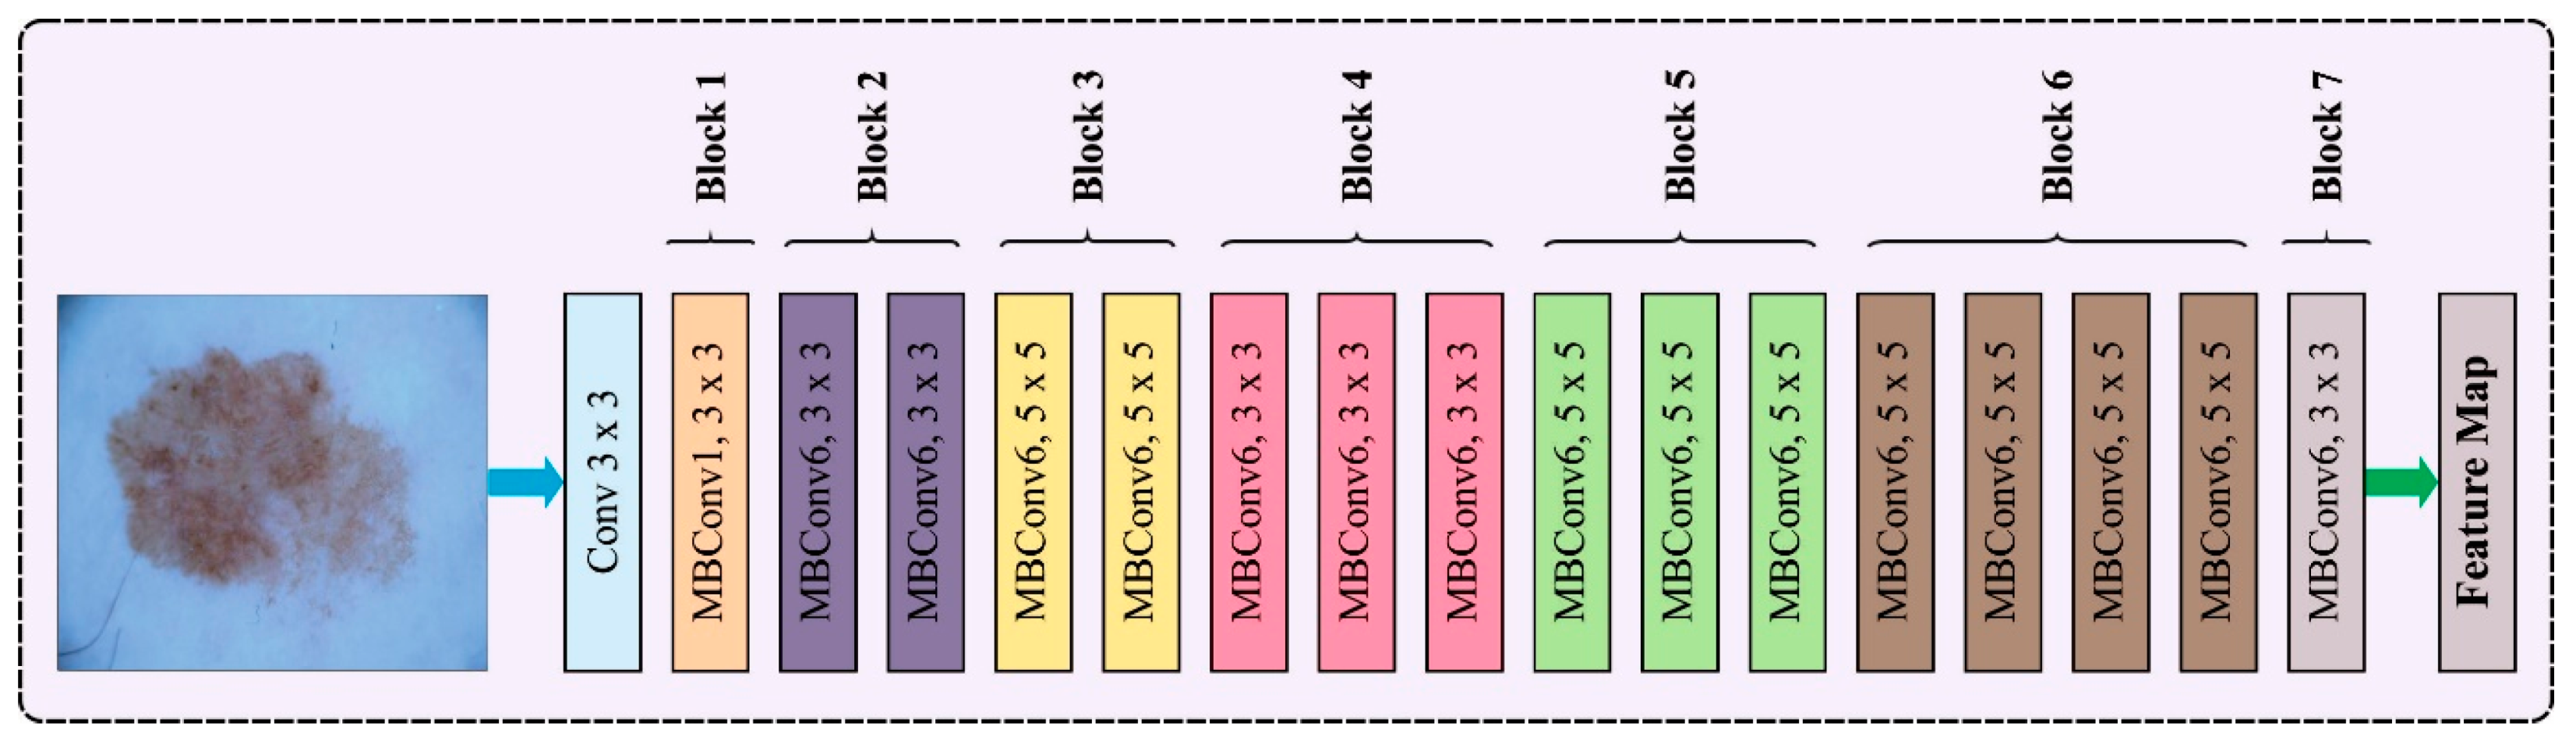
3.2. Feature Extraction Using EfficientNet Model

3.3. Hyperparameter Tuning Using AOA
3.4. Skin Cancer Detection Using Optimal SDAE Model
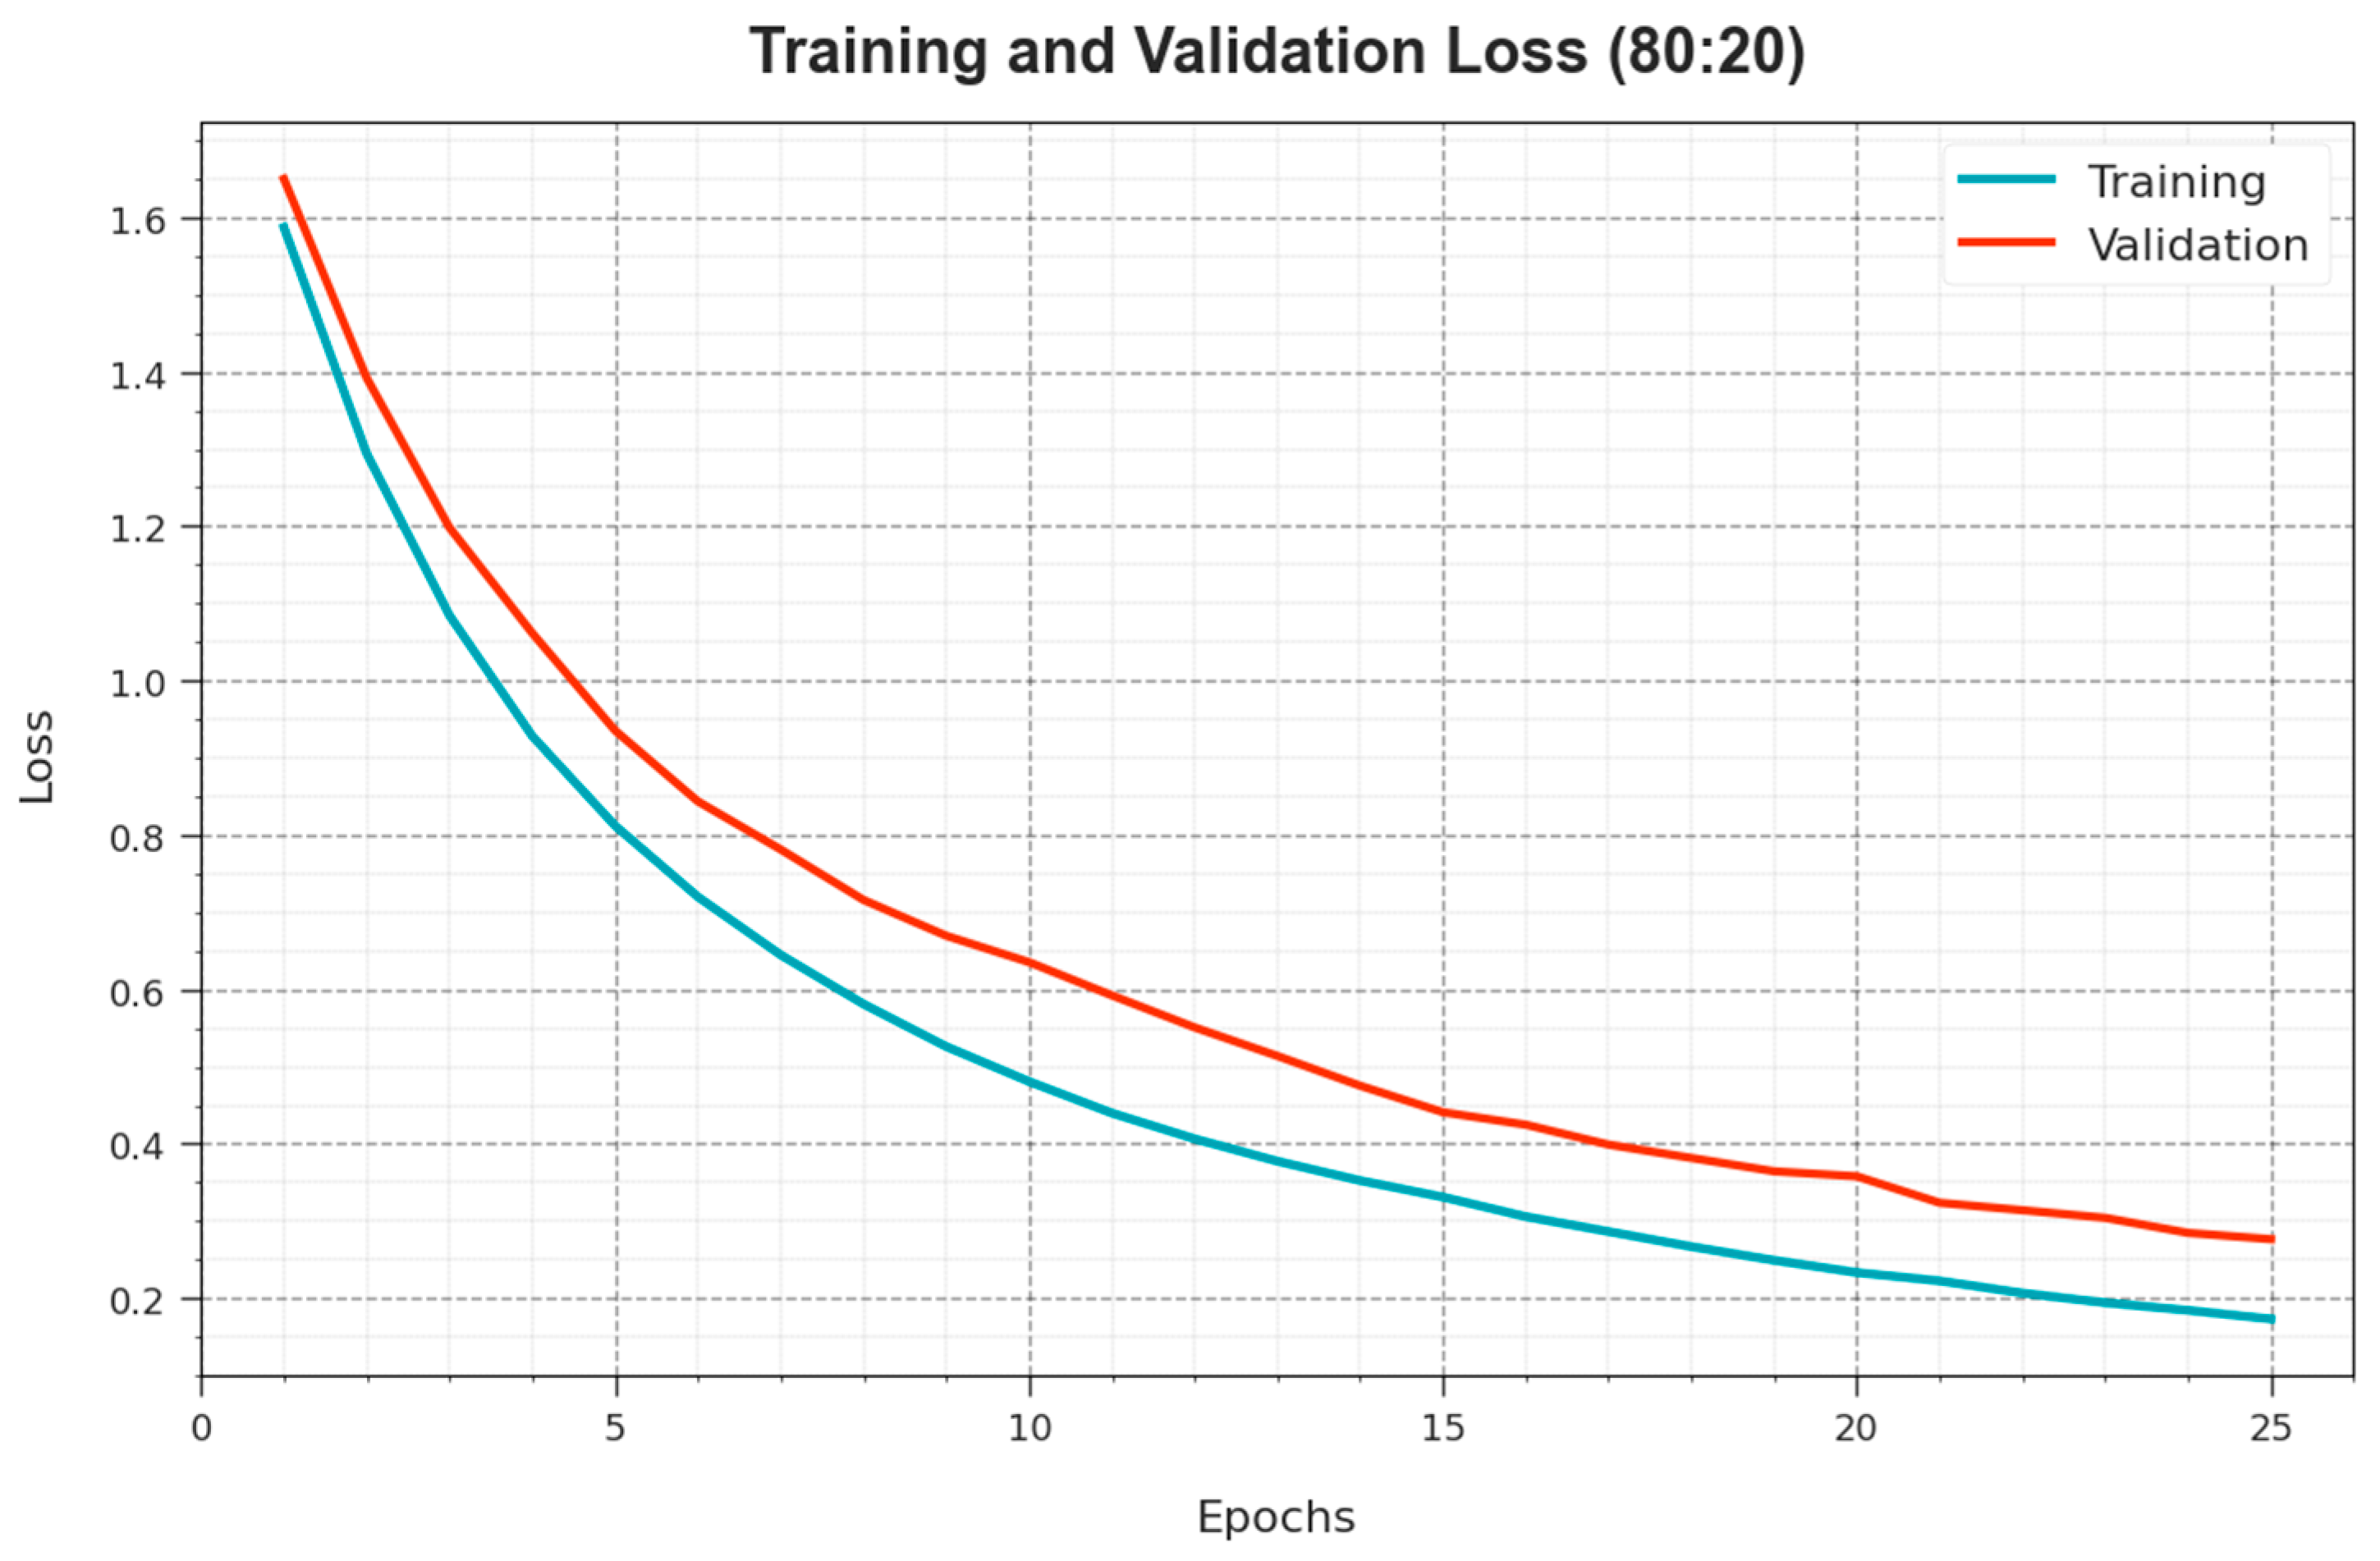
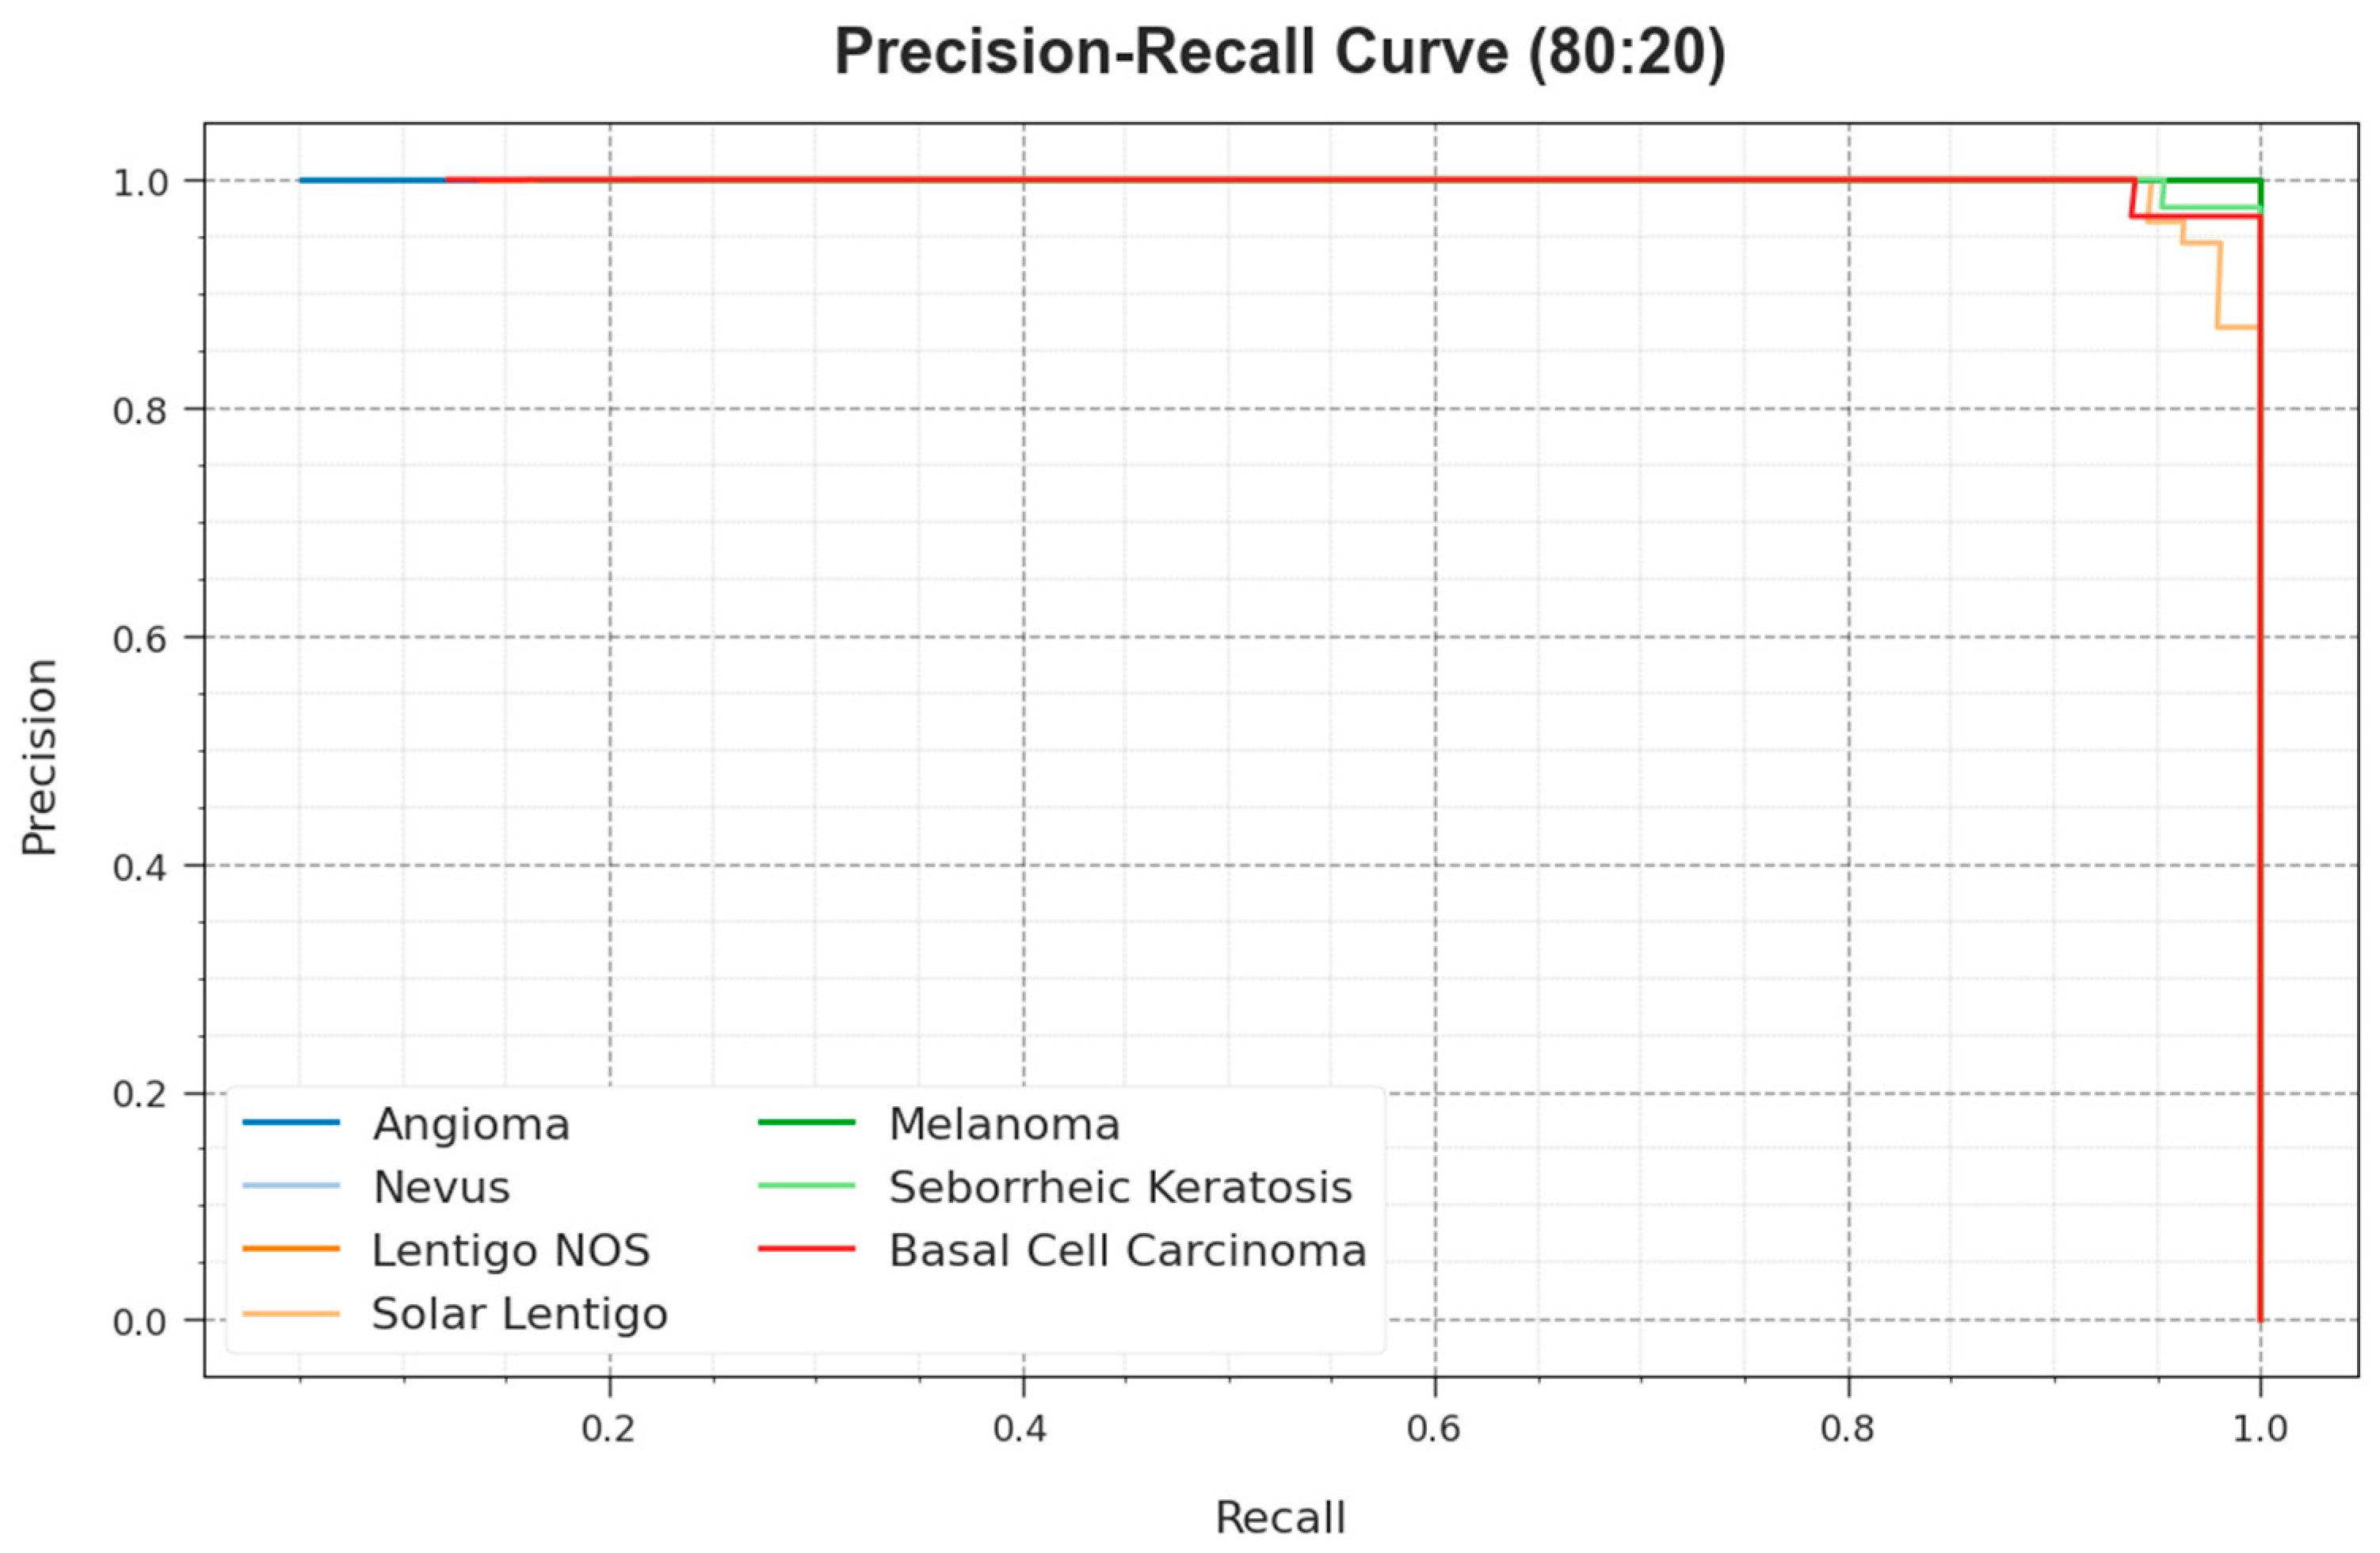
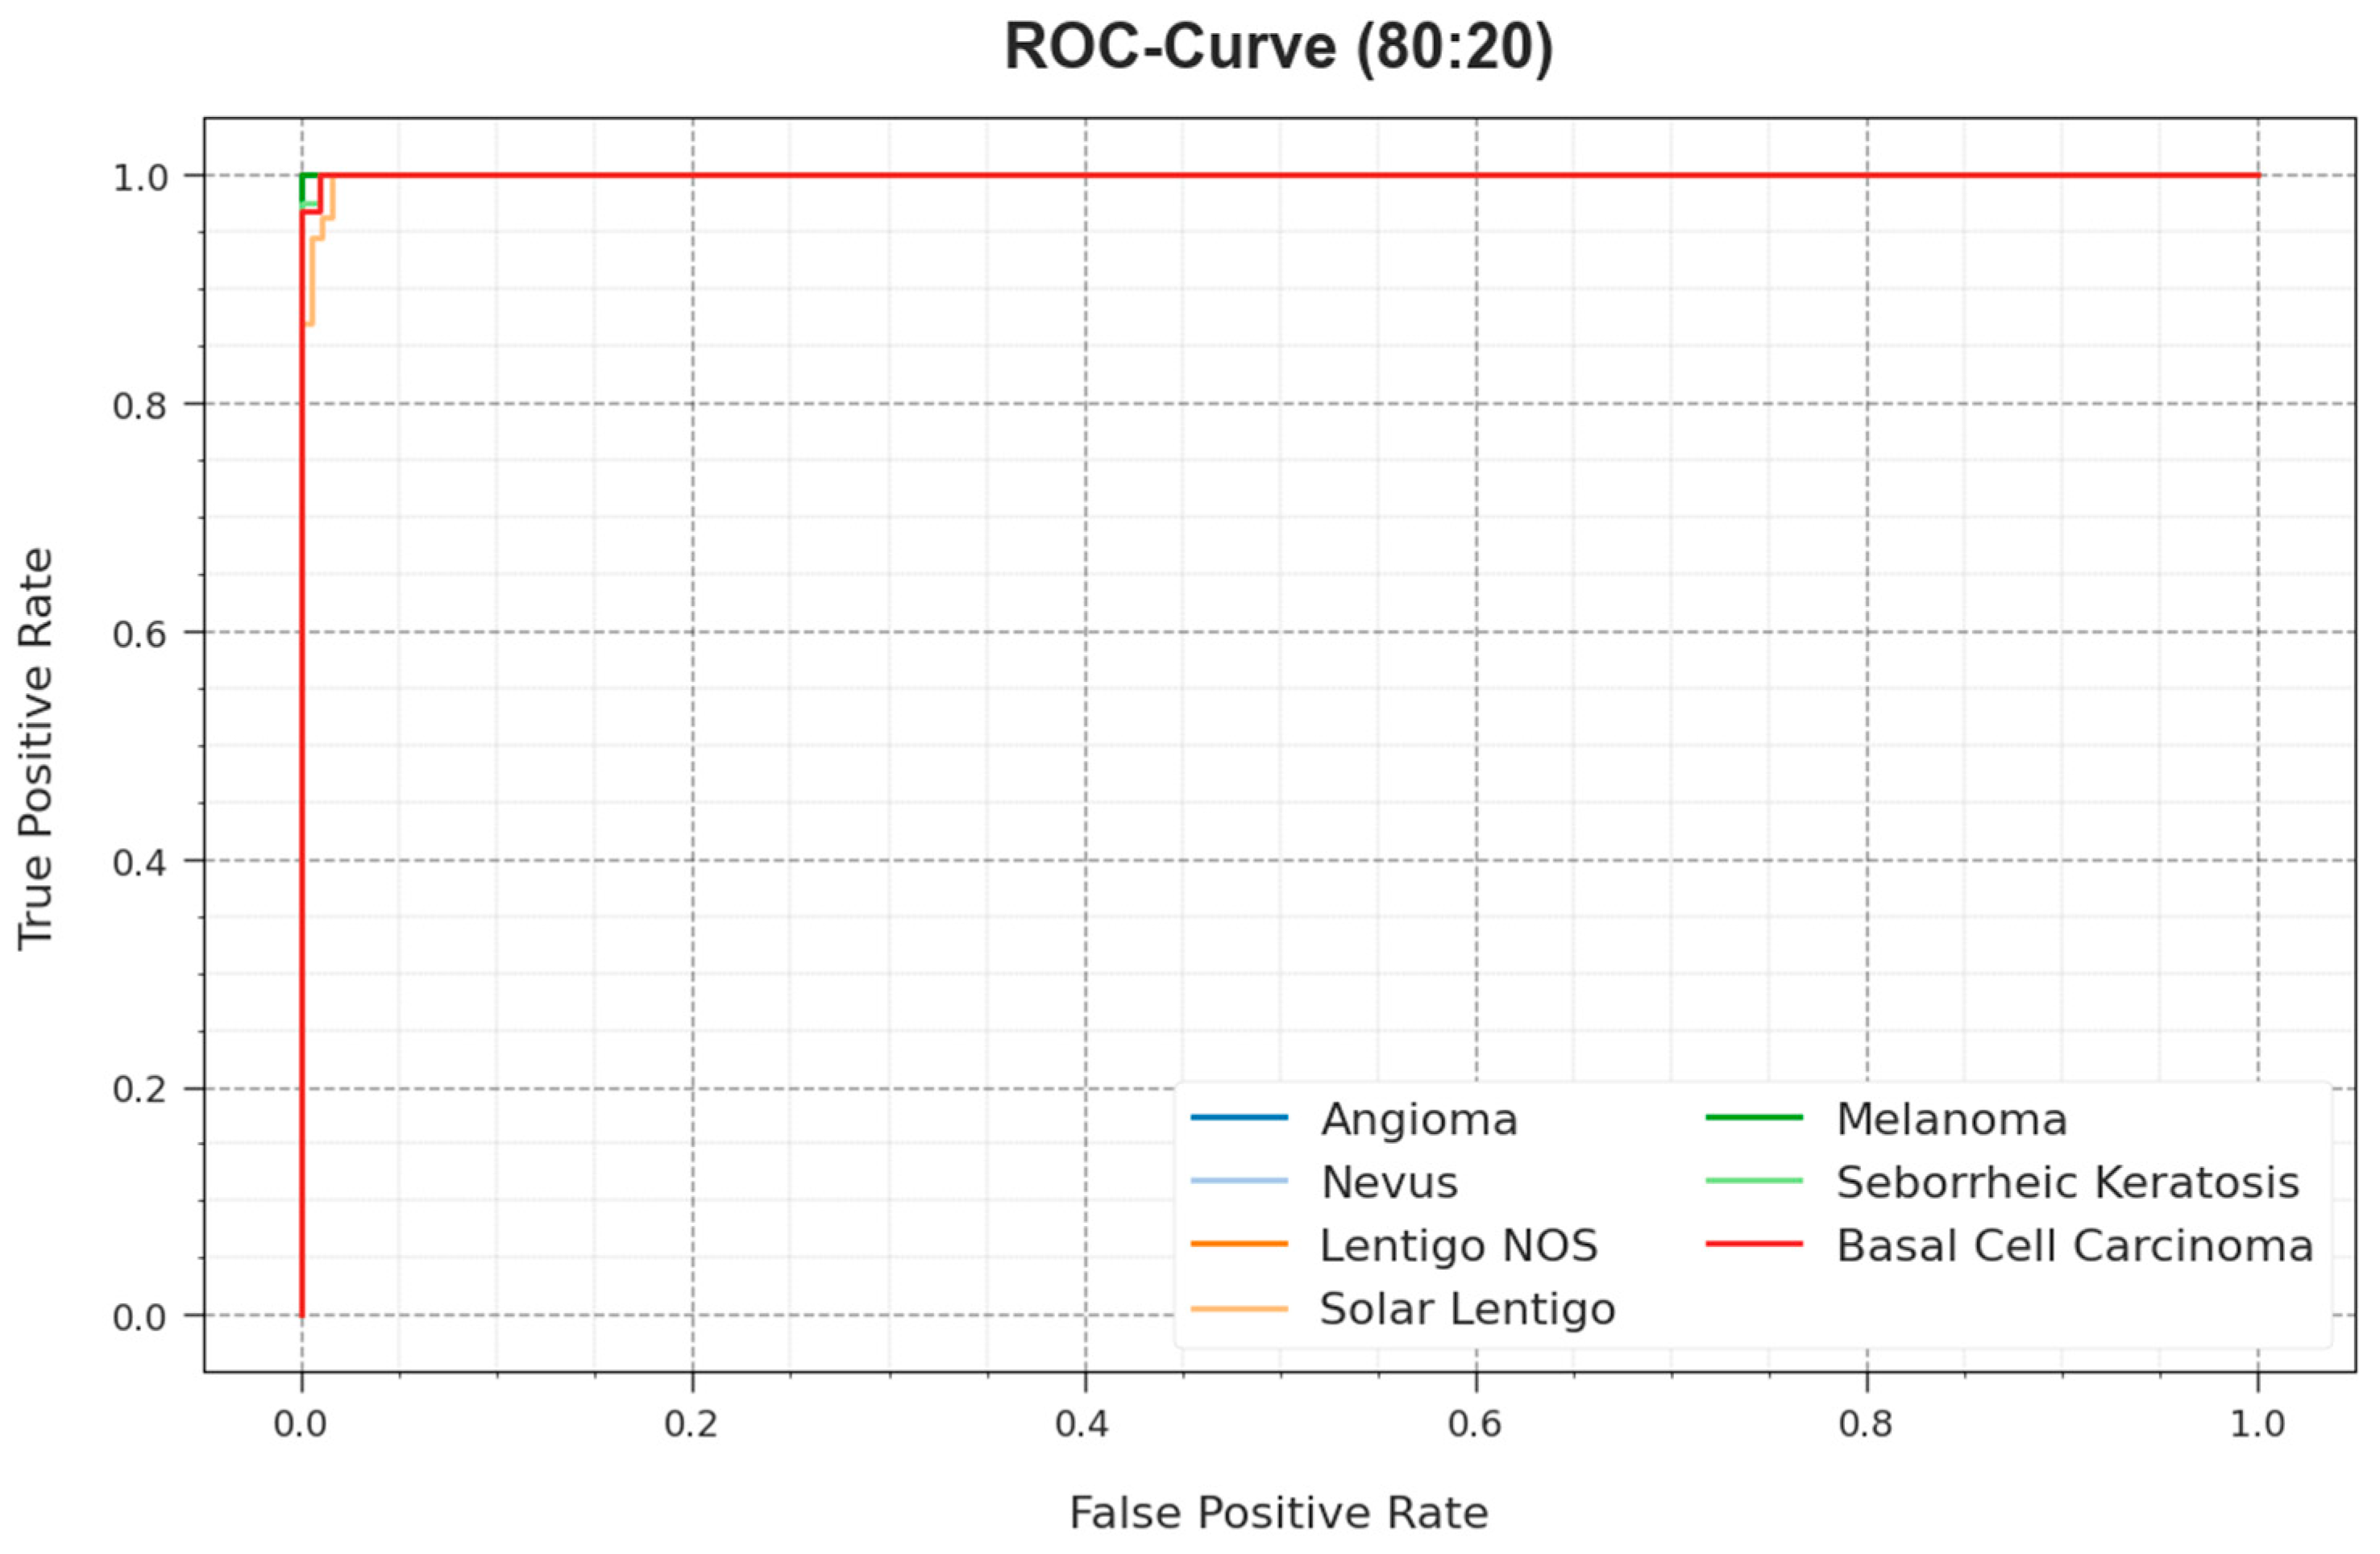
4. Results Analysis
5. Conclusions
Author Contributions
Funding
Institutional Review Board Statement
Informed Consent Statement
Data Availability Statement
Conflicts of Interest
References
- Asiri, Y.; Halawani, H.T.; Algarni, A.D.; Alanazi, A.A. IoT-enabled healthcare environment using intelligent deep learning enabled skin lesion diagnosis model. Alex. Eng. J. 2023, 78, 35–44. [Google Scholar] [CrossRef]
- Riaz, L.; Qadir, H.M.; Ali, G.; Ali, M.; Raza, M.A.; Jurcut, A.D.; Ali, J. A Comprehensive Joint Learning System to Detect Skin Cancer. IEEE Access 2023, 11, 79434–79444. [Google Scholar] [CrossRef]
- Shinde, R.K.; Alam, S.; Hossain, B.; Imtiaz, S.M.; Kim, J.; Padwal, A.A.; Kim, N. Squeeze-mnet: Precise skin cancer detection model for low computing IOT devices using transfer learning. Cancers 2022, 15, 12. [Google Scholar] [CrossRef] [PubMed]
- Abdelhafeez, A.; Mohamed, H.K. Skin Cancer Detection using Neutrosophic c-means and Fuzzy c-means Clustering Algorithms. J. Intell. Syst. Internet Things 2023, 8, 33–42. [Google Scholar] [CrossRef]
- Singh, B.; Ebrahim, A.M.A.; Rajan, R.; Gupta, S.; Babu, D.V. February. IoT enabled Primary Skin Cancer Prediction Using Pigmented Lesions. In Proceedings of the 2022 Second International Conference on Artificial Intelligence and Smart Energy (ICAIS), Coimbatore, India, 23–25 February 2022; IEEE: New York, NY, USA, 2022; pp. 1315–1319. [Google Scholar]
- Singh, S.K.; Abolghasemi, V.; Anisi, M.H. Fuzzy Logic with Deep Learning for Detection of Skin Cancer. Appl. Sci. 2023, 13, 8927. [Google Scholar] [CrossRef]
- Alenezi, F.; Armghan, A.; Polat, K. A multi-stage melanoma recognition framework with deep residual neural network and hyperparameter optimization-based decision support in dermoscopy images. Expert Syst. Appl. 2023, 215, 119352. [Google Scholar] [CrossRef]
- Kaur, R.; GholamHosseini, H.; Sinha, R.; Lindén, M. Melanoma classification using a novel deep convolutional neural network with dermoscopic images. Sensors 2022, 22, 1134. [Google Scholar] [CrossRef]
- Tajjour, S.; Garg, S.; Chandel, S.S.; Sharma, D. A novel hybrid artificial neural network technique for the early skin cancer diagnosis using color space conversions of original images. Int. J. Imaging Syst. Technol. 2023, 33, 276–286. [Google Scholar] [CrossRef]
- Jojoa Acosta, M.F.; Caballero Tovar, L.Y.; Garcia-Zapirain, M.B.; Percybrooks, W.S. Melanoma diagnosis using deep learning techniques on dermatoscopic images. BMC Med. Imaging 2021, 21, 6. [Google Scholar] [CrossRef]
- Meenakshi, K.; Adepu, A.; Nagandla, V.V.T.; Agarwal, S. A Machine learning based melanoma skin cancer using hybrid texture features. In Proceedings of the 2023 3rd International Conference on Intelligent Technologies (CONIT), Hubballi, India, 23–25 June 2023; IEEE: New York, NY, USA, 2023; pp. 1–5. [Google Scholar]
- Mehr, R.A.; Ameri, A. Skin Cancer Detection Based on Deep Learning. J. Biomed. Phys. Eng. 2022, 12, 559. [Google Scholar]
- Khan, M.A.; Akram, T.; Zhang, Y.; Alhaisoni, M.; Al Hejaili, A.; Shaban, K.A.; Tariq, U.; Zayyan, M.H. SkinNet-ENDO: Multiclass skin lesion recognition using deep neural network and Entropy-Normal distribution optimization algorithm with ELM. Int. J. Imaging Syst. Technol. 2023, 33, 1275–1292. [Google Scholar] [CrossRef]
- Malibari, A.A.; Alzahrani, J.S.; Eltahir, M.M.; Malik, V.; Obayya, M.; Al Duhayyim, M.; Neto, A.V.L.; de Albuquerque, V.H.C. Optimal deep neural network-driven computer aided diagnosis model for skin cancer. Comput. Electr. Eng. 2022, 103, 108318. [Google Scholar] [CrossRef]
- Veeraiah, V.; Ravikaumar, G.K.; Kalpana, R.; Sreenivasulu, K.; Singh, Y.; Shukla, S.K. December. Medical Internet of Things using Deep Learning Techniques for Skin Cancer Detection. In Proceedings of the 2022 5th International Conference on Contemporary Computing and Informatics (IC3I), Uttar Pradesh, India, 14–16 December 2022; IEEE: New York, NY, USA, 2022; pp. 317–321. [Google Scholar]
- Sivakumar, N.R.; Ghorashi, S.A.; Karim, F.K.; Alabdulkreem, E.; Al-Rasheed, A. MIoT Based Skin Cancer Detection Using Bregman Recurrent Deep Learning. Comput. Mater. Contin. 2022, 73, 6253–6267. [Google Scholar] [CrossRef]
- Pushpa, B. An Efficient Internet of Things (IoT)-Enabled Skin Lesion Detection Model using Hybrid Feature Extraction with Extreme Machine Learning Model. In Proceedings of the International Conference on Intelligent Computing, Information and Control Systems: ICICCS 2020, Madurai, India, 13–15 May 2020; Springer: Singapore, 2021; pp. 275–282. [Google Scholar]
- Ananth, C.; Therese, M.J. A Survey on Melanoma: Skin Cancer through Computerized Diagnosis. 2020. Available online: https://papers.ssrn.com/sol3/papers.cfm?abstract_id=3551811 (accessed on 8 October 2023).
- Linsangan, N.B.; Adtoon, J.J. Skin cancer detection and classification for moles using k-nearest neighbor algorithm. In Proceedings of the 5th International Conference on Bioinformatics Research and Applications, Hong Kong, 27–29 December 2018; Association for Computing Machinery: New York, NY, USA, 2018; pp. 47–51. [Google Scholar]
- Dahou, A.; Aseeri, A.O.; Mabrouk, A.; Ibrahim, R.A.; Al-Betar, M.A.; Elaziz, M.A. Optimal Skin Cancer Detection Model Using Transfer Learning and Dynamic-Opposite Hunger Games Search. Diagnostics 2023, 13, 1579. [Google Scholar] [CrossRef]
- Ramya, P.; Sathiyabhama, B. Skin Cancer Prediction using Enhanced Genetic Algorithm with Extreme Learning Machine. J. Trends Comput. Sci. Smart Technol. 2023, 5, 1–13. [Google Scholar] [CrossRef]
- Abd Elaziz, M.; Dahou, A.; Mabrouk, A.; El-Sappagh, S.; Aseeri, A.O. An efficient artificial rabbits optimization based on mutation strategy for skin cancer prediction. Comput. Biol. Med. 2023, 163, 107154. [Google Scholar] [CrossRef]
- Khamparia, A.; Singh, P.K.; Rani, P.; Samanta, D.; Khanna, A.; Bhushan, B. An internet of health things-driven deep learning framework for detection and classification of skin cancer using transfer learning. Trans. Emerg. Telecommun. Technol. 2021, 32, e3963. [Google Scholar] [CrossRef]
- Anupama, C.S.S.; Natrayan, L.; Lydia, E.L.; Sait, A.W.; Escorcia-Gutierrez, J.; Gamarra, M.; Mansour, R.F. Deep learning with backtracking search optimization based skin lesion diagnosis model. Comput. Mater. Contin. 2021, 70, 1297–1313. [Google Scholar] [CrossRef]
- Ottom, M.A. Convolutional Neural Network for diagnosing skin cancer. Int. J. Adv. Comput. Sci. Appl. 2019, 10, 333–338. [Google Scholar] [CrossRef]
- Adjobo, E.C.; Mahama, A.T.S.; Gouton, P.; Tossa, J. November. Proposition of convolutional neural network based system for skin cancer detection. In Proceedings of the 2019 15th International Conference on Signal-Image Technology & Internet-Based Systems (SITIS), Sorrento, Italy, 26–29 November 2019; IEEE: New York, NY, USA, 2019; pp. 35–39. [Google Scholar]
- Baskaran, D.; Nagamani, Y.; Merugula, S.; Premnath, S.P. MSRFNet for skin lesion segmentation and deep learning with hybrid optimization for skin cancer detection. Imaging Sci. J. 2023, 71, 616–635. [Google Scholar] [CrossRef]
- Luo, J.; Fan, Y.; Jiang, P.; He, Z.; Xu, P.; Li, X.; Yang, W.; Zhou, W.; Ma, S. Vehicle platform attitude estimation method based on adaptive Kalman filter and sliding window least squares. Meas. Sci. Technol. 2020, 32, 035007. [Google Scholar] [CrossRef]
- Chen, S.W.; Chen, J.K.; Hsieh, Y.H.; Chen, W.H.; Liao, Y.H.; Lin, Y.C.; Chen, M.C.; Tsai, C.T.; Chai, J.W.; Yuan, S.M. Improving Patient Safety in the X-ray Inspection Process with EfficientNet-Based Medical Assistance System. Healthcare 2023, 11, 2068. [Google Scholar] [CrossRef]
- Jajam, N.; Challa, N.P.; Prasanna, K.S.; Deepthi, C.H.V.S. Arithmetic Optimization with Ensemble Deep Learning SBLSTM-RNN-IGSA model for Customer Churn Prediction. IEEE Access 2023, 11, 93111–93128. [Google Scholar] [CrossRef]
- Fei, Z.; Wang, J.; Liu, K.; Attahi, E.; Huang, B. Deep feature fusion-based stacked denoising autoencoder for tag recommendation systems. IET Cyber-Syst. Robot. 2023, 5, e12095. [Google Scholar] [CrossRef]
- Rahmati, K.; Taherinasab, S. The importance of reconfiguration of the distribution network to achieve minimization of energy losses using the dragonfly algorithm. e-Prime-Adv. Electr. Eng. Electron. Energy 2023, 5, 100270. [Google Scholar] [CrossRef]


| Class | No. of Images |
|---|---|
| Angioma | 21 |
| Nevus | 46 |
| Lentigo NOS | 41 |
| Solar Lentigo | 68 |
| Melanoma | 51 |
| Seborrheic Keratosis | 54 |
| Basal Cell Carcinoma | 37 |
| Total Number of Images | 318 |
| Class | ||||
|---|---|---|---|---|
| TR Phase (80%) | ||||
| Angioma | 99.61 | 92.31 | 100.00 | 96.00 |
| Nevus | 100.00 | 100.00 | 100.00 | 100.00 |
| Lentigo NOS | 100.00 | 100.00 | 100.00 | 100.00 |
| Solar Lentigo | 98.43 | 100.00 | 98.00 | 96.43 |
| Melanoma | 100.00 | 100.00 | 100.00 | 100.00 |
| Seborrheic Keratosis | 99.21 | 95.12 | 100.00 | 97.50 |
| Basal Cell Carcinoma | 99.61 | 96.77 | 100.00 | 98.36 |
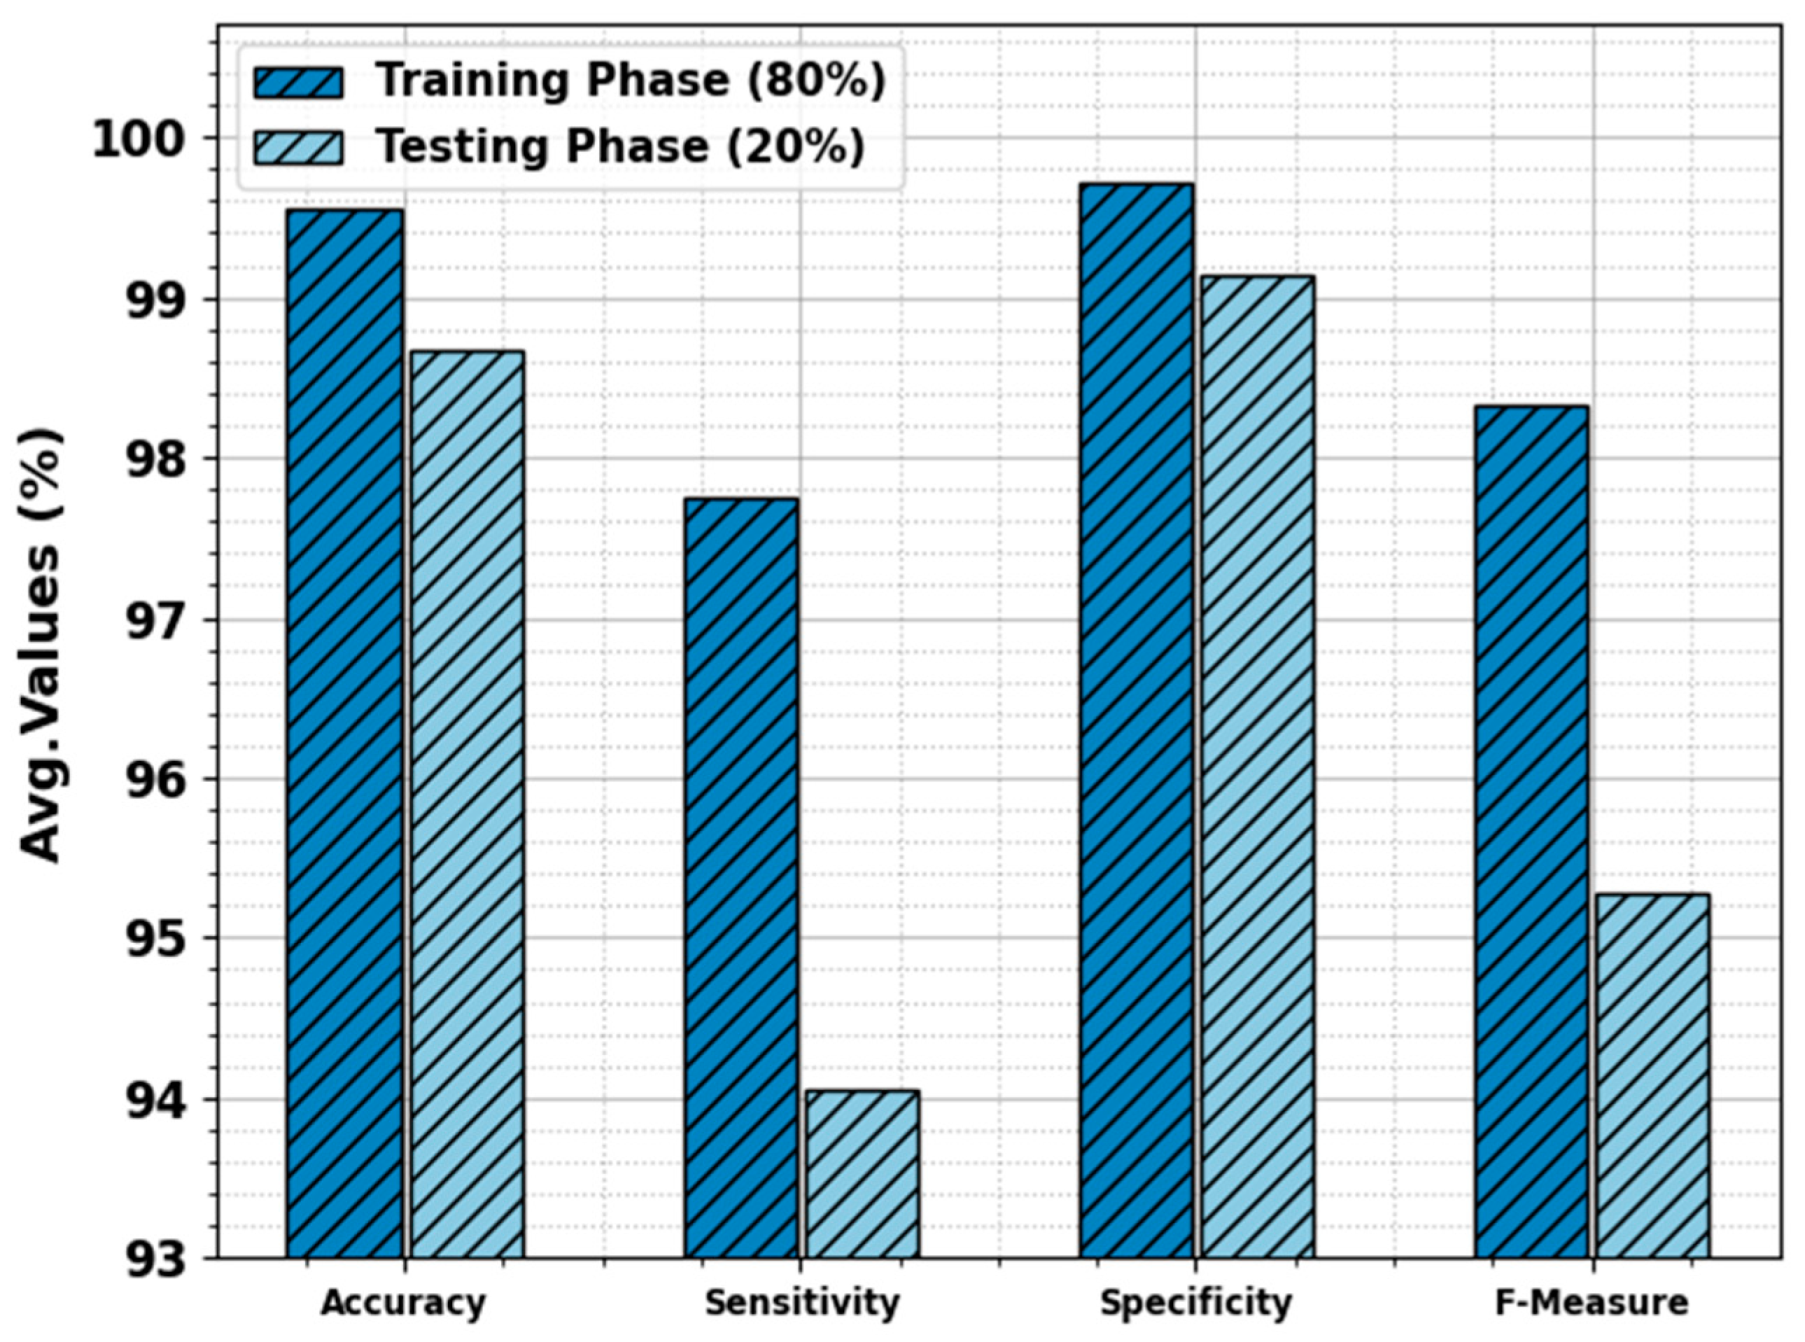
| Average | 99.55 | 97.74 | 99.71 | 98.33 |
| TS Phase (20%) | ||||
| Angioma | 96.88 | 75.00 | 100.00 | 85.71 |
| Nevus | 100.00 | 100.00 | 100.00 | 100.00 |
| Lentigo NOS | 100.00 | 100.00 | 100.00 | 100.00 |
| Solar Lentigo | 95.31 | 100.00 | 94.00 | 90.32 |
| Melanoma | 100.00 | 100.00 | 100.00 | 100.00 |
| Seborrheic Keratosis | 100.00 | 100.00 | 100.00 | 100.00 |
| Basal Cell Carcinoma | 98.44 | 83.33 | 100.00 | 90.91 |
| Average | 98.66 | 94.05 | 99.14 | 95.28 |
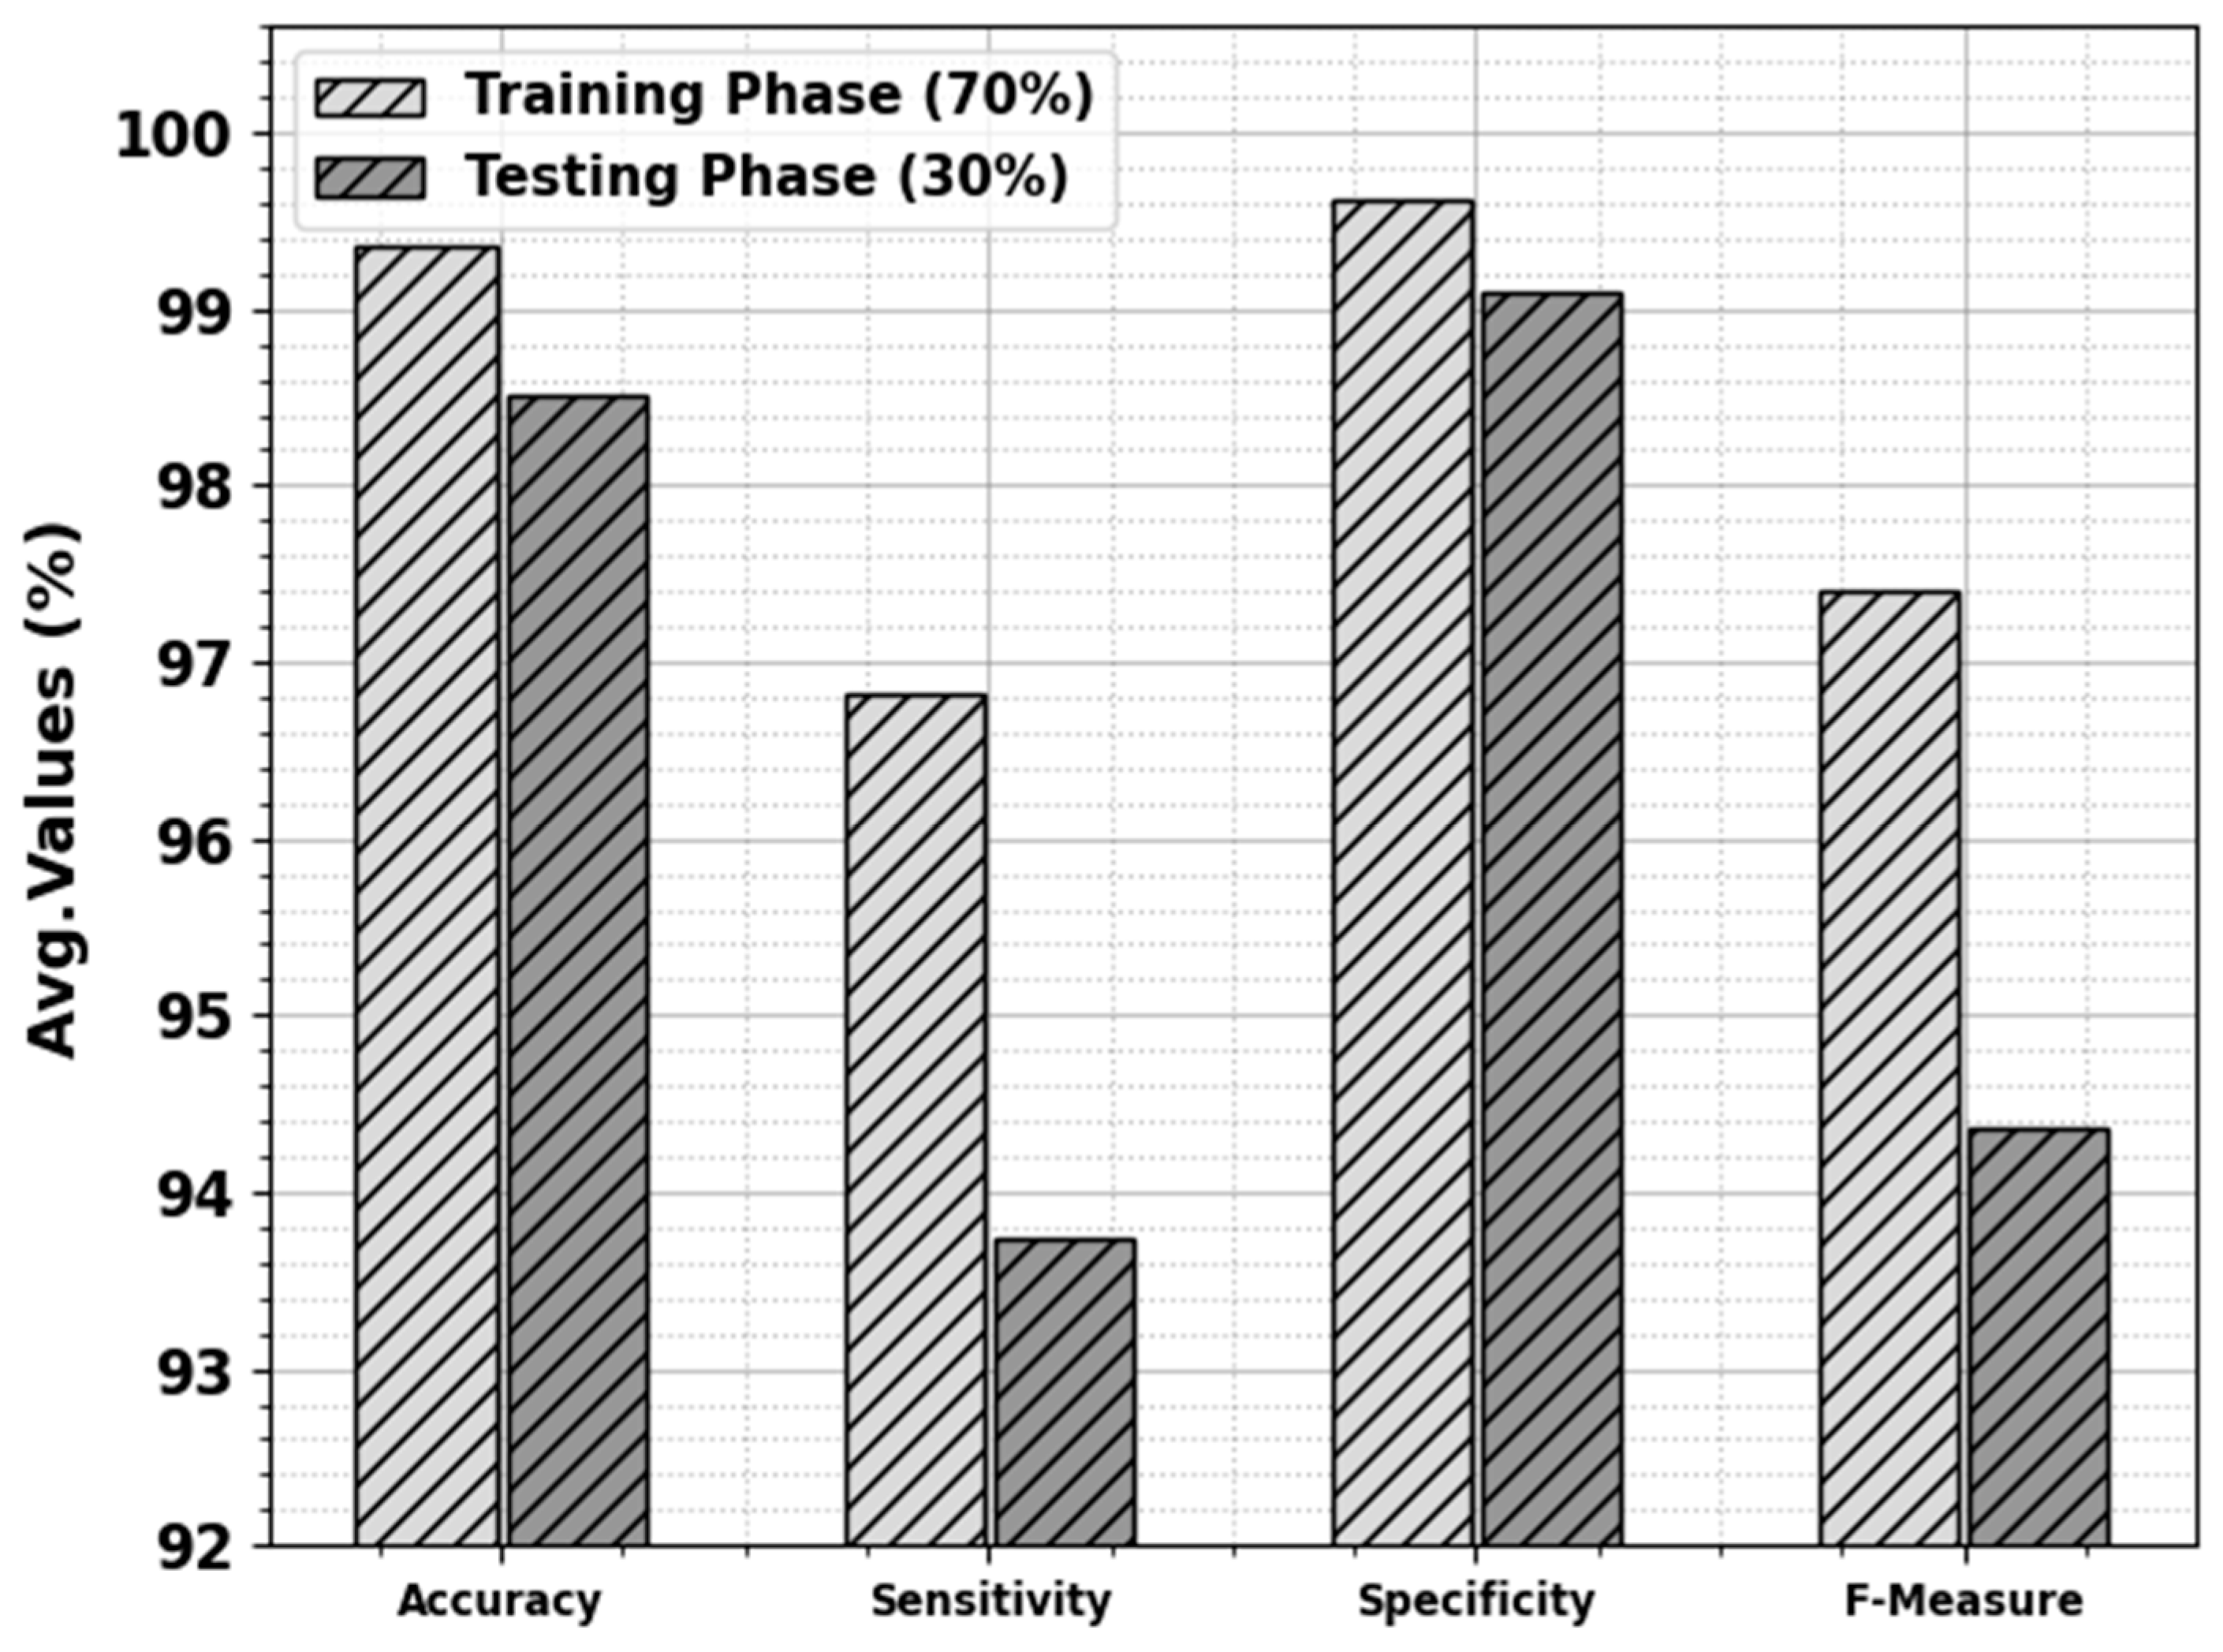
| Class | ||||
|---|---|---|---|---|
| TR Phase (70%) | ||||
| Angioma | 99.10 | 86.67 | 100.00 | 92.86 |
| Nevus | 100.00 | 100.00 | 100.00 | 100.00 |
| Lentigo NOS | 99.55 | 96.67 | 100.00 | 98.31 |
| Solar Lentigo | 99.55 | 100.00 | 99.43 | 98.95 |
| Melanoma | 99.10 | 97.30 | 99.46 | 97.30 |
| Seborrheic Keratosis | 98.20 | 97.14 | 98.40 | 94.44 |
| Basal Cell Carcinoma | 100.00 | 100.00 | 100.00 | 100.00 |
| Average | 99.36 | 96.82 | 99.61 | 97.41 |
| TS Phase (30%) | ||||
| Angioma | 98.96 | 83.33 | 100.00 | 90.91 |
| Nevus | 97.92 | 100.00 | 97.59 | 92.86 |
| Lentigo NOS | 100.00 | 100.00 | 100.00 | 100.00 |
| Solar Lentigo | 97.92 | 100.00 | 97.33 | 95.45 |
| Melanoma | 100.00 | 100.00 | 100.00 | 100.00 |
| Seborrheic Keratosis | 97.92 | 89.47 | 100.00 | 94.44 |
| Basal Cell Carcinoma | 96.88 | 83.33 | 98.81 | 86.96 |
| Average | 98.51 | 93.73 | 99.10 | 94.37 |
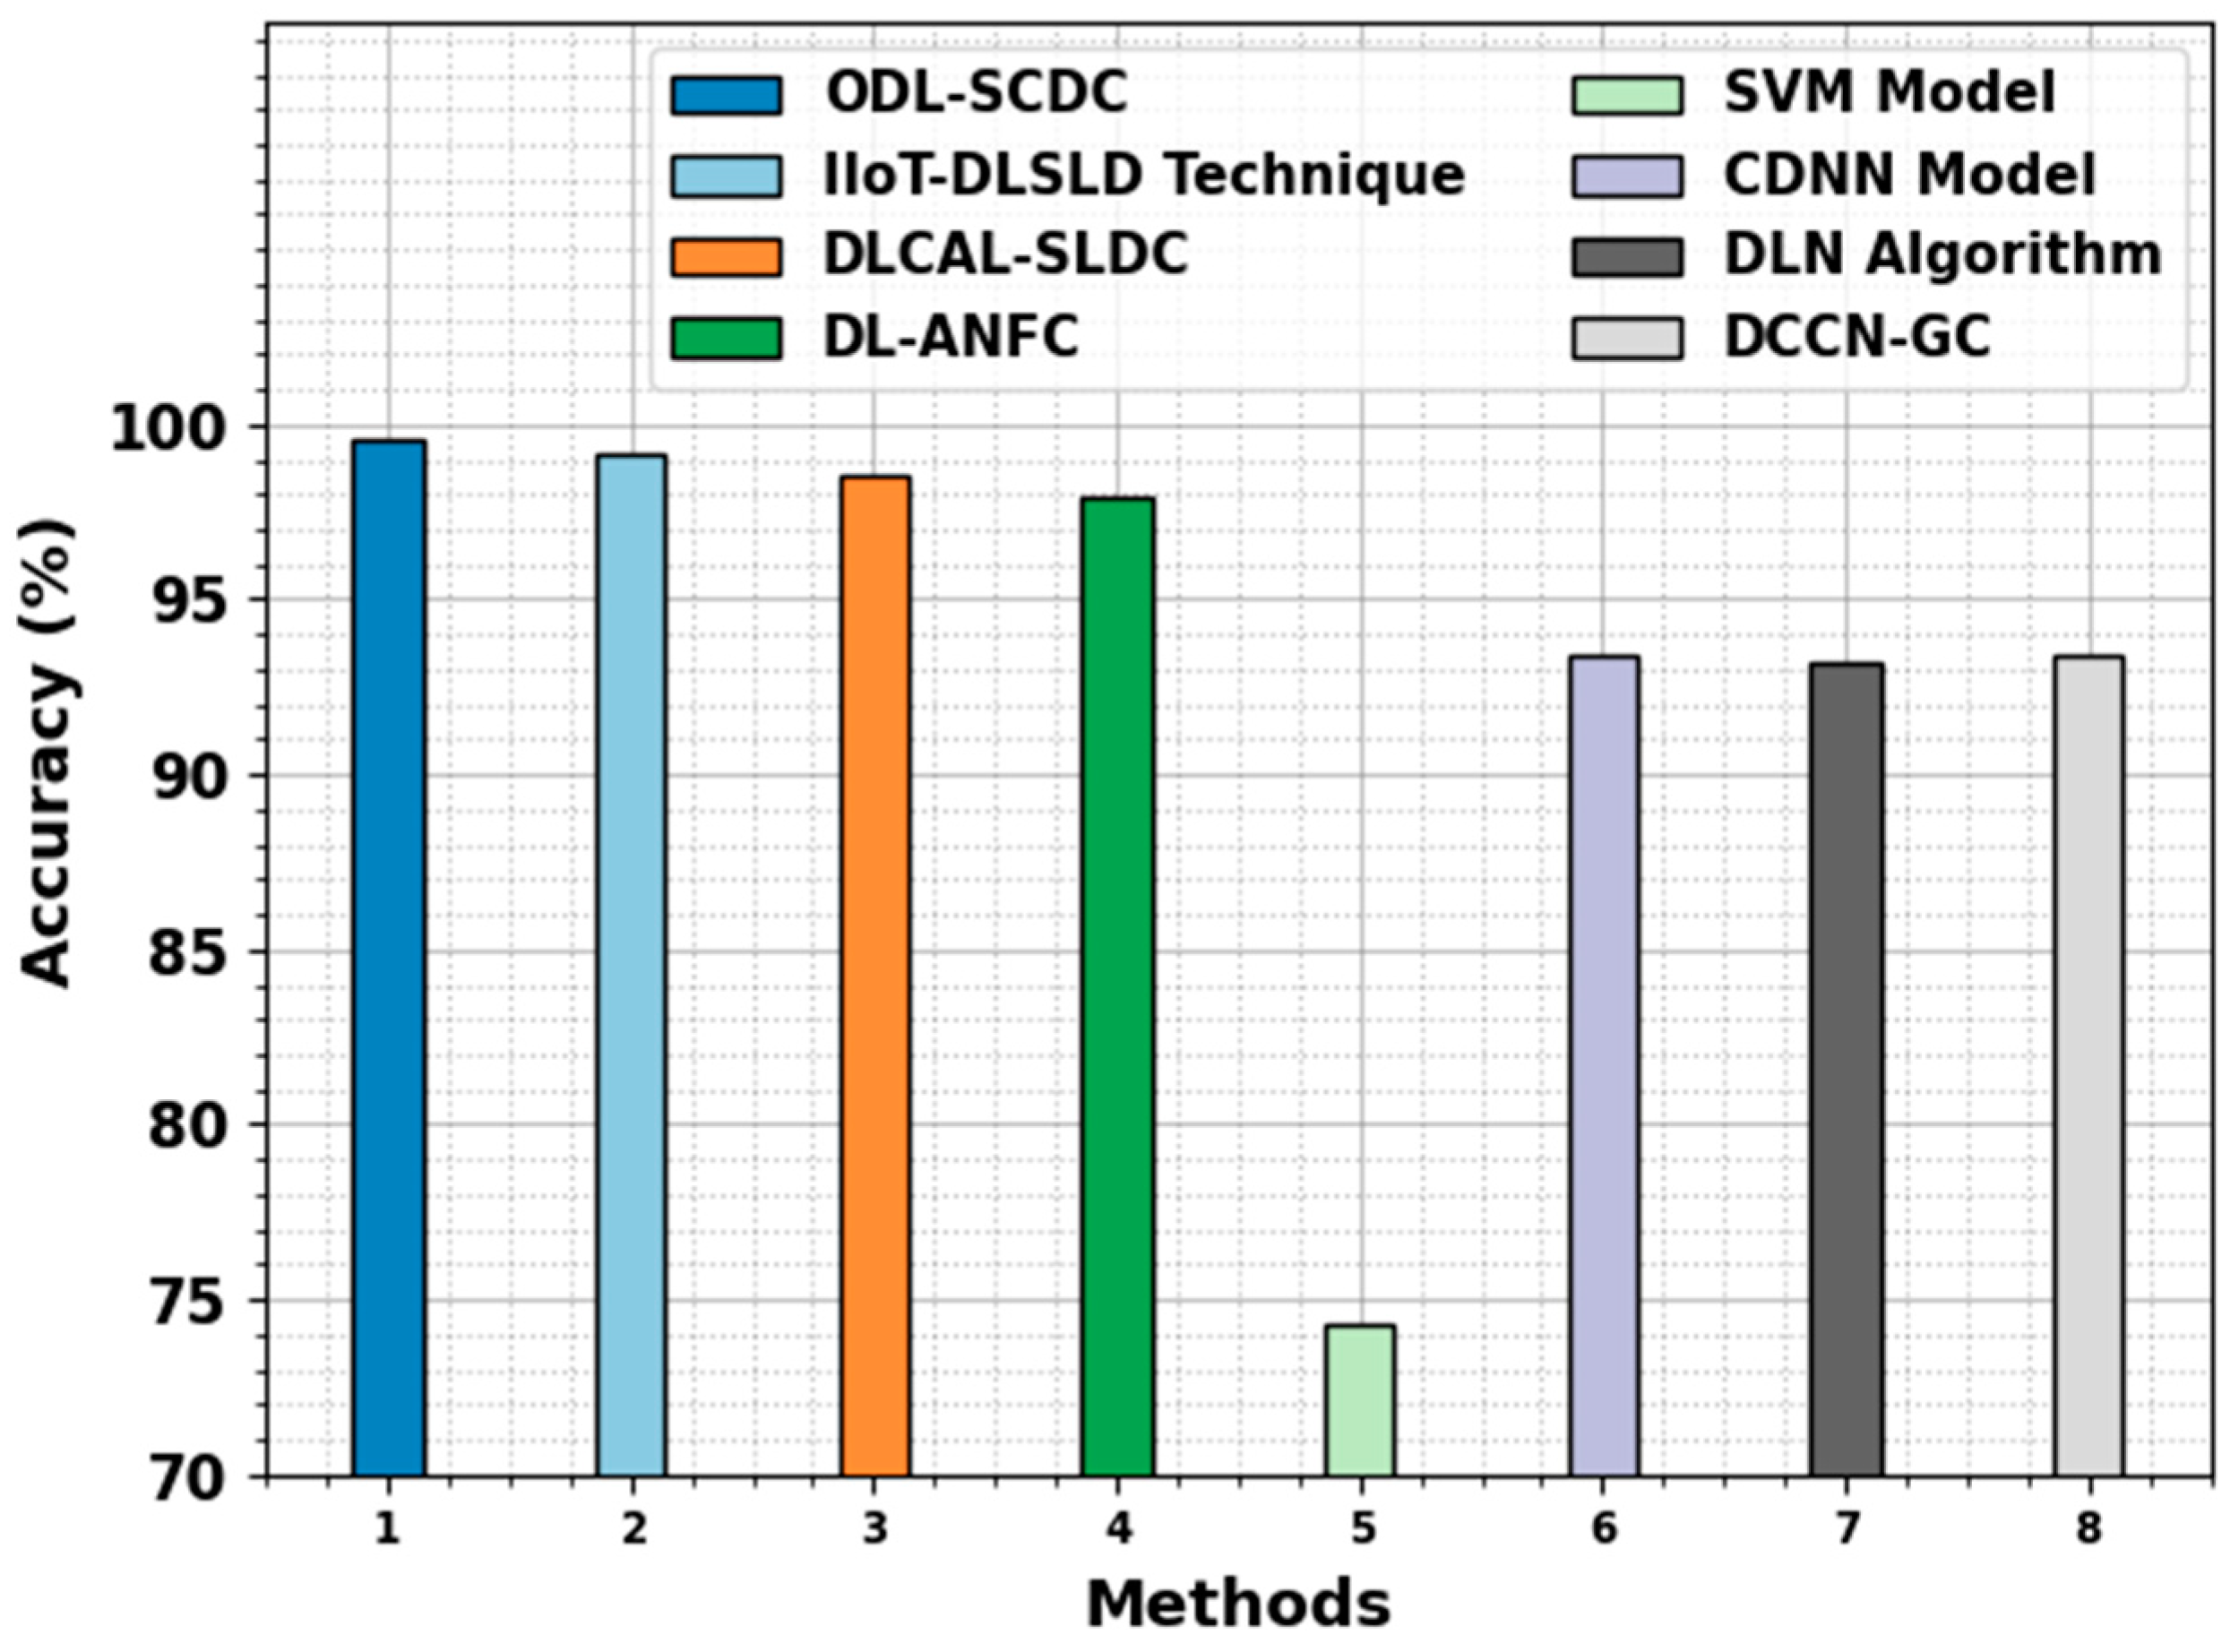
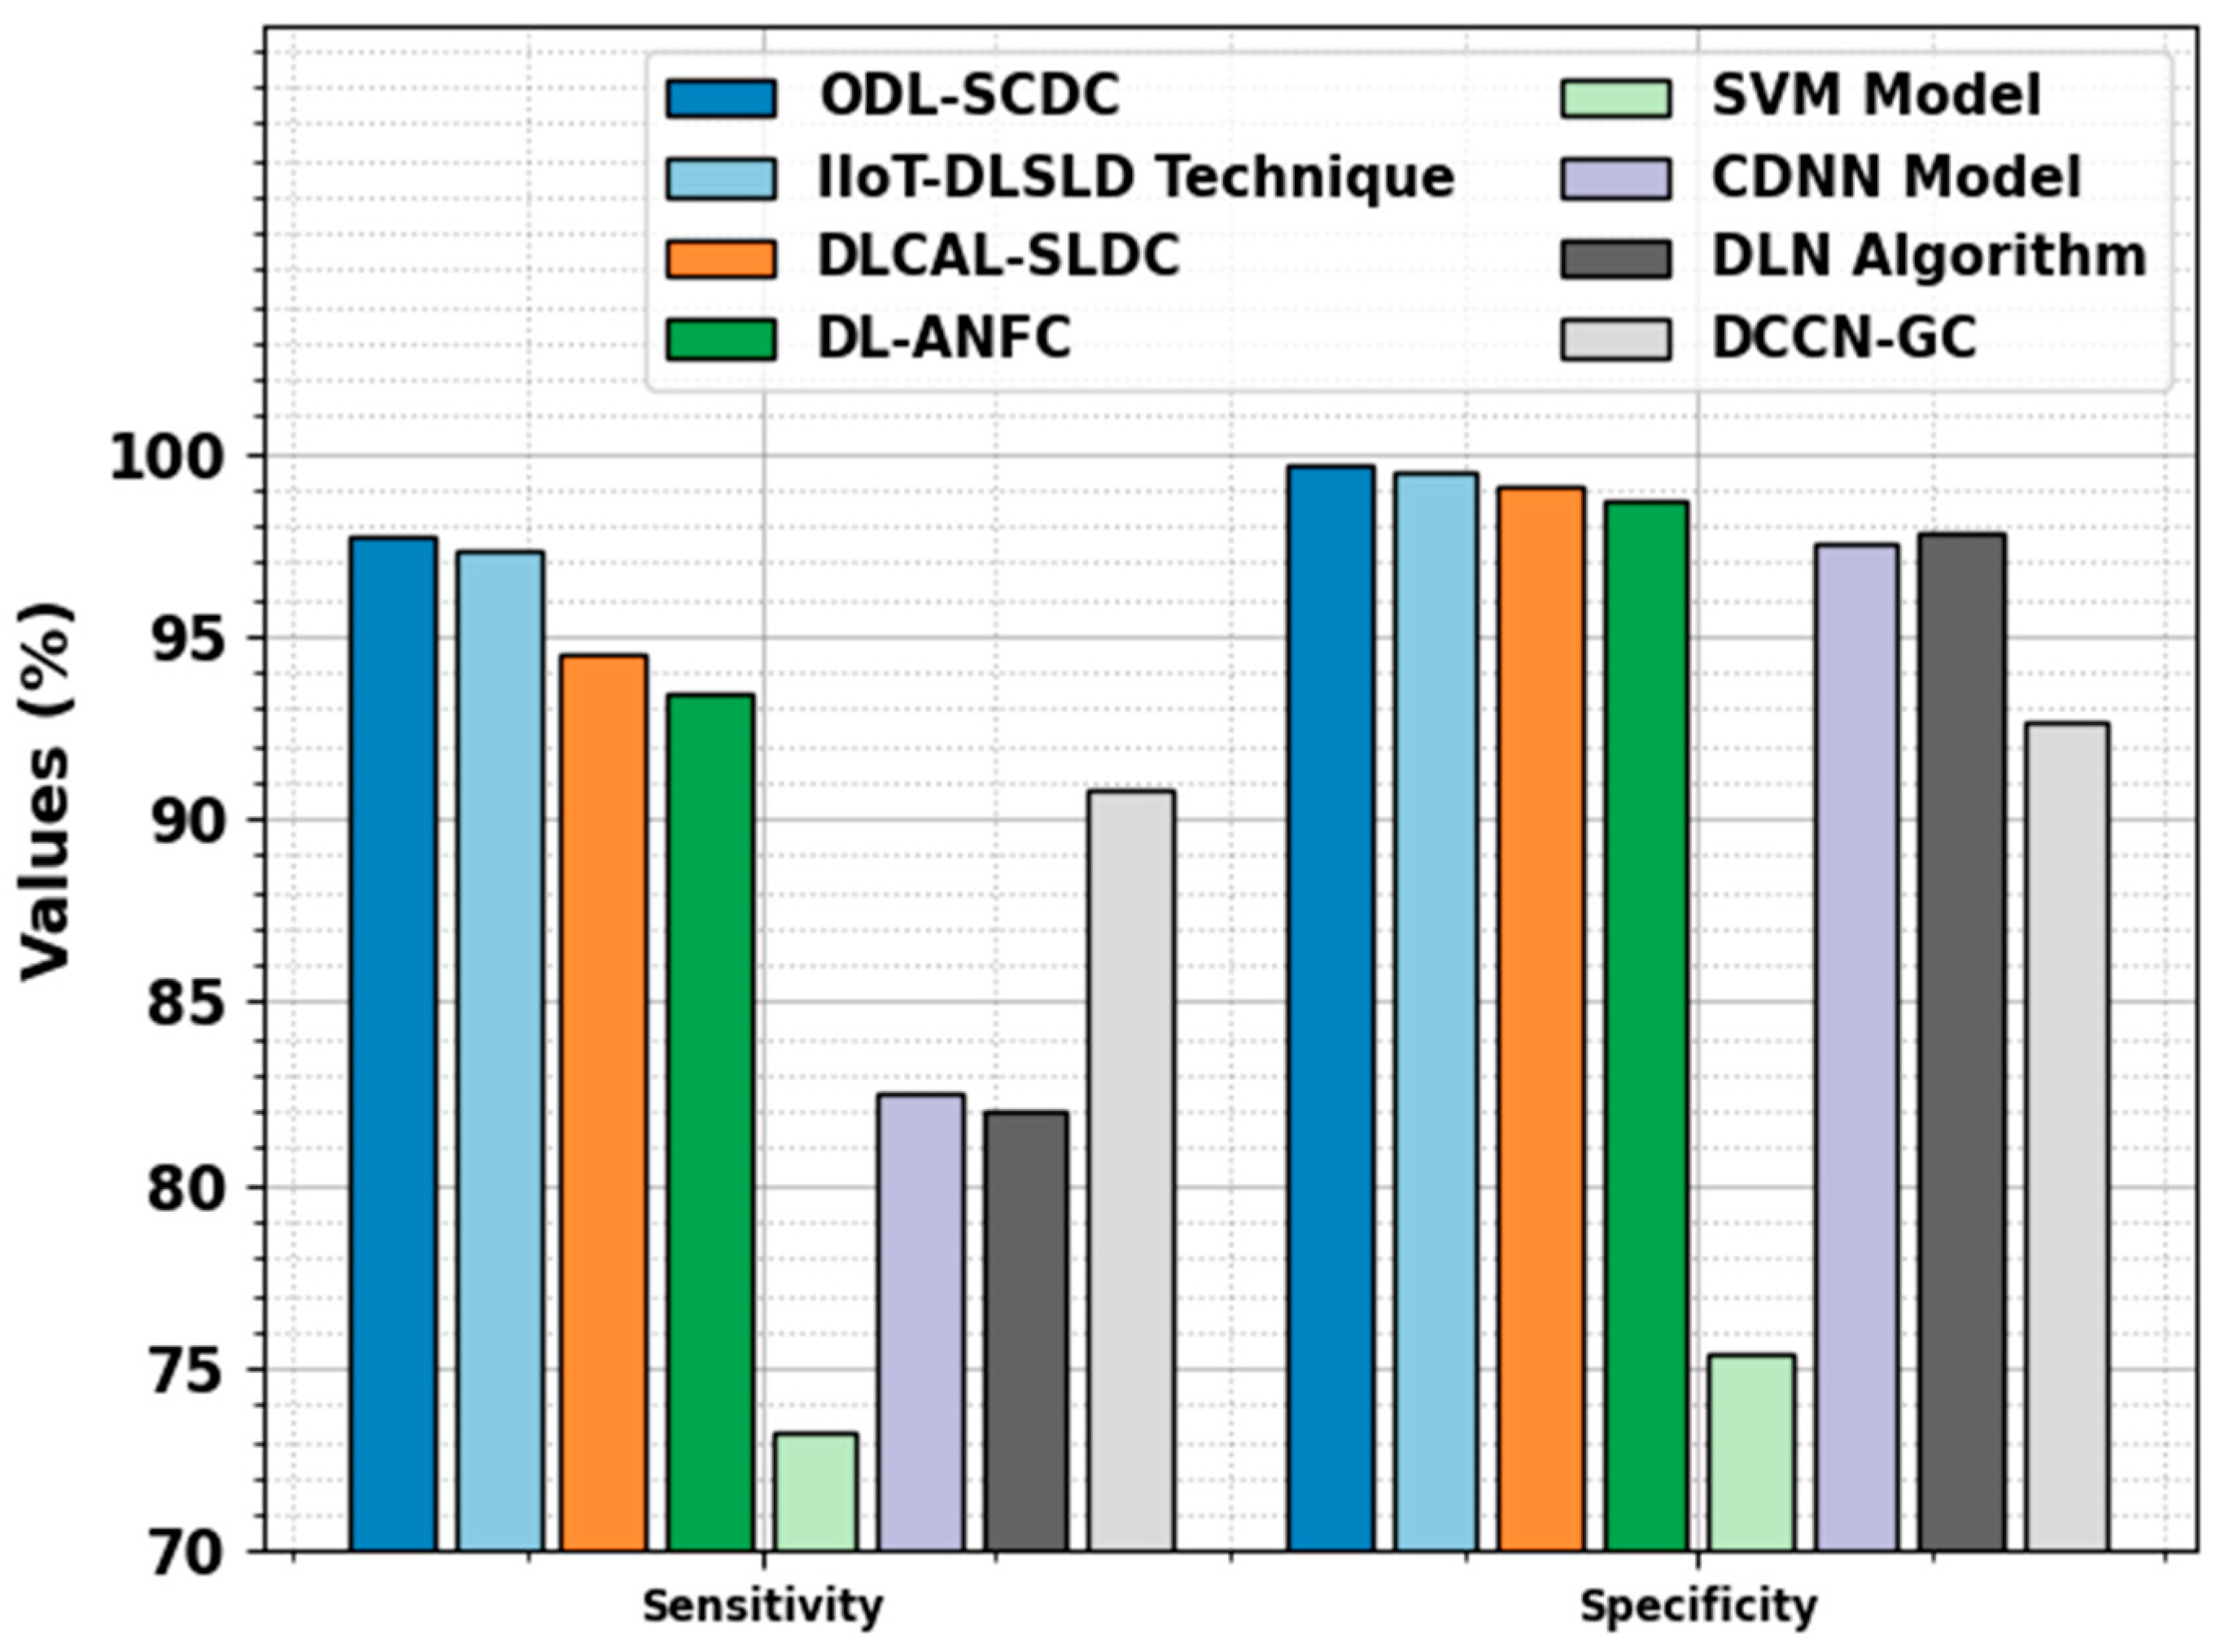
| Methods | |||
|---|---|---|---|
| ODL-SCDC | 97.74 | 99.71 | 99.55 |
| IIoT-DLSLD Technique | 97.30 | 99.50 | 99.20 |
| DLCAL-SLDC | 94.50 | 99.10 | 98.50 |
| DL-ANFC | 93.40 | 98.70 | 97.90 |
| SVM Model | 73.20 | 75.40 | 74.30 |
| CDNN Model | 82.50 | 97.50 | 93.40 |
| DLN Algorithm | 82.00 | 97.80 | 93.20 |
| DCCN-GC | 90.80 | 92.70 | 93.40 |
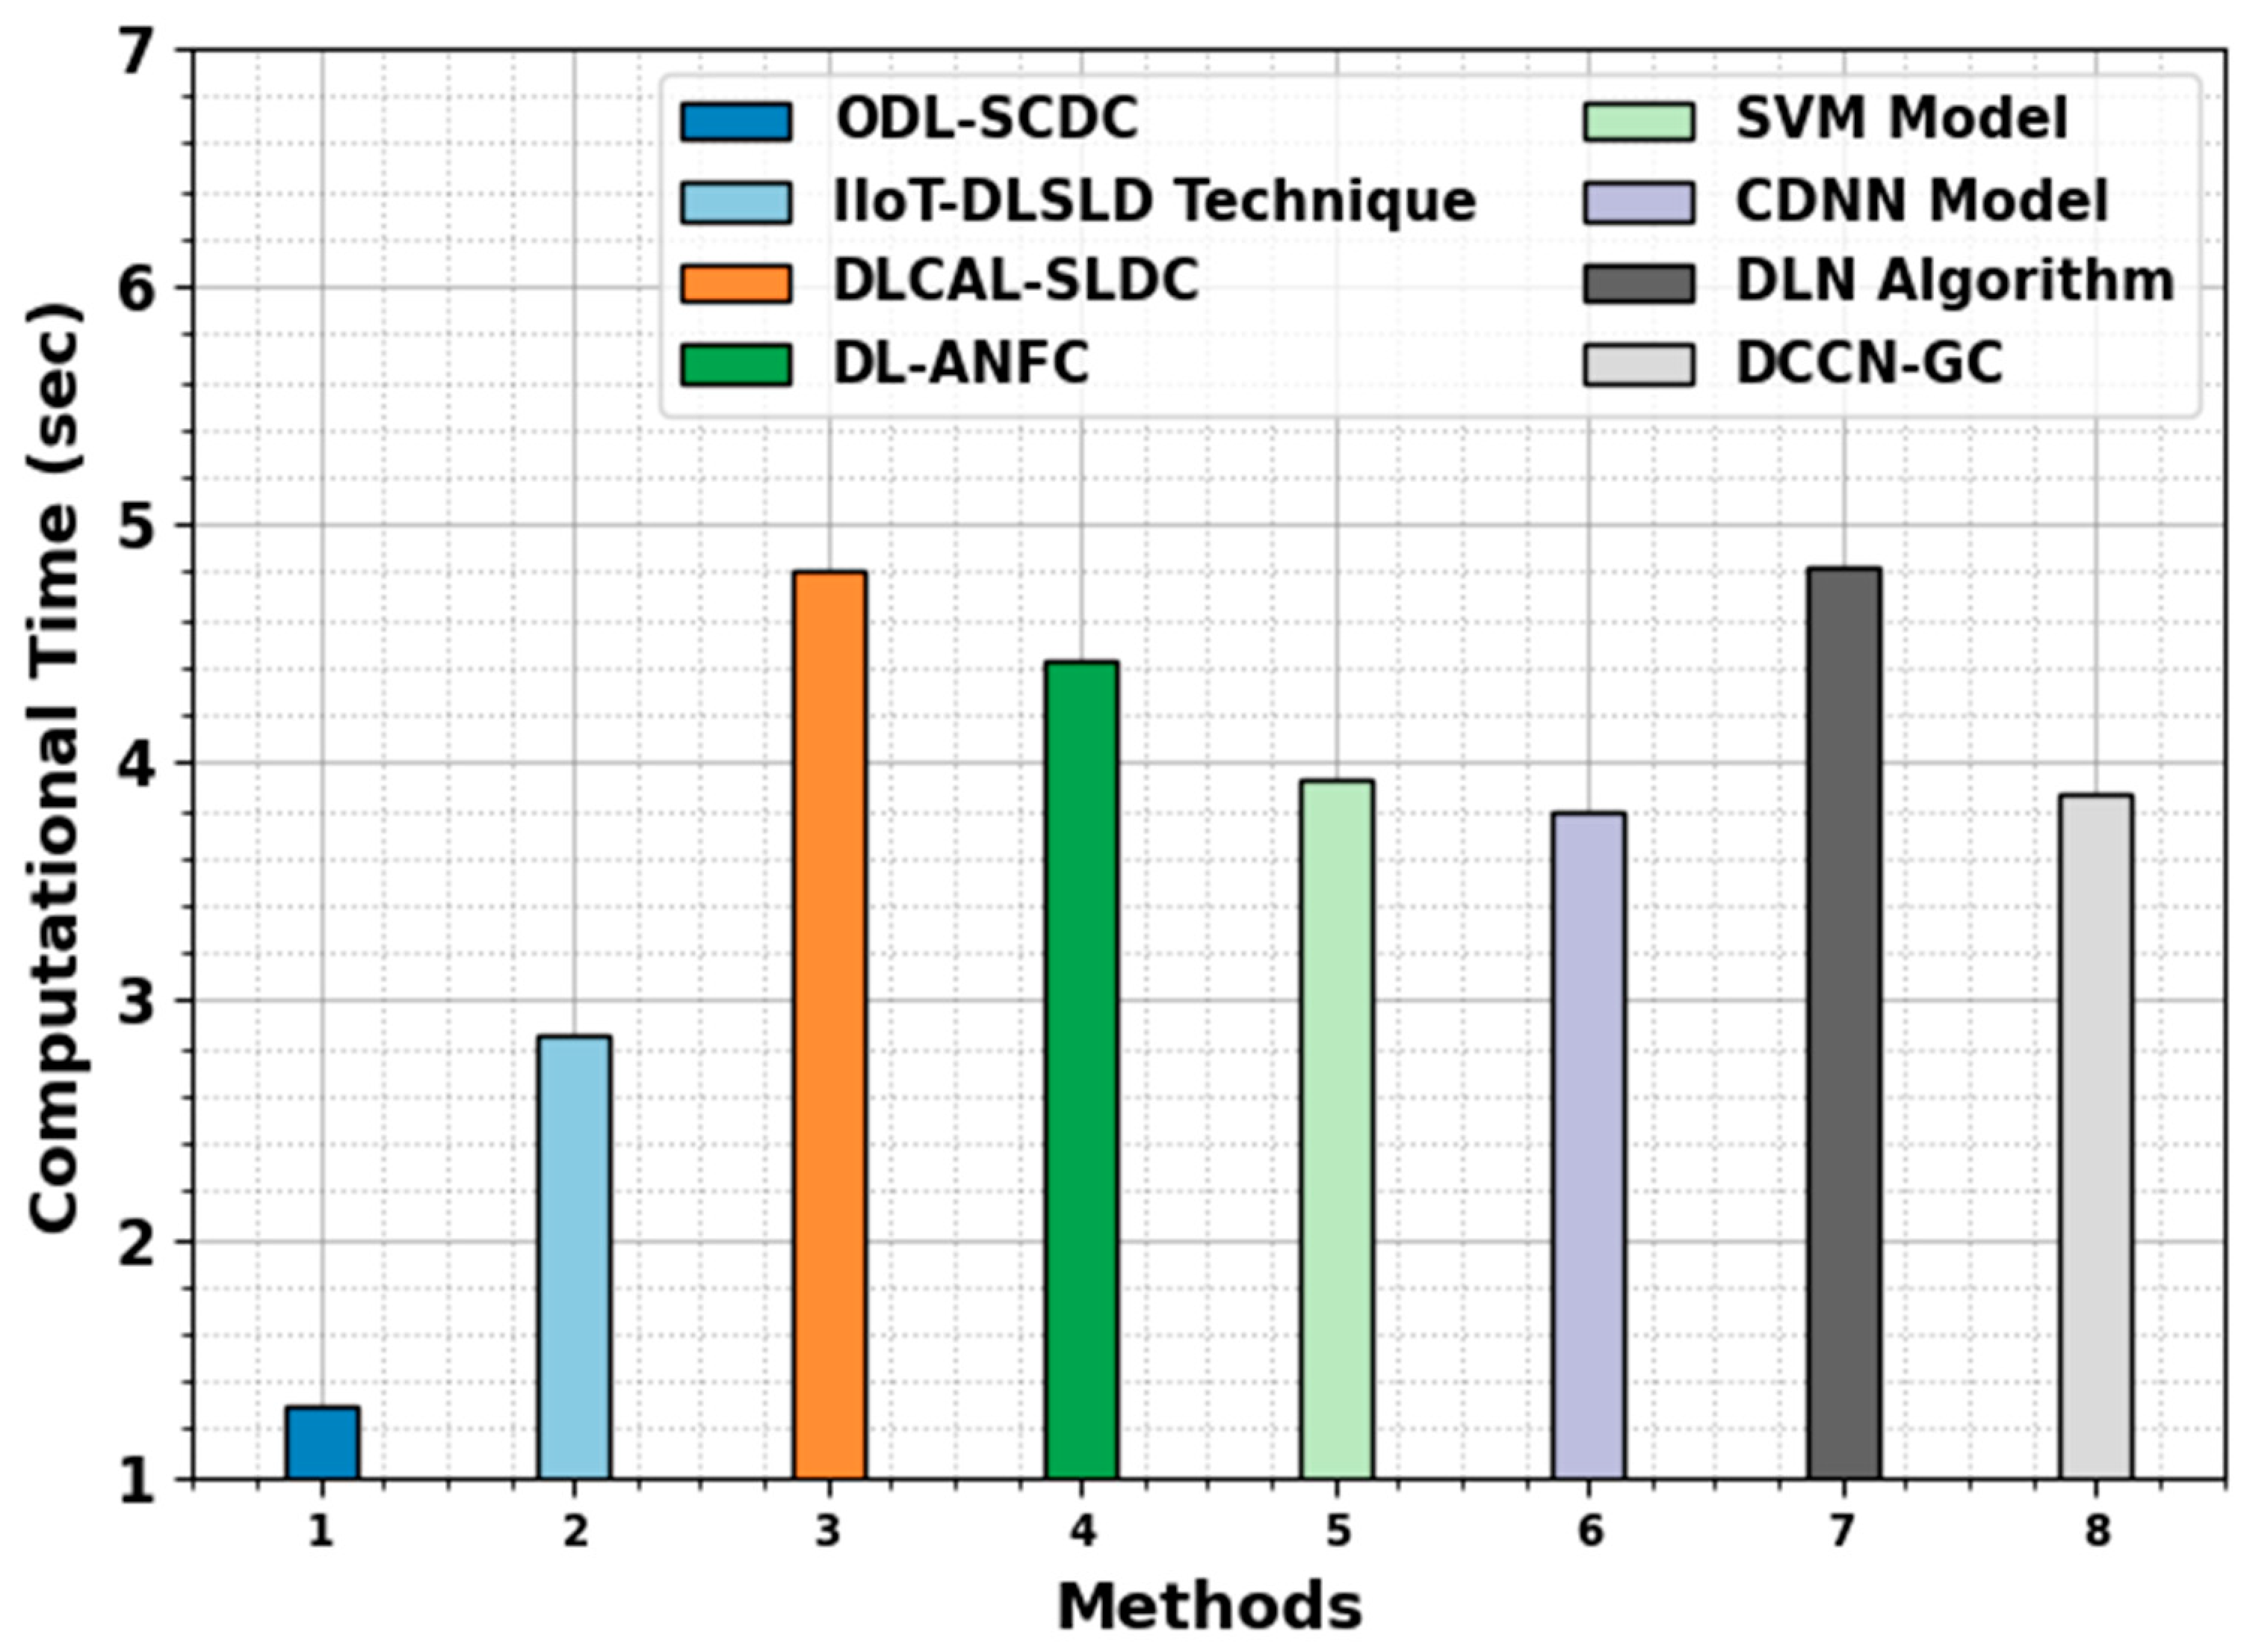
| Methods | Computational Time (s) |
|---|---|
| ODL-SCDC | 1.30 |
| IIoT-DLSLD Technique | 2.85 |
| DLCAL-SLDC | 4.80 |
| DL-ANFC | 4.43 |
| SVM Model | 3.93 |
| CDNN Model | 3.80 |
| DLN Algorithm | 4.82 |
| DCCN-GC | 3.87 |
Disclaimer/Publisher’s Note: The statements, opinions and data contained in all publications are solely those of the individual author(s) and contributor(s) and not of MDPI and/or the editor(s). MDPI and/or the editor(s) disclaim responsibility for any injury to people or property resulting from any ideas, methods, instructions or products referred to in the content. |
© 2023 by the authors. Licensee MDPI, Basel, Switzerland. This article is an open access article distributed under the terms and conditions of the Creative Commons Attribution (CC BY) license (https://creativecommons.org/licenses/by/4.0/).
Share and Cite
Obayya, M.; Arasi, M.A.; Almalki, N.S.; Alotaibi, S.S.; Al Sadig, M.; Sayed, A. Internet of Things-Assisted Smart Skin Cancer Detection Using Metaheuristics with Deep Learning Model. Cancers 2023, 15, 5016. https://doi.org/10.3390/cancers15205016
Obayya M, Arasi MA, Almalki NS, Alotaibi SS, Al Sadig M, Sayed A. Internet of Things-Assisted Smart Skin Cancer Detection Using Metaheuristics with Deep Learning Model. Cancers. 2023; 15(20):5016. https://doi.org/10.3390/cancers15205016
Chicago/Turabian StyleObayya, Marwa, Munya A. Arasi, Nabil Sharaf Almalki, Saud S. Alotaibi, Mutasim Al Sadig, and Ahmed Sayed. 2023. "Internet of Things-Assisted Smart Skin Cancer Detection Using Metaheuristics with Deep Learning Model" Cancers 15, no. 20: 5016. https://doi.org/10.3390/cancers15205016
APA StyleObayya, M., Arasi, M. A., Almalki, N. S., Alotaibi, S. S., Al Sadig, M., & Sayed, A. (2023). Internet of Things-Assisted Smart Skin Cancer Detection Using Metaheuristics with Deep Learning Model. Cancers, 15(20), 5016. https://doi.org/10.3390/cancers15205016