
Rapid Classification of Sarcomas Using Methylation Fingerprint: A Pilot Study
 , , , , and
Abstract
:Simple Summary
Abstract
1. Introduction
2. Materials and Methods
2.1. Patients and DNA Isolation
2.2. Nanopore WGS
2.3. Data Analysis Pipeline
2.3.1. Classification
- Methylation-based Random Forest Classification
- 2.
- Unsupervised Clustering
2.3.2. Copy-Number Analysis
2.3.3. Reporting
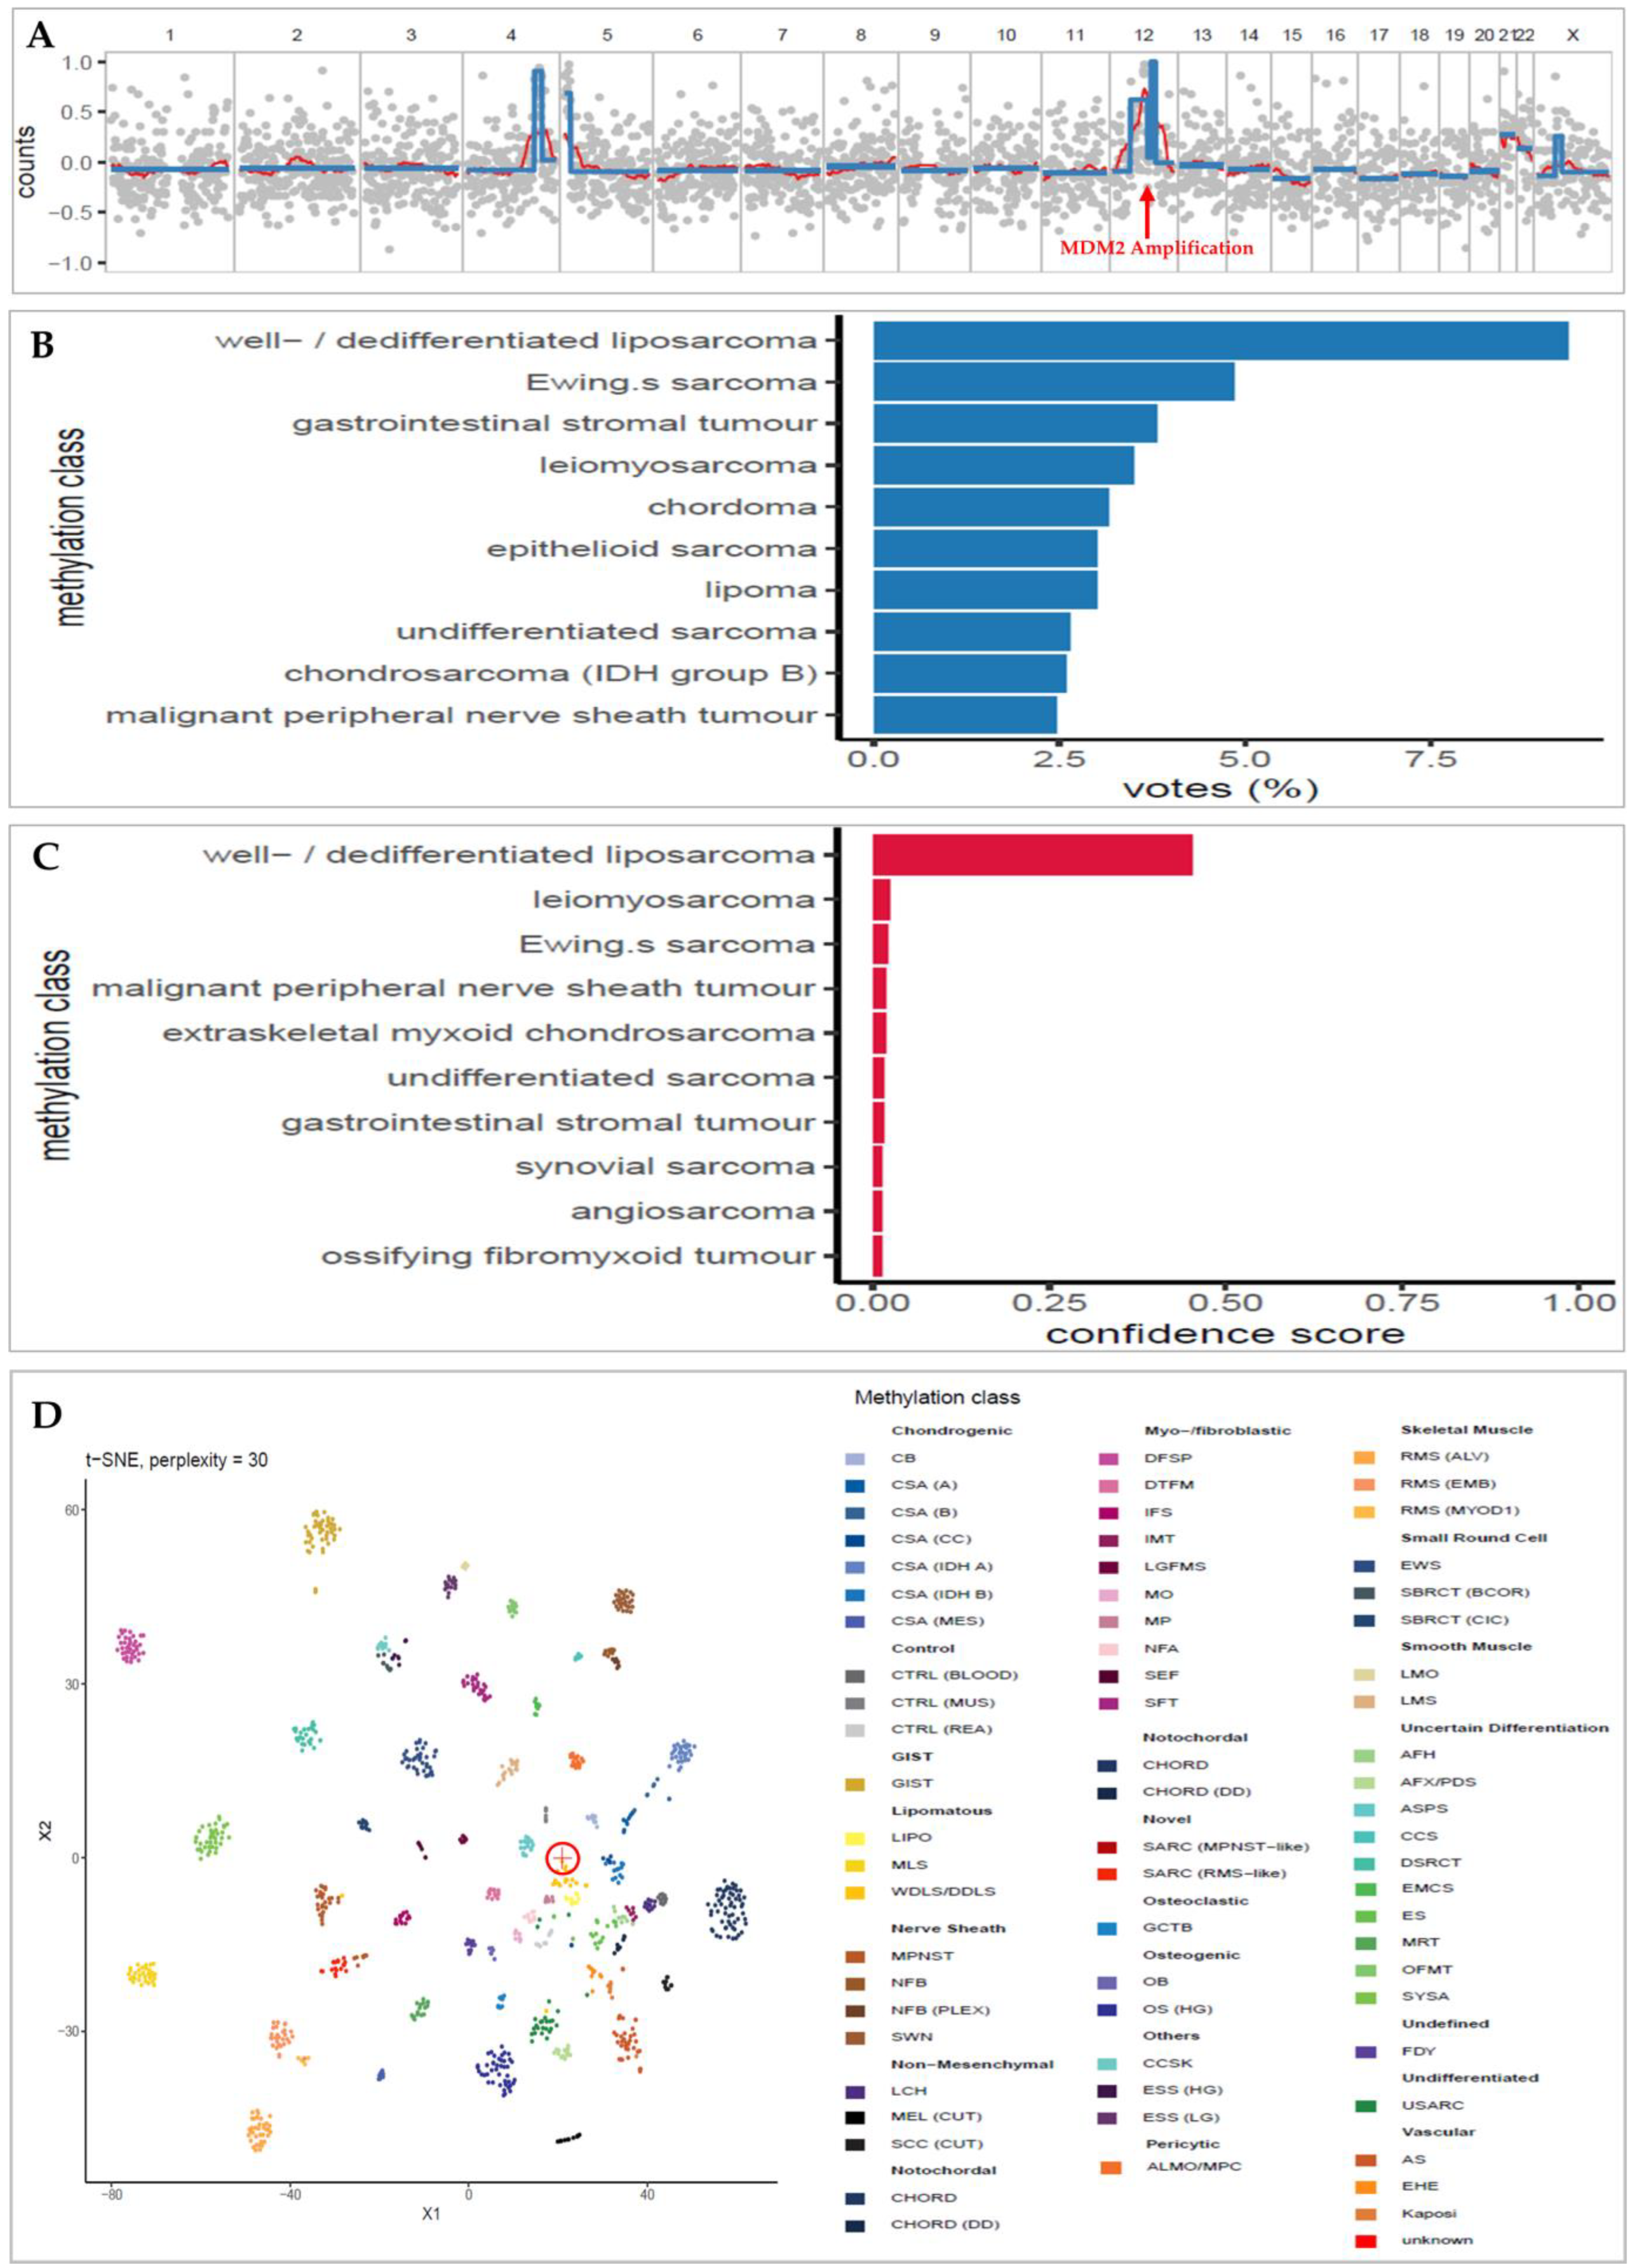
3. Results
3.1. DNA Extracted from Sarcoma Surgical Samples Are Successfully Utilized for Nanopore Sequencing
3.2. Low-Overage DNA Methylation Successfully Classifies Sarcoma
3.3. t-SNE Unsupervised Clustering Matches Concordant Classifications
3.4. Copy-Number Analysis Detects Typical Sarcoma Alteration
4. Discussion
5. Conclusions
Supplementary Materials
Author Contributions
Funding
Institutional Review Board Statement
Informed Consent Statement
Data Availability Statement
Acknowledgments
Conflicts of Interest
References
- Yang, J.; Ren, Z.; Du, X.; Hao, M.; Zhou, W. The role of mesenchymal stem/progenitor cells in sarcoma: Update and dispute. Stem Cell Investig. 2014, 1, 18. [Google Scholar] [CrossRef] [PubMed]
- Amin, M.B.; Greene, F.L.; Edge, S.B.; Compton, C.C.; Gershenwald, J.E.; Brookland, R.K.; Meyer, L.; Gress, D.M.; Byrd, D.R.; Winchester, D.P. The Eighth Edition AJCC Cancer Staging Manual: Continuing to build a bridge from a population-based to a more “personalized” approach to cancer staging. CA Cancer J. Clin. 2017, 67, 93–99. [Google Scholar] [CrossRef] [PubMed]
- den Hollander, D.; Van der Graaf, W.T.A.; Fiore, M.; Kasper, B.; Singer, S.; Desar, I.M.E.; Husson, O. Unravelling the heterogeneity of soft tissue and bone sarcoma patients’ health-related quality of life: A systematic literature review with focus on tumour location. ESMO Open 2020, 5, e000914. [Google Scholar] [CrossRef]
- Martinez-Trufero, J.; Cruz Jurado, J.; Gomez-Mateo, M.C.; Bernabeu, D.; Floria, L.J.; Lavernia, J.; Sebio, A.; Garcia Del Muro, X.; Alvarez, R.; Correa, R.; et al. Uncommon and peculiar soft tissue sarcomas: Multidisciplinary review and practical recommendations for diagnosis and treatment. Spanish group for Sarcoma research (GEIS—GROUP). Part I. Cancer Treat. Rev. 2021, 99, 102259. [Google Scholar] [CrossRef] [PubMed]
- Hwa Yun, B.; Guo, J.; Bellamri, M.; Turesky, R.J. DNA adducts: Formation, biological effects, and new biospecimens for mass spectrometric measurements in humans. Mass Spectrom. Rev. 2020, 39, 55–82. [Google Scholar] [CrossRef]
- Gounder, M.M.; Agaram, N.P.; Trabucco, S.E.; Robinson, V.; Ferraro, R.A.; Millis, S.Z.; Krishnan, A.; Lee, J.; Attia, S.; Abida, W.; et al. Clinical genomic profiling in the management of patients with soft tissue and bone sarcoma. Nat. Commun. 2022, 13, 3406. [Google Scholar] [CrossRef]
- Nacev, B.A.; Sanchez-Vega, F.; Smith, S.A.; Antonescu, C.R.; Rosenbaum, E.; Shi, H.; Tang, C.; Socci, N.D.; Rana, S.; Gularte-Merida, R.; et al. Clinical sequencing of soft tissue and bone sarcomas delineates diverse genomic landscapes and potential therapeutic targets. Nat. Commun. 2022, 13, 3405. [Google Scholar] [CrossRef]
- Koelsche, C.; Schrimpf, D.; Stichel, D.; Sill, M.; Sahm, F.; Reuss, D.E.; Blattner, M.; Worst, B.; Heilig, C.E.; Beck, K.; et al. Sarcoma classification by DNA methylation profiling. Nat. Commun. 2021, 12, 498. [Google Scholar] [CrossRef]
- Forus, A.; Florenes, V.A.; Maelandsmo, G.M.; Meltzer, P.S.; Fodstad, O.; Myklebost, O. Mapping of amplification units in the q13-14 region of chromosome 12 in human sarcomas: Some amplica do not include MDM2. Cell Growth Differ. 1993, 4, 1065–1070. [Google Scholar]
- Patterson, H.; Barnes, D.; Gill, S.; Spicer, J.; Fisher, C.; Thomas, M.; Grimer, R.; Fletcher, C.; Gusterson, B.; Cooper, C. Amplification and Over-Expression of the MDM2 Gene in Human Soft Tissue Tumours. Sarcoma 1997, 1, 17–22. [Google Scholar] [CrossRef]
- Nakayama, T.; Toguchida, J.; Wadayama, B.; Kanoe, H.; Kotoura, Y.; Sasaki, M.S. MDM2 gene amplification in bone and soft-tissue tumors: Association with tumor progression in differentiated adipose-tissue tumors. Int. J. Cancer 1995, 64, 342–346. [Google Scholar] [CrossRef] [PubMed]
- Fletcher, J.A. Cytogenetics and molecular biology of soft tissue tumors. Monogr. Pathol. 1996, 38, 37–64. [Google Scholar] [PubMed]
- Dor, Y.; Cedar, H. Principles of DNA methylation and their implications for biology and medicine. Lancet 2018, 392, 777–786. [Google Scholar] [CrossRef]
- Capper, D.; Jones, D.T.W.; Sill, M.; Hovestadt, V.; Schrimpf, D.; Sturm, D.; Koelsche, C.; Sahm, F.; Chavez, L.; Reuss, D.E.; et al. DNA methylation-based classification of central nervous system tumours. Nature 2018, 555, 469–474. [Google Scholar] [CrossRef] [PubMed]
- Laird, P.W. The power and the promise of DNA methylation markers. Nat. Rev. Cancer 2003, 3, 253–266. [Google Scholar] [CrossRef]
- Kono, N.; Arakawa, K. Nanopore sequencing: Review of potential applications in functional genomics. Dev. Growth Differ. 2019, 61, 316–326. [Google Scholar] [CrossRef] [PubMed]
- Zhang, J.; Xie, S.; Xu, J.; Liu, H.; Wan, S. Cancer Biomarkers Discovery of Methylation Modification With Direct High-Throughput Nanopore Sequencing. Front. Genet. 2021, 12, 672804. [Google Scholar] [CrossRef]
- Simpson, J.T.; Workman, R.E.; Zuzarte, P.C.; David, M.; Dursi, L.J.; Timp, W. Detecting DNA cytosine methylation using nanopore sequencing. Nat. Methods 2017, 14, 407–410. [Google Scholar] [CrossRef]
- Euskirchen, P.; Bielle, F.; Labreche, K.; Kloosterman, W.P.; Rosenberg, S.; Daniau, M.; Schmitt, C.; Masliah-Planchon, J.; Bourdeaut, F.; Dehais, C.; et al. Same-day genomic and epigenomic diagnosis of brain tumors using real-time nanopore sequencing. Acta Neuropathol. 2017, 134, 691–703. [Google Scholar] [CrossRef]
- Kuschel, L.P.; Hench, J.; Frank, S.; Hench, I.B.; Girard, E.; Blanluet, M.; Masliah-Planchon, J.; Misch, M.; Onken, J.; Czabanka, M.; et al. Robust methylation-based classification of brain tumors using nanopore sequencing. Neuropathol. Appl. Neurobiol. 2023, 49, e12856. [Google Scholar] [CrossRef]
- Pedregosa, F. Scikit-learn: Machine Learning in Python. J. Mach. Learn. Res. 2011, 12, 2825–2830. [Google Scholar]
- Fischer, B.; Smith, M.; Pau, G.; Morgan, M.; van Twisk, D. rhdf5: R Interface to HDF5, R Package version 2.42.0. 2022. Available online: https://github.com/grimbough/rhdf5 (accessed on 29 January 2023).
- Krijthe, R.; van der Maaten, L.R.; Rtsne, L. Rtsne: T-Distributed Stochastic Neighbor Embedding using a Barnes-Hut Implementation. 2015. Available online: https://github.com/jkrijthe/Rtsne (accessed on 29 January 2023).
- Li, H. Minimap2: Pairwise alignment for nucleotide sequences. Bioinformatics 2018, 34, 3094–3100. [Google Scholar] [CrossRef] [PubMed]
- Ellison, D.W.; Kocak, M.; Figarella-Branger, D.; Felice, G.; Catherine, G.; Pietsch, T.; Frappaz, D.; Massimino, M.; Grill, J.; Boyett, J.M.; et al. Histopathological grading of pediatric ependymoma: Reproducibility and clinical relevance in European trial cohorts. J. Negat. Results BioMed. 2011, 10, 7. [Google Scholar] [CrossRef] [PubMed]
- Muschkin, C.G.; Patterson, C.J. Aging trends—Puerto Rico. J. Cross Cult. Gerontol. 1997, 12, 373–385. [Google Scholar] [CrossRef]
- Stupp, R.; Hegi, M.E.; Mason, W.P.; van den Bent, M.J.; Taphoorn, M.J.; Janzer, R.C.; Ludwin, S.K.; Allgeier, A.; Fisher, B.; Belanger, K.; et al. Effects of radiotherapy with concomitant and adjuvant temozolomide versus radiotherapy alone on survival in glioblastoma in a randomised phase III study: 5-year analysis of the EORTC-NCIC trial. Lancet Oncol. 2009, 10, 459–466. [Google Scholar] [CrossRef]
- Pembaur, A.; Sallard, E.; Weil, P.P.; Ortelt, J.; Ahmad-Nejad, P.; Postberg, J. Simplified Point-of-Care Full SARS-CoV-2 Genome Sequencing Using Nanopore Technology. Microorganisms 2021, 9, 2598. [Google Scholar] [CrossRef]
- Chavala, S.H.; Kim, Y.; Tudisco, L.; Cicatiello, V.; Milde, T.; Kerur, N.; Claros, N.; Yanni, S.; Guaiquil, V.H.; Hauswirth, W.W.; et al. Retinal angiogenesis suppression through small molecule activation of p53. J. Clin. Invest. 2013, 123, 4170–4181. [Google Scholar] [CrossRef]
- Koelsche, C.; von Deimling, A. Methylation classifiers: Brain tumors, sarcomas, and what’s next. Genes Chromosomes Cancer 2022, 61, 346–355. [Google Scholar] [CrossRef]
- Sbaraglia, M.; Righi, A.; Gambarotti, M.; Dei Tos, A.P. Ewing sarcoma and Ewing-like tumors. Virchows Arch. 2020, 476, 109–119. [Google Scholar] [CrossRef]
- Antonescu, C.R.; Owosho, A.A.; Zhang, L.; Chen, S.; Deniz, K.; Huryn, J.M.; Kao, Y.C.; Huang, S.C.; Singer, S.; Tap, W.; et al. Sarcomas With CIC-rearrangements Are a Distinct Pathologic Entity With Aggressive Outcome: A Clinicopathologic and Molecular Study of 115 Cases. Am. J. Surg. Pathol. 2017, 41, 941–949. [Google Scholar] [CrossRef]
- Yoshida, A.; Goto, K.; Kodaira, M.; Kobayashi, E.; Kawamoto, H.; Mori, T.; Yoshimoto, S.; Endo, O.; Kodama, N.; Kushima, R.; et al. CIC-rearranged Sarcomas: A Study of 20 Cases and Comparisons With Ewing Sarcomas. Am. J. Surg. Pathol. 2016, 40, 313–323. [Google Scholar] [CrossRef] [PubMed]
- Sbaraglia, M.; Bellan, E.; Dei Tos, A.P. The 2020 WHO Classification of Soft Tissue Tumours: News and perspectives. Pathologica 2021, 113, 70–84. [Google Scholar] [CrossRef] [PubMed]

| Sample | Max Calibrated Meth. Class | Pathology | Pathology Meth. Class | Concordance | Max Confidence Score | Mean Read Length | Mean Coverage | MDM2 Ampl. | t-SNE Agreed Cluster |
|---|---|---|---|---|---|---|---|---|---|
| SARC-01 | WDLS/DDLS | Well differentiated liposarcoma | WDLS/DDLS | C | 0.09 | 5192 | 0.43 | Y | Y |
| SARC-02 | MLS | myxoid liposarcoma | MLS | C | 0.30 | 5038 | 6.4 | Y | |
| SARC-03 | LMS | leiomyosarcoma | LMS | C | 0.21 | 5679 | 1.78 | Y | |
| SARC-04 | USARC | Undifferentiated small round spindle cell sarcoma | USARC | C | 0.08 | 1957 | 0.08 | ||
| SARC-05 | EMCS | Extraskeletal myxoid chondrosarcoma | EMCS | C | 0.88 | 4537 | 0.11 | Y | |
| SARC-06 | WDLS/DDLS | Dedifferentiated liposarcoma | WDLS/DDLS | C | 0.08 | 1310 | 0.05 | Y | Y |
| SARC-08 | WDLS/DDLS | Well differentiated liposarcoma | WDLS/DDLS | C | 0.10 | 5121 | 0.03 | ||
| SARC-09 | WDLS/DDLS | Highly suspicious for well differentiated liposarcoma | WDLS/DDLS | C | 0.45 | 5564 | 0.07 | Y | Y |
| SARC-10 | EWS | Ewing´s sarcoma | EWS | C | 0.14 | 3081 | 0.06 | Y | |
| SARC-11 | WDLS/DDLS | Well differentiated liposarcoma | WDLS/DDLS | C | 0.15 | 5244 | 0.04 | Y | Y |
| SARC-17 | MLS | Myxoid liposarcoma | MLS | C | 0.36 | 5900 | 0.06 | Y | |
| SARC-18 | CSA (A) | Chondrosarcoma | CSA (A) | C | 0.53 | 2638 | 0.05 | Y | |
| SARC-19 | WDLS/DDLS | Well differentiated liposarcoma | WDLS/DDLS | C | 0.14 | 7078 | 0.05 | Y | Y |
| SARC-21 | SYSA | synovial sarcoma | SYSA | C | 0.23 | 2623 | 0.04 | Y | |
| SARC-13 | MPNST | chondrosarcoma | CHORD | D | 0.04 | 1774 | 0.06 | ||
| SARC-12 | WDLS/DDLS | Myxofibrosarcoma | USARC | D | 0.07 | 3072 | 0.06 | Y | |
| SARC-22 | AFH | Myxofibrosarcoma | USARC | D | 0.04 | 2749 | 0.04 | ||
| SARC-07 | EWS | Unclassified spindle-round cell sarcoma | SRBCS | D | 0.91 | 2830 | 0.08 | Y |
Disclaimer/Publisher’s Note: The statements, opinions and data contained in all publications are solely those of the individual author(s) and contributor(s) and not of MDPI and/or the editor(s). MDPI and/or the editor(s) disclaim responsibility for any injury to people or property resulting from any ideas, methods, instructions or products referred to in the content. |
© 2023 by the authors. Licensee MDPI, Basel, Switzerland. This article is an open access article distributed under the terms and conditions of the Creative Commons Attribution (CC BY) license (https://creativecommons.org/licenses/by/4.0/).
Share and Cite
Iluz, A.; Maoz, M.; Lavi, N.; Charbit, H.; Or, O.; Olshinka, N.; Demma, J.A.; Adileh, M.; Wygoda, M.; Blumenfeld, P.; et al. Rapid Classification of Sarcomas Using Methylation Fingerprint: A Pilot Study. Cancers 2023, 15, 4168. https://doi.org/10.3390/cancers15164168
Iluz A, Maoz M, Lavi N, Charbit H, Or O, Olshinka N, Demma JA, Adileh M, Wygoda M, Blumenfeld P, et al. Rapid Classification of Sarcomas Using Methylation Fingerprint: A Pilot Study. Cancers. 2023; 15(16):4168. https://doi.org/10.3390/cancers15164168
Chicago/Turabian StyleIluz, Aviel, Myriam Maoz, Nir Lavi, Hanna Charbit, Omer Or, Noam Olshinka, Jonathan Abraham Demma, Mohammad Adileh, Marc Wygoda, Philip Blumenfeld, and et al. 2023. "Rapid Classification of Sarcomas Using Methylation Fingerprint: A Pilot Study" Cancers 15, no. 16: 4168. https://doi.org/10.3390/cancers15164168
APA StyleIluz, A., Maoz, M., Lavi, N., Charbit, H., Or, O., Olshinka, N., Demma, J. A., Adileh, M., Wygoda, M., Blumenfeld, P., Gliner-Ron, M., Azraq, Y., Moss, J., Peretz, T., Eden, A., Zick, A., & Lavon, I. (2023). Rapid Classification of Sarcomas Using Methylation Fingerprint: A Pilot Study. Cancers, 15(16), 4168. https://doi.org/10.3390/cancers15164168