


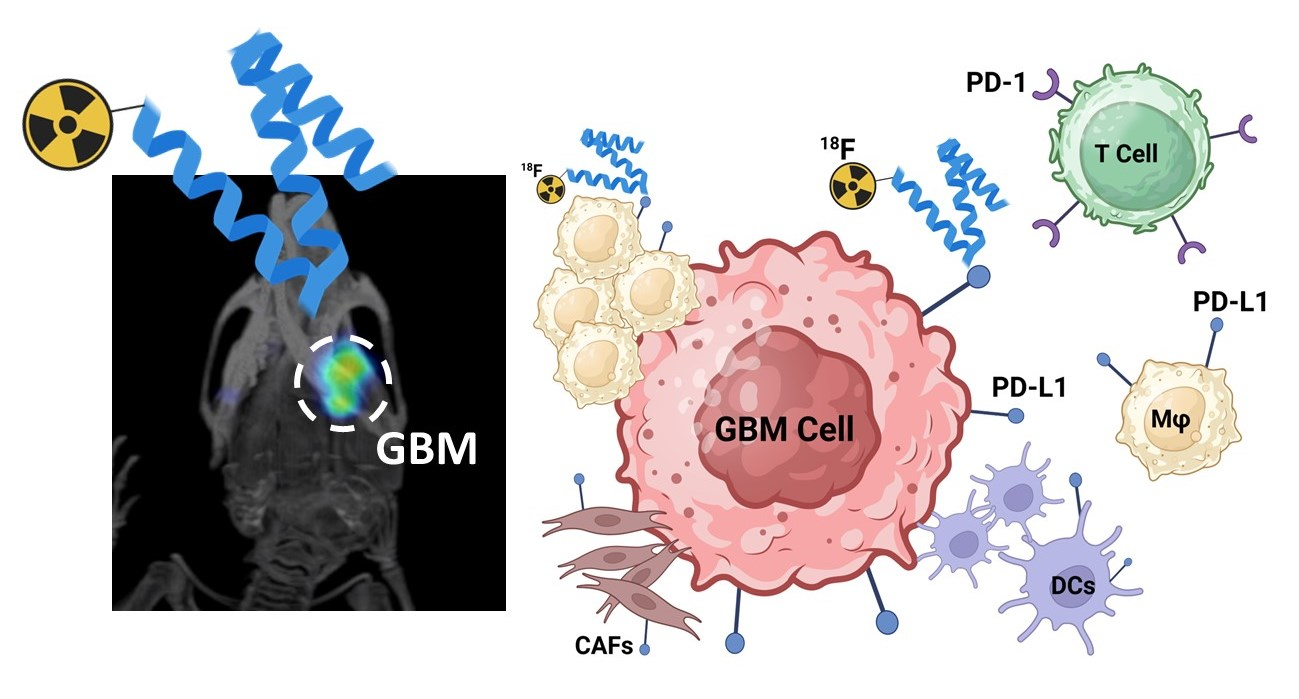
Immuno-PET Imaging of Tumour PD-L1 Expression in Glioblastoma

 , and
, and 
Abstract
Simple Summary
Abstract

1. Introduction
2. Materials and Methods
2.1. General
2.2. Preparation of 18F-AlF-NOTA-ZPD-L1 and 68Ga-NOTA-ZPD-L1
2.3. Cell Lines and Tumours
2.4. Flow Analysis of PD-L1 Expression
2.5. 18F-AlF-NOTA-ZPD-L1 and 68Ga-NOTA-ZPD-L1 In Vitro Studies
2.6. Mouse Models
2.7. 18F-AlF-NOTA-ZPD-L1 and 68Ga-NOTA-ZPD-L1 In Vivo Imaging and Ex Vivo Studies
2.8. Ex Vivo Immunohistochemistry
2.9. Statistical Analysis
3. Results
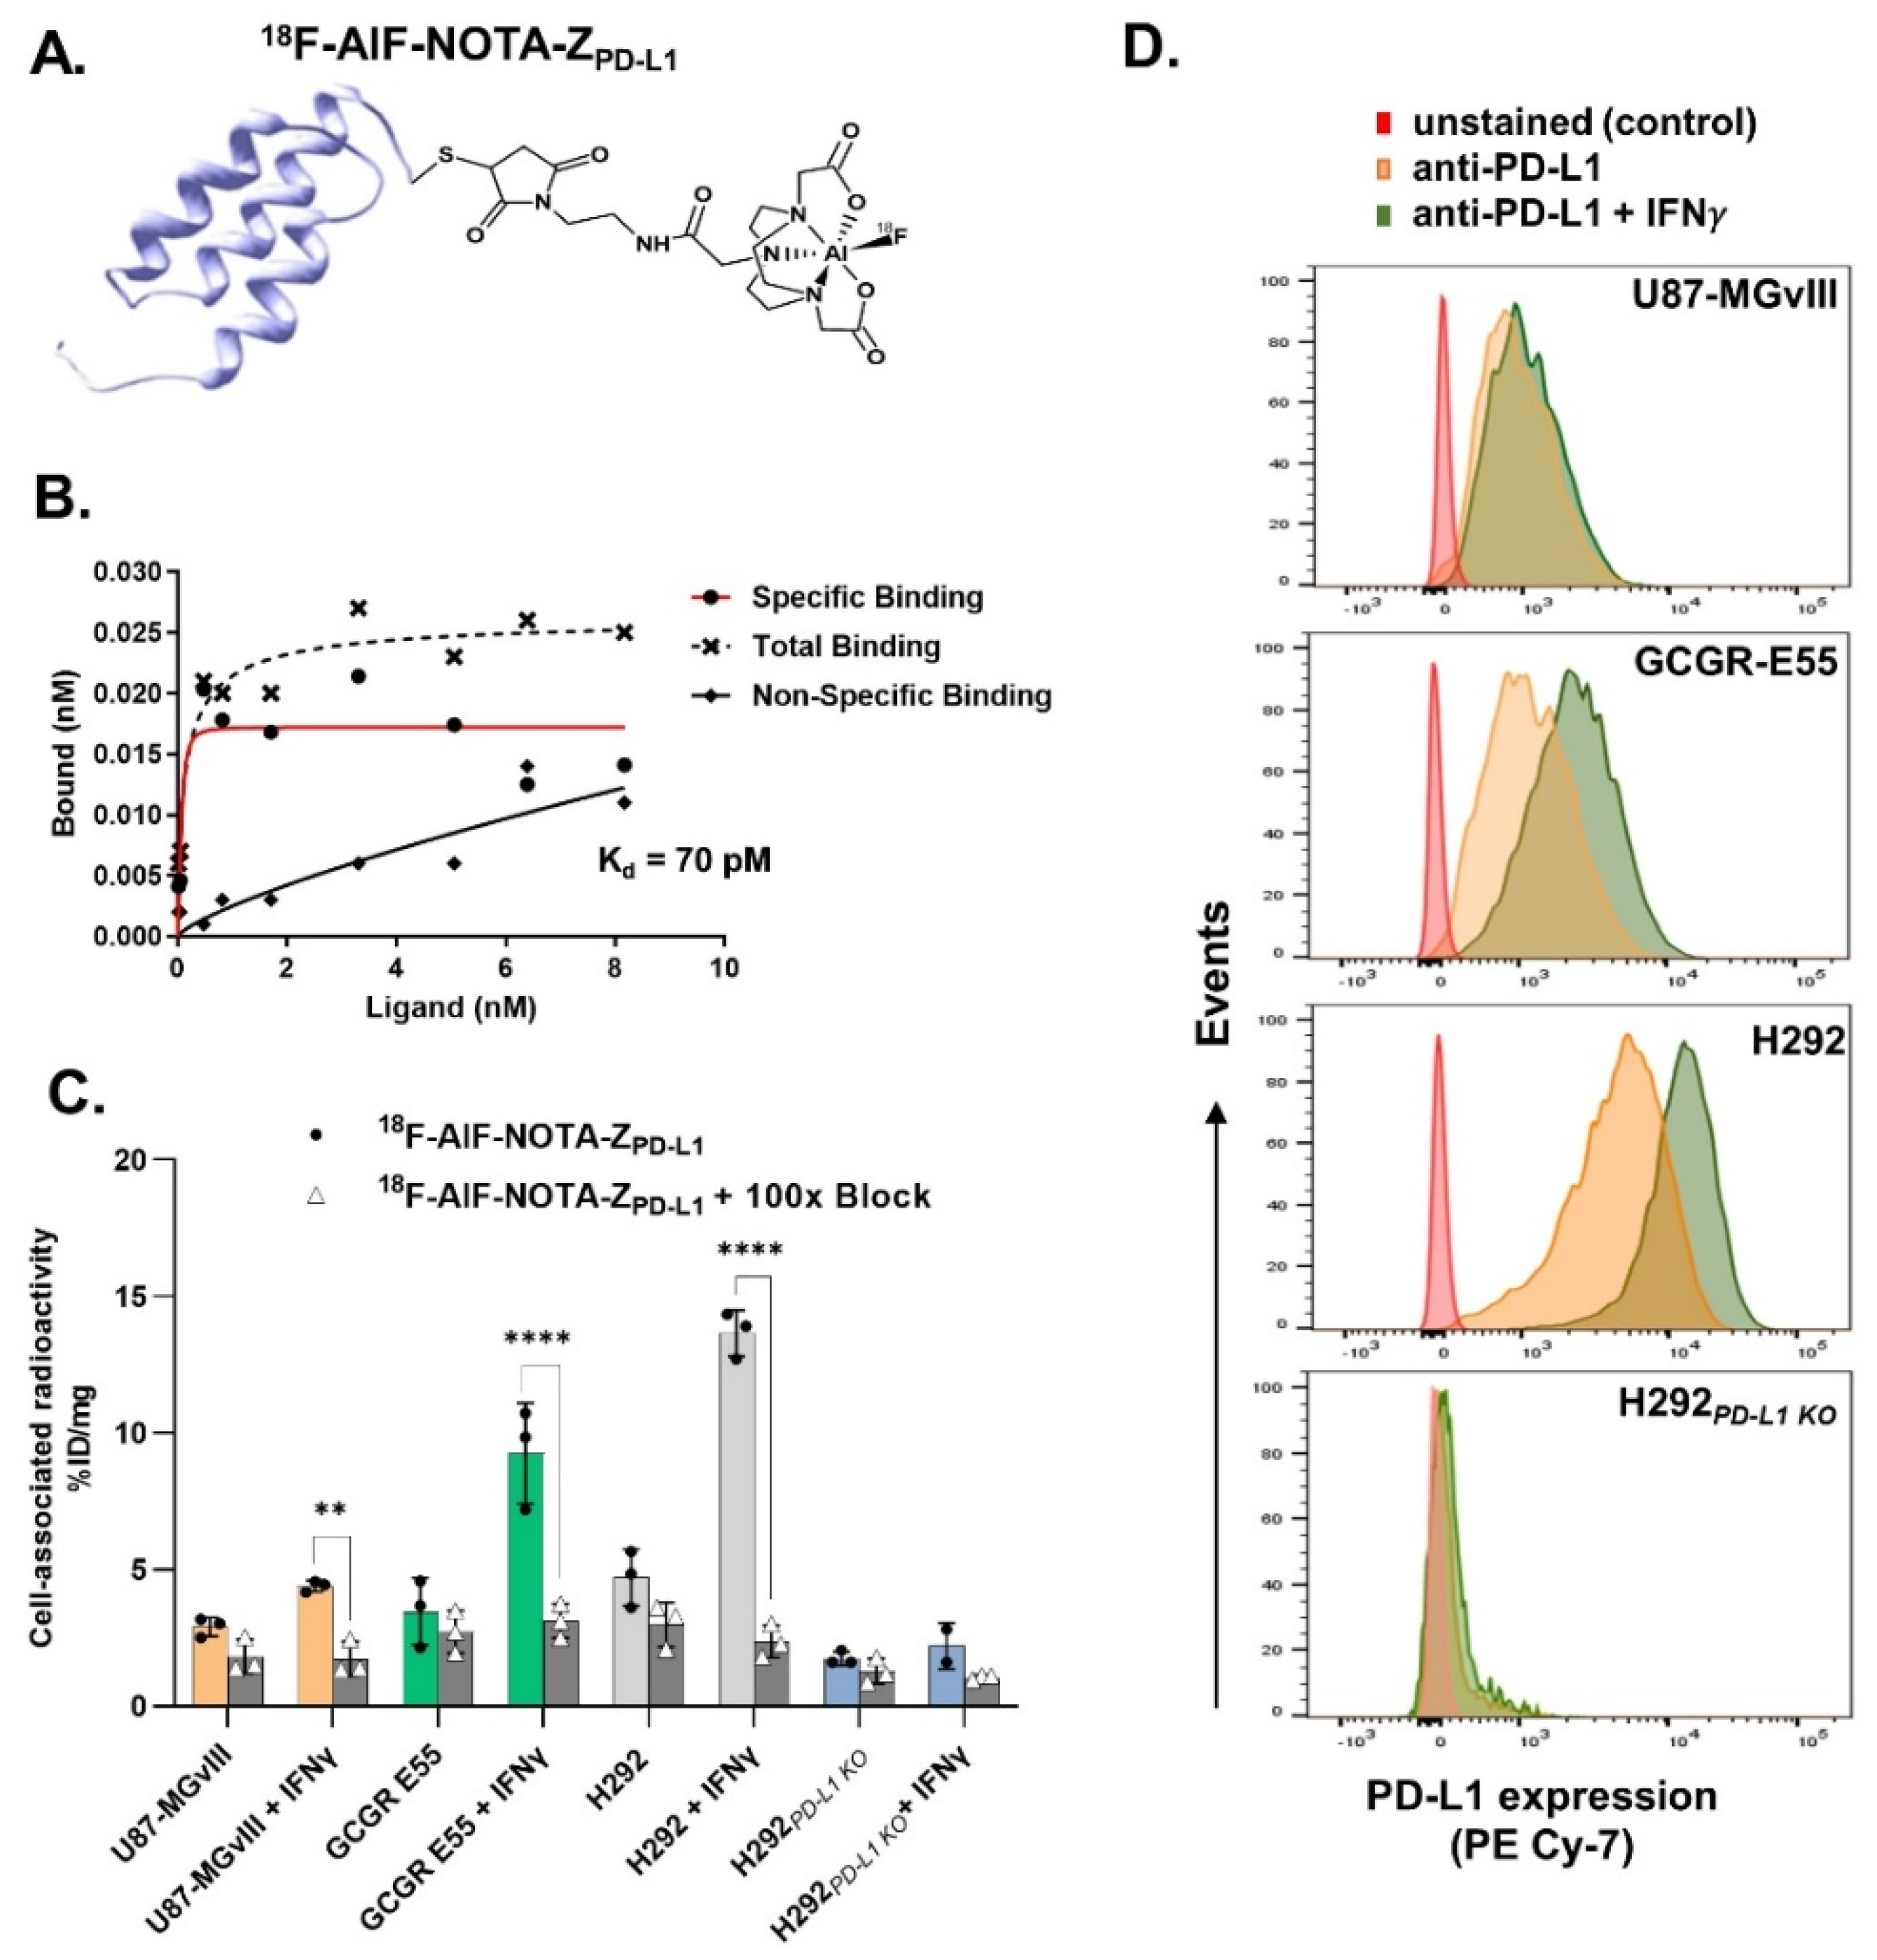
3.1. Radiolabelling
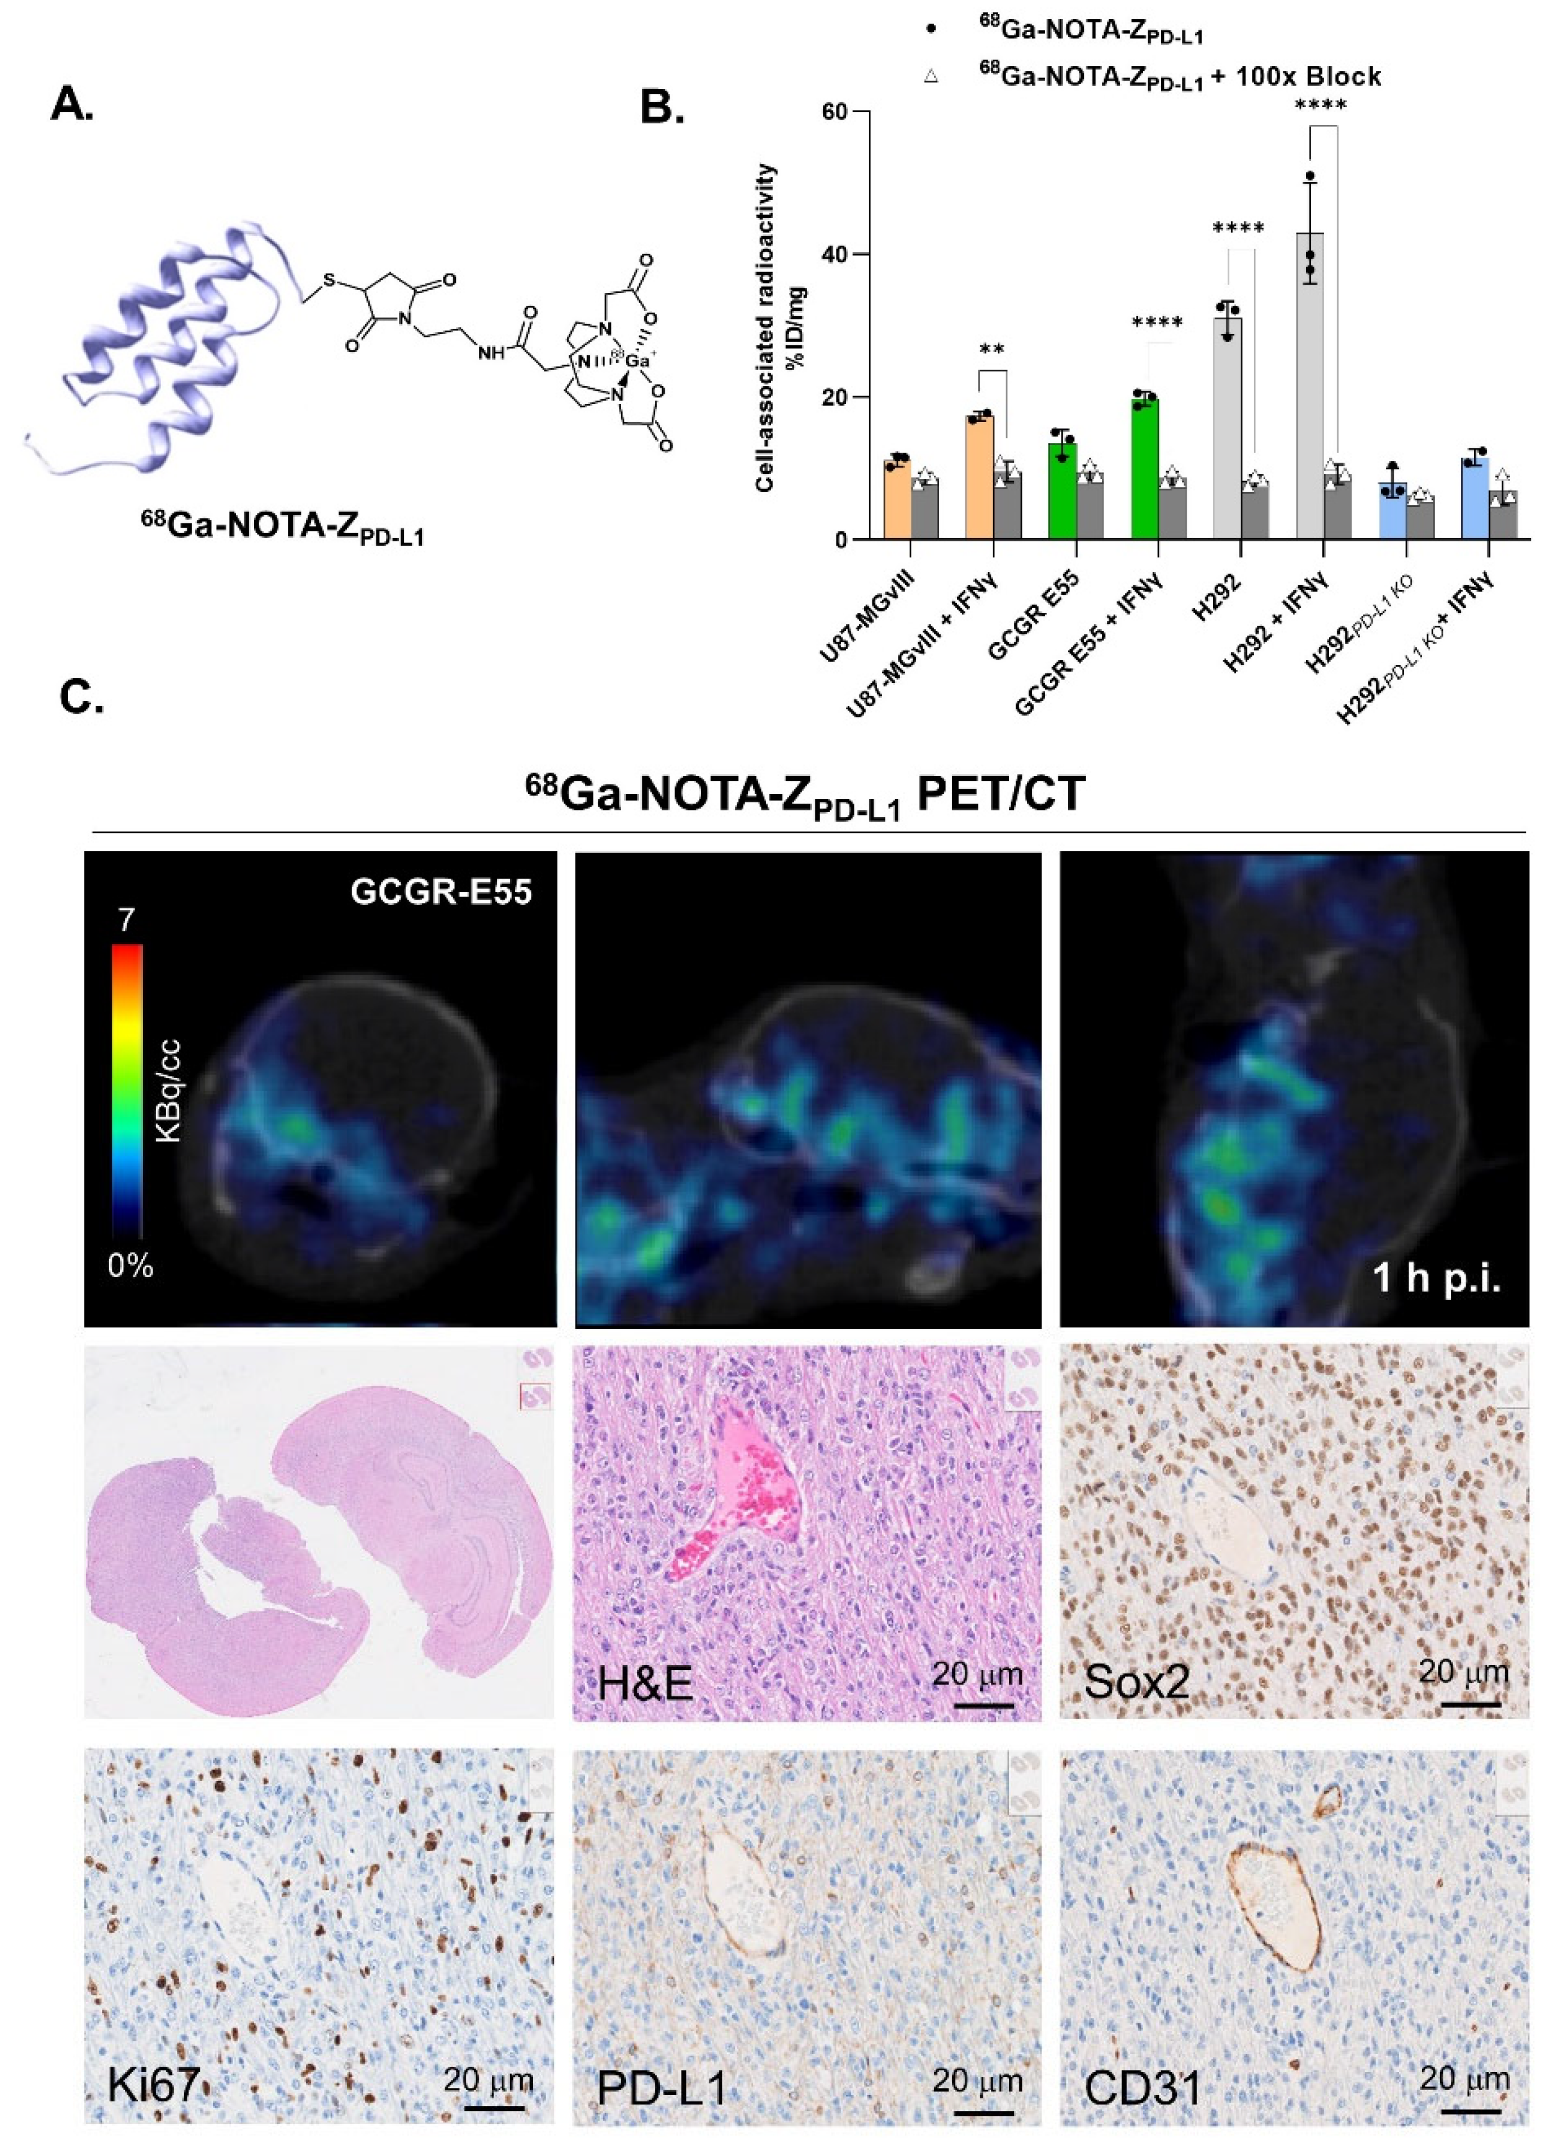
3.2. In Vitro Evaluation of the Radioconjugates
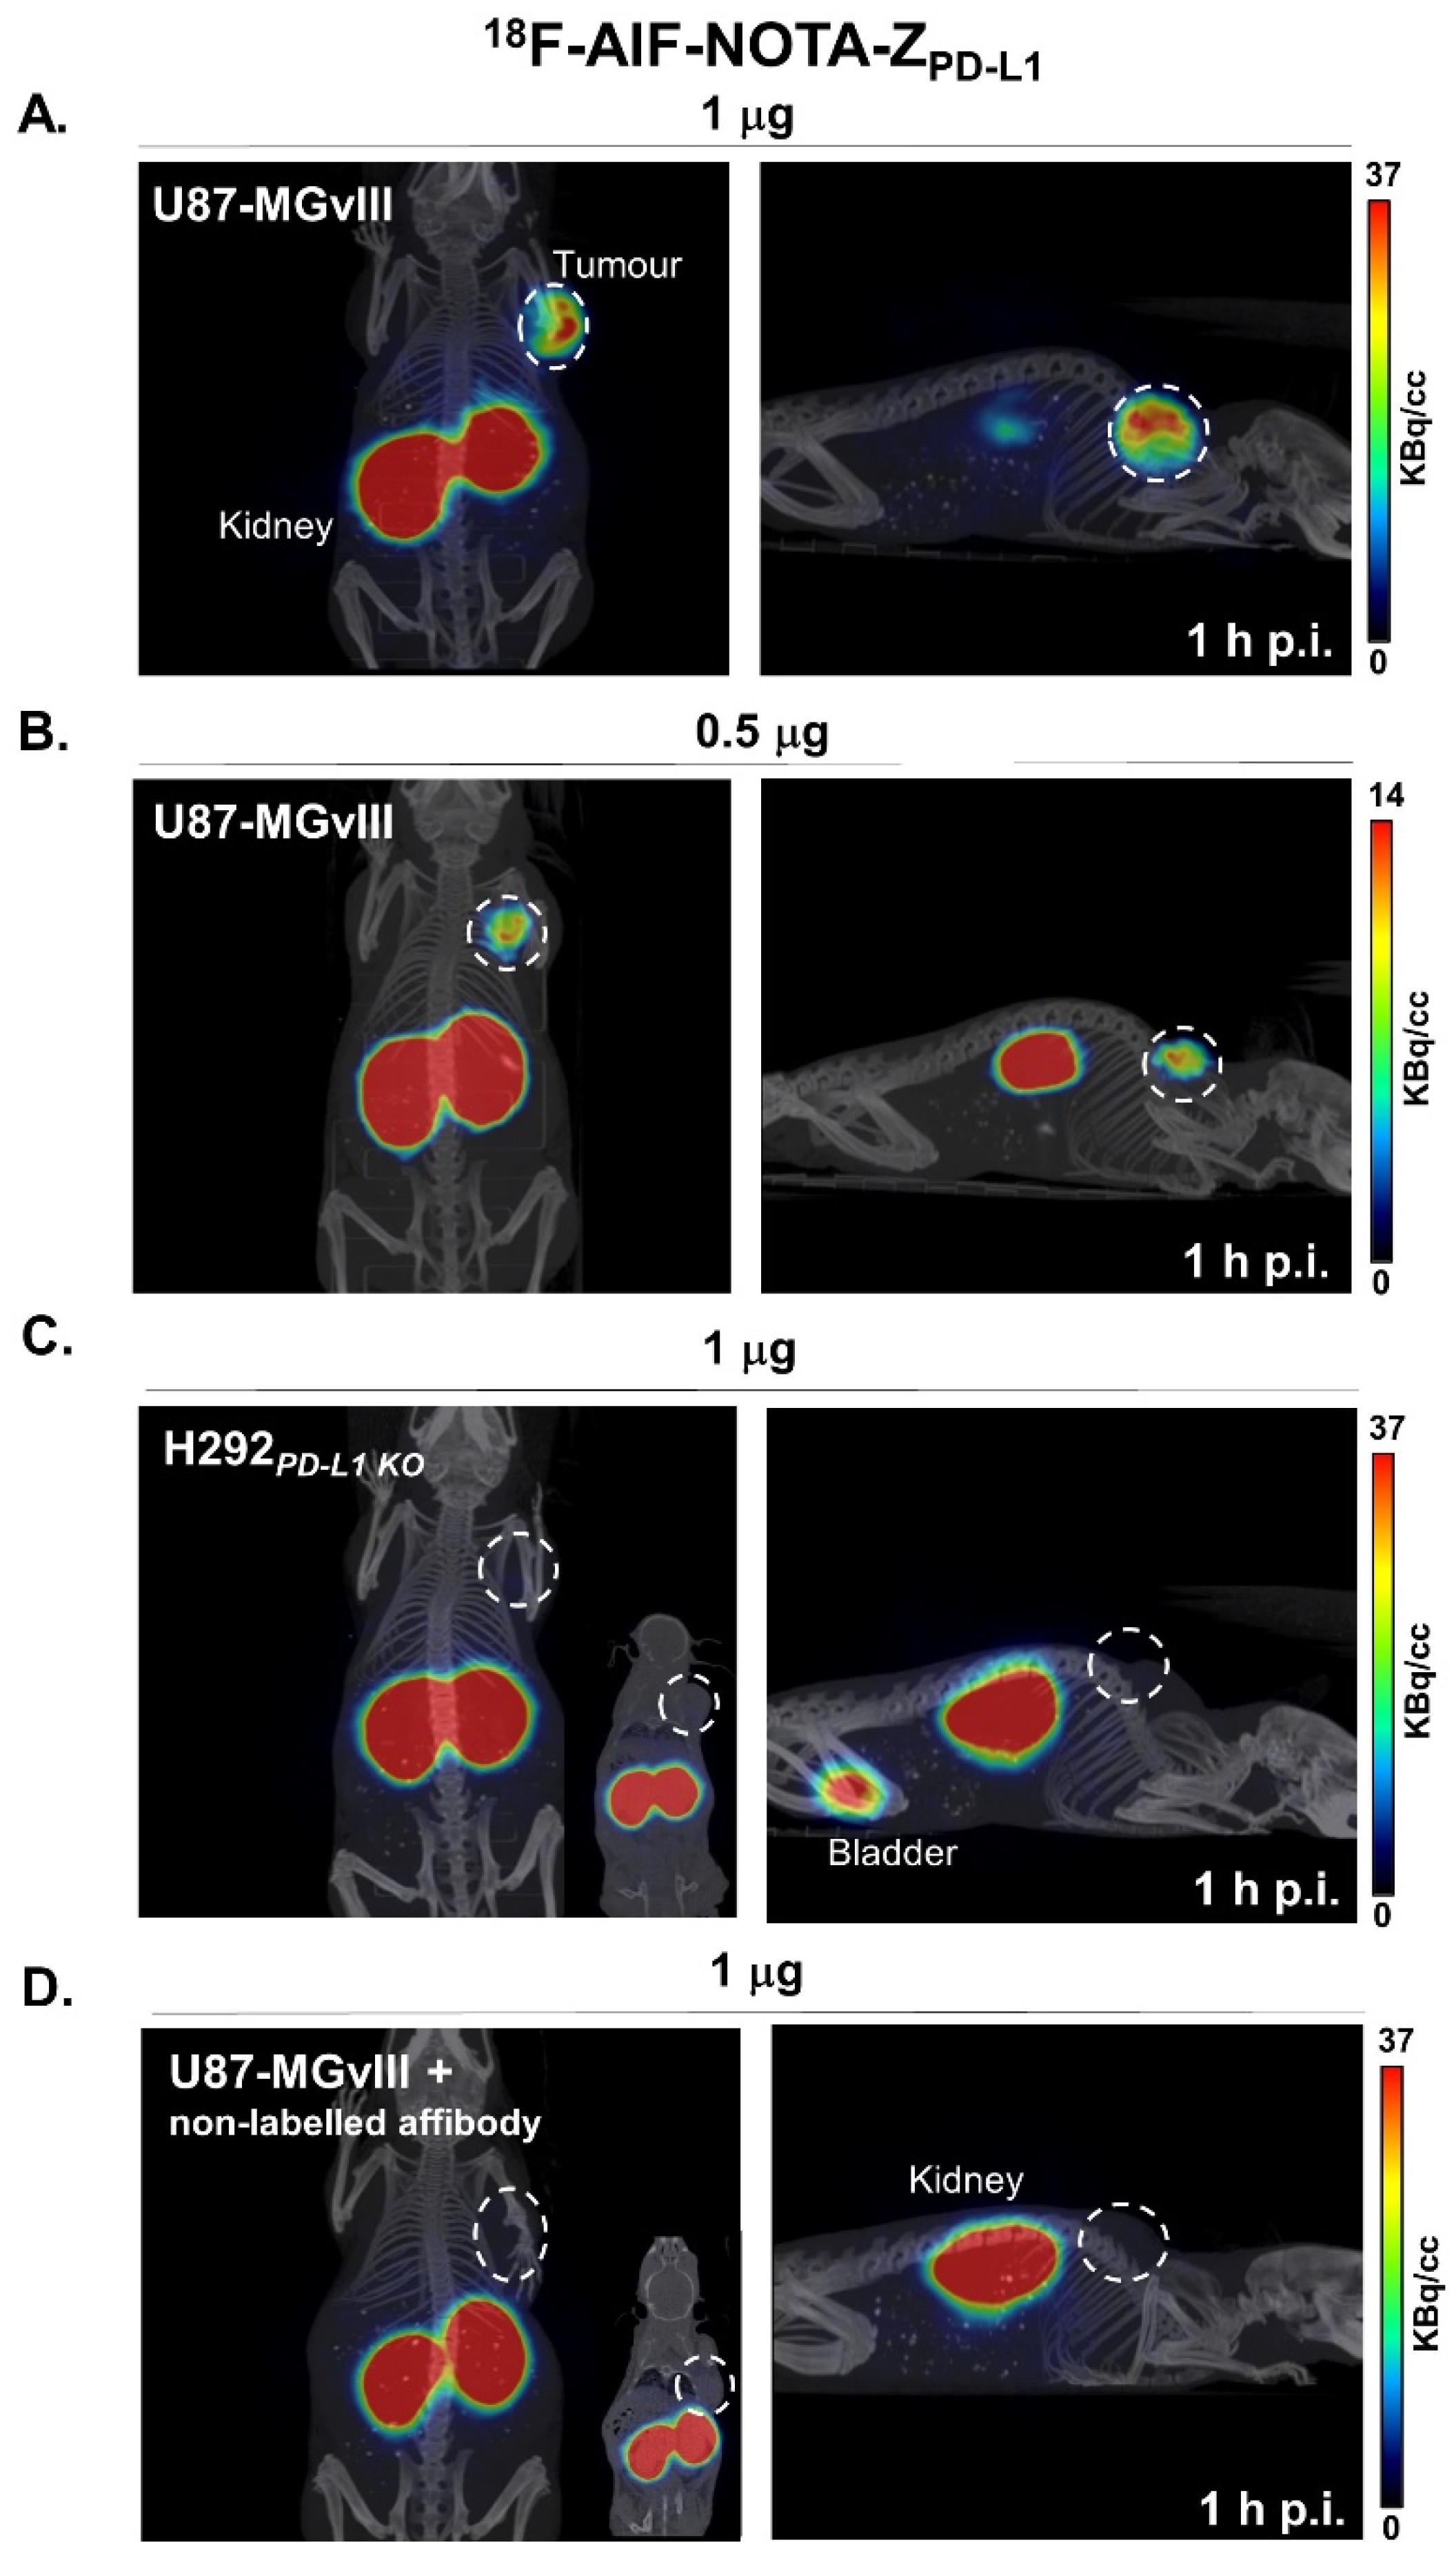
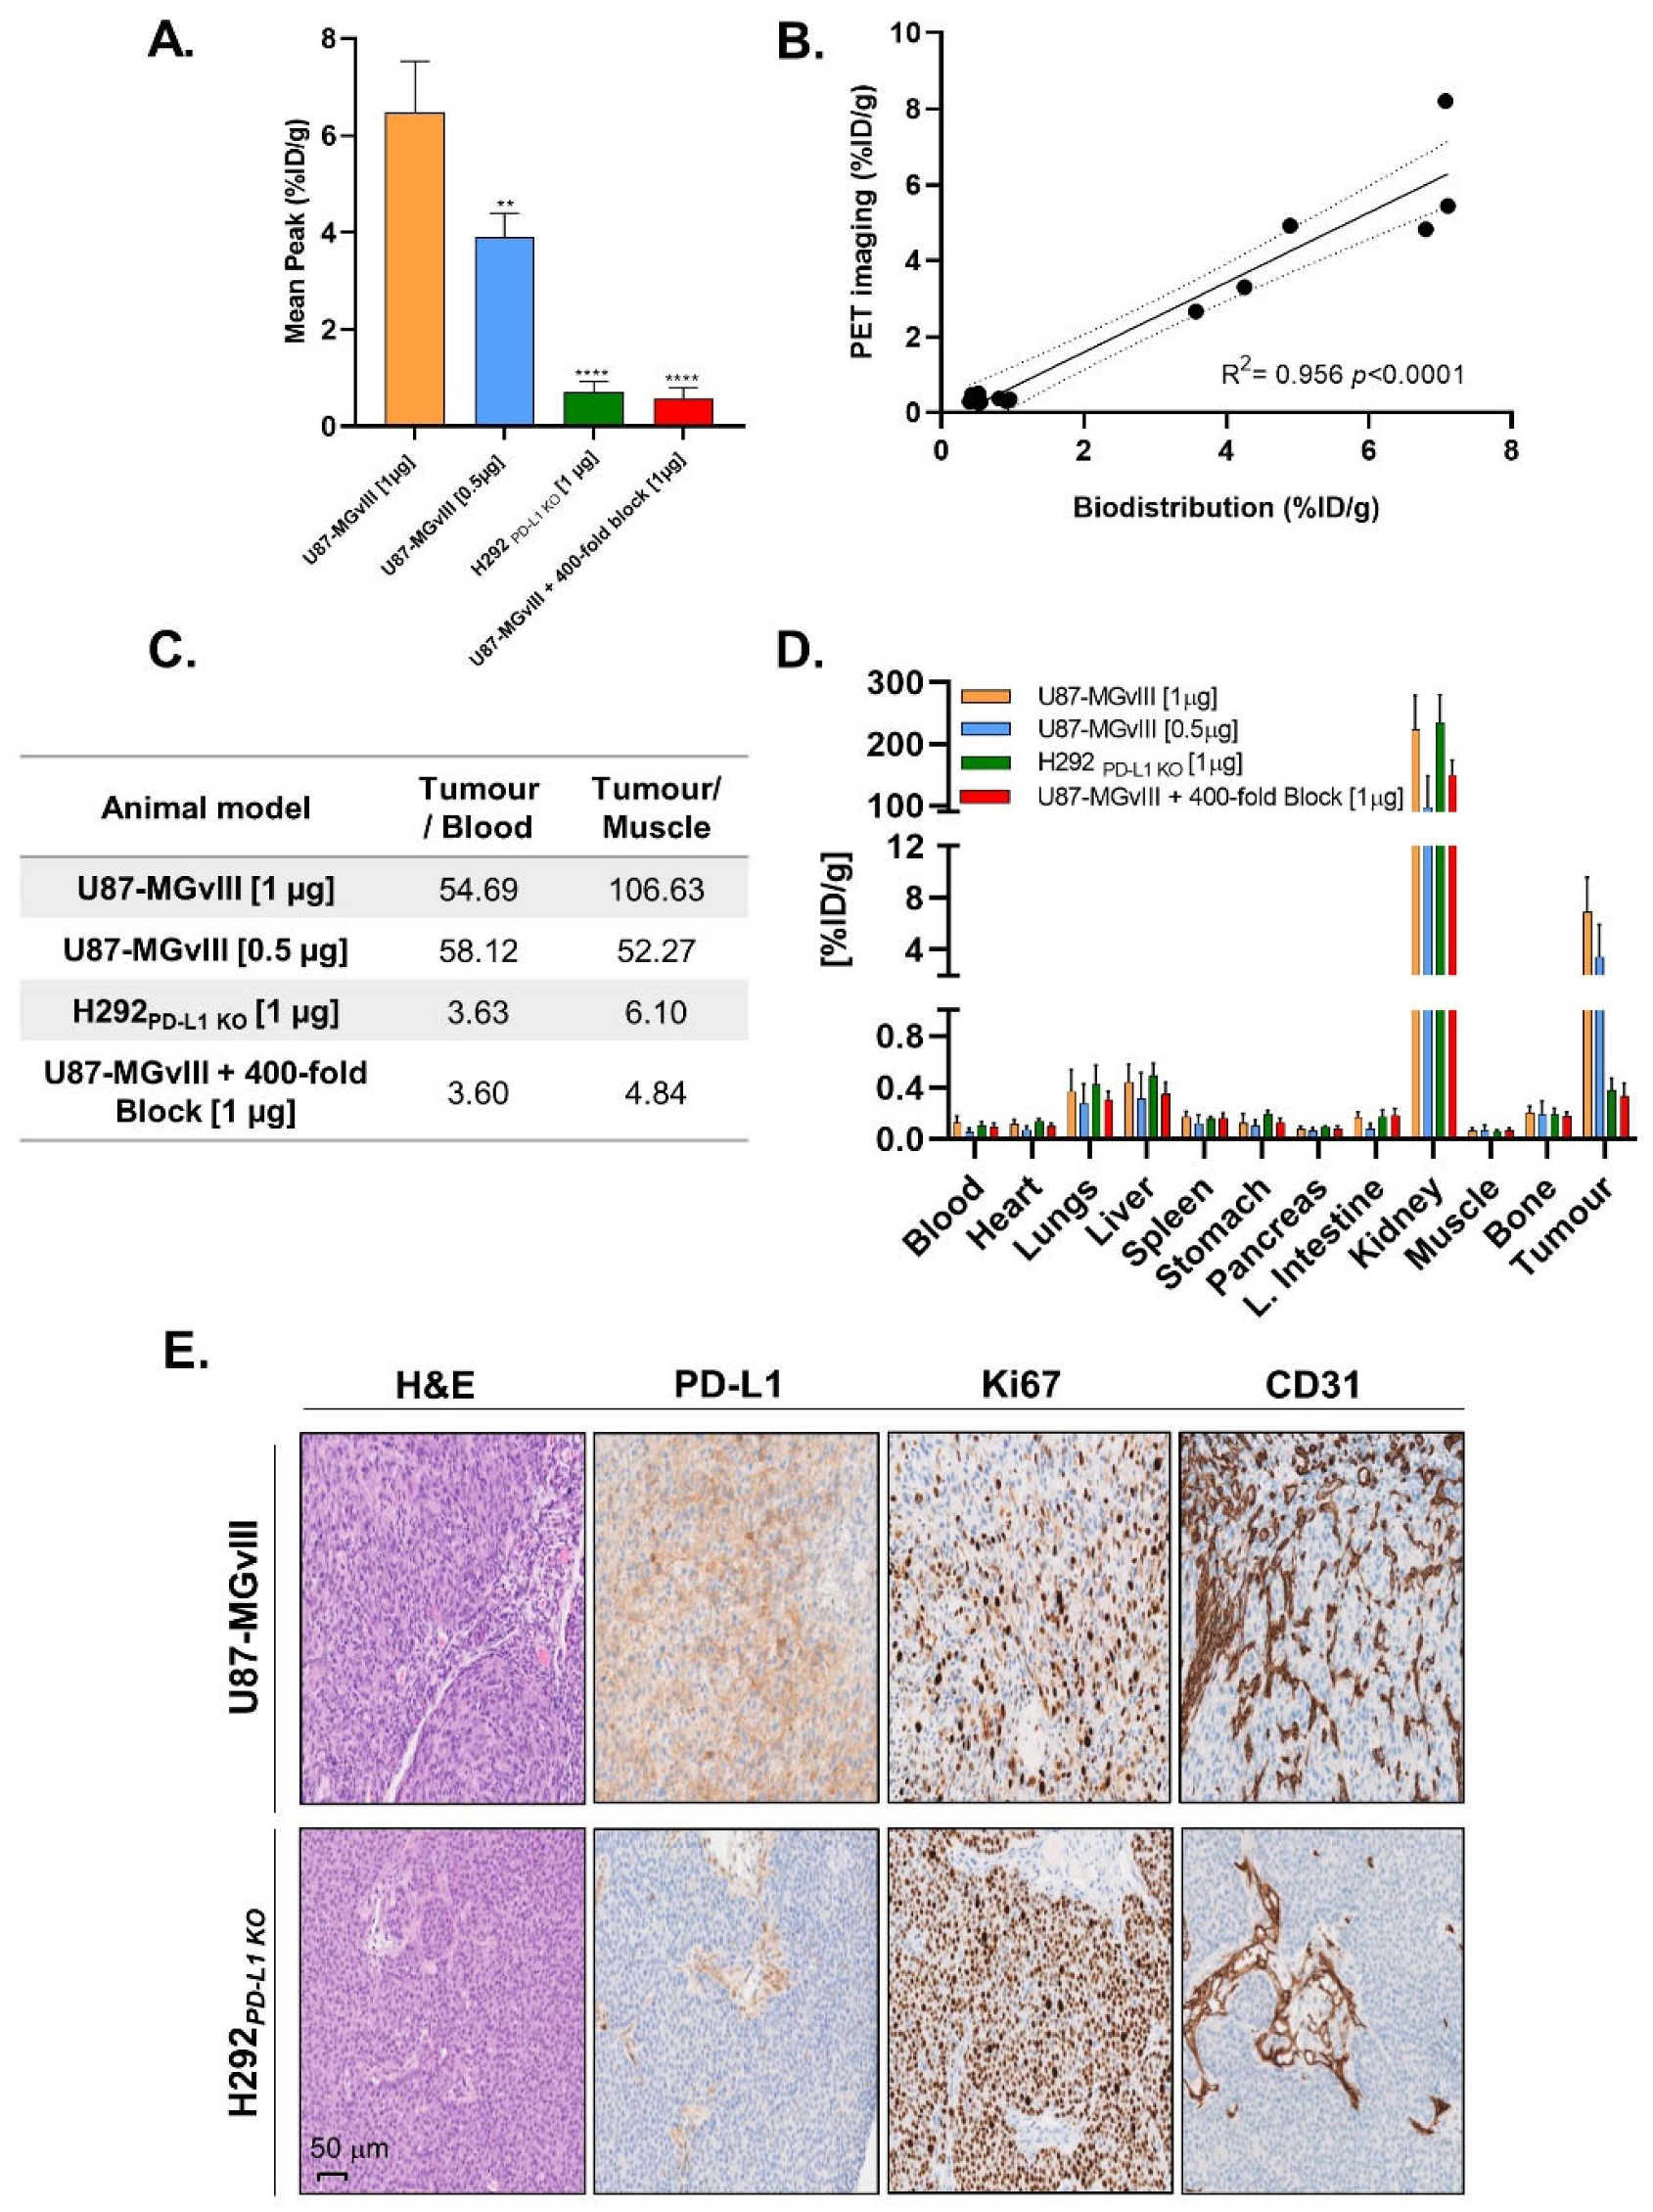
3.3. PD-L1-Specific Radioconjugates Accumulation In Vivo
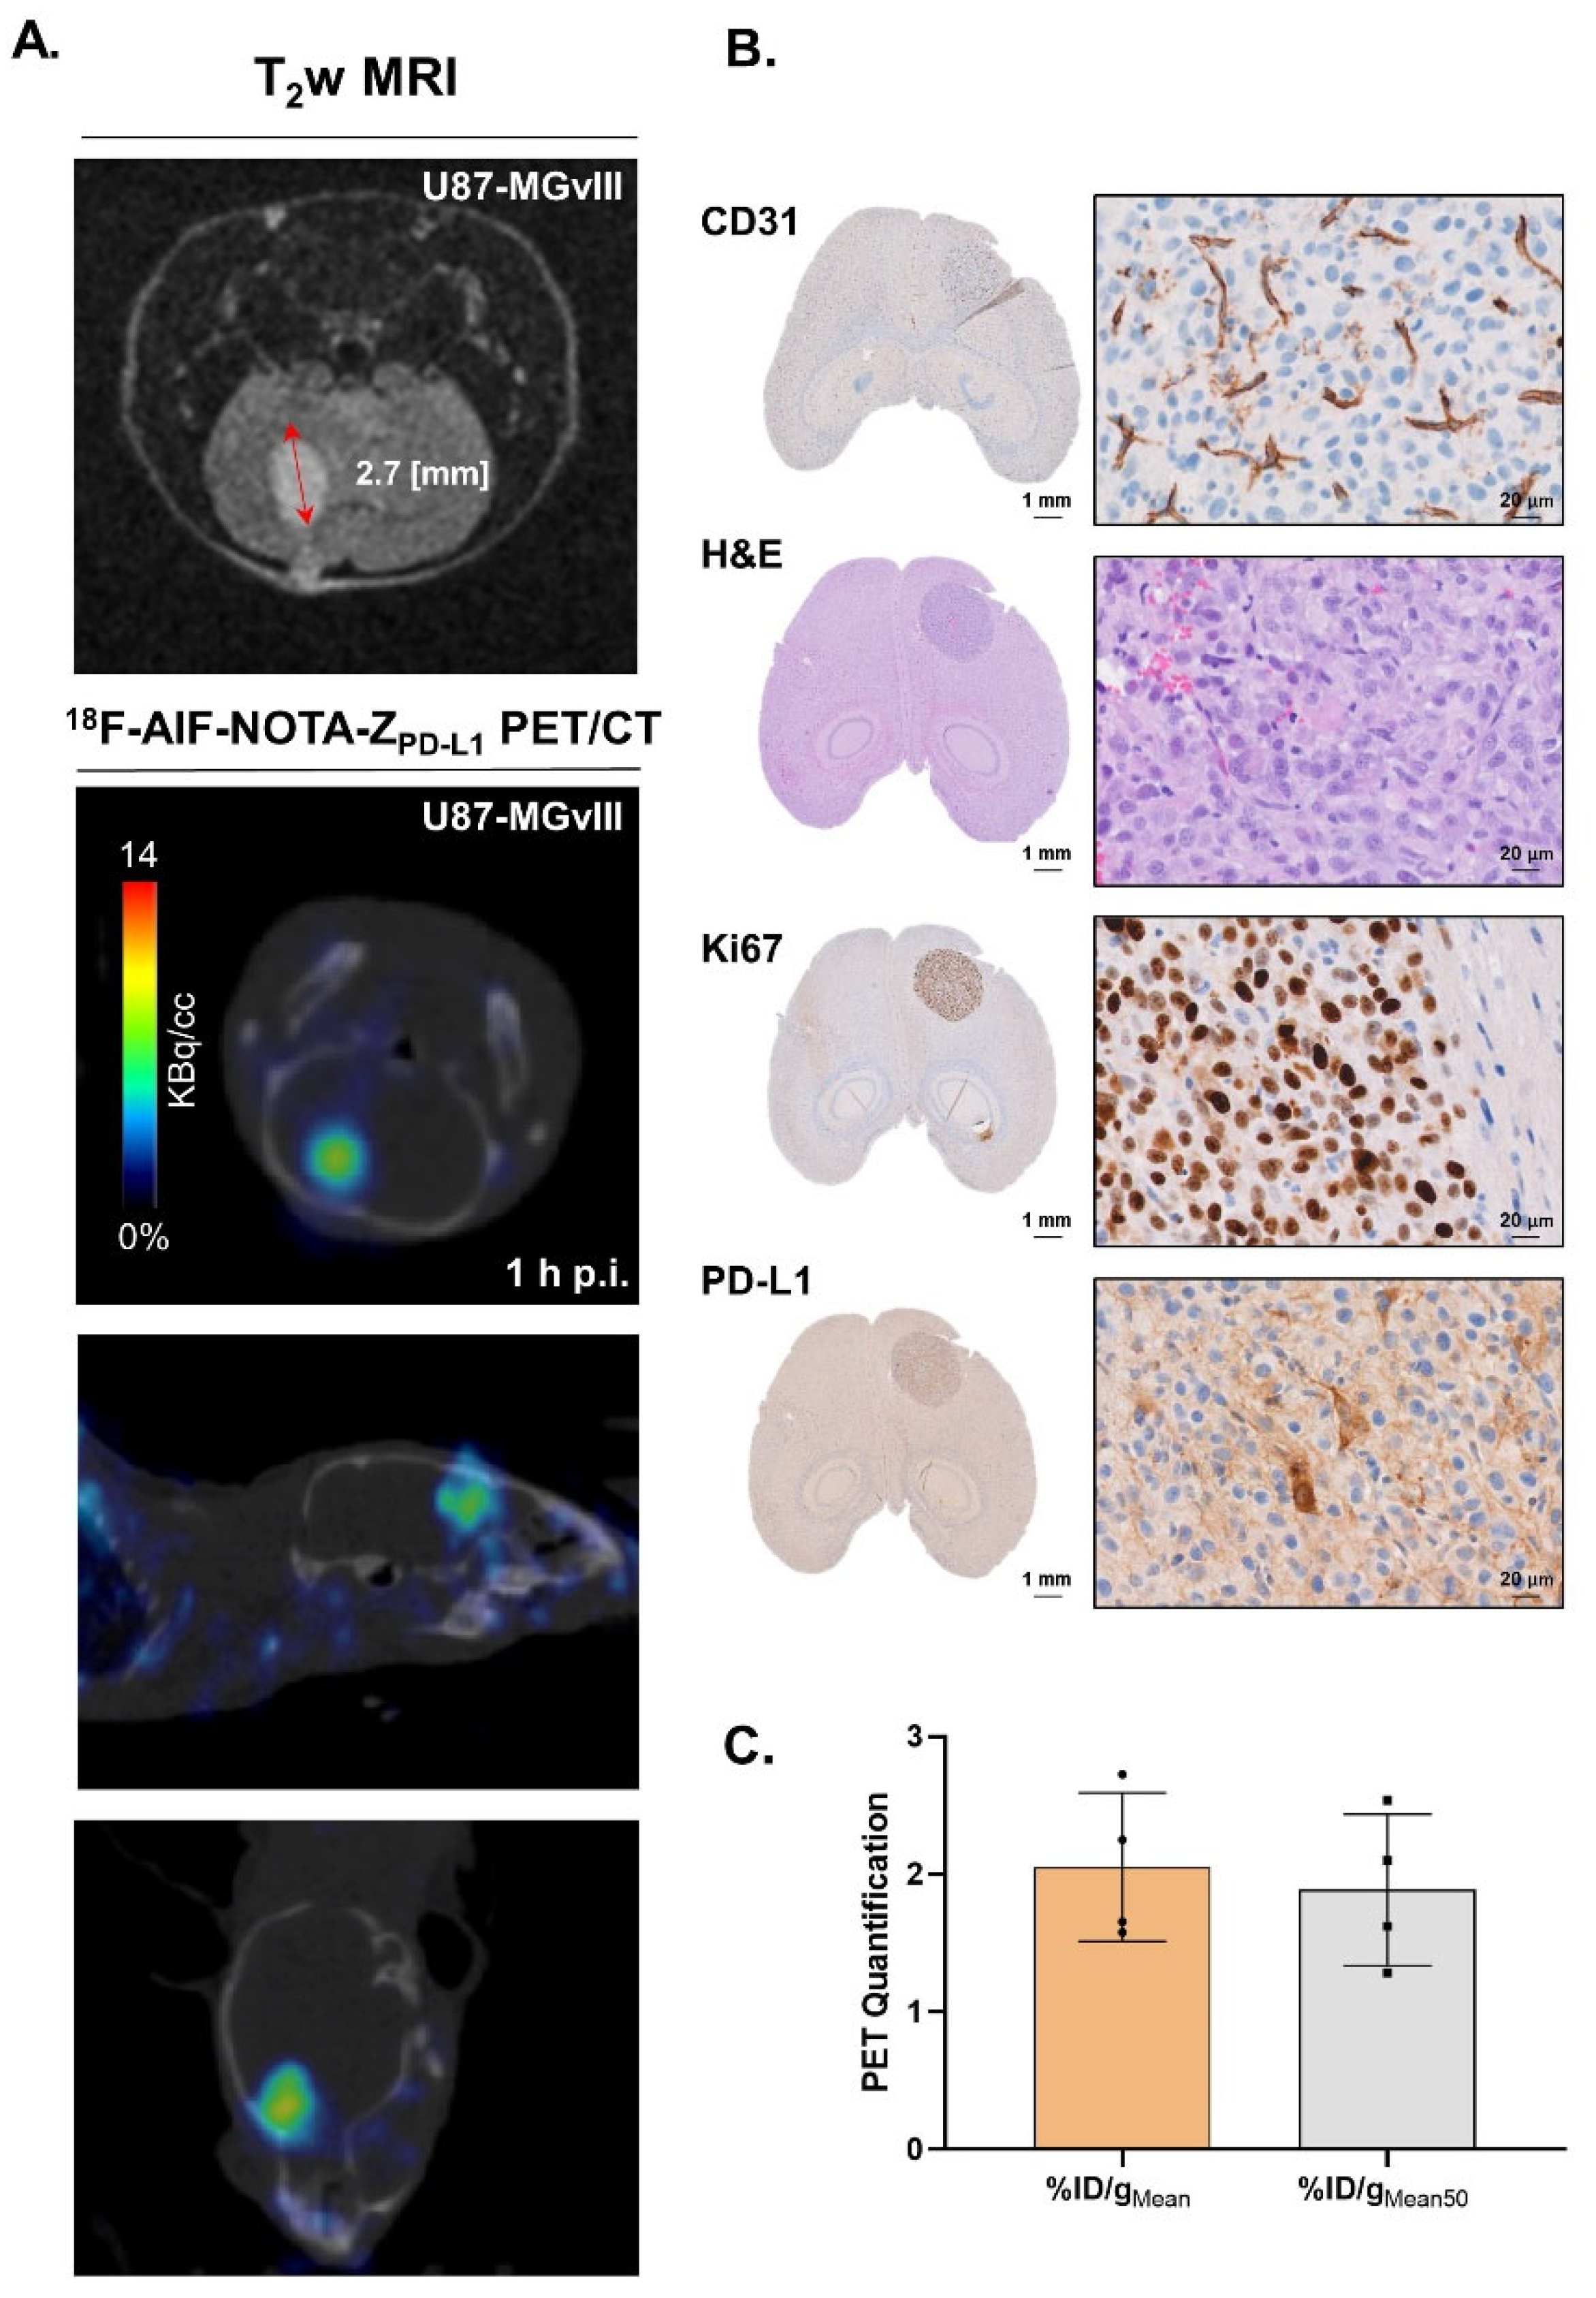
3.4. Targeting PD-L1 in the Brain
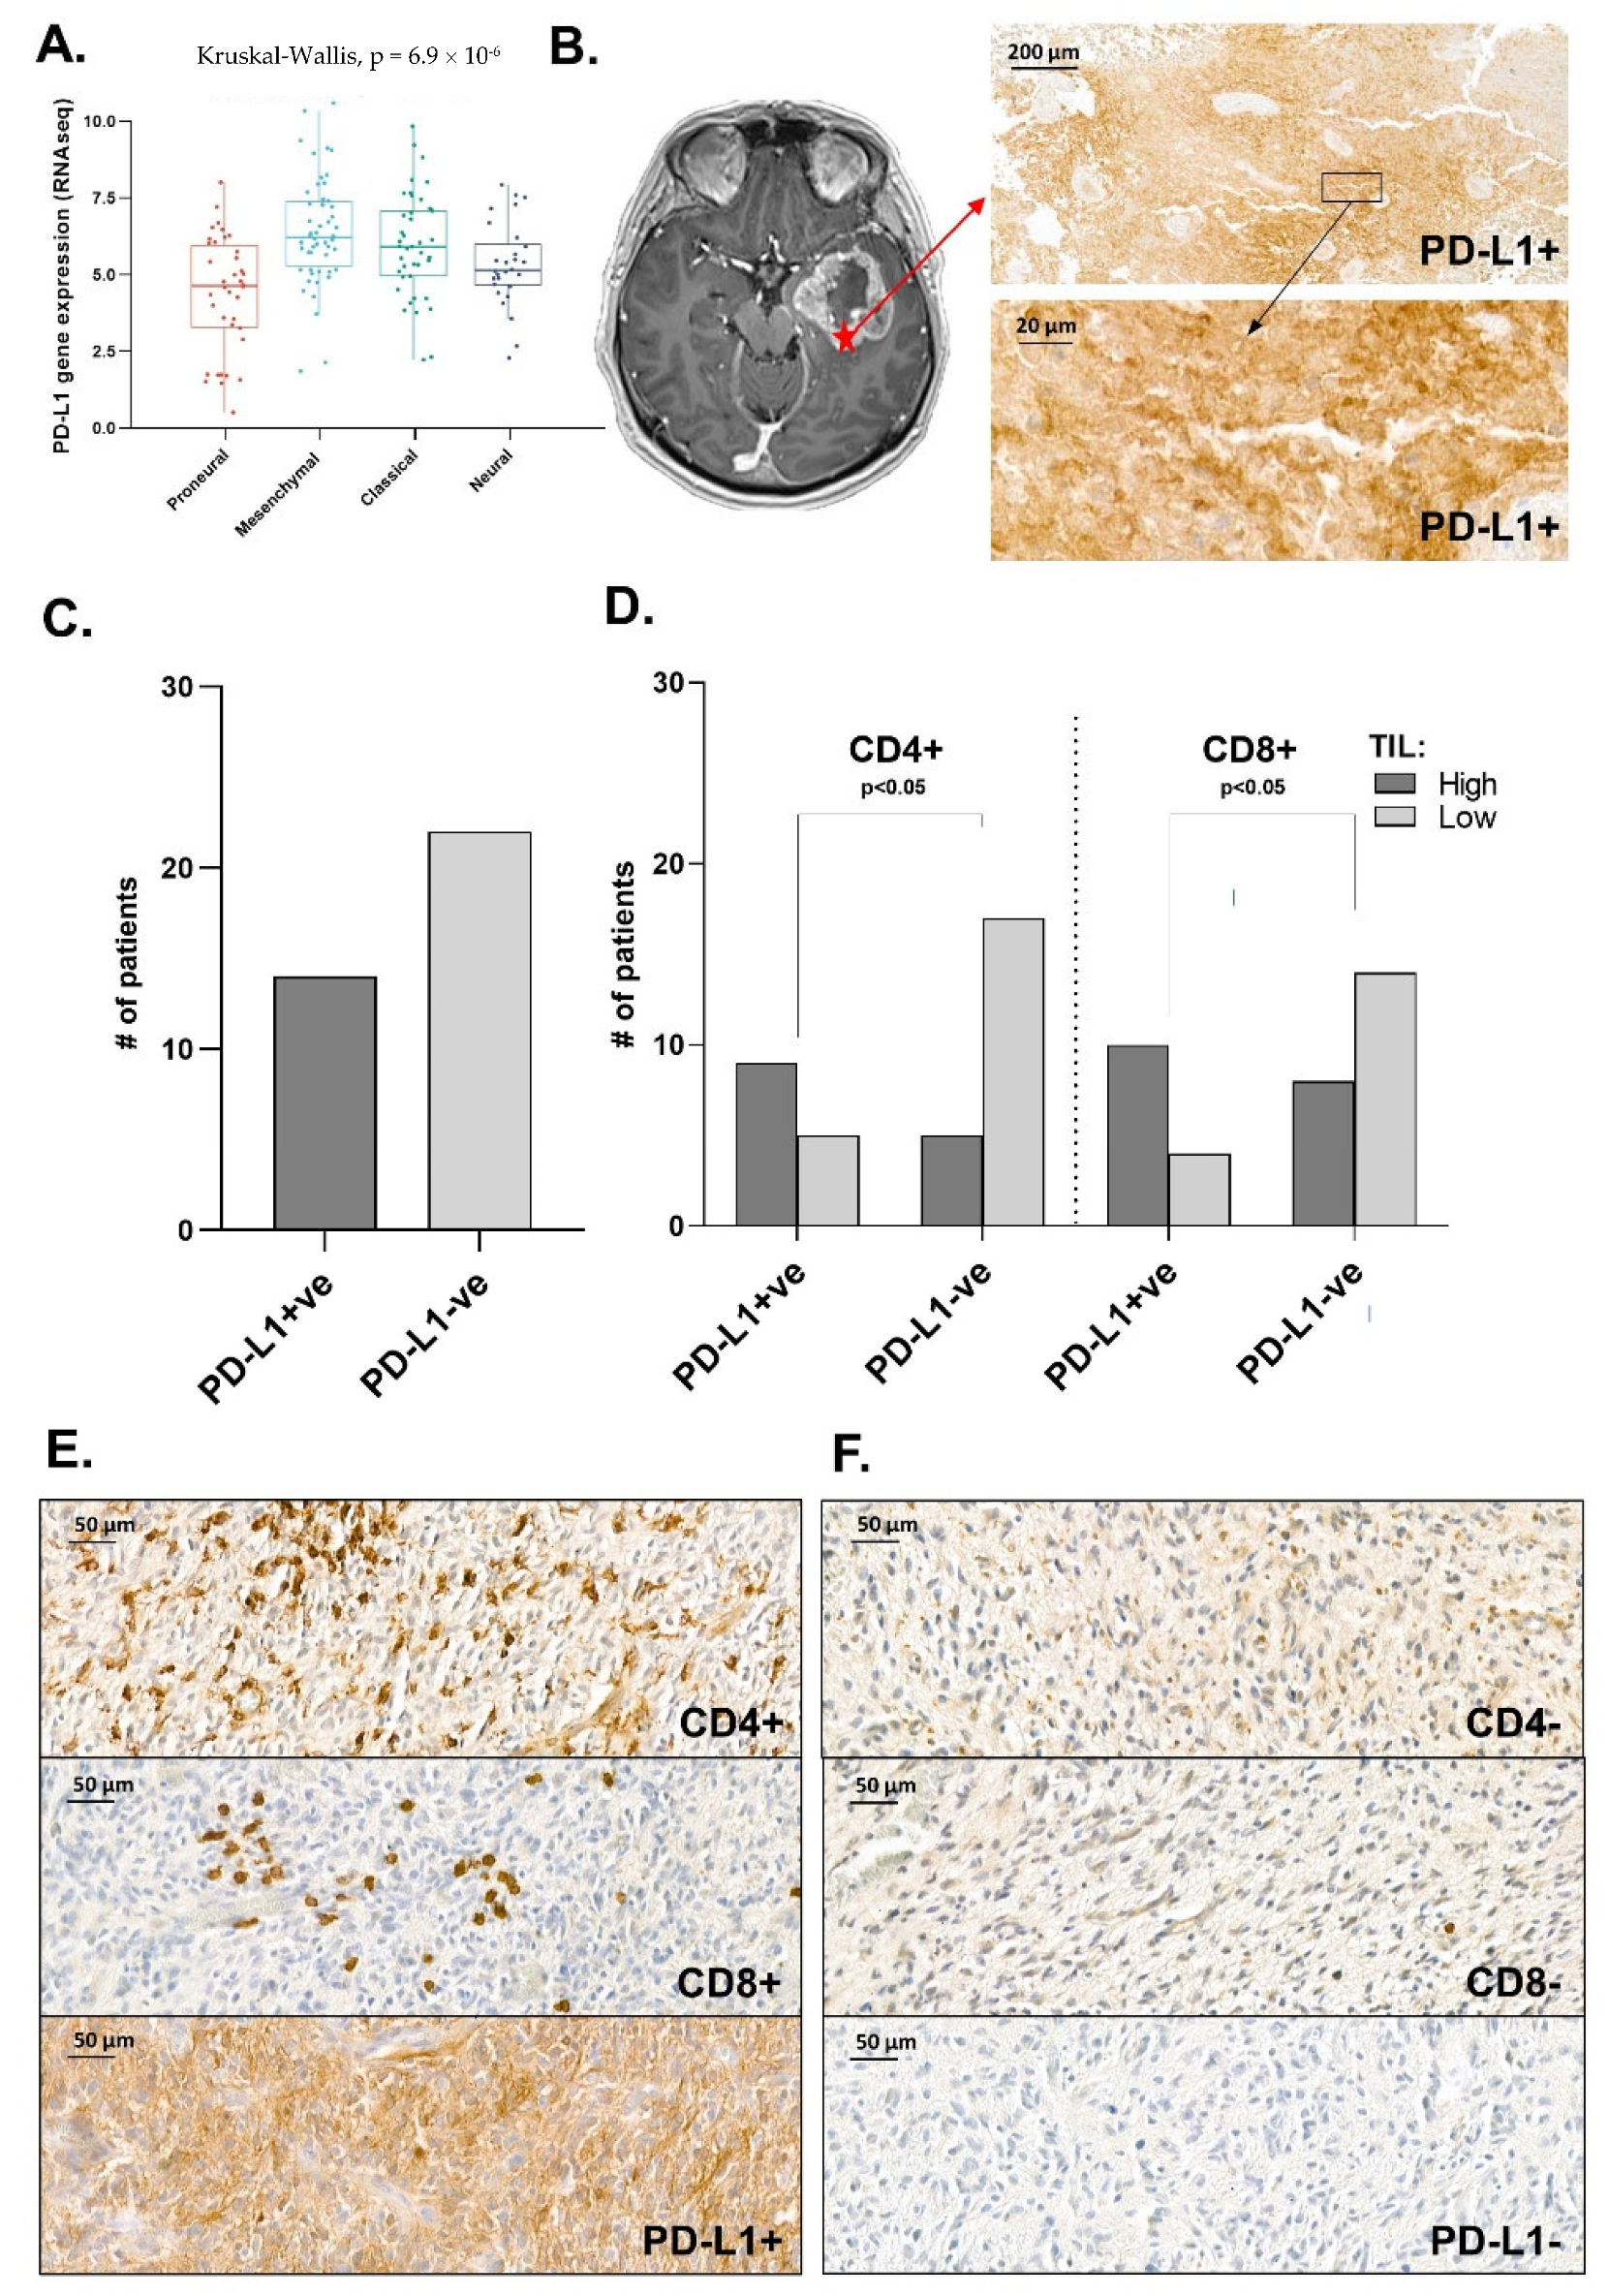
3.5. Distribution Pattern of PD-L1 in Human Glioma Samples
4. Discussion
5. Conclusions
Supplementary Materials
Author Contributions
Funding
Institutional Review Board Statement
Informed Consent Statement
Data Availability Statement
Acknowledgments
Conflicts of Interest
References
- Wang, Z.; Peet, N.P.; Zhang, P.; Jiang, Y.; Rong, L. Current Development of Glioblastoma Therapeutic Agents. Mol. Cancer Ther. 2021, 20, 1521–1532. [Google Scholar] [CrossRef]
- Hao, C.; Chen, G.; Zhao, H.; Li, Y.; Chen, J.; Zhang, H.; Li, S.; Zhao, Y.; Chen, F.; Li, W.; et al. PD-L1 Expression in Glioblastoma, the Clinical and Prognostic Significance: A Systematic Literature Review and Meta-Analysis. Front. Oncol. 2020, 10, 1015. [Google Scholar] [CrossRef]
- Lee, G.A.; Lin, W.L.; Kuo, D.P.; Li, Y.T.; Chang, Y.W.; Chen, Y.C.; Huang, S.W.; Hsu, J.B.; Chen, C.Y. Detection of PD-L1 Expression in Temozolomide-Resistant Glioblastoma by Using PD-L1 Antibodies Conjugated with LipidCoated Superparamagnetic Iron Oxide. Int. J. Nanomed. 2021, 16, 5233–5246. [Google Scholar] [CrossRef]
- Ramirez, Y.P.; Weatherbee, J.L.; Wheelhouse, R.T.; Ross, A.H. Glioblastoma multiforme therapy and mechanisms of resistance. Pharmaceuticals 2013, 6, 1475–1506. [Google Scholar] [CrossRef]
- Wei, F.; Zhong, S.; Ma, Z.; Kong, H.; Medvec, A.; Ahmed, R.; Freeman, G.J.; Krogsgaard, M.; Riley, J.L. Strength of PD-1 signaling differentially affects T-cell effector functions. Proc. Natl. Acad. Sci. USA 2013, 110, E2480–E2489. [Google Scholar] [CrossRef]
- Clark, D.P. Biomarkers for immune checkpoint inhibitors: The importance of tumor topography and the challenges to cytopathology. Cancer Cytopathol. 2018, 126, 11–19. [Google Scholar] [CrossRef]
- Brown, N.F.; Carter, T.J.; Ottaviani, D.; Mulholland, P. Harnessing the immune system in glioblastoma. Br. J. Cancer 2018, 119, 1171–1181. [Google Scholar] [CrossRef]
- Cloughesy, T.F.; Mochizuki, A.Y.; Orpilla, J.R.; Hugo, W.; Lee, A.H.; Davidson, T.B.; Wang, A.C.; Ellingson, B.M.; Rytlewski, J.A.; Sanders, C.M.; et al. Neoadjuvant anti-PD-1 immunotherapy promotes a survival benefit with intratumoral and systemic immune responses in recurrent glioblastoma. Nat. Med. 2019, 25, 477–486. [Google Scholar] [CrossRef]
- Kaffes, I.; Szulzewsky, F.; Chen, Z.; Herting, C.J.; Gabanic, B.; Velazquez Vega, J.E.; Shelton, J.; Switchenko, J.M.; Ross, J.L.; McSwain, L.F.; et al. Human Mesenchymal glioblastomas are characterized by an increased immune cell presence compared to Proneural and Classical tumors. Oncoimmunology 2019, 8, e1655360. [Google Scholar] [CrossRef]
- Bergmann, N.; Delbridge, C.; Gempt, J.; Feuchtinger, A.; Walch, A.; Schirmer, L.; Bunk, W.; Aschenbrenner, T.; Liesche-Starnecker, F.; Schlegel, J. The Intratumoral Heterogeneity Reflects the Intertumoral Subtypes of Glioblastoma Multiforme: A Regional Immunohistochemistry Analysis. Front. Oncol. 2020, 10, 494. [Google Scholar] [CrossRef]
- Scheffel, T.B.; Grave, N.; Vargas, P.; Diz, F.M.; Rockenbach, L.; Morrone, F.B. Immunosuppression in Gliomas via PD-1/PD-L1 Axis and Adenosine Pathway. Front. Oncol. 2020, 10, 617385. [Google Scholar] [CrossRef]
- Gonzalez Trotter, D.E.; Meng, X.; McQuade, P.; Rubins, D.; Klimas, M.; Zeng, Z.; Connolly, B.M.; Miller, P.J.; O’Malley, S.S.; Lin, S.A.; et al. In Vivo Imaging of the Programmed Death Ligand 1 by 18F PET. J. Nucl. Med. 2017, 58, 1852–1857. [Google Scholar] [CrossRef]
- Bensch, F.; van der Veen, E.L.; Lub-de Hooge, M.N.; Jorritsma-Smit, A.; Boellaard, R.; Kok, I.C.; Oosting, S.F.; Schroder, C.P.; Hiltermann, T.J.N.; van der Wekken, A.J.; et al. 89Zr-atezolizumab imaging as a non-invasive approach to assess clinical response to PD-L1 blockade in cancer. Nat. Med. 2018, 24, 1852–1858. [Google Scholar] [CrossRef]
- Nienhuis, P.H.; Antunes, I.F.; Glaudemans, A.W.J.M.; Jalving, M.; Leung, D.; Noordzij, W.; Slart, R.H.J.A.; Vries, E.F.d.; Hospers, G.A.P. 18F-BMS986192 PET imaging of PD-L1 in metastatic melanoma patients with brain metastases treated with immune checkpoint inhibitors. A pilot study. J. Nucl. Med. 2022, 63, 899–905. [Google Scholar] [CrossRef]
- Wei, W.; Rosenkrans, Z.T.; Liu, J.; Huang, G.; Luo, Q.Y.; Cai, W. ImmunoPET: Concept, Design, and Applications. Chem. Rev. 2020, 120, 3787–3851. [Google Scholar] [CrossRef]
- Ryman, J.T.; Meibohm, B. Pharmacokinetics of Monoclonal Antibodies. CPT Pharmacomet. Syst. Pharmacol. 2017, 6, 576–588. [Google Scholar] [CrossRef]
- Martins, C.D.; Da Pieve, C.; Burley, T.A.; Smith, R.; Ciobota, D.M.; Allott, L.; Harrington, K.J.; Oyen, W.J.G.; Smith, G.; Kramer-Marek, G. HER3-Mediated Resistance to Hsp90 Inhibition Detected in Breast Cancer Xenografts by Affibody-Based PET Imaging. Clin. Cancer Res. 2018, 24, 1853–1865. [Google Scholar] [CrossRef]
- Burley, T.A.; Da Pieve, C.; Martins, C.D.; Ciobota, D.M.; Allott, L.; Oyen, W.J.G.; Harrington, K.J.; Smith, G.; Kramer-Marek, G. Affibody-Based PET Imaging to Guide EGFR-Targeted Cancer Therapy in Head and Neck Squamous Cell Cancer Models. J. Nucl. Med. 2019, 60, 353–361. [Google Scholar] [CrossRef]
- Kramer-Marek, G.; Kiesewetter, D.O.; Martiniova, L.; Jagoda, E.; Lee, S.B.; Capala, J. [18F]FBEM-ZHER2:342-Affibody molecule—A new molecular tracer for in vivo monitoring of HER2 expression by positron emission tomography. Eur. J. Nucl. Med. Mol. Imaging 2008, 35, 1008–1018. [Google Scholar] [CrossRef]
- Stahl, S.; Graslund, T.; Eriksson Karlstrom, A.; Frejd, F.Y.; Nygren, P.A.; Lofblom, J. Affibody Molecules in Biotechnological and Medical Applications. Trends Biotechnol. 2017, 35, 691–712. [Google Scholar] [CrossRef]
- Maczynska, J.; Raes, F.; Da Pieve, C.; Turnock, S.; Boult, J.K.R.; Hoebart, J.; Niedbala, M.; Robinson, S.P.; Harrington, K.J.; Kaspera, W.; et al. Triggering anti-GBM immune response with EGFR-mediated photoimmunotherapy. BMC Med. 2022, 20, 16. [Google Scholar] [CrossRef]
- Workman, P.; Aboagye, E.O.; Balkwill, F.; Balmain, A.; Bruder, G.; Chaplin, D.J.; Double, J.A.; Everitt, J.; Farningham, D.A.H.; Glennie, M.J.; et al. Guidelines for the welfare and use of animals in cancer research. Br. J. Cancer 2010, 102, 1555–1577. [Google Scholar] [CrossRef] [PubMed]
- Behr, T.M.; Goldenberg, D.M.; Becker, W. Reducing the renal uptake of radiolabeled antibody fragments and peptides for diagnosis and therapy: Present status, future prospects and limitations. Eur. J. Nucl. Med. 1998, 25, 201–212. [Google Scholar] [CrossRef] [PubMed]
- Li, C.W.; Lim, S.O.; Xia, W.; Lee, H.H.; Chan, L.C.; Kuo, C.W.; Khoo, K.H.; Chang, S.S.; Cha, J.H.; Kim, T.; et al. Glycosylation and stabilization of programmed death ligand-1 suppresses T-cell activity. Nat. Commun. 2016, 7, 12632. [Google Scholar] [CrossRef]
- Carro, M.S.; Lim, W.K.; Alvarez, M.J.; Bollo, R.J.; Zhao, X.; Snyder, E.Y.; Sulman, E.P.; Anne, S.L.; Doetsch, F.; Colman, H.; et al. The transcriptional network for mesenchymal transformation of brain tumours. Nature 2010, 463, 318–325. [Google Scholar] [CrossRef] [PubMed]
- Zhang, P.; Xia, Q.; Liu, L.; Li, S.; Dong, L. Current Opinion on Molecular Characterization for GBM Classification in Guiding Clinical Diagnosis, Prognosis, and Therapy. Front. Mol. Biosci. 2020, 7, 562798. [Google Scholar] [CrossRef]
- Yang, W.; Wu, P.F.; Ma, J.X.; Liao, M.J.; Wang, X.H.; Xu, L.S.; Xu, M.H.; Yi, L. Sortilin promotes glioblastoma invasion and mesenchymal transition through GSK-3 beta/beta-catenin/twist pathway. Cell Death Dis. 2019, 10, 208. [Google Scholar] [CrossRef]
- Olmez, I.; Love, S.; Xiao, A.Z.; Manigat, L.; Randolph, P.; McKenna, B.D.; Neal, B.P.; Boroda, S.; Li, M.; Brenneman, B.; et al. Targeting the mesenchymal subtype in glioblastoma and other cancers via inhibition of diacylglycerol kinase alpha. Neuro-Oncol. 2018, 20, 192–202. [Google Scholar] [CrossRef]
- Behnan, J.; Finocchiaro, G.; Hanna, G. The landscape of the mesenchymal signature in brain tumours. Brain 2019, 142, 847–866. [Google Scholar] [CrossRef]
- Bhat, K.P.L.; Balasubramaniyan, V.; Vaillant, B.; Ezhilarasan, R.; Hummelink, K.; Hollingsworth, F.; Wani, K.; Heathcock, L.; James, J.D.; Goodman, L.D.; et al. Mesenchymal Differentiation Mediated by NF-kappa B Promotes Radiation Resistance in Glioblastoma. Cancer Cell 2013, 24, 331–346. [Google Scholar] [CrossRef]
- Topalian, S.L.; Taube, J.M.; Anders, R.A.; Pardoll, D.M. Mechanism-driven biomarkers to guide immune checkpoint blockade in cancer therapy. Nat. Rev. Cancer 2016, 16, 275–287. [Google Scholar] [CrossRef]
- Qian, J.; Wang, C.; Wang, B.; Yang, J.; Wang, Y.; Luo, F.; Xu, J.; Zhao, C.; Liu, R.; Chu, Y. The IFN-γ/PD-L1 axis between T cells and tumor microenvironment: Hints for glioma anti-PD-1/PD-L1 therapy. J. Neuroinflamm. 2018, 15, 290. [Google Scholar] [CrossRef]
- Zhu, Z.; Zhang, H.; Chen, B.; Liu, X.; Zhang, S.; Zong, Z.; Gao, M. PD-L1-Mediated Immunosuppression in Glioblastoma Is Associated With the Infiltration and M2-Polarization of Tumor-Associated Macrophages. Front. Immunol. 2020, 11, 588552. [Google Scholar] [CrossRef]
- Samman, D.M.E.; Mahdy, M.M.E.; Cousha, H.S.; Kamar, Z.; Mohamed, K.A.K.; Gabal, H.H.A. Immunohistochemical expression of programmed death-ligand 1 and CD8 in glioblastomas. J. Pathol. Transl. Med. 2021, 55, 388–397. [Google Scholar] [CrossRef] [PubMed]
- Rubins, D.J.; Meng, X.; McQuade, P.; Klimas, M.; Getty, K.; Lin, S.A.; Connolly, B.M.; O’Malley, S.S.; Haley, H.; Purcell, M.; et al. In Vivo Evaluation and Dosimetry Estimate for a High Affinity Affibody PET Tracer Targeting PD-L1. Mol. Imaging Biol. 2021, 23, 241–249. [Google Scholar] [CrossRef]
- Arvanitis, C.D.; Ferraro, G.B.; Jain, R.K. The blood-brain barrier and blood-tumour barrier in brain tumours and metastases. Nat. Rev. Cancer 2020, 20, 26–41. [Google Scholar] [CrossRef] [PubMed]
- Niemeijer, A.N.; Leung, D.; Huisman, M.C.; Bahce, I.; Hoekstra, O.S.; van Dongen, G.A.M.S.; Boellaard, R.; Du, S.; Hayes, W.; Smith, R.; et al. Whole body PD-1 and PD-L1 positron emission tomography in patients with non-small-cell lung cancer. Nat. Commun. 2018, 9, 4664. [Google Scholar] [CrossRef] [PubMed]
- Kok, I.C.; Hooiveld, J.S.; van de Donk, P.P.; Giesen, D.; van der Veen, E.L.; Lub-de Hooge, M.N.; Brouwers, A.H.; Hiltermann, T.J.N.; van der Wekken, A.J.; Hijmering-Kappelle, L.B.M.; et al. 89Zr-pembrolizumab imaging as a non-invasive approach to assess clinical response to PD-1 blockade in cancer. Ann. Oncol. Off. J. Eur. Soc. Med. Oncol. 2022, 33, 80–88. [Google Scholar] [CrossRef]
- Kist de Ruijter, L.; van de Donk, P.P.; Hooiveld-Noeken, J.S.; Giesen, D.; Elias, S.G.; Lub-de Hooge, M.N.; Oosting, S.F.; Jalving, M.; Timens, W.; Brouwers, A.H.; et al. Whole-body CD8+ T cell visualization before and during cancer immunotherapy: A phase 1/2 trial. Nat. Med. 2022, 28, 2601–2610. [Google Scholar] [CrossRef]
- Garber, S.T.; Hashimoto, Y.; Weathers, S.P.; Xiu, J.; Gatalica, Z.; Verhaak, R.G.; Zhou, S.; Fuller, G.N.; Khasraw, M.; de Groot, J.; et al. Immune checkpoint blockade as a potential therapeutic target: Surveying CNS malignancies. Neuro Oncol. 2016, 18, 1357–1366. [Google Scholar]
- Han, S.; Zhang, C.; Li, Q.; Dong, J.; Liu, Y.; Huang, Y.; Jiang, T.; Wu, A. Tumour-infiltrating CD4(+) and CD8(+) lymphocytes as predictors of clinical outcome in glioma. Br. J. Cancer 2014, 110, 2560–2568. [Google Scholar] [CrossRef] [PubMed]


Disclaimer/Publisher’s Note: The statements, opinions and data contained in all publications are solely those of the individual author(s) and contributor(s) and not of MDPI and/or the editor(s). MDPI and/or the editor(s) disclaim responsibility for any injury to people or property resulting from any ideas, methods, instructions or products referred to in the content. |
© 2023 by the authors. Licensee MDPI, Basel, Switzerland. This article is an open access article distributed under the terms and conditions of the Creative Commons Attribution (CC BY) license (https://creativecommons.org/licenses/by/4.0/).
Share and Cite
Sharma, G.; Braga, M.C.; Da Pieve, C.; Szopa, W.; Starzetz, T.; Plate, K.H.; Kaspera, W.; Kramer-Marek, G. Immuno-PET Imaging of Tumour PD-L1 Expression in Glioblastoma. Cancers 2023, 15, 3131. https://doi.org/10.3390/cancers15123131
Sharma G, Braga MC, Da Pieve C, Szopa W, Starzetz T, Plate KH, Kaspera W, Kramer-Marek G. Immuno-PET Imaging of Tumour PD-L1 Expression in Glioblastoma. Cancers. 2023; 15(12):3131. https://doi.org/10.3390/cancers15123131
Chicago/Turabian StyleSharma, Gitanjali, Marta C. Braga, Chiara Da Pieve, Wojciech Szopa, Tatjana Starzetz, Karl H. Plate, Wojciech Kaspera, and Gabriela Kramer-Marek. 2023. "Immuno-PET Imaging of Tumour PD-L1 Expression in Glioblastoma" Cancers 15, no. 12: 3131. https://doi.org/10.3390/cancers15123131
APA StyleSharma, G., Braga, M. C., Da Pieve, C., Szopa, W., Starzetz, T., Plate, K. H., Kaspera, W., & Kramer-Marek, G. (2023). Immuno-PET Imaging of Tumour PD-L1 Expression in Glioblastoma. Cancers, 15(12), 3131. https://doi.org/10.3390/cancers15123131