
Pathways Related to Colon Inflammation Are Associated with Colorectal Carcinoma: A Transcriptome- and Methylome-Wide Study

 , , , ,
Abstract
Simple Summary
Abstract
1. Introduction
2. Materials and Methods
3. Results
3.1. Inflammation-Related Differentially Expressed Gene Pathways in Colon Tissue
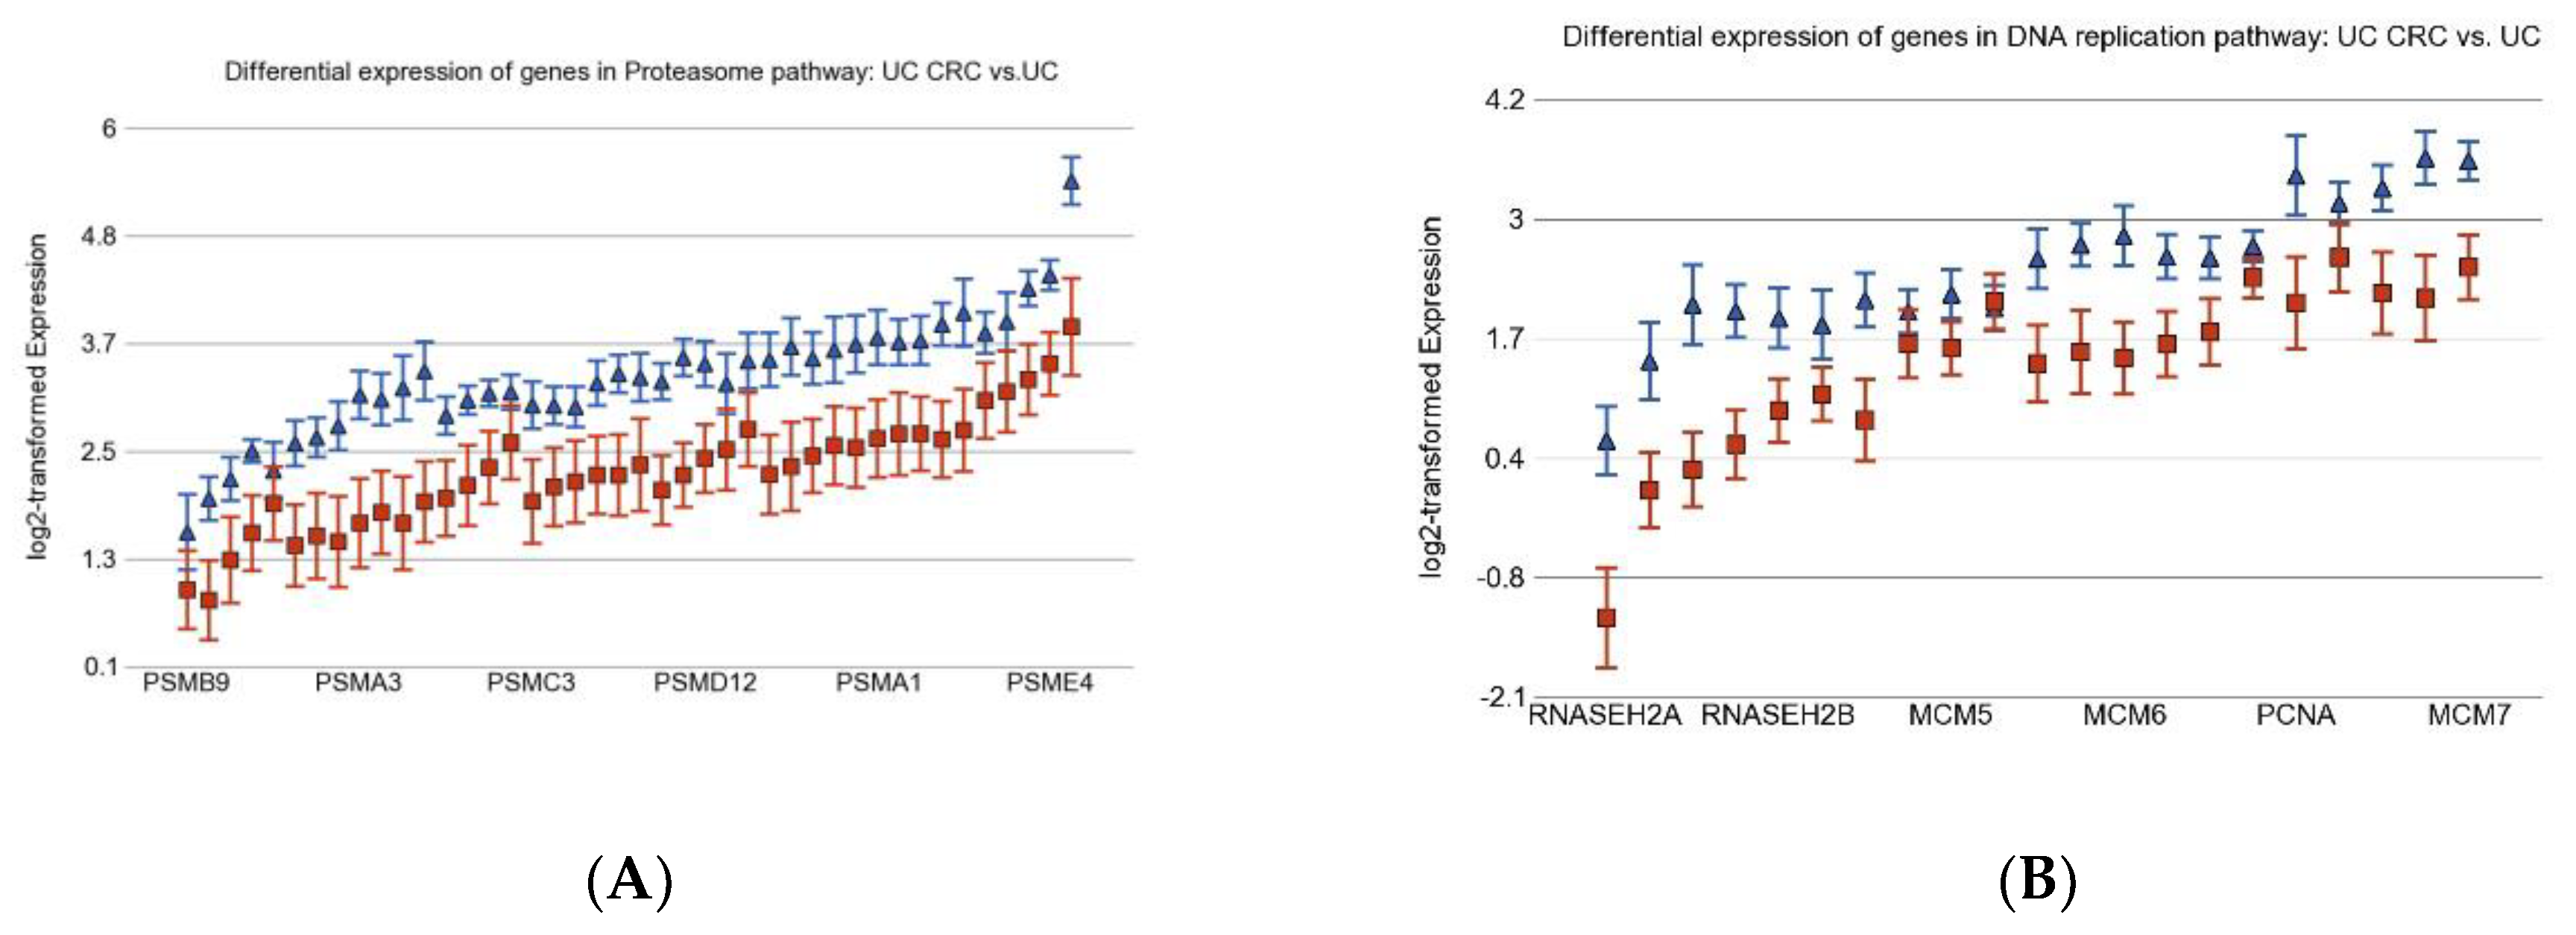
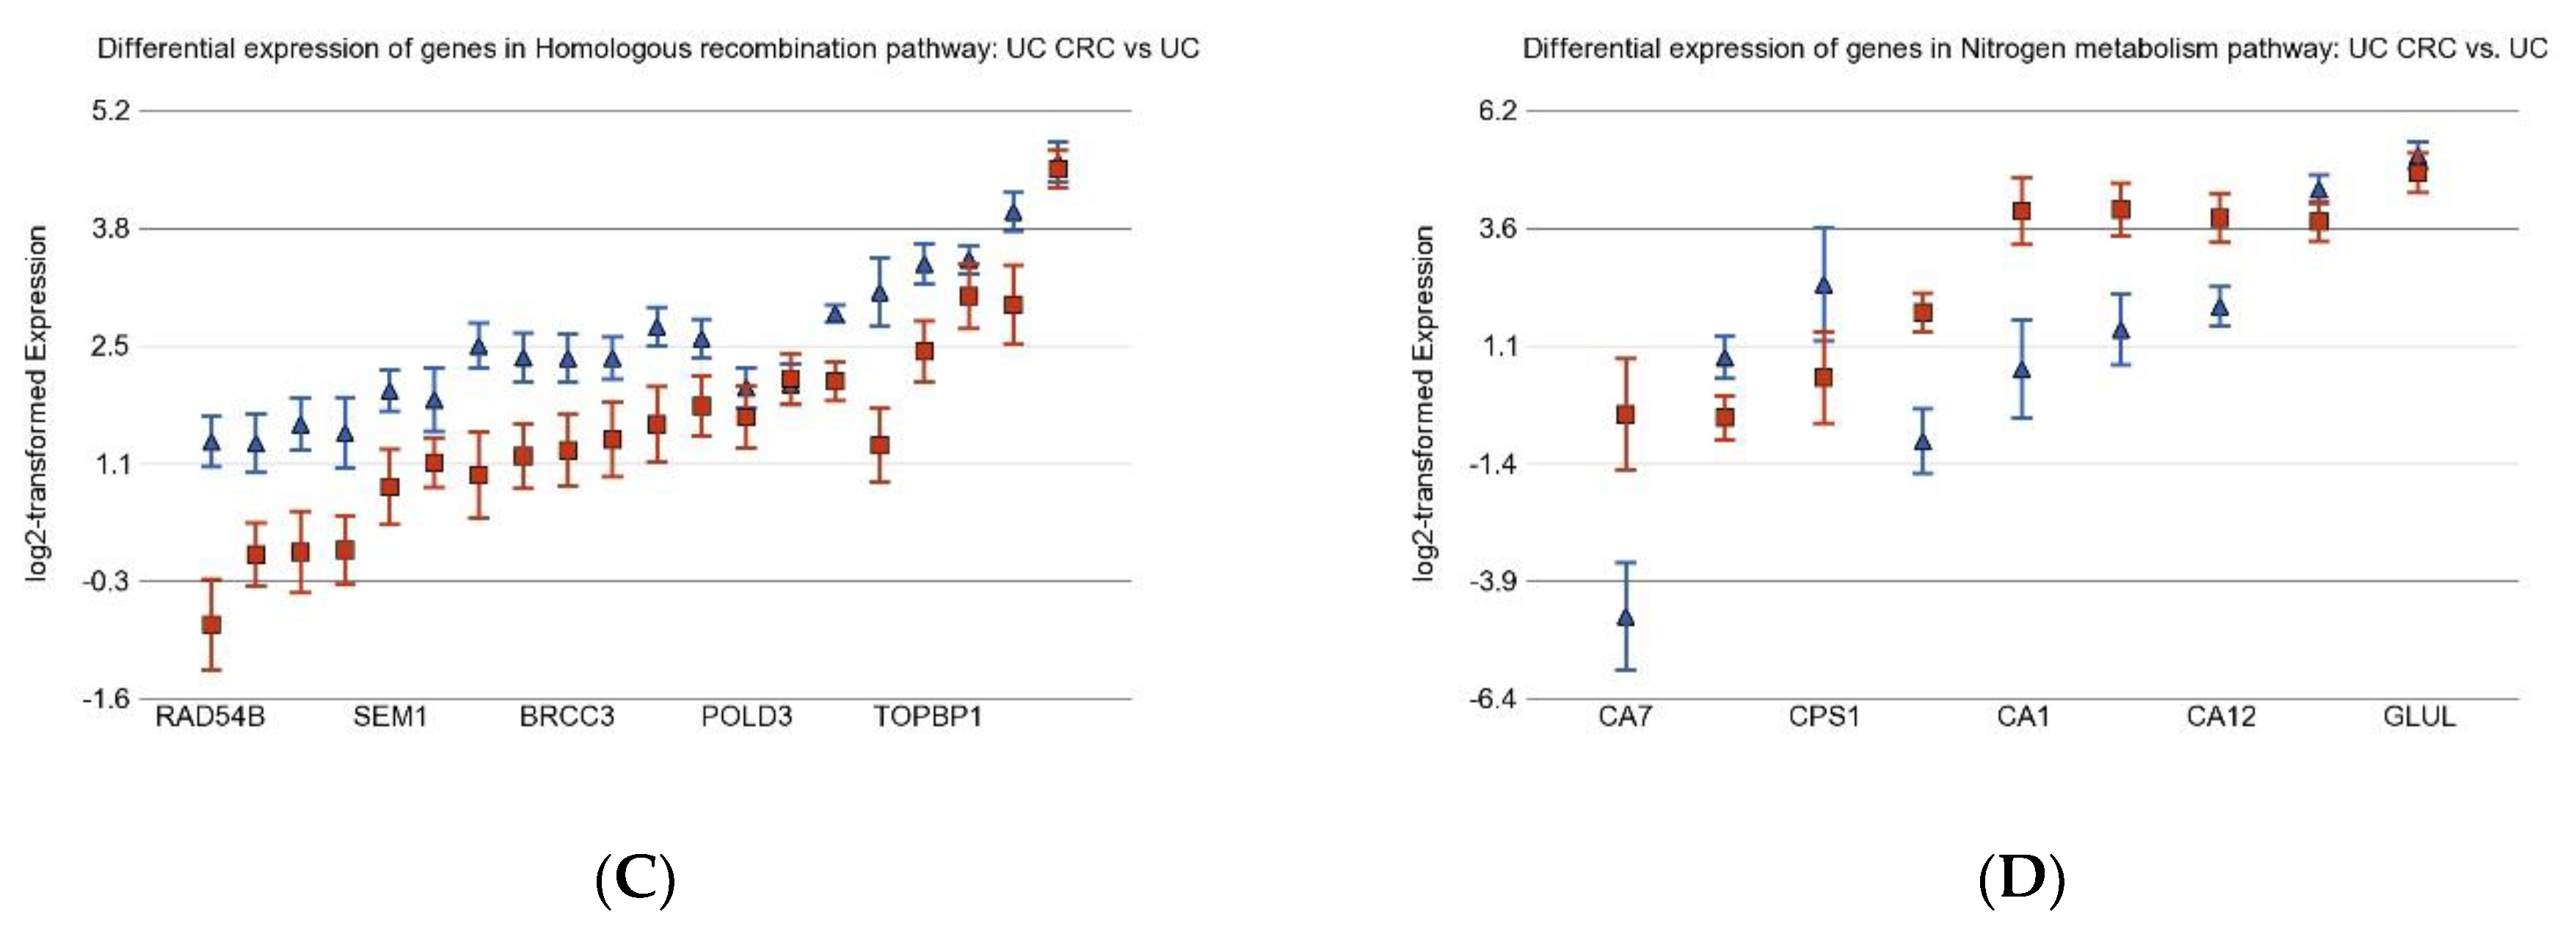
3.2. Differentially Expressed Gene Pathways in UC CRC
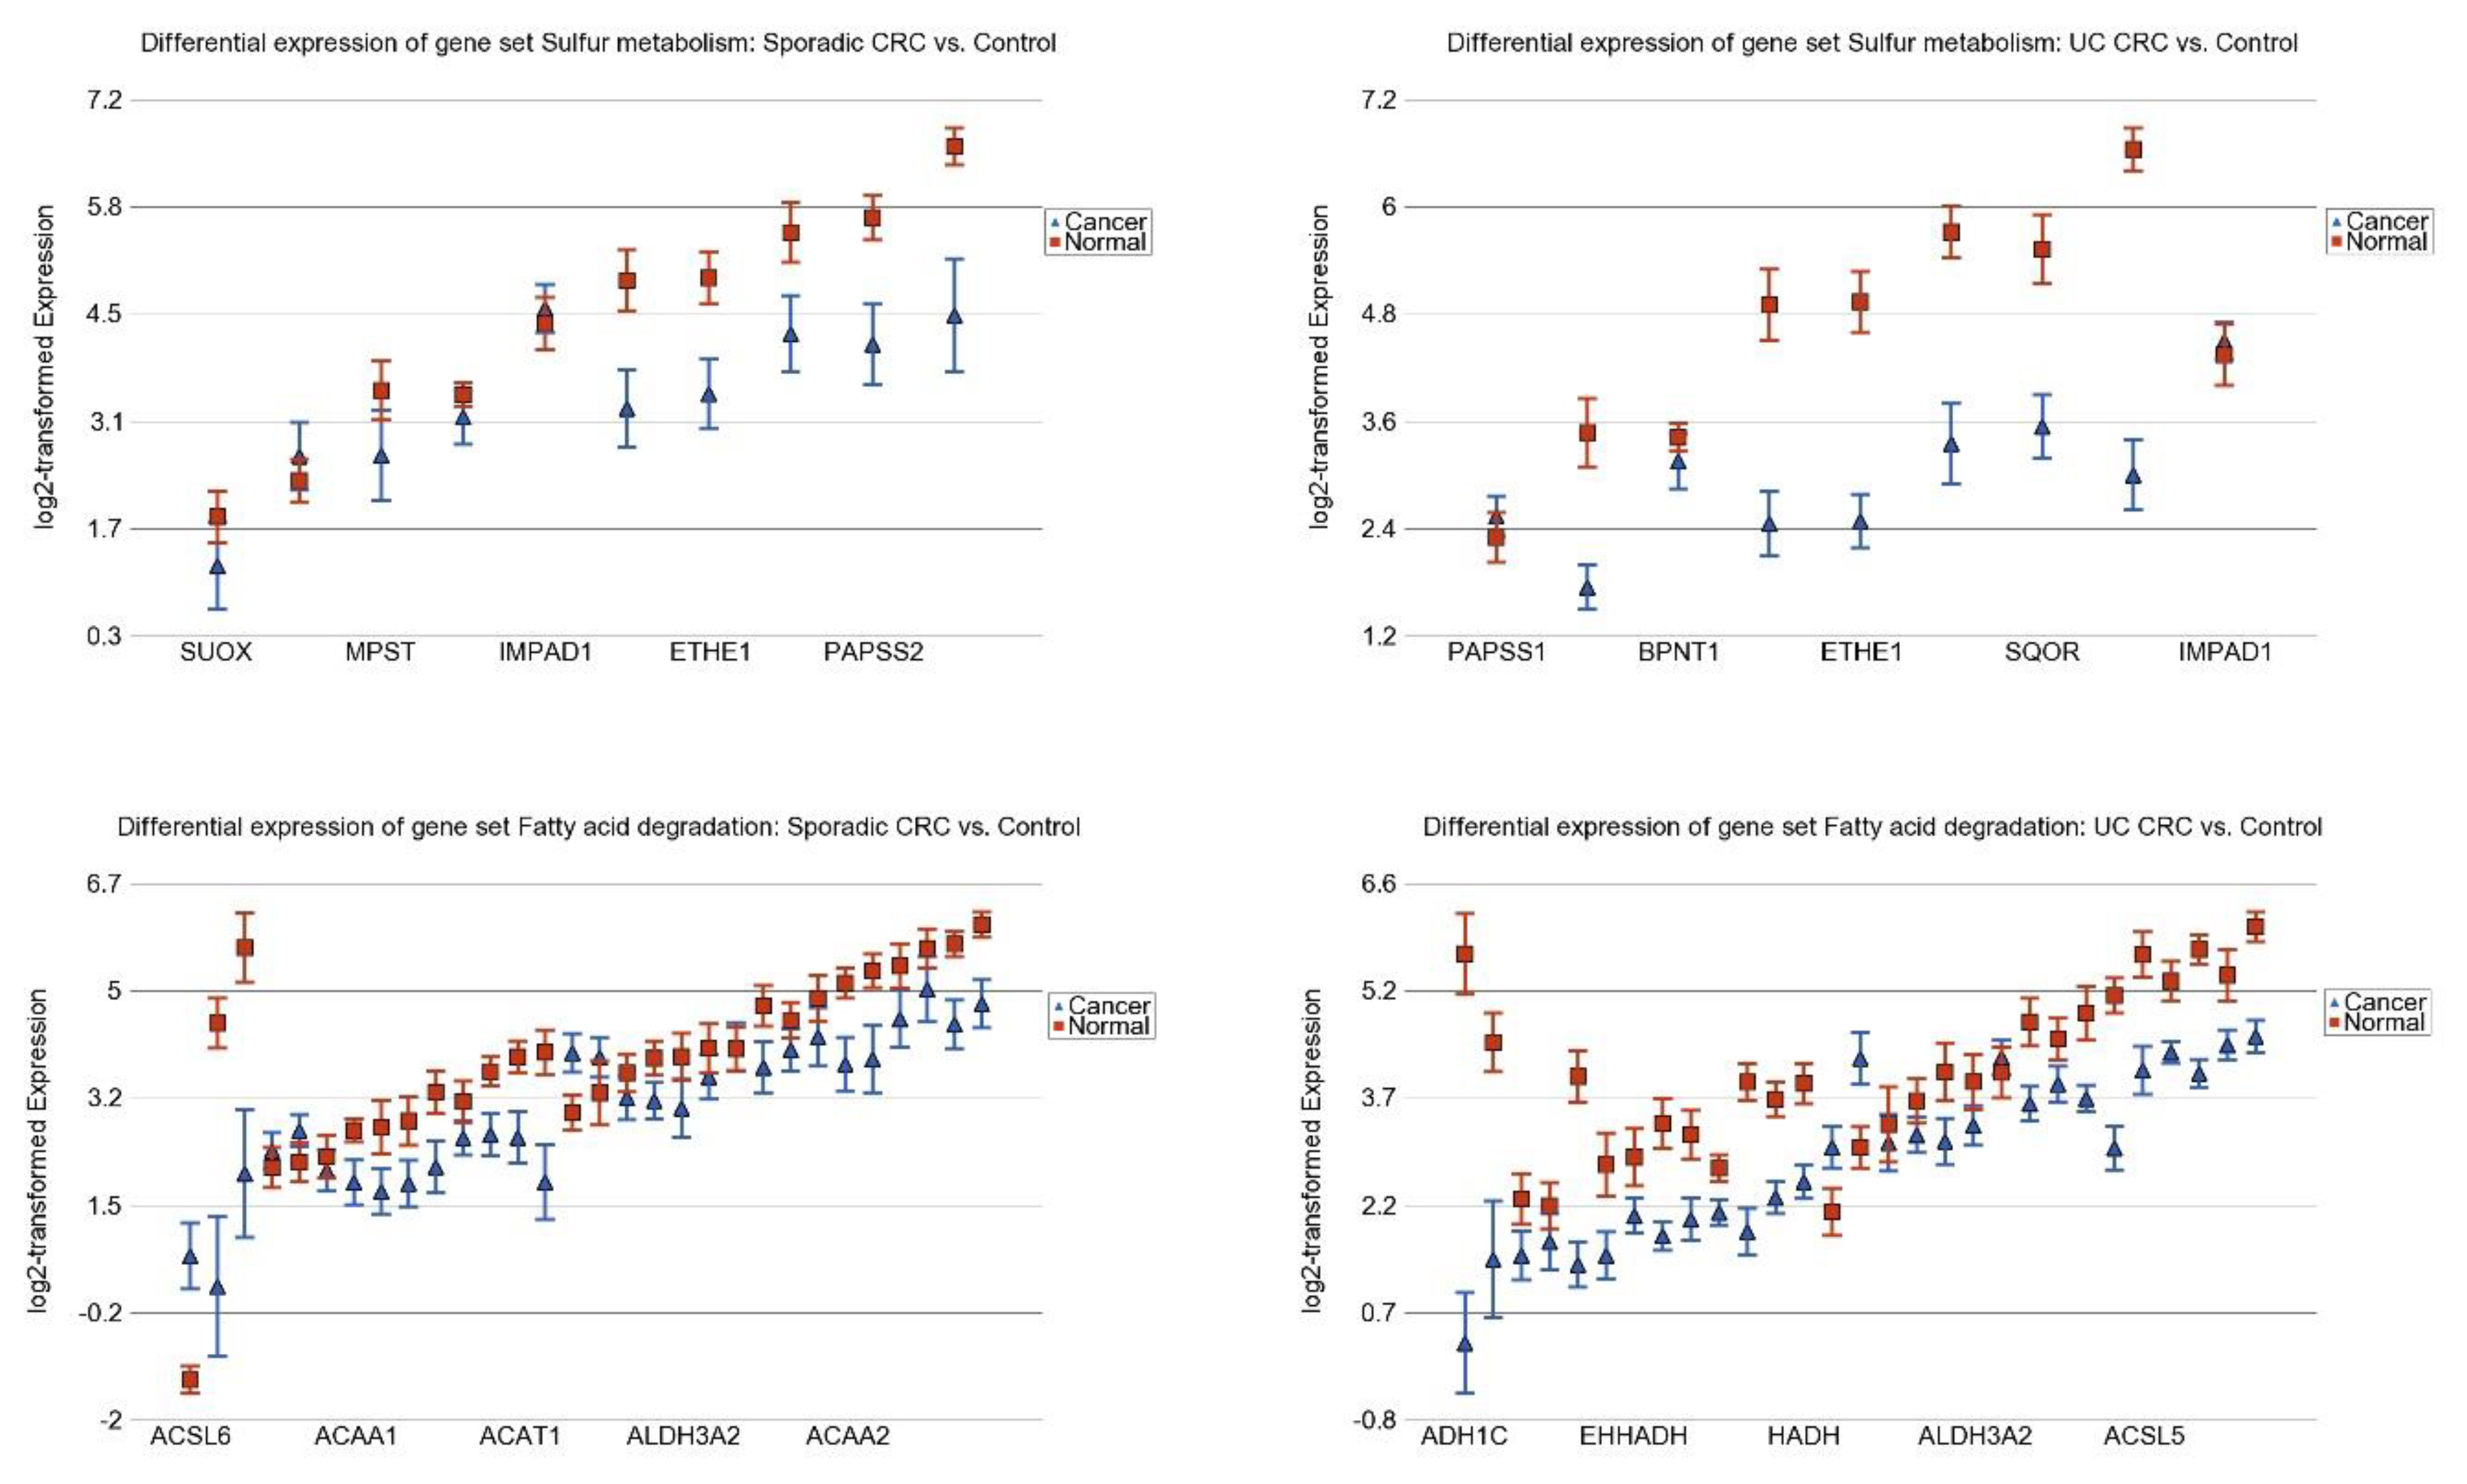
3.3. Differentially Expressed Gene Pathways in Sporadic CRC
3.4. Association of Colonic Mucosal Inflammation and CRC
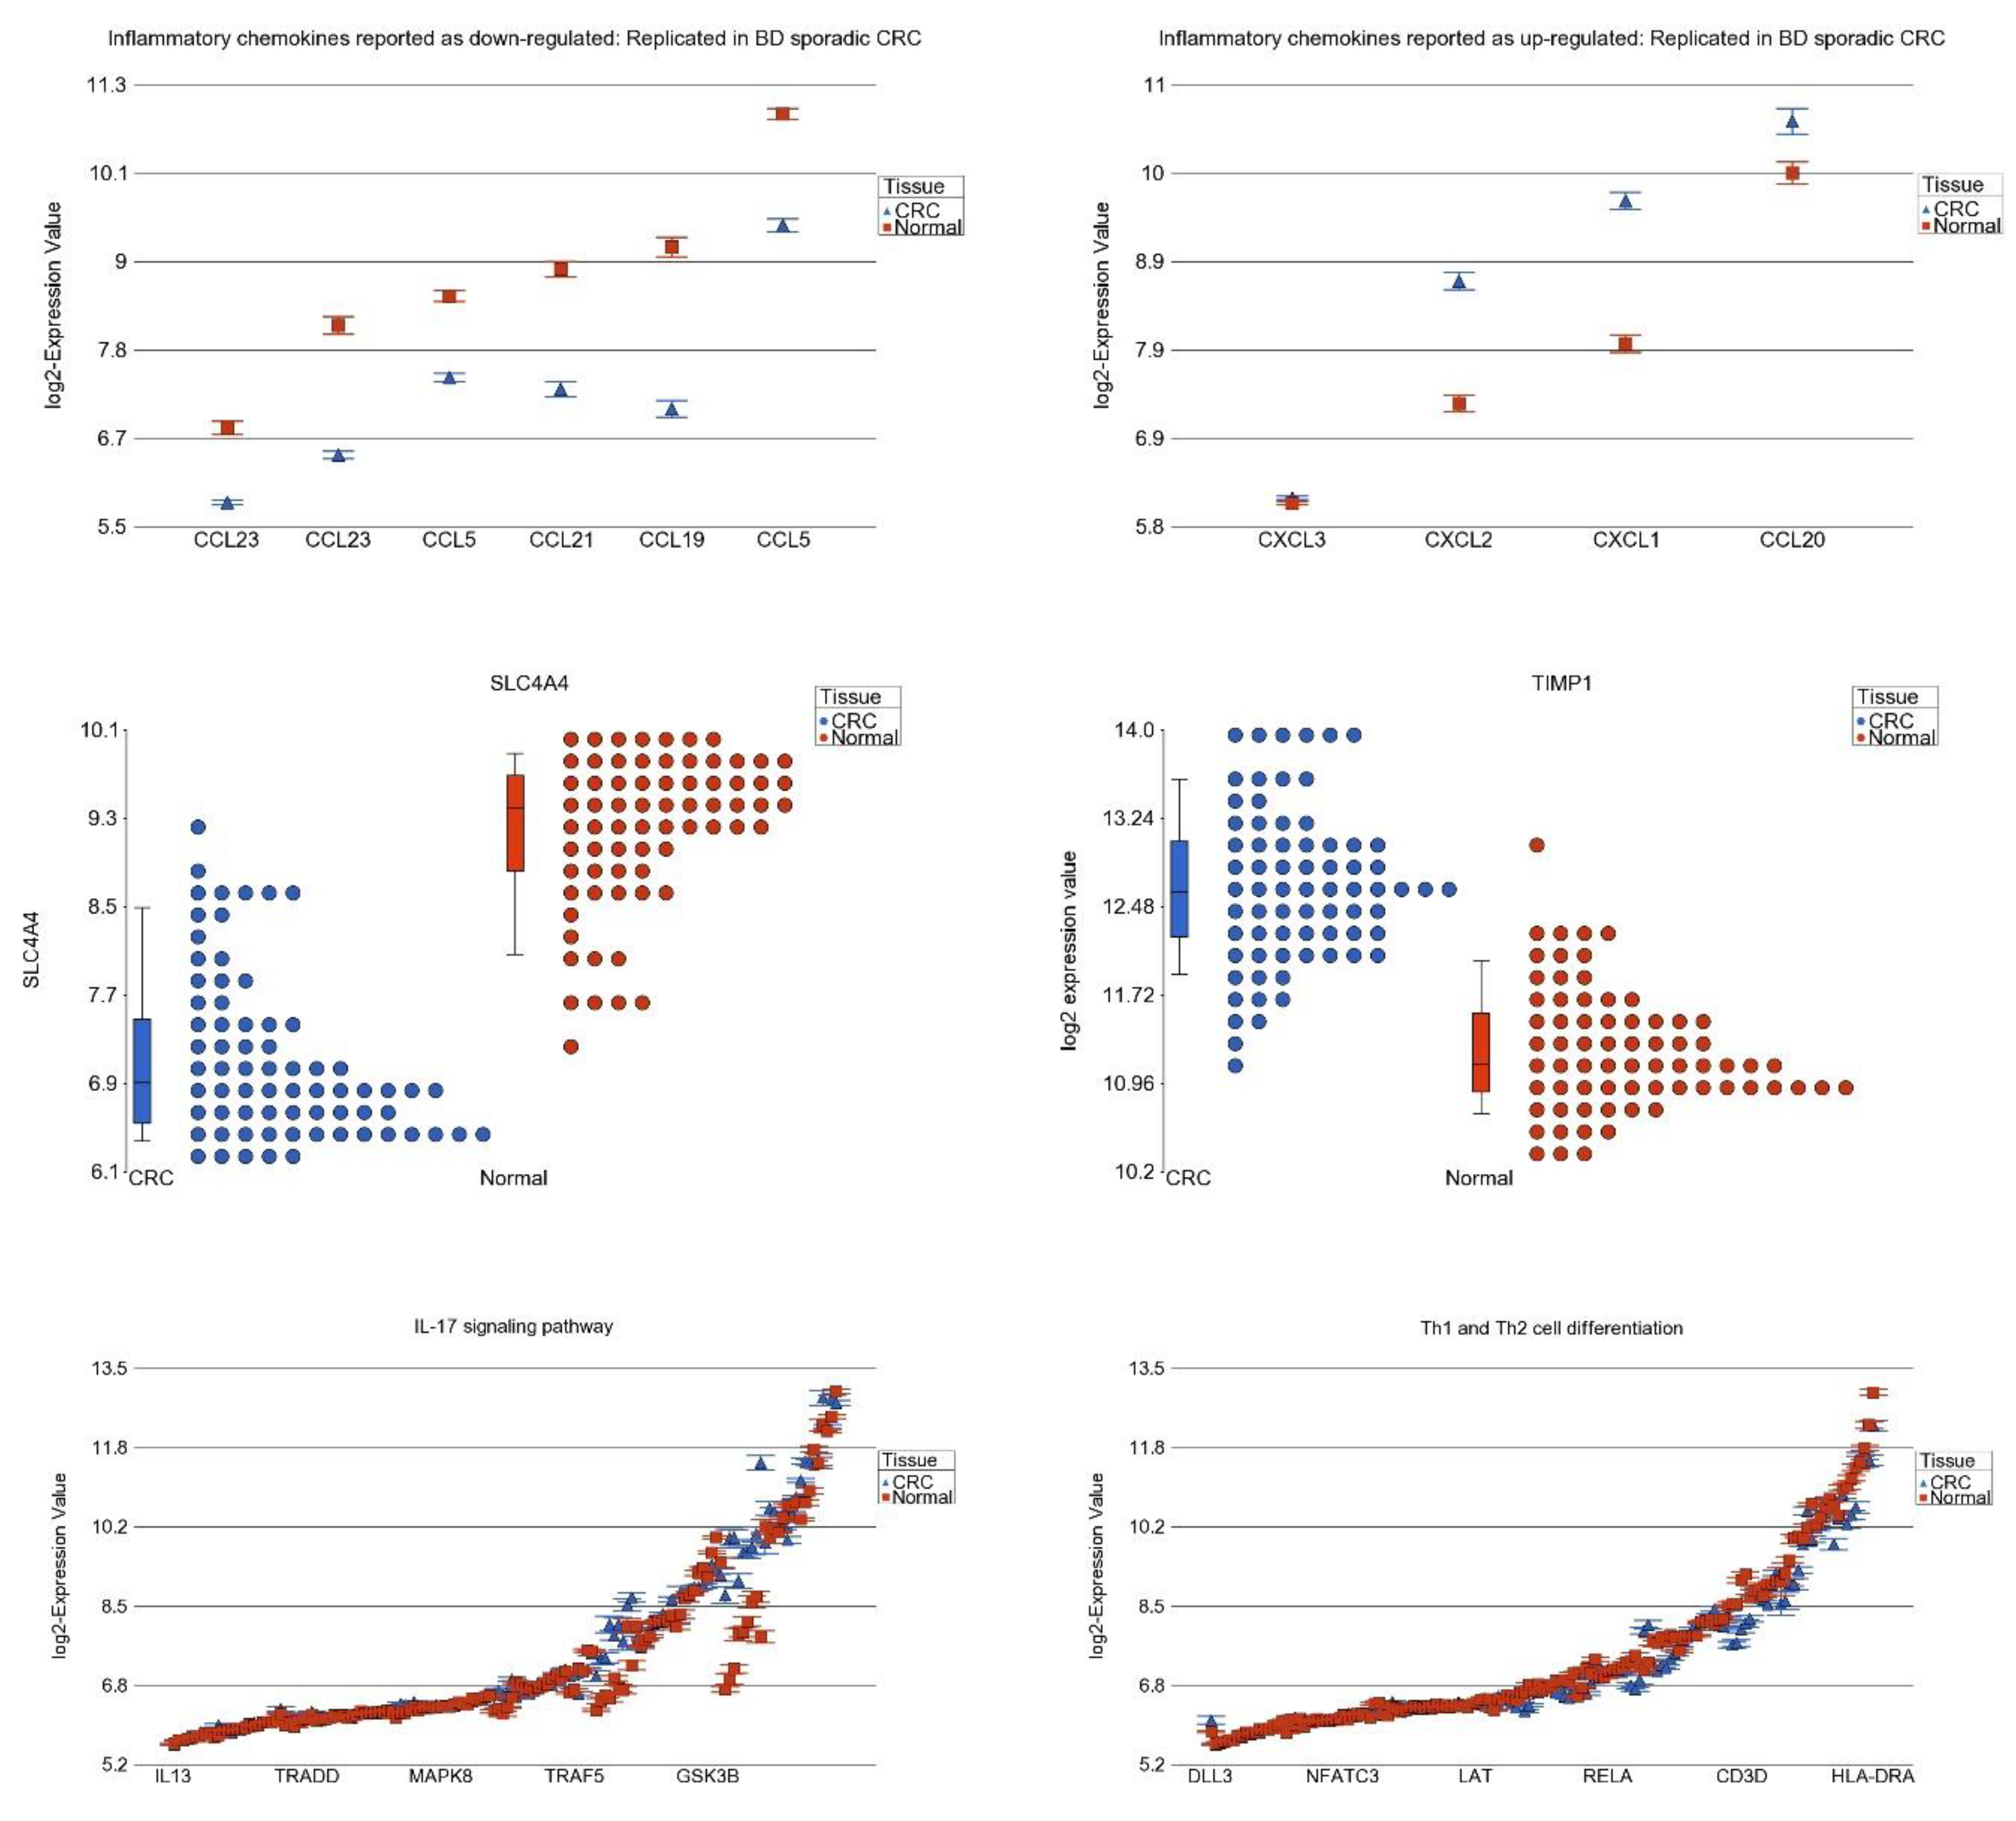
3.5. Replication Study in Sporadic CRC
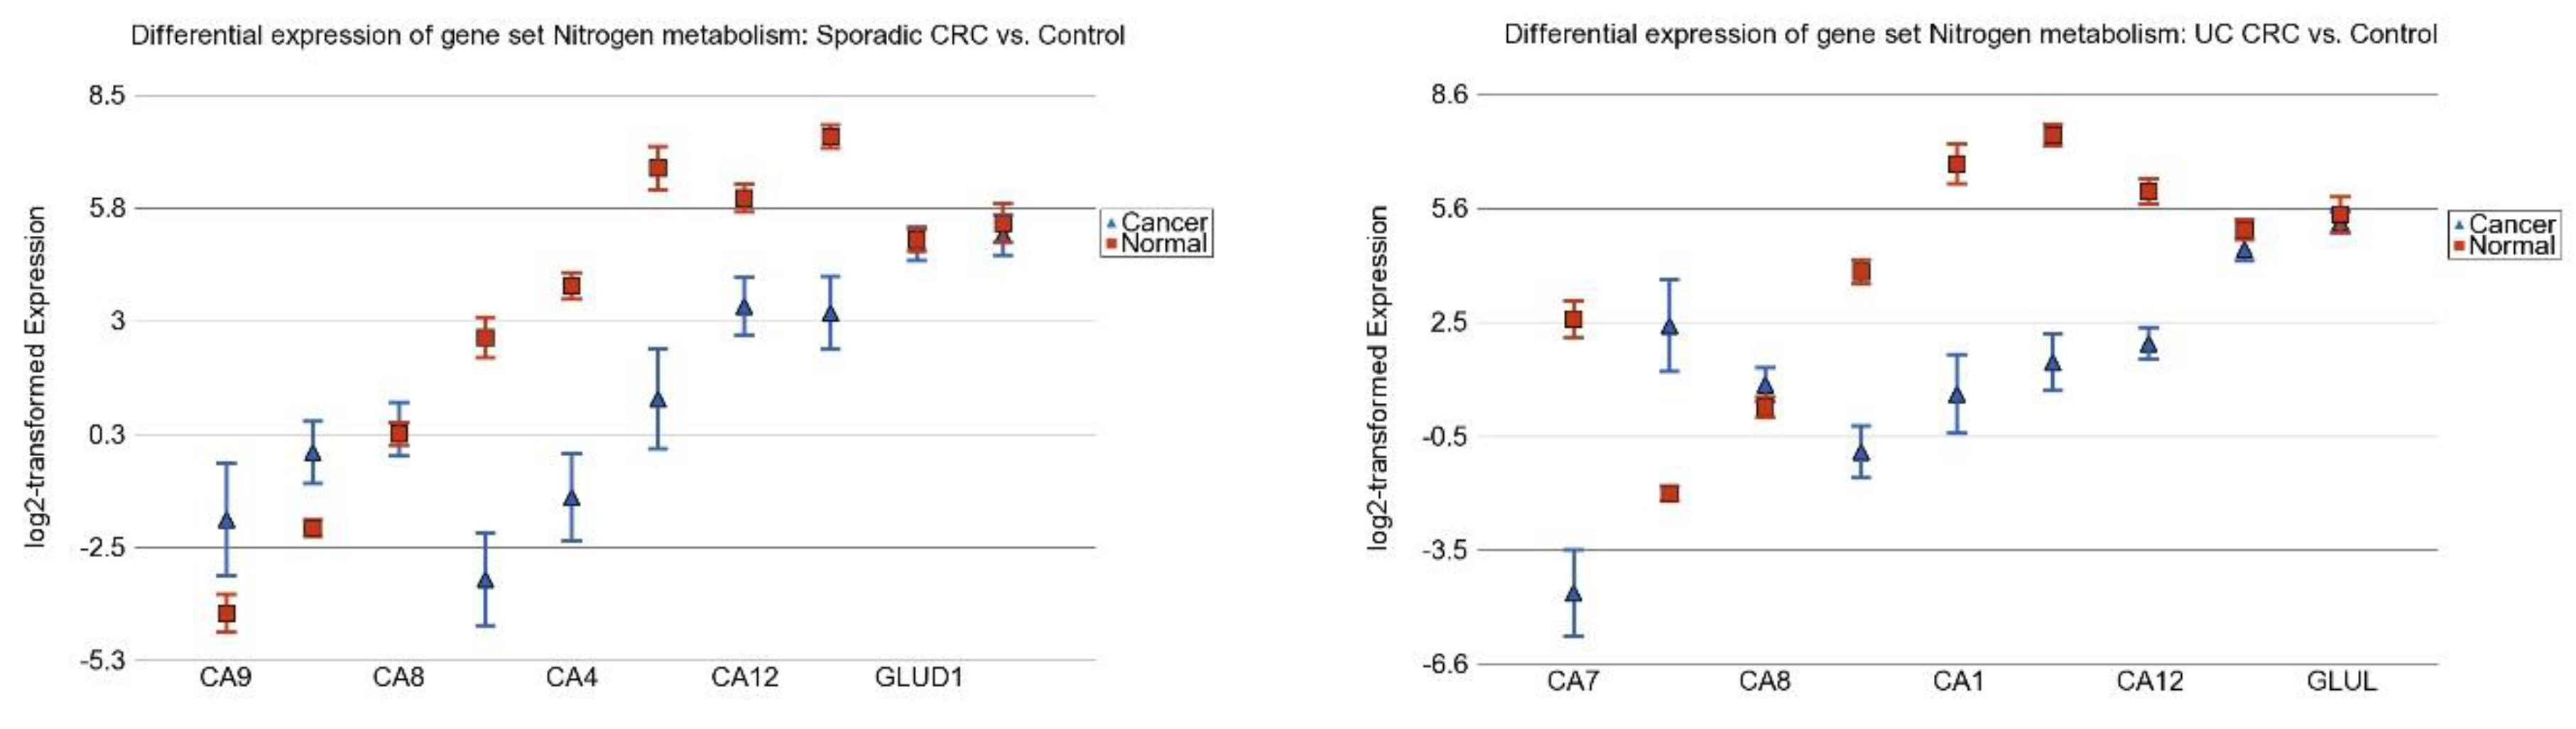
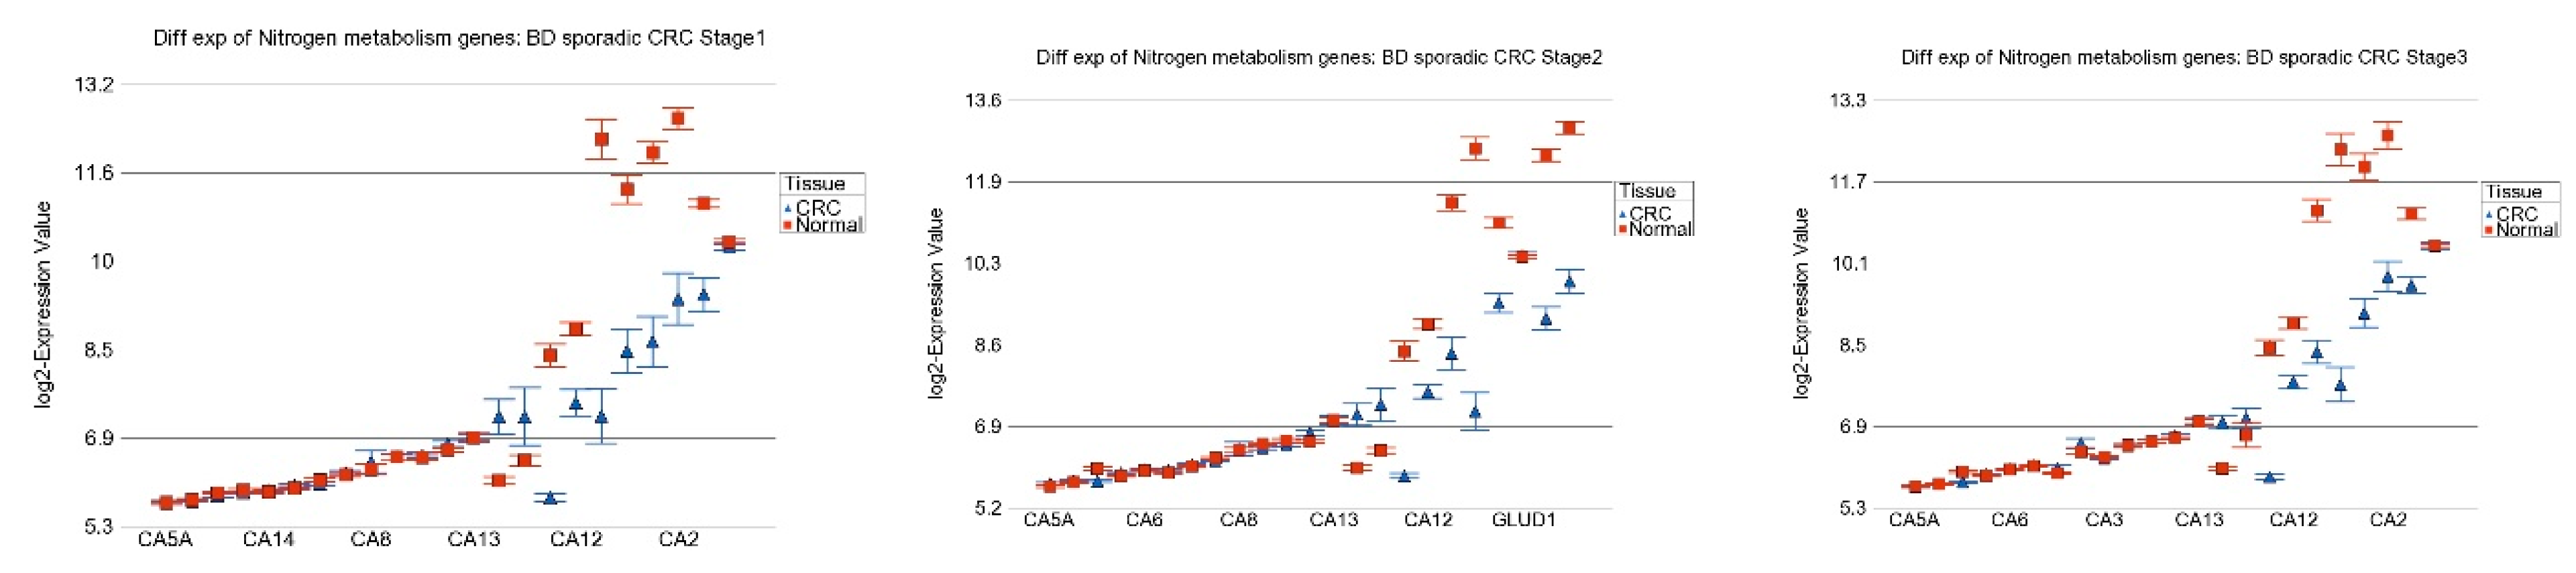
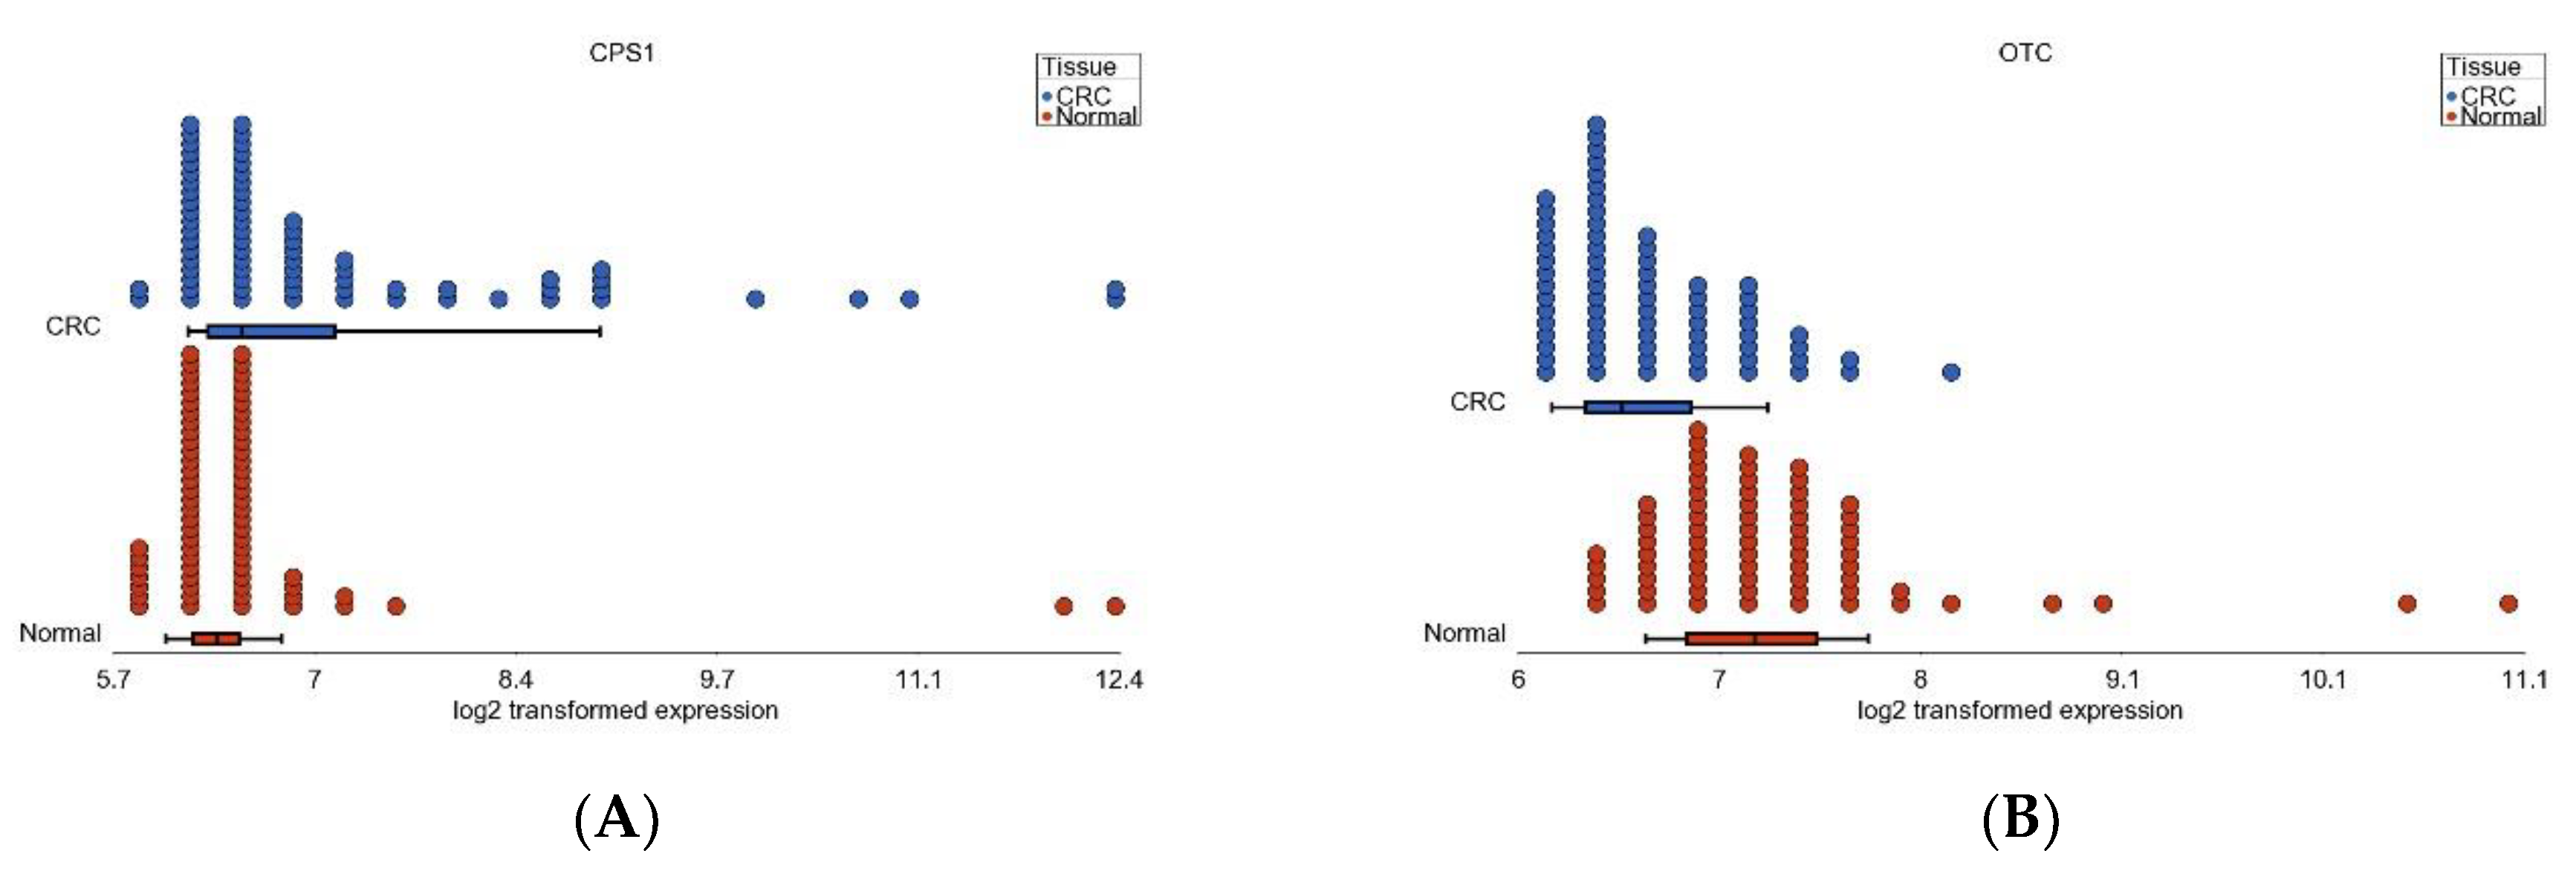
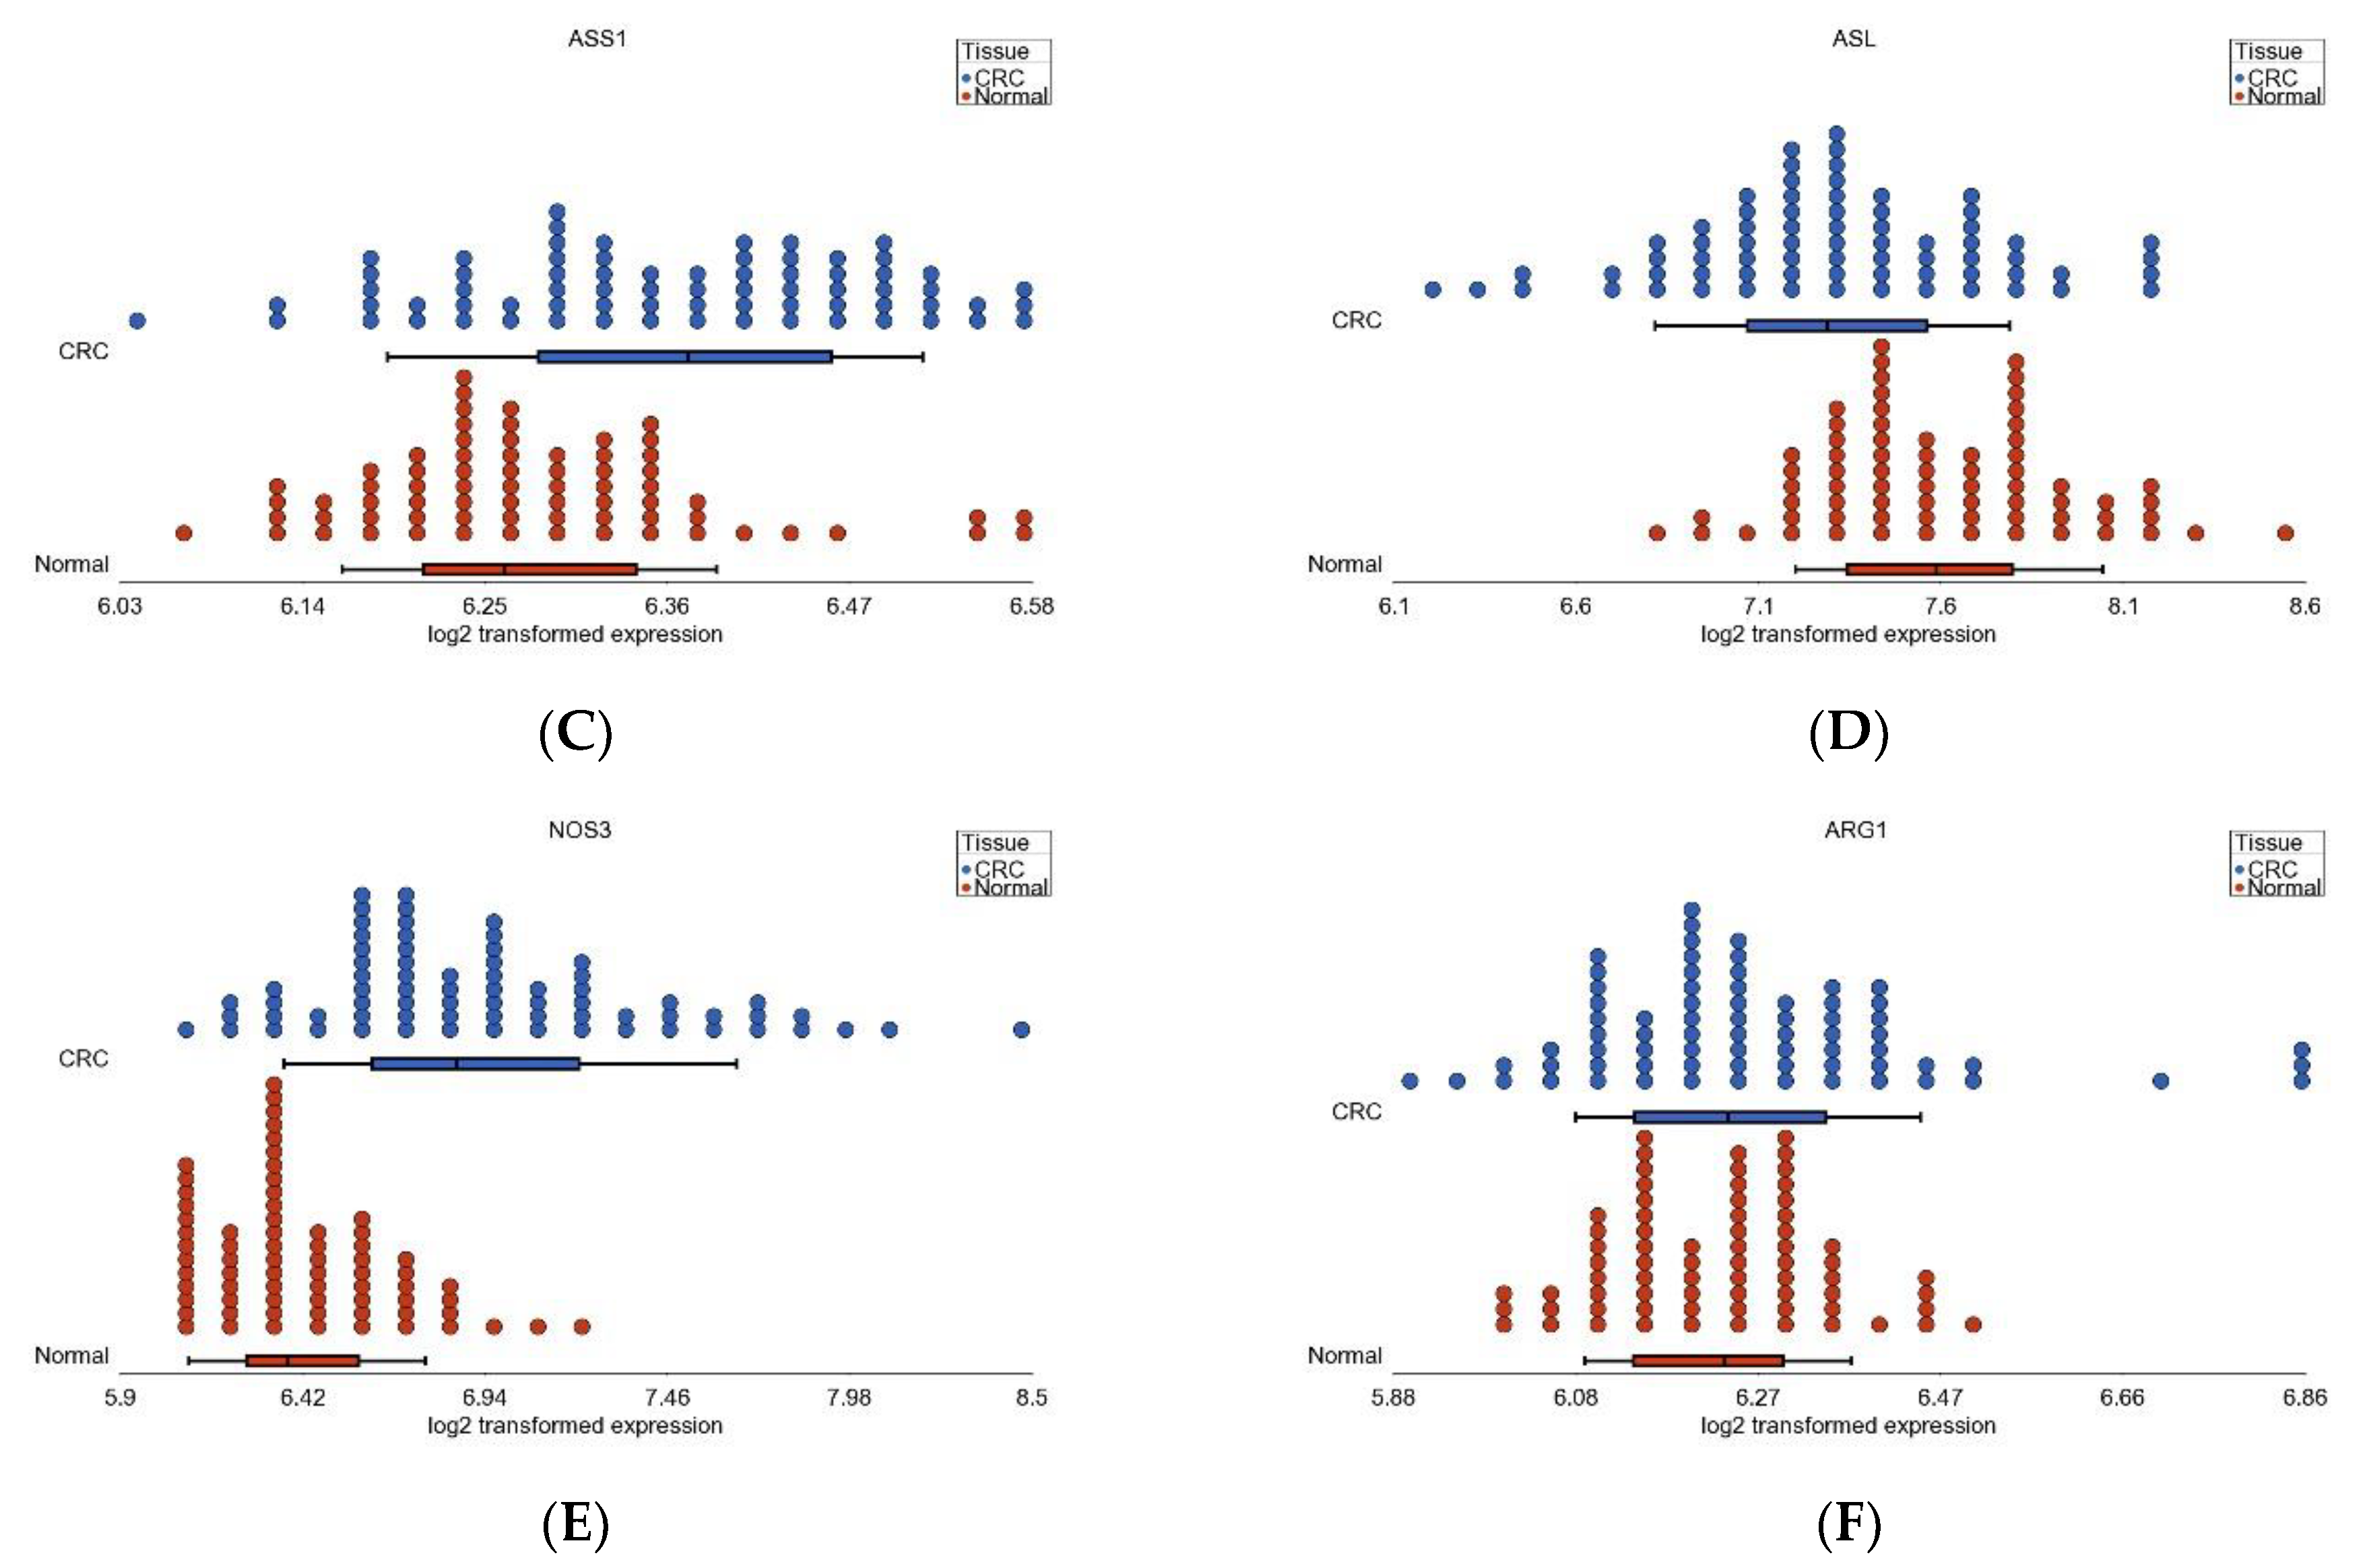
3.6. Nitrogen Metabolism, Genes for Urea Cycle Enzymes
3.7. Differential Expression of Previously Reported Inflammatory Genes in Our Dataset
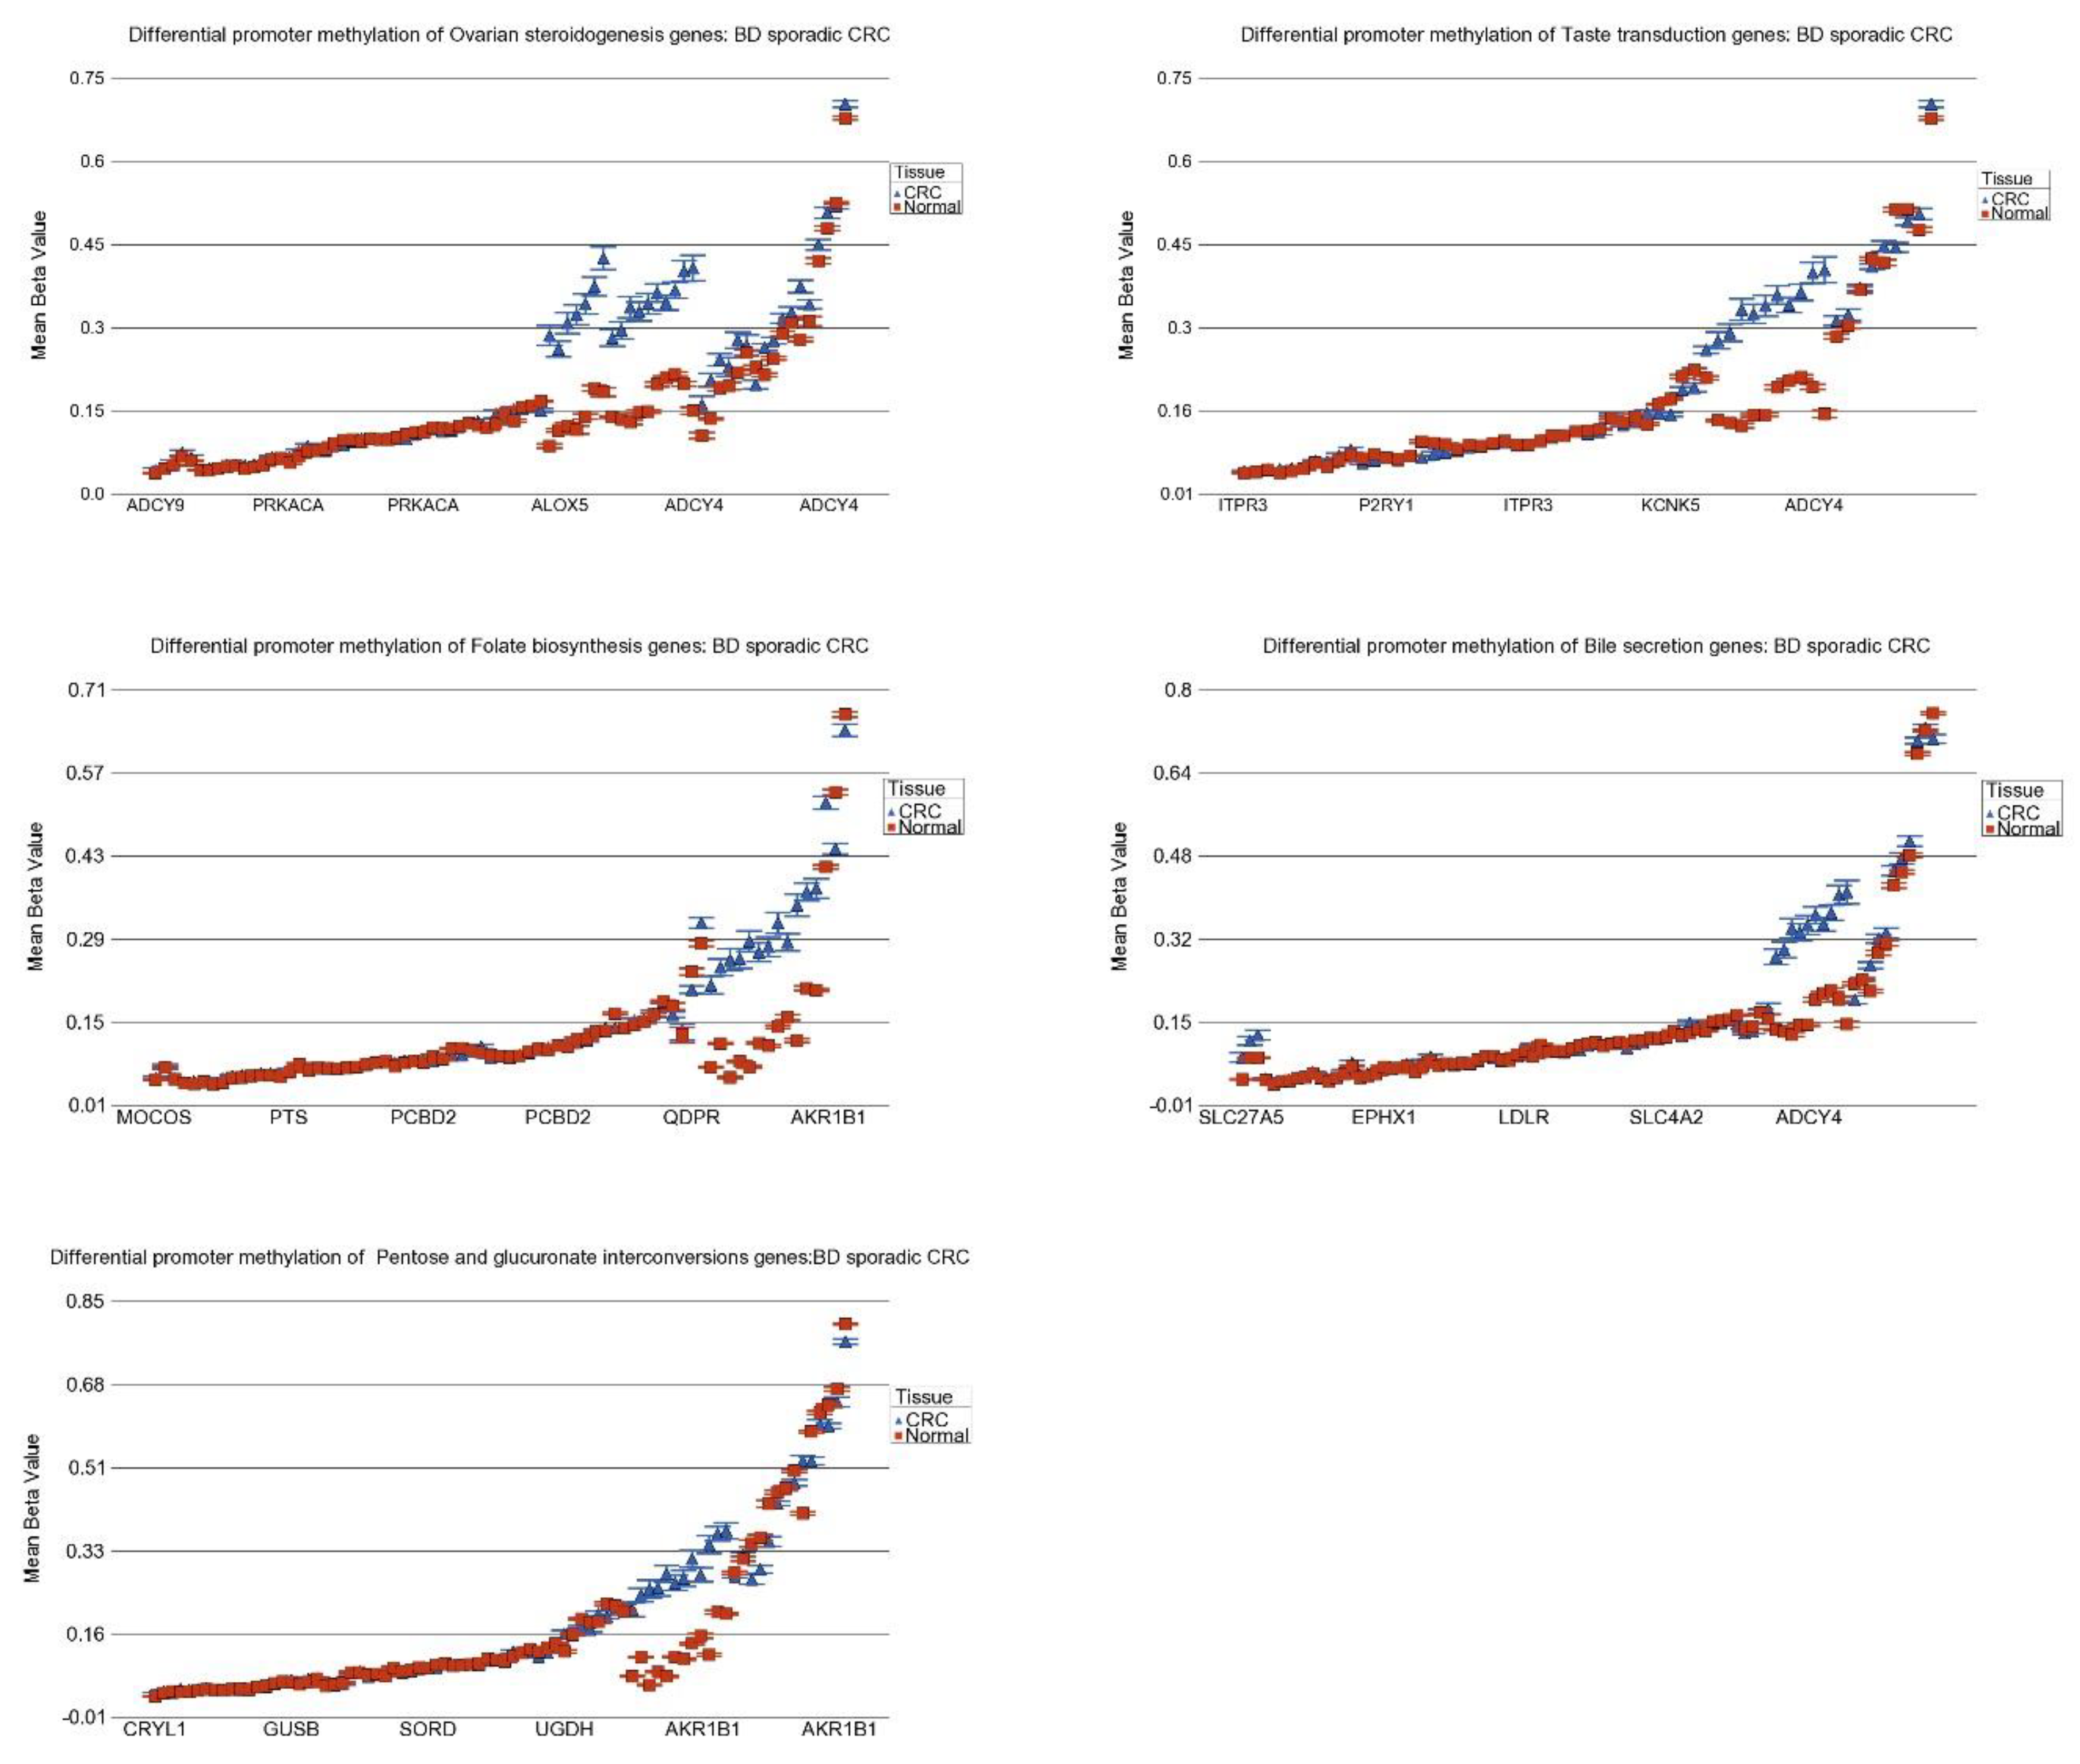
3.8. DNA Methylation of These Inflammation-Related Genes in CRC
4. Discussion
5. Conclusions
Supplementary Materials
Author Contributions
Funding
Institutional Review Board Statement
Informed Consent Statement
Data Availability Statement
Acknowledgments
Conflicts of Interest
References
- Guindi, M.; Riddell, R.H. Indeterminate colitis. J. Clin. Pathol. 2004, 57, 1233–1244. [Google Scholar] [CrossRef] [PubMed]
- Bray, F.; Ferlay, J.; Soerjomataram, I.; Siegel, R.L.; Torre, L.A.; Jemal, A. Global cancer statistics 2018: GLOBOCAN estimates of incidence and mortality worldwide for 36 cancers in 185 countries. CA Cancer J. Clin. 2018, 68, 394–424. [Google Scholar] [CrossRef] [PubMed]
- Lynch, H.T.; Watson, P.; Smyrk, T.C.; Lanspa, S.J.; Boman, B.M.; Boland, C.R.; Lynch, J.F.; Cavalieri, R.J.; Leppert, M.; White, R.; et al. Colon cancer genetics. Cancer 1992, 70, 1300–1312. [Google Scholar] [CrossRef] [PubMed]
- Lutgens, M.W.; van Oijen, M.G.; van der Heijden, G.J.; Vleggaar, F.P.; Siersema, P.D.; Oldenburg, B. Declining risk of colorectal cancer in inflammatory bowel disease: An updated meta-analysis of population-based cohort studies. Inflamm. Bowel Dis. 2013, 19, 789–799. [Google Scholar] [CrossRef] [PubMed]
- Herrinton, L.J.; Liu, L.; Levin, T.R.; Allison, J.E.; Lewis, J.D.; Velayos, F. Incidence and mortality of colorectal adenocarcinoma in persons with inflammatory bowel disease from 1998 to 2010. Gastroenterology 2012, 143, 382–389. [Google Scholar] [CrossRef] [PubMed]
- Yashiro, M. Ulcerative colitis-associated colorectal cancer. World J. Gastroenterol. 2014, 20, 16389–16397. [Google Scholar] [CrossRef] [PubMed]
- Lucafò, M.; Curci, D.; Franzin, M.; Decorti, G.; Stocco, G. Inflammatory Bowel Disease and Risk of Colorectal Cancer: An Overview From Pathophysiology to Pharmacological Prevention. Front. Pharmacol. 2021, 12, 772101. [Google Scholar] [CrossRef] [PubMed]
- Pekow, J.; Hernandez, K.; Meckel, K.; Deng, Z.; Haider, H.I.; Khalil, A.; Zhang, C.; Talisila, N.; Siva, S.; Jasmine, F.; et al. IBD-associated Colon Cancers Differ in DNA Methylation and Gene Expression Profiles Compared With Sporadic Colon Cancers. J. Crohns Colitis 2019, 13, 884–893. [Google Scholar] [CrossRef]
- Itzkowitz, S.H.; Yio, X. Inflammation and cancer IV. Colorectal cancer in inflammatory bowel disease: The role of inflammation. Am. J. Physiol. Gastrointest. Liver Physiol. 2004, 287, G7–G17. [Google Scholar] [CrossRef]
- Jasmine, F.; Haq, Z.; Kamal, M.; Raza, M.; da Silva, G.; Gorospe, K.; Paul, R.; Strzempek, P.; Ahsan, H.; Kibriya, M.G. Interaction between Microsatellite Instability (MSI) and Tumor DNA Methylation in the Pathogenesis of Colorectal Carcinoma. Cancers 2021, 13, 4956. [Google Scholar] [CrossRef]
- Luo, C.; Zhang, H. The Role of Proinflammatory Pathways in the Pathogenesis of Colitis-Associated Colorectal Cancer. Mediators Inflamm. 2017, 2017, 5126048. [Google Scholar] [CrossRef] [PubMed]
- Rajamäki, K.; Taira, A.; Katainen, R.; Välimäki, N.; Kuosmanen, A.; Plaketti, R.M.; Seppälä, T.T.; Ahtiainen, M.; Wirta, E.V.; Vartiainen, E.; et al. Genetic and Epigenetic Characteristics of Inflammatory Bowel Disease-Associated Colorectal Cancer. Gastroenterology 2021, 161, 592–607. [Google Scholar] [CrossRef] [PubMed]
- Feagins, L.A.; Souza, R.F.; Spechler, S.J. Carcinogenesis in IBD: Potential targets for the prevention of colorectal cancer. Nat. Rev. Gastroenterol. Hepatol. 2009, 6, 297–305. [Google Scholar] [CrossRef] [PubMed]
- Khalyfa, A.A.; Punatar, S.; Aslam, R.; Yarbrough, A. Exploring the Inflammatory Pathogenesis of Colorectal Cancer. Diseases 2021, 9, 79. [Google Scholar] [CrossRef] [PubMed]
- Nosho, K.; Sukawa, Y.; Adachi, Y.; Ito, M.; Mitsuhashi, K.; Kurihara, H.; Kanno, S.; Yamamoto, I.; Ishigami, K.; Igarashi, H.; et al. Association of Fusobacterium nucleatum with immunity and molecular alterations in colorectal cancer. World J. Gastroenterol. 2016, 22, 557–566. [Google Scholar] [CrossRef]
- Chen, T.; Li, Q.; Wu, J.; Wu, Y.; Peng, W.; Li, H.; Wang, J.; Tang, X.; Peng, Y.; Fu, X. Fusobacterium nucleatum promotes M2 polarization of macrophages in the microenvironment of colorectal tumours via a TLR4-dependent mechanism. Cancer Immunol. Immunother. 2018, 67, 1635–1646. [Google Scholar] [CrossRef]
- Hu, L.; Liu, Y.; Kong, X.; Wu, R.; Peng, Q.; Zhang, Y.; Zhou, L.; Duan, L. Fusobacterium nucleatum Facilitates M2 Macrophage Polarization and Colorectal Carcinoma Progression by Activating TLR4/NF-κB/S100A9 Cascade. Front. Immunol. 2021, 12, 658681. [Google Scholar] [CrossRef]
- Muller, M.; Hansmannel, F.; Arnone, D.; Choukour, M.; Ndiaye, N.C.; Kokten, T.; Houlgatte, R.; Peyrin-Biroulet, L. Genomic and molecular alterations in human inflammatory bowel disease-associated colorectal cancer. United Eur. Gastroenterol. J. 2020, 8, 675–684. [Google Scholar] [CrossRef]
- Sanchez, J.A.; Dejulius, K.L.; Bronner, M.; Church, J.M.; Kalady, M.F. Relative role of methylator and tumor suppressor pathways in ulcerative colitis-associated colon cancer. Inflamm. Bowel Dis. 2011, 17, 1966–1970. [Google Scholar] [CrossRef]
- Hsieh, C.J.; Klump, B.; Holzmann, K.; Borchard, F.; Gregor, M.; Porschen, R. Hypermethylation of the p16INK4a promoter in colectomy specimens of patients with long-standing and extensive ulcerative colitis. Cancer Res. 1998, 58, 3942–3945. [Google Scholar]
- Azarschab, P.; Porschen, R.; Gregor, M.; Blin, N.; Holzmann, K. Epigenetic control of the E-cadherin gene (CDH1) by CpG methylation in colectomy samples of patients with ulcerative colitis. Genes Chromosomes Cancer 2002, 35, 121–126. [Google Scholar] [CrossRef] [PubMed]
- Garrity-Park, M.M.; Loftus, E.V., Jr.; Sandborn, W.J.; Bryant, S.C.; Smyrk, T.C. Methylation status of genes in non-neoplastic mucosa from patients with ulcerative colitis-associated colorectal cancer. Am. J. Gastroenterol. 2010, 105, 1610–1619. [Google Scholar] [CrossRef]
- Keshet, R.; Szlosarek, P.; Carracedo, A.; Erez, A. Rewiring urea cycle metabolism in cancer to support anabolism. Nat. Rev. Cancer 2018, 18, 634–645. [Google Scholar] [CrossRef]
- Zhao, H.; Wu, L.; Yan, G.; Chen, Y.; Zhou, M.; Wu, Y.; Li, Y. Inflammation and tumor progression: Signaling pathways and targeted intervention. Signal. Transduct. Target. Ther. 2021, 6, 263. [Google Scholar] [CrossRef] [PubMed]
- Hamilton, S.R. Tumours of the colon and rectum. In World Health Organization Classification of Tumours—Pathology and Genetics of Tumours of the Digestive System; WHO: Geneva, Switzerland, 2000. [Google Scholar]
- Janavicius, R.; Matiukaite, D.; Jakubauskas, A.; Griskevicius, L. Microsatellite instability detection by high-resolution melting analysis. Clin. Chem. 2010, 56, 1750–1757. [Google Scholar] [CrossRef] [PubMed]
- Kibriya, M.G.; Raza, M.; Jasmine, F.; Roy, S.; Paul-Brutus, R.; Rahaman, R.; Dodsworth, C.; Rakibuz-Zaman, M.; Kamal, M.; Ahsan, H. A genome-wide DNA methylation study in colorectal carcinoma. BMC Med. Genom. 2011, 4, 50. [Google Scholar] [CrossRef]
- Downey, T. Analysis of a multifactor microarray study using Partek genomics solution. Methods Enzymol. 2006, 411, 256–270. [Google Scholar] [CrossRef]
- Kibriya, M.G.; Raza, M.; Kamal, M.; Haq, Z.; Paul, R.; Mareczko, A.; Pierce, B.L.; Ahsan, H.; Jasmine, F. Relative Telomere Length Change in Colorectal Carcinoma and Its Association with Tumor Characteristics, Gene Expression and Microsatellite Instability. Cancers 2022, 14, 2250. [Google Scholar] [CrossRef]
- Kibriya, M.G.; Raza, M.; Quinn, A.; Kamal, M.; Ahsan, H.; Jasmine, F. A Transcriptome and Methylome Study Comparing Tissues of Early and Late Onset Colorectal Carcinoma. Int. J. Mol. Sci. 2022, 23, 4261. [Google Scholar] [CrossRef]
- McLean, M.H.; Murray, G.I.; Stewart, K.N.; Norrie, G.; Mayer, C.; Hold, G.L.; Thomson, J.; Fyfe, N.; Hope, M.; Mowat, N.A.; et al. The inflammatory microenvironment in colorectal neoplasia. PLoS ONE 2011, 6, e15366. [Google Scholar] [CrossRef]
- Liang, Y.; Wu, X.; Su, Q.; Liu, Y.; Xiao, H. Identification and Validation of a Novel Inflammatory Response-Related Gene Signature for the Prognosis of Colon Cancer. J. Inflamm. Res. 2021, 14, 3809–3821. [Google Scholar] [CrossRef] [PubMed]
- Baba, Y.; Nosho, K.; Shima, K.; Goessling, W.; Chan, A.T.; Ng, K.; Chan, J.A.; Giovannucci, E.L.; Fuchs, C.S.; Ogino, S. PTGER2 overexpression in colorectal cancer is associated with microsatellite instability, independent of CpG island methylator phenotype. Cancer Epidemiol. Biomark. Prev. 2010, 19, 822–831. [Google Scholar] [CrossRef] [PubMed]
- Maiuri, A.R.; Li, H.; Stein, B.D.; Tennessen, J.M.; O’Hagan, H.M. Inflammation-induced DNA methylation of DNA polymerase gamma alters the metabolic profile of colon tumors. Cancer Metab. 2018, 6, 9. [Google Scholar] [CrossRef]
- Leung, A.W.; Backstrom, I.; Bally, M.B. Sulfonation, an underexploited area: From skeletal development to infectious diseases and cancer. Oncotarget 2016, 7, 55811–55827. [Google Scholar] [CrossRef] [PubMed]
- Xu, P.; Xi, Y.; Zhu, J.; Zhang, M.; Luka, Z.; Stolz, D.B.; Cai, X.; Xie, Y.; Xu, M.; Ren, S.; et al. Intestinal Sulfation Is Essential to Protect Against Colitis and Colonic Carcinogenesis. Gastroenterology 2021, 161, 271–286.e11. [Google Scholar] [CrossRef]
- Witherspoon, M.; Sandu, D.; Lu, C.; Wang, K.; Edwards, R.; Yeung, A.; Gelincik, O.; Manfredi, G.; Gross, S.; Kopelovich, L.; et al. ETHE1 overexpression promotes SIRT1 and PGC1α mediated aerobic glycolysis, oxidative phosphorylation, mitochondrial biogenesis and colorectal cancer. Oncotarget 2019, 10, 4004–4017. [Google Scholar] [CrossRef]
- Ramasamy, S.; Singh, S.; Taniere, P.; Langman, M.J.; Eggo, M.C. Sulfide-detoxifying enzymes in the human colon are decreased in cancer and upregulated in differentiation. Am. J. Physiol. Gastrointest. Liver Physiol. 2006, 291, G288–G296. [Google Scholar] [CrossRef]
- Nakada, N.; Mikami, T.; Horie, K.; Nagashio, R.; Sakurai, Y.; Sanoyama, I.; Yoshida, T.; Sada, M.; Kobayashi, K.; Sato, Y.; et al. Expression of CA2 and CA9 carbonic anhydrases in ulcerative colitis and ulcerative colitis-associated colorectal cancer. Pathol. Int. 2020, 70, 523–532. [Google Scholar] [CrossRef]
- Schniers, A.; Goll, R.; Pasing, Y.; Sørbye, S.W.; Florholmen, J.; Hansen, T. Ulcerative colitis: Functional analysis of the in-depth proteome. Clin. Proteom. 2019, 16, 4. [Google Scholar] [CrossRef]
- Yang, H.; Wu, J.; Zhang, J.; Yang, Z.; Jin, W.; Li, Y.; Jin, L.; Yin, L.; Liu, H.; Wang, Z. Integrated bioinformatics analysis of key genes involved in progress of colon cancer. Mol. Genet. Genom. Med. 2019, 7, e00588. [Google Scholar] [CrossRef]
- Yoo, C.W.; Nam, B.H.; Kim, J.Y.; Shin, H.J.; Lim, H.; Lee, S.; Lee, S.K.; Lim, M.C.; Song, Y.J. Carbonic anhydrase XII expression is associated with histologic grade of cervical cancer and superior radiotherapy outcome. Radiat. Oncol. 2010, 5, 101. [Google Scholar] [CrossRef] [PubMed]
- Kurmi, K.; Haigis, M.C. Nitrogen Metabolism in Cancer and Immunity. Trends Cell. Biol. 2020, 30, 408–424. [Google Scholar] [CrossRef] [PubMed]
- O’Brien, S.J.; Kalbfleisch, T.; Srivastava, S.; Pan, J.; Rai, S.; Petras, R.E.; Ronquillo, N.; Polk, H.C., Jr.; Galandiuk, S. Decreased Tumoral Expression of Colon-Specific Water Channel Aquaporin 8 Is Associated With Reduced Overall Survival in Colon Adenocarcinoma. Dis. Colon Rectum 2021, 64, 1083–1095. [Google Scholar] [CrossRef] [PubMed]
- Zhang, H.; Du, W.B.; Guo, X.M.; Wang, L.K.; Cheng, J.M.; Wei, L.J. Identification of the AQP8-miR-92a network associated with the aggressive traits of colorectal cancer. Biochem. Biophys. Res. Commun. 2020, 527, 218–225. [Google Scholar] [CrossRef] [PubMed]
- Chen, X.; Chen, J.; Feng, Y.; Guan, W. Prognostic Value of SLC4A4 and its Correlation with Immune Infiltration in Colon Adenocarcinoma. Med. Sci. Monit. 2020, 26, e925016. [Google Scholar] [CrossRef]
- Hickman, D.; Pope, J.; Patil, S.D.; Fakis, G.; Smelt, V.; Stanley, L.A.; Payton, M.; Unadkat, J.D.; Sim, E. Expression of arylamine N-acetyltransferase in human intestine. Gut 1998, 42, 402–409. [Google Scholar] [CrossRef]
- Mariani, F.; Sena, P.; Roncucci, L. Inflammatory pathways in the early steps of colorectal cancer development. World J. Gastroenterol. 2014, 20, 9716–9731. [Google Scholar] [CrossRef]
- Mahid, S.S.; Colliver, D.W.; Crawford, N.P.; Martini, B.D.; Doll, M.A.; Hein, D.W.; Cobbs, G.A.; Petras, R.E.; Galandiuk, S. Characterization of N-acetyltransferase 1 and 2 polymorphisms and haplotype analysis for inflammatory bowel disease and sporadic colorectal carcinoma. BMC Med. Genet. 2007, 8, 28. [Google Scholar] [CrossRef]
- Wang, M.; Qi, Y.Y.; Chen, S.; Sun, D.F.; Wang, S.; Chen, J.; Li, Y.Q.; Han, W.; Yang, X.Y. Expression of UDP-glucuronosyltransferase 1A, nuclear factor erythroid-E2-related factor 2 and Kelch-like ECH-associated protein 1 in colonic mucosa, adenoma and adenocarcinoma tissue. Oncol. Lett. 2012, 4, 925–930. [Google Scholar] [CrossRef]


| Pathway (GO Description) | Stage 1 vs. Normal | Stage 2 vs. Normal | Stage 3 vs. Normal | Interaction p | |||
|---|---|---|---|---|---|---|---|
| FC | (95% CI) | FC | (95% CI) | FC | (95% CI) | ||
| Nitrogen metabolism | −1.72 | (−1.94–−1.53) | −1.76 | (−1.92–−1.61) | −1.66 | (−1.79–−1.55) | 0.558 |
| Proximal tubule bicarbonate reclamation | −1.27 | (−1.34–−1.20) | −1.38 | (−1.44–−1.32) | −1.34 | (−1.38–−1.29) | 1.29 × 10⁻³ |
| Pentose and glucuronate interconversions | −1.21 | (−1.28–−1.15) | −1.32 | (−1.37–−1.27) | −1.24 | (−1.28–−1.20) | 0.084 |
| Retinol metabolism | −1.20 | (−1.24–−1.16) | −1.27 | (−1.30–−1.23) | −1.19 | (−1.22–−1.17) | 8.33 × 10⁻³ |
| Sulfur metabolism | −1.20 | (−1.29–−1.12) | −1.31 | (−1.39–−1.24) | −1.30 | (−1.36–−1.24) | 3.65 × 10⁻² |
| Synthesis and degradation of ketone bodies | −1.18 | (−1.28–−1.09) | −1.26 | (−1.34–−1.19) | −1.22 | (−1.28–−1.16) | 0.353 |
| Mineral absorption | −1.17 | (−1.21–−1.14) | −1.16 | (−1.19–−1.14) | −1.17 | (−1.19–−1.15) | 1.10 × 10⁻⁷ |
| Drug metabolism-cytochrome P450 | −1.14 | (−1.18–−1.10) | −1.20 | (−1.23–−1.17) | −1.20 | (−1.22–−1.17) | 9.76 × 10⁻³ |
| Ascorbate and aldarate metabolism | −1.13 | (−1.19–−1.06) | −1.30 | (−1.35–−1.24) | −1.21 | (−1.25–−1.17) | 9.02 × 10⁻⁴ |
| Steroid hormone biosynthesis | −1.13 | (−1.17–−1.09) | −1.19 | (−1.22–−1.16) | −1.16 | (−1.18–−1.13) | 0.119 |
| Chemical carcinogenesis | −1.11 | (−1.14–−1.08) | −1.17 | (−1.19–−1.15) | −1.17 | (−1.19–−1.15) | 2.70 × 10⁻⁴ |
| Metabolism of xenobiotics by cytochrome P450 | −1.10 | (−1.14–−1.07) | −1.16 | (−1.19–−1.13) | −1.15 | (−1.18–−1.13) | 8.91 × 10⁻³ |
| Bile secretion | −1.10 | (−1.13–−1.07) | −1.14 | (−1.16–−1.12) | −1.13 | (−1.15–−1.11) | 1.37 × 10⁻² |
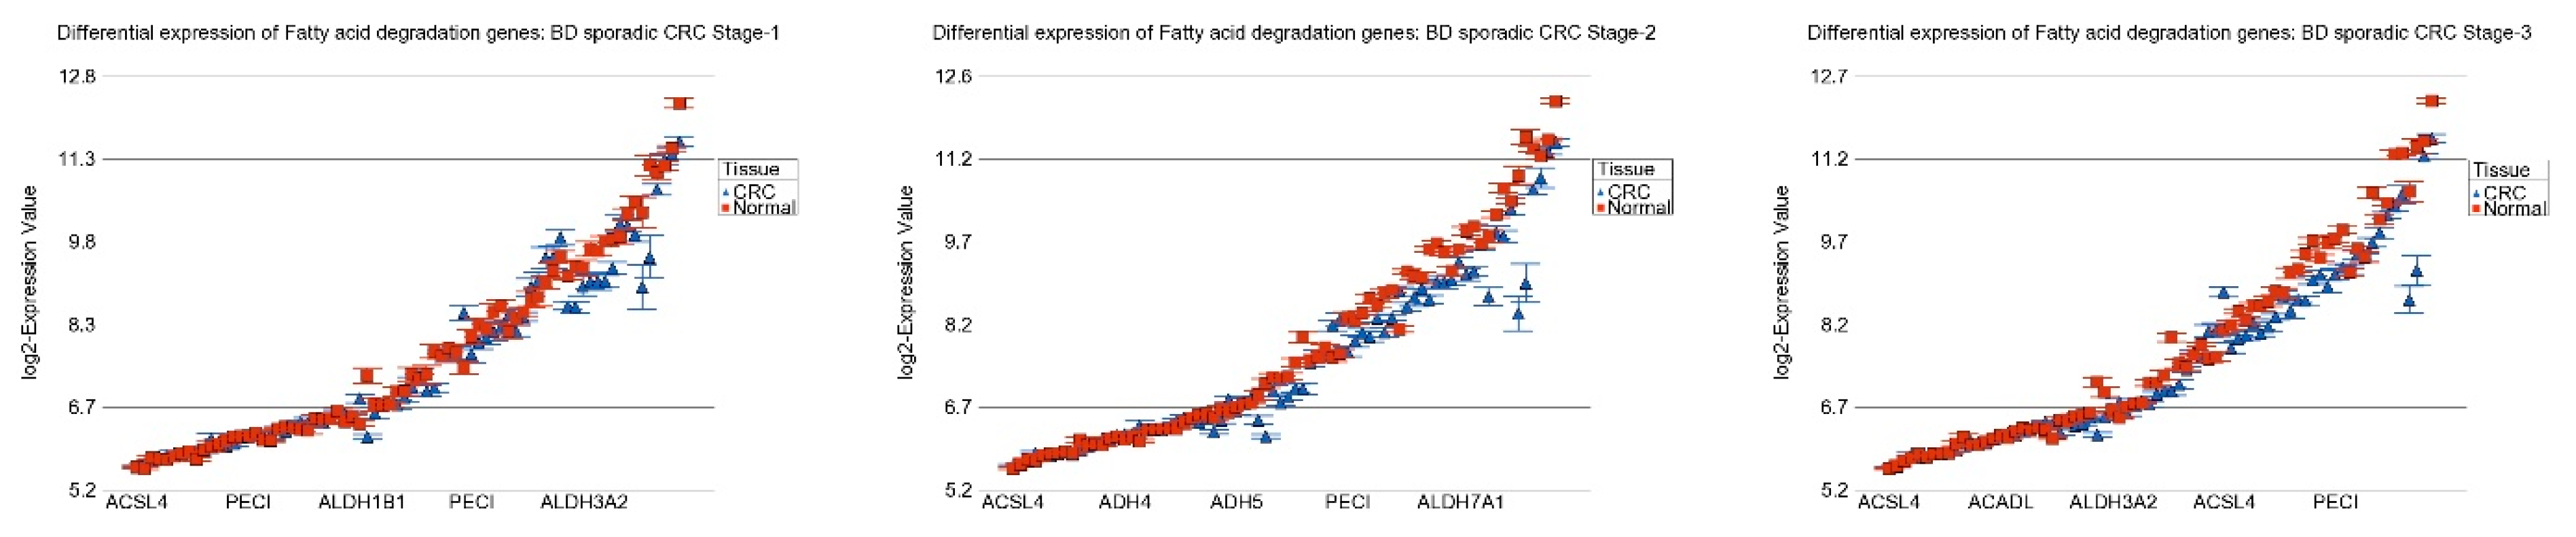
| Fatty acid degradation | −1.09 | (−1.13–−1.06) | −1.21 | (−1.24–−1.18) | −1.19 | (−1.21–−1.17) | 1.50 × 10⁻⁷ |
| Porphyrin and chlorophyll metabolism | −1.09 | (−1.13–−1.05) | −1.17 | (−1.20–−1.13) | −1.13 | (−1.16–−1.11) | 3.74 × 10⁻² |
| Butanoate metabolism | −1.06 | (−1.10–−1.03) | −1.14 | (−1.17–−1.11) | −1.12 | (−1.15–−1.10) | 7.69 × 10⁻³ |
| Valine, leucine and isoleucine degradation | −1.05 | (−1.09–−1.02) | −1.18 | (−1.20–−1.15) | −1.14 | (−1.16–−1.12) | 4.24 × 10⁻⁸ |
| Tryptophan metabolism | −1.05 | (−1.08–−1.02) | −1.08 | (−1.11–−1.06) | −1.09 | (−1.11–−1.07) | 8.57 × 10⁻³ |
| Tyrosine metabolism | −1.05 | (−1.09–−1.01) | −1.11 | (−1.14–−1.08) | −1.09 | (−1.12–−1.07) | 0.139 |
| Taste transduction | −1.05 | (−1.07–−1.04) | −1.05 | (−1.06–−1.04) | −1.05 | (−1.05–−1.04) | 0.453 |
| Phototransduction | −1.04 | (−1.06–−1.02) | −1.07 | (−1.09–−1.06) | −1.06 | (−1.08–−1.05) | 3.09 × 10⁻² |
| Ovarian steroidogenesis | −1.04 | (−1.06–−1.01) | −1.03 | (−1.05–−1.01) | −1.04 | (−1.05–−1.02) | 0.967 |
| Cardiac muscle contraction | −1.03 | (−1.05–−1.02) | −1.06 | (−1.07–−1.05) | −1.05 | (−1.06–−1.04) | 4.24 × 10⁻⁹ |
| Pantothenate and CoA biosynthesis | −1.03 | (−1.07–1.00) | −1.03 | (−1.06–−1.00) | −1.03 | (−1.05–−1.01) | 1.18 × 10⁻² |
| beta-Alanine metabolism | 1.01 | (−1.02–1.04) | −1.03 | (−1.05–−1.01) | −1.03 | (−1.05–−1.01) | 4.25 × 10⁻² |
| Folate biosynthesis | 1.02 | (−1.01–1.06) | −1.03 | (−1.06–−1.00) | −1.01 | (−1.03–1.01) | 1.30 × 10⁻³ |
| Primary bile acid biosynthesis | 1.08 | (1.03–1.14) | −1.01 | (−1.05–1.02) | −1.01 | (−1.04–1.02) | 1.66 × 10⁻² |
| Riboflavin metabolism | 1.09 | (1.02–1.17) | −1.03 | (−1.08–1.02) | 1.01 | (−1.03–1.05) | 2.98 × 10⁻³ |
| Pathway (GO Description) | MSI: CRC vs. Normal | MSS: CRC vs. Normal | Interaction p | ||
|---|---|---|---|---|---|
| FC | (95% CI) | FC | (95% CI) | ||
| Nitrogen metabolism | −1.72 | (−1.89–−1.56) | −1.70 | (−1.80–−1.60) | 0.232 |
| Sulfur metabolism | −1.36 | (−1.44–−1.28) | −1.26 | (−1.31–−1.21) | 2.03 × 10⁻² |
| Proximal tubule bicarbonate reclamation | −1.36 | (−1.42–−1.30) | −1.33 | (−1.37–−1.30) | 0.069 |
| Pentose and glucuronate interconversions | −1.35 | (−1.40–−1.29) | −1.23 | (−1.26–−1.20) | 3.37 × 10⁻⁶ |
| Synthesis and degradation of ketone bodies | −1.32 | (−1.41–−1.24) | −1.19 | (−1.24–−1.15) | 4.83 × 10⁻³ |
| Ascorbate and aldarate metabolism | −1.29 | (−1.35–−1.23) | −1.20 | (−1.23–−1.16) | 8.54 × 10⁻⁷ |
| Retinol metabolism | −1.27 | (−1.31–−1.23) | −1.20 | (−1.22–−1.18) | 1.78 × 10⁻⁴ |
| Steroid hormone biosynthesis | −1.22 | (−1.25–−1.18) | −1.14 | (−1.16–−1.12) | 1.80 × 10⁻⁴ |
| Drug metabolism-cytochrome P450 | −1.22 | (−1.25–−1.19) | −1.17 | (−1.19–−1.15) | 2.32 × 10⁻⁴ |
| Fatty acid degradation | −1.21 | (−1.23–−1.18) | −1.17 | (−1.19–−1.15) | 5.42 × 10⁻¹¹ |
| Chemical carcinogenesis | −1.18 | (−1.21–−1.16) | −1.15 | (−1.16–−1.13) | 6.15 × 10⁻⁵ |
| Porphyrin and chlorophyll metabolism | −1.17 | (−1.21–−1.13) | −1.12 | (−1.14–−1.10) | 4.22 × 10⁻⁵ |
| Metabolism of xenobiotics by cytochrome P450 | −1.17 | (−1.20–−1.14) | −1.14 | (−1.15–−1.12) | 1.78 × 10⁻⁴ |
| Bile secretion | −1.16 | (−1.18–−1.13) | −1.12 | (−1.14–−1.11) | 3.57 × 10⁻² |
| Valine, leucine and isoleucine degradation | −1.15 | (−1.18–−1.12) | −1.13 | (−1.14–−1.11) | 1.96 × 10⁻¹⁶ |
| Mineral absorption | −1.15 | (−1.18–−1.12) | −1.17 | (−1.19–−1.15) | 0.193 |
| Butanoate metabolism | −1.14 | (−1.17–−1.11) | −1.11 | (−1.13–−1.09) | 1.17 × 10⁻⁴ |
| Tyrosine metabolism | −1.11 | (−1.14–−1.08) | −1.08 | (−1.10–−1.06) | 0.198 |
| Phototransduction | −1.08 | (−1.10–−1.06) | −1.06 | (−1.07–−1.05) | 0.100 |
| Tryptophan metabolism | −1.07 | (−1.10–−1.05) | −1.08 | (−1.09–−1.06) | 1.74 × 10⁻⁵ |
| Cardiac muscle contraction | −1.05 | (−1.06–−1.04) | −1.05 | (−1.05–−1.04) | 1.00 × 10⁻⁵ |
| Folate biosynthesis | −1.04 | (−1.07–−1.01) | 1.00 | (−1.02–1.02) | 9.67 × 10⁻³ |
| Riboflavin metabolism | −1.04 | (−1.10–1.02) | 1.03 | (−1.01–1.06) | 0.079 |
| Taste transduction | −1.04 | (−1.06–−1.03) | −1.05 | (−1.06–−1.04) | 0.366 |
| Ovarian steroidogenesis | −1.04 | (−1.06–−1.02) | −1.04 | (−1.05–−1.02) | 0.930 |
Disclaimer/Publisher’s Note: The statements, opinions and data contained in all publications are solely those of the individual author(s) and contributor(s) and not of MDPI and/or the editor(s). MDPI and/or the editor(s) disclaim responsibility for any injury to people or property resulting from any ideas, methods, instructions or products referred to in the content. |
© 2023 by the authors. Licensee MDPI, Basel, Switzerland. This article is an open access article distributed under the terms and conditions of the Creative Commons Attribution (CC BY) license (https://creativecommons.org/licenses/by/4.0/).
Share and Cite
Kibriya, M.G.; Jasmine, F.; Pekow, J.; Munoz, A.; Weber, C.; Raza, M.; Kamal, M.; Ahsan, H.; Bissonnette, M. Pathways Related to Colon Inflammation Are Associated with Colorectal Carcinoma: A Transcriptome- and Methylome-Wide Study. Cancers 2023, 15, 2921. https://doi.org/10.3390/cancers15112921
Kibriya MG, Jasmine F, Pekow J, Munoz A, Weber C, Raza M, Kamal M, Ahsan H, Bissonnette M. Pathways Related to Colon Inflammation Are Associated with Colorectal Carcinoma: A Transcriptome- and Methylome-Wide Study. Cancers. 2023; 15(11):2921. https://doi.org/10.3390/cancers15112921
Chicago/Turabian StyleKibriya, Muhammad G., Farzana Jasmine, Joel Pekow, Aaron Munoz, Christopher Weber, Maruf Raza, Mohammed Kamal, Habibul Ahsan, and Marc Bissonnette. 2023. "Pathways Related to Colon Inflammation Are Associated with Colorectal Carcinoma: A Transcriptome- and Methylome-Wide Study" Cancers 15, no. 11: 2921. https://doi.org/10.3390/cancers15112921
APA StyleKibriya, M. G., Jasmine, F., Pekow, J., Munoz, A., Weber, C., Raza, M., Kamal, M., Ahsan, H., & Bissonnette, M. (2023). Pathways Related to Colon Inflammation Are Associated with Colorectal Carcinoma: A Transcriptome- and Methylome-Wide Study. Cancers, 15(11), 2921. https://doi.org/10.3390/cancers15112921