
Assessment of Variabilities in Lung-Contouring Methods on CBCT Preclinical Radiomics Outputs
 , ,
, , 
Abstract
Simple Summary
Abstract
1. Introduction
2. Materials and Methods
2.1. CBCT Datasets
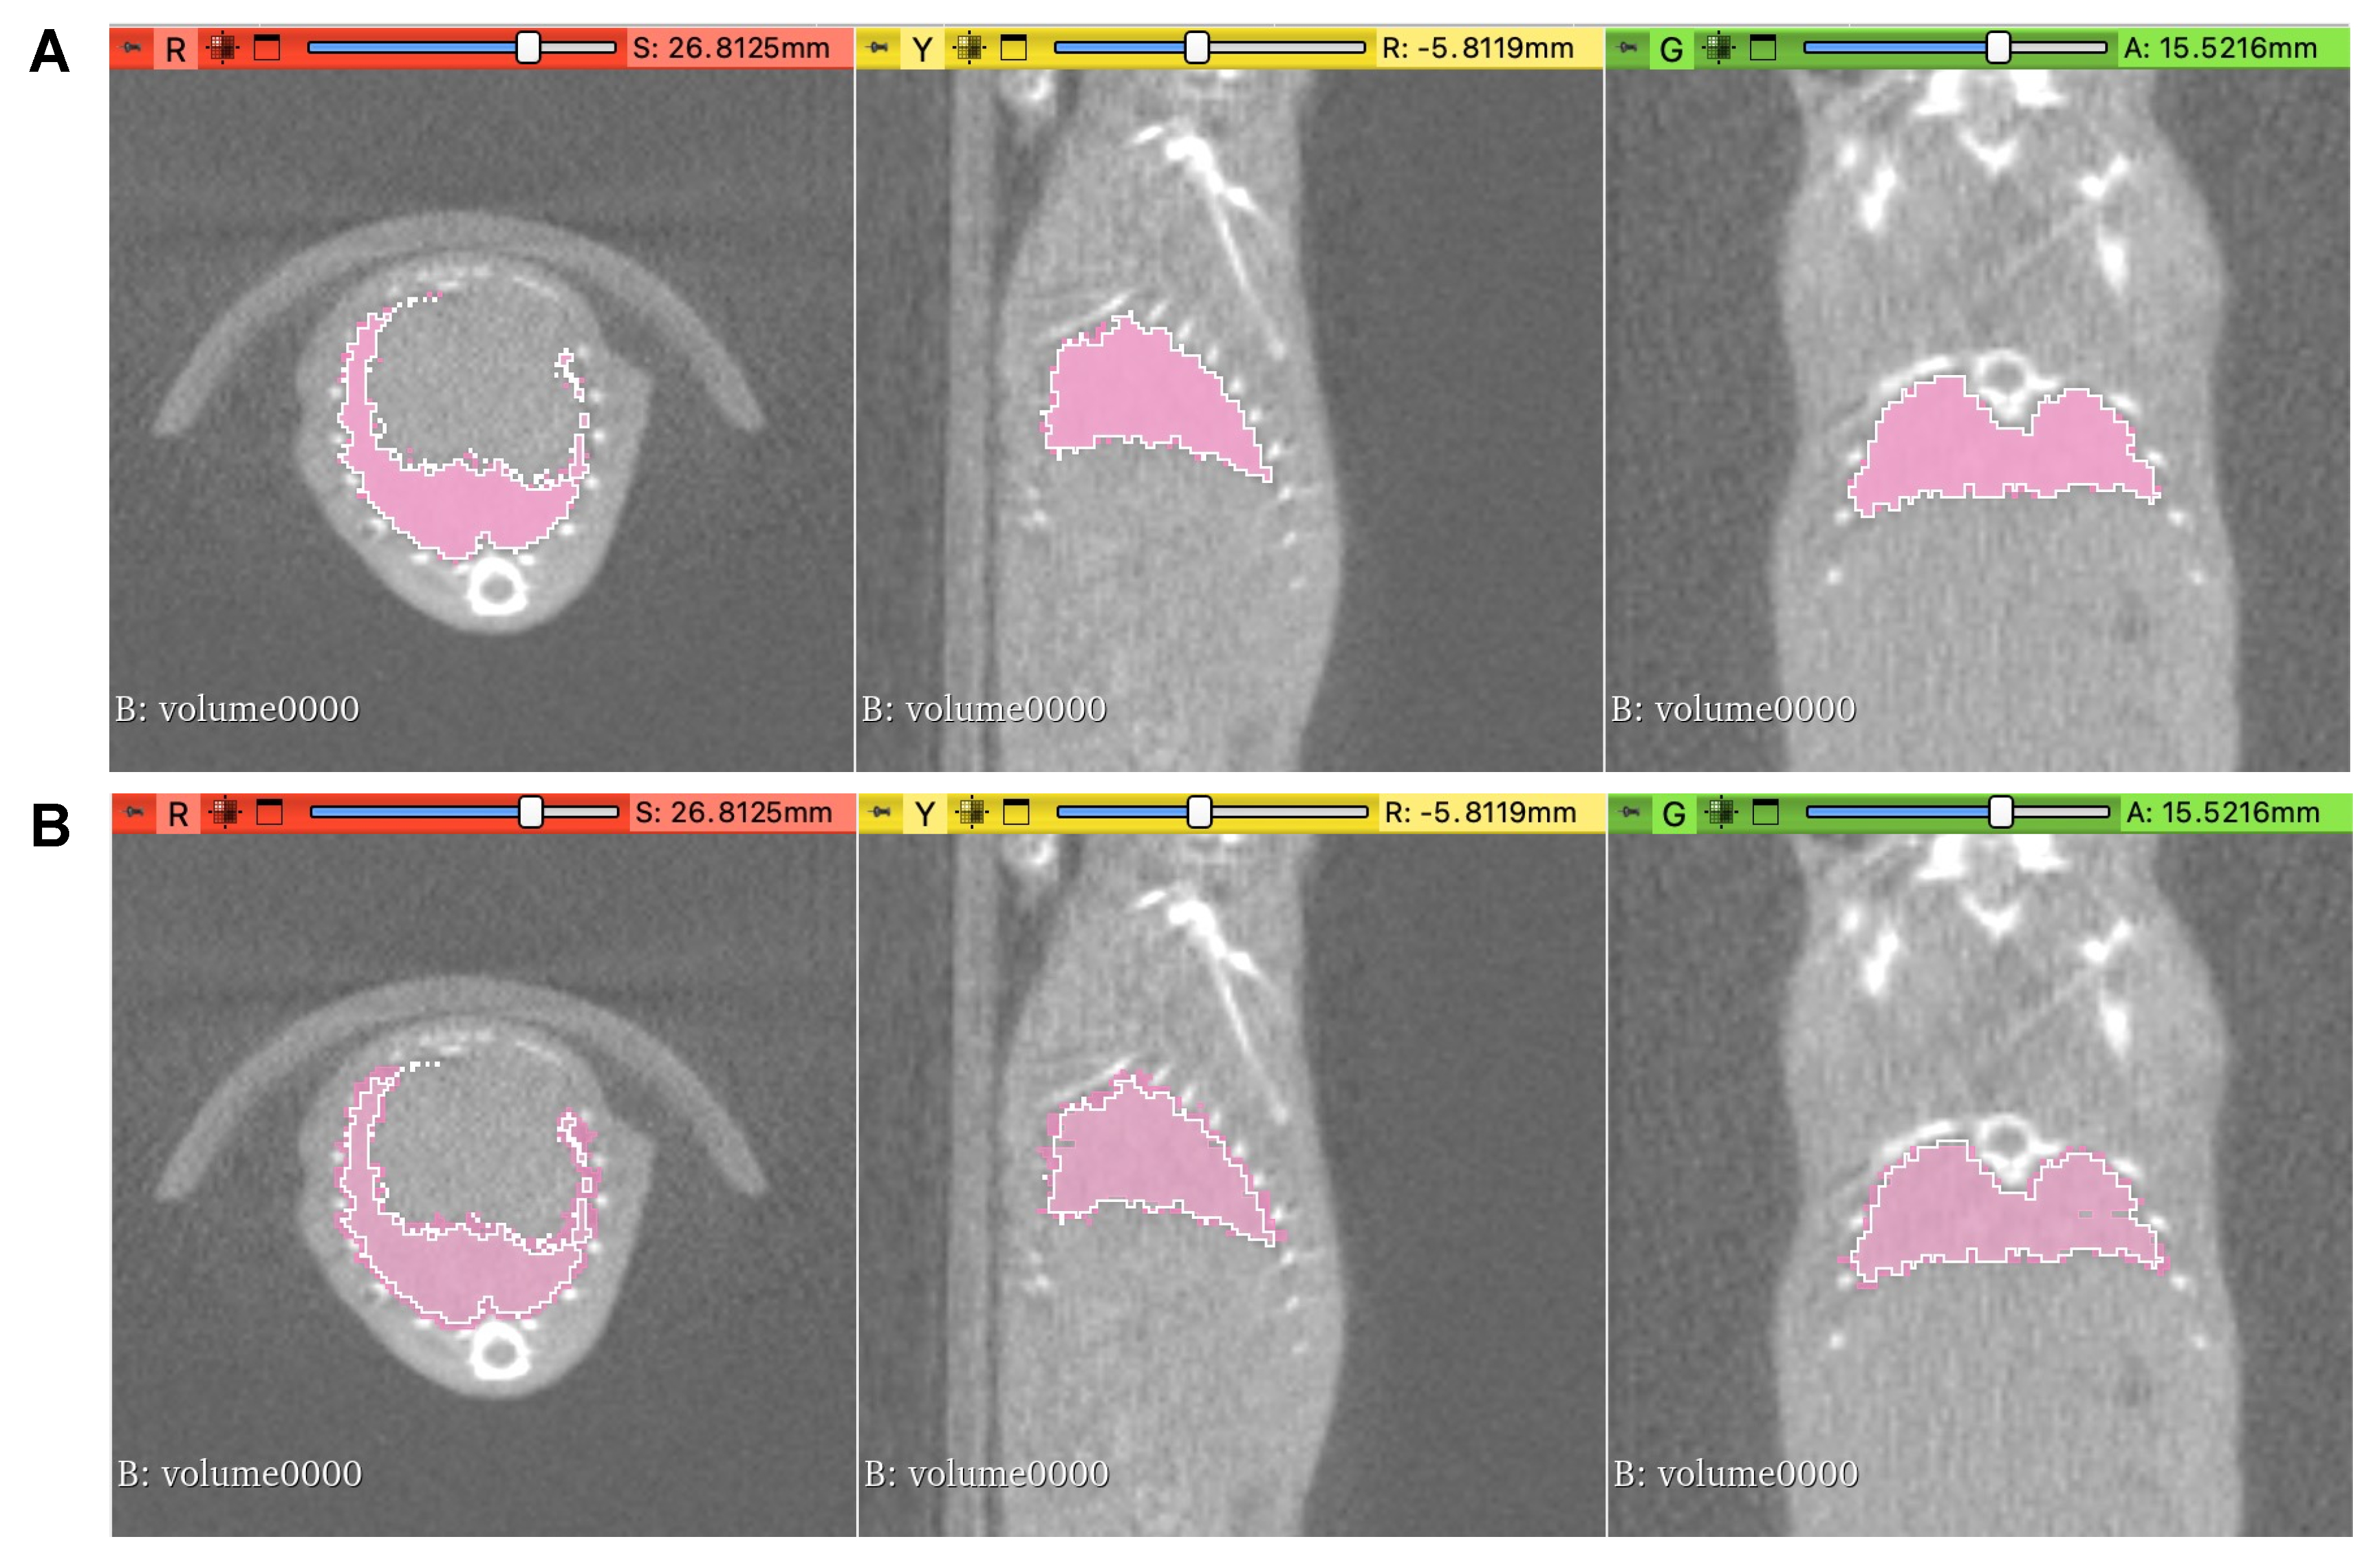
2.2. Contouring Methods
2.3. Radiomics Analysis
2.4. Statistical Analysis
3. Results
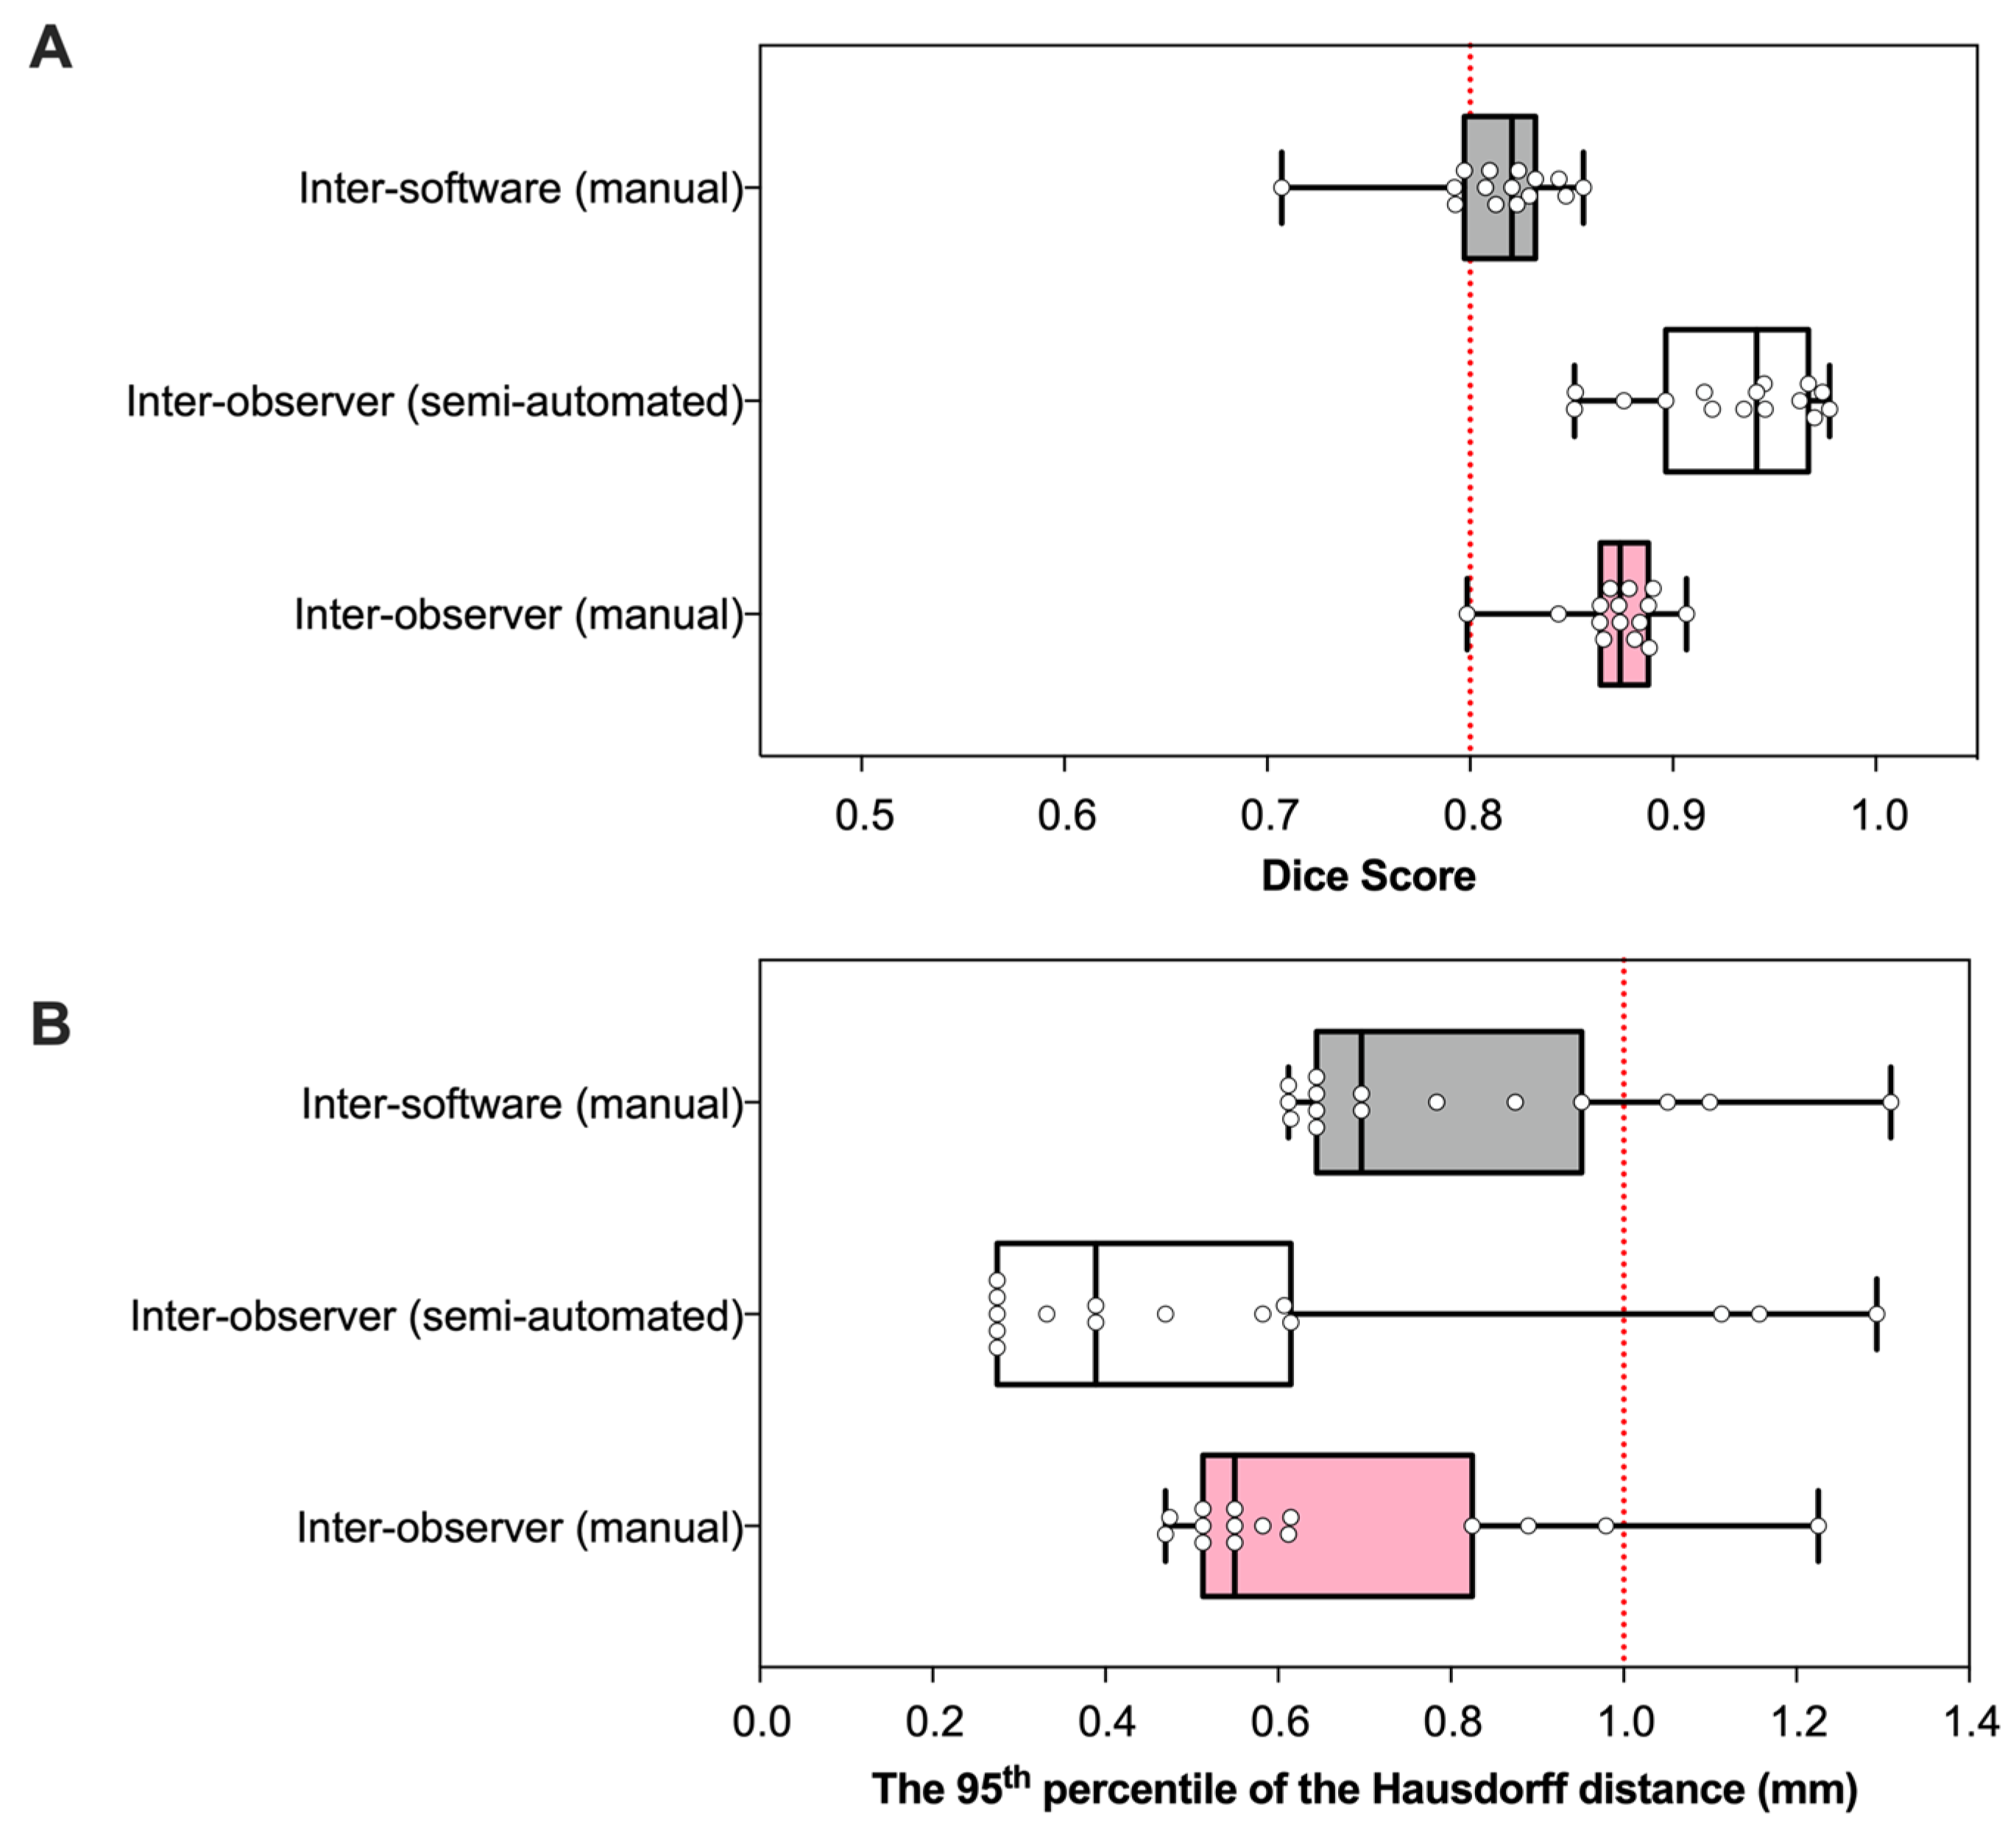
3.1. Geometry
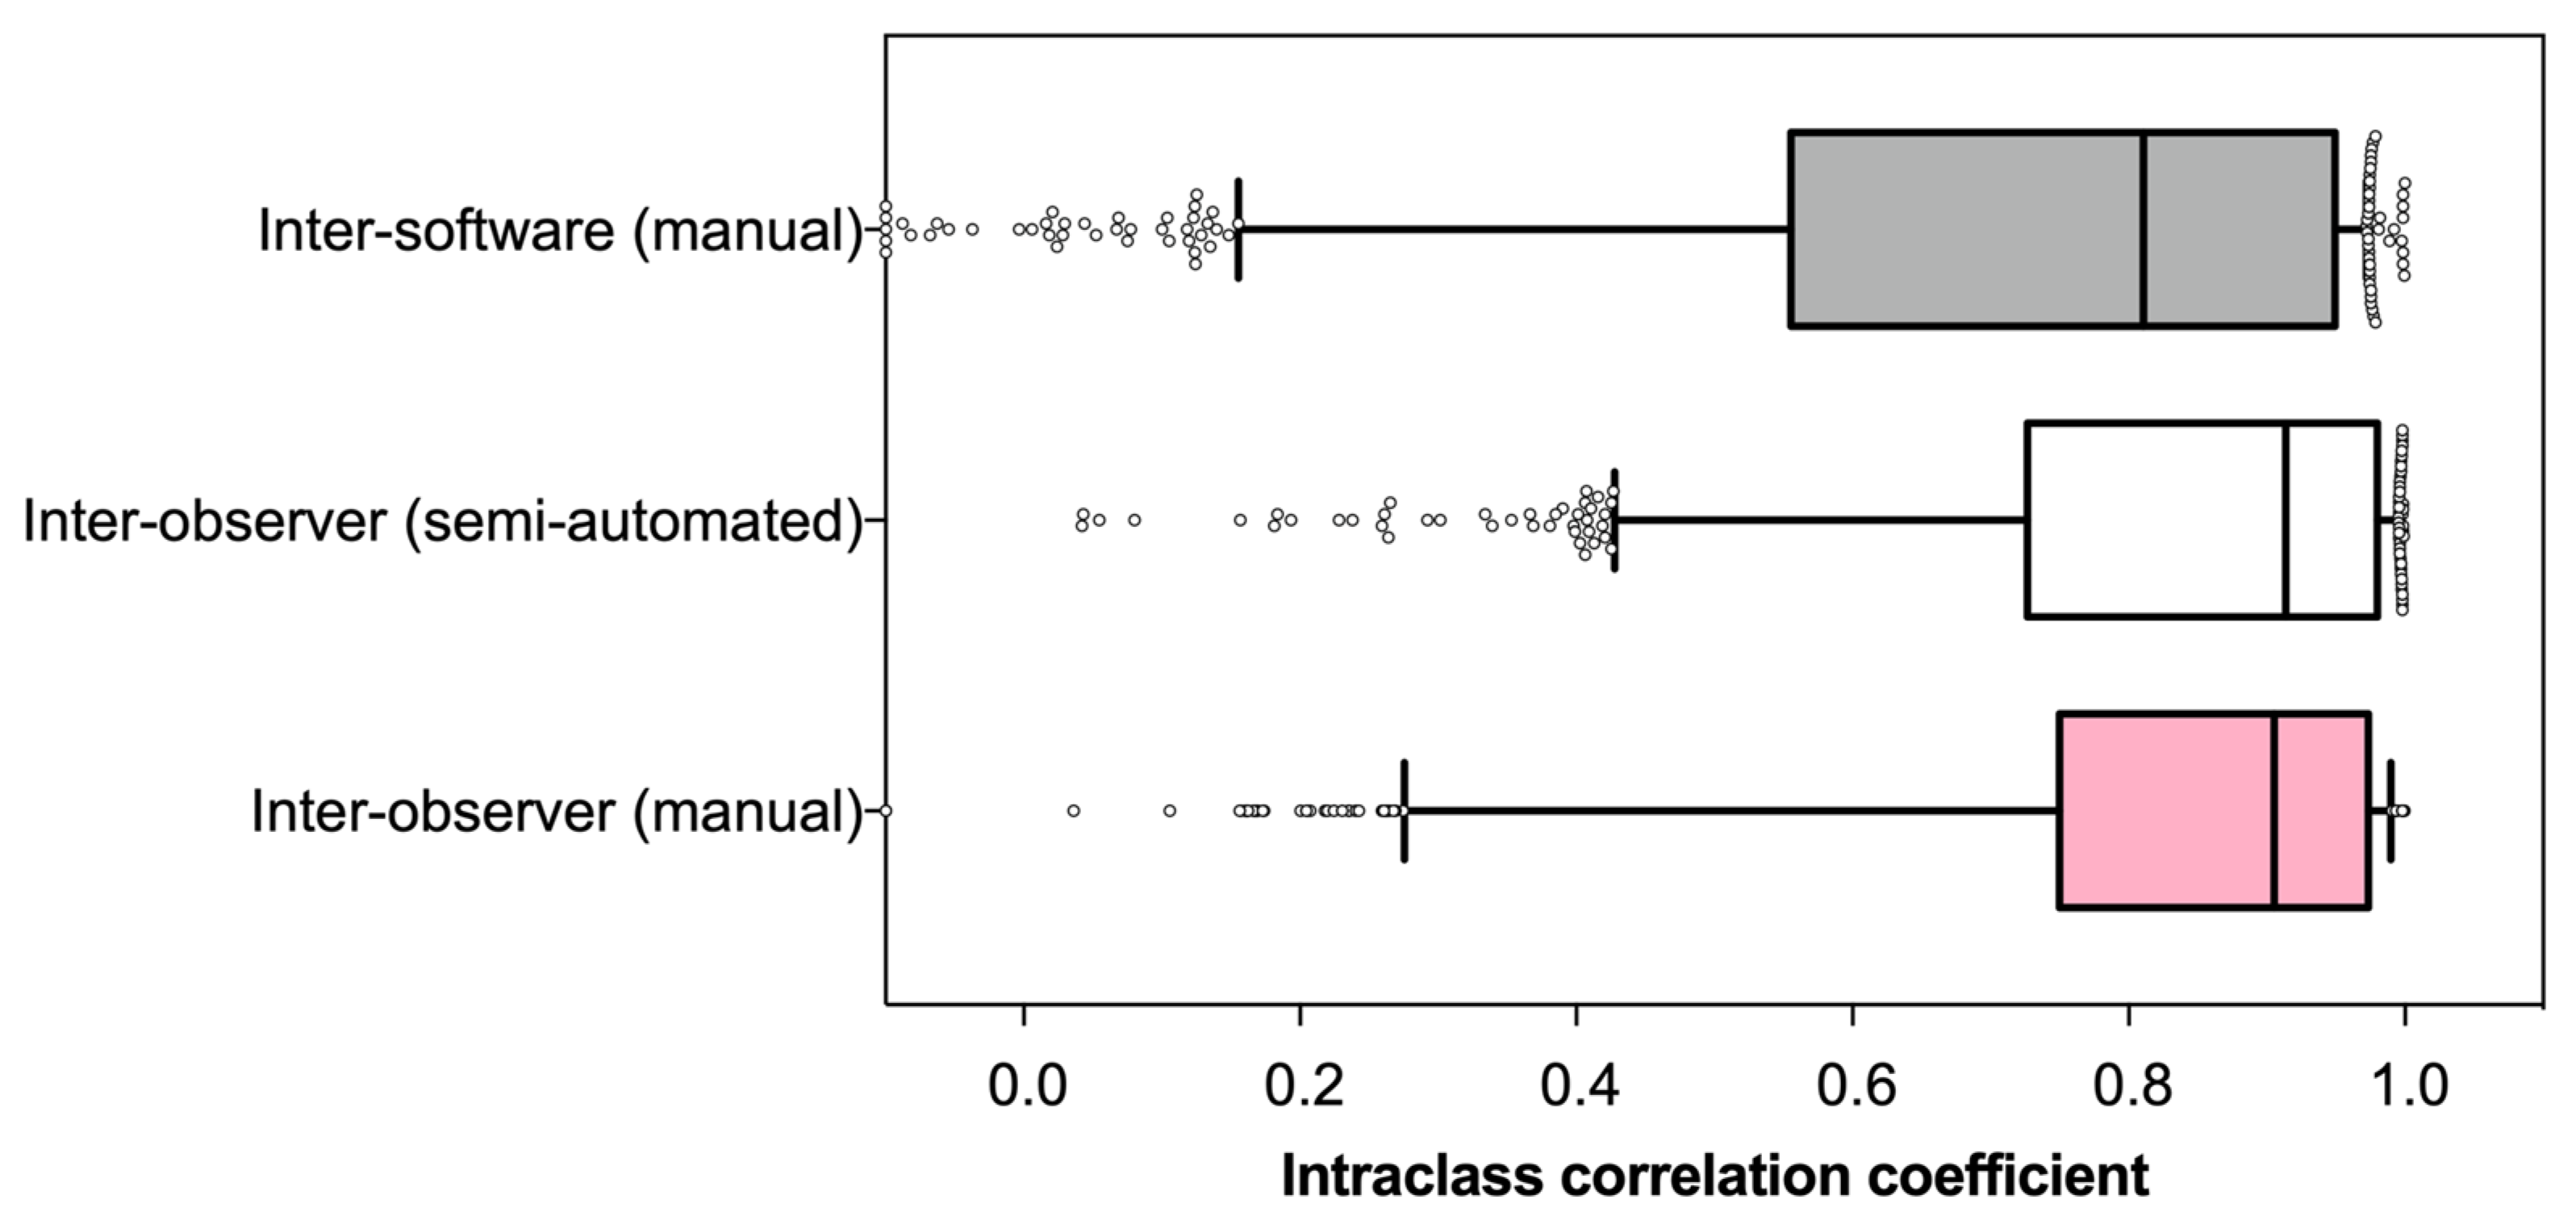
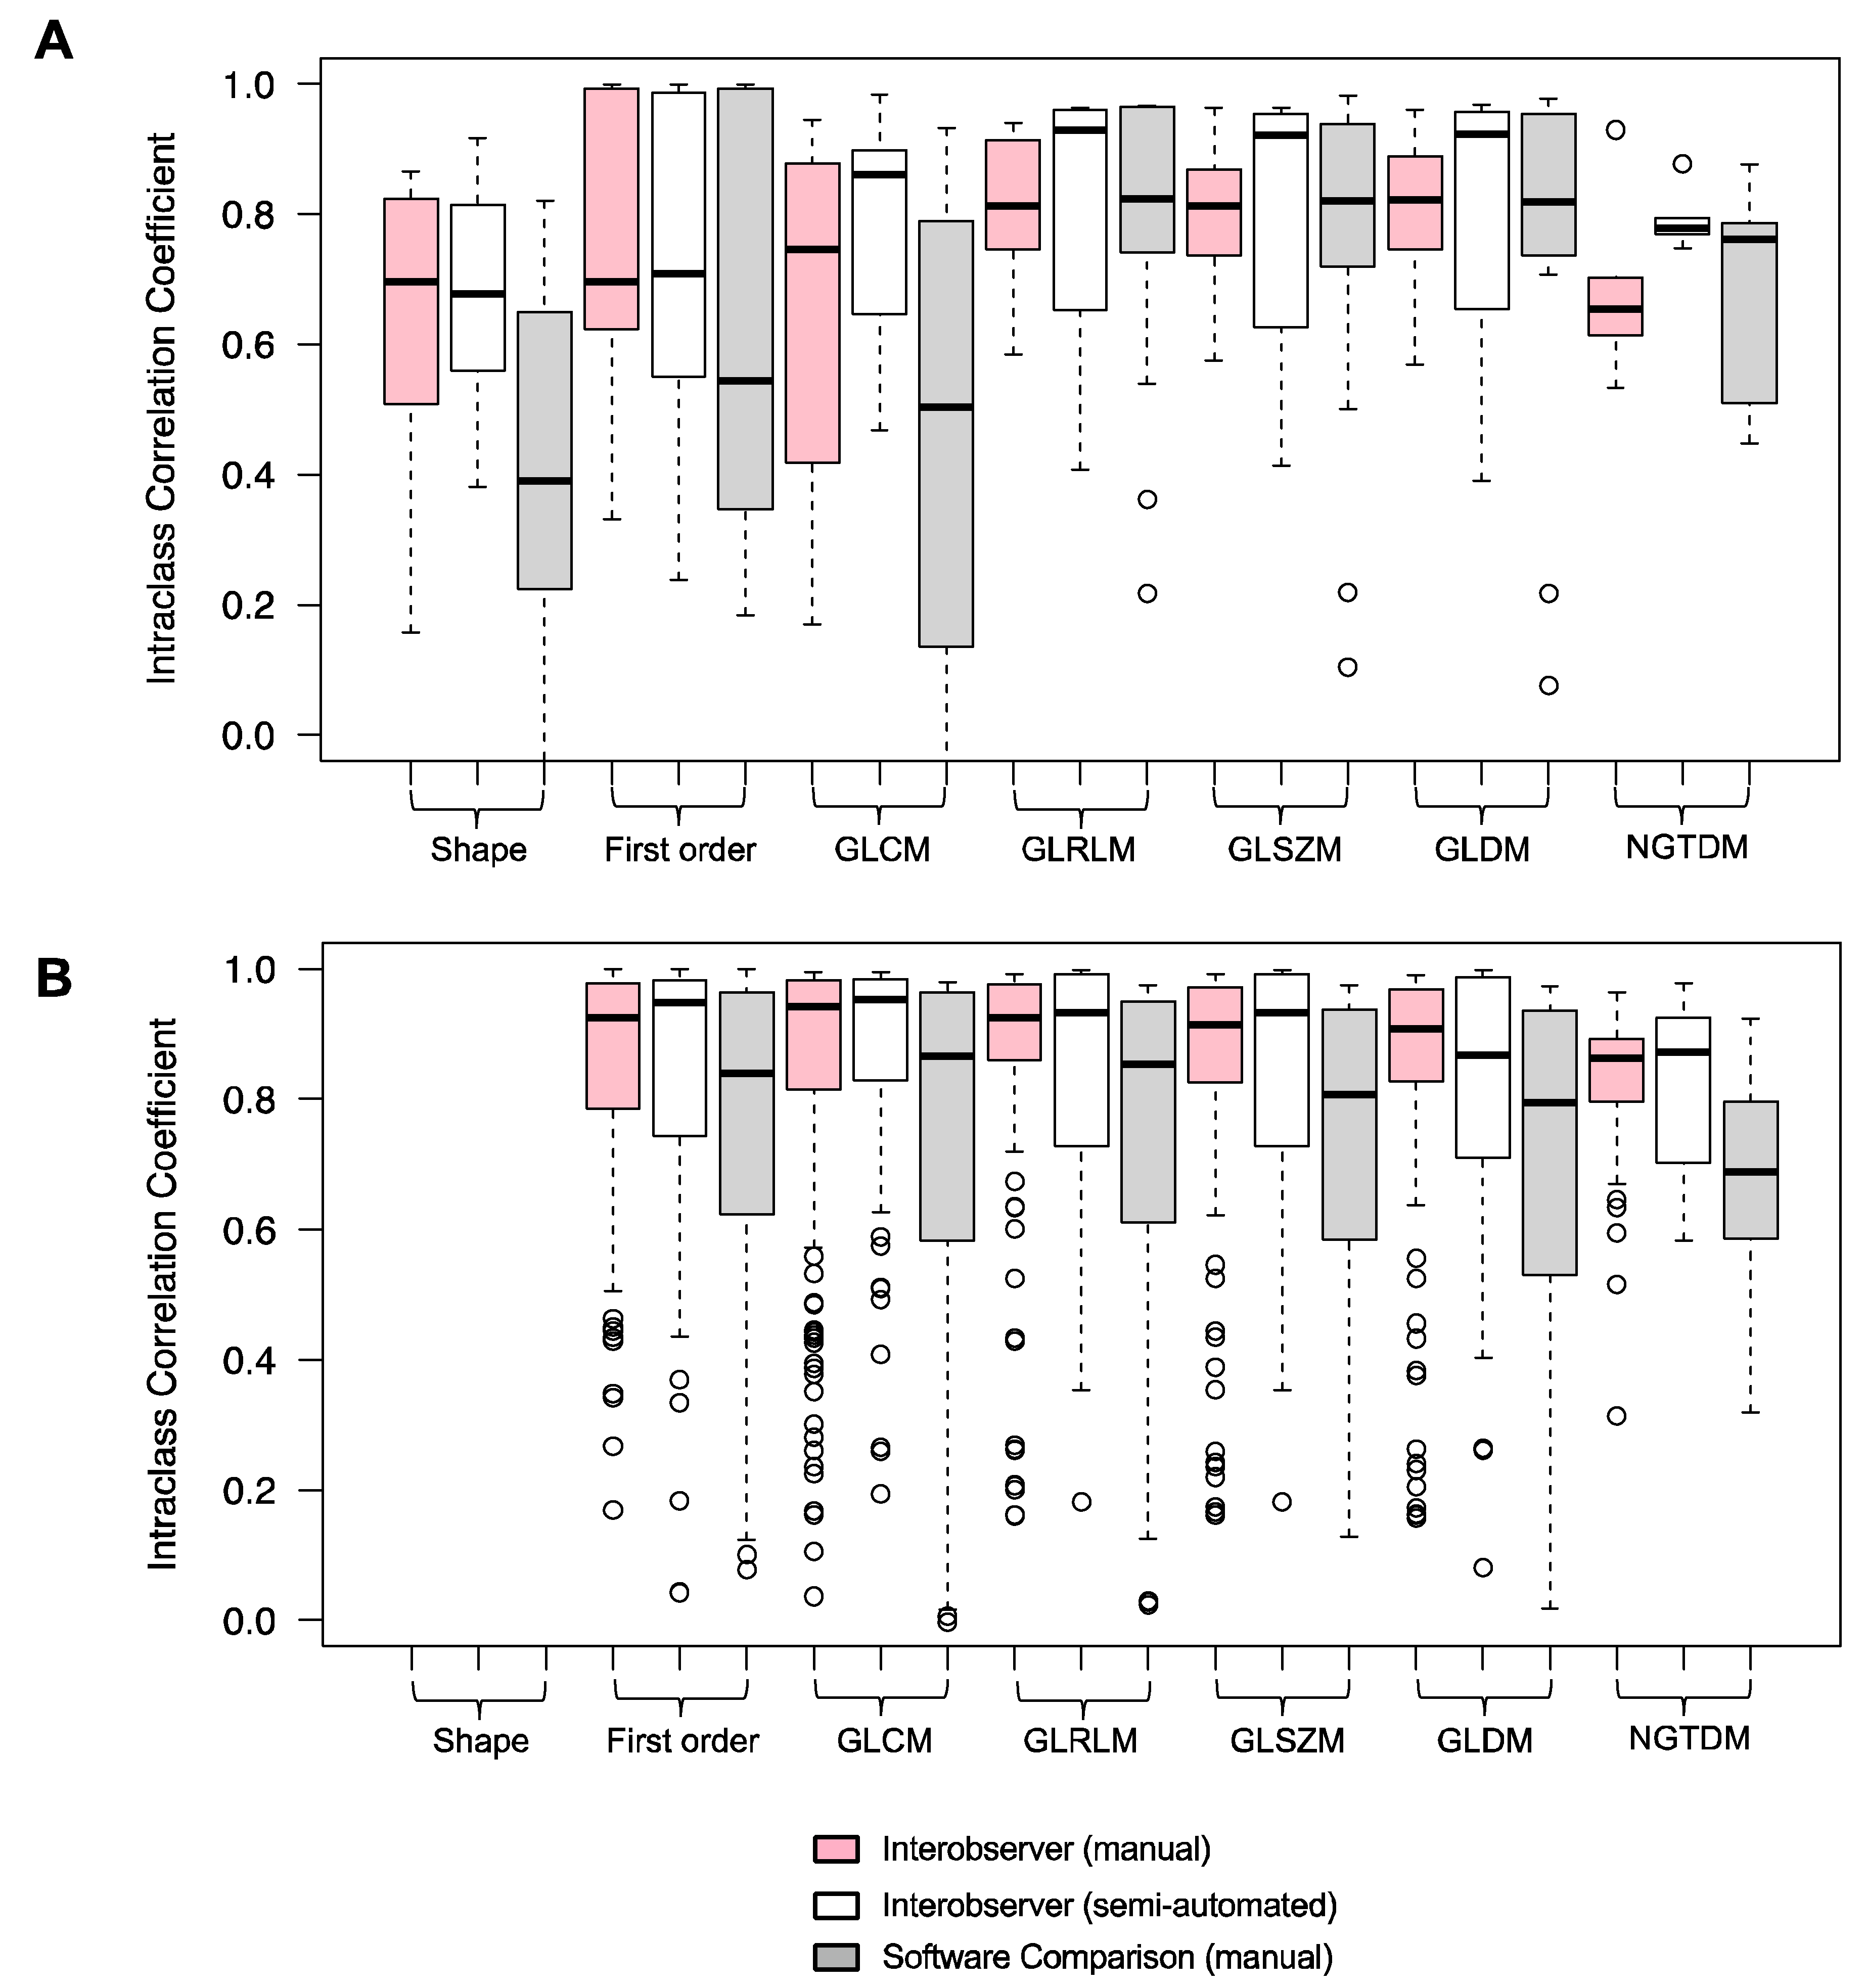
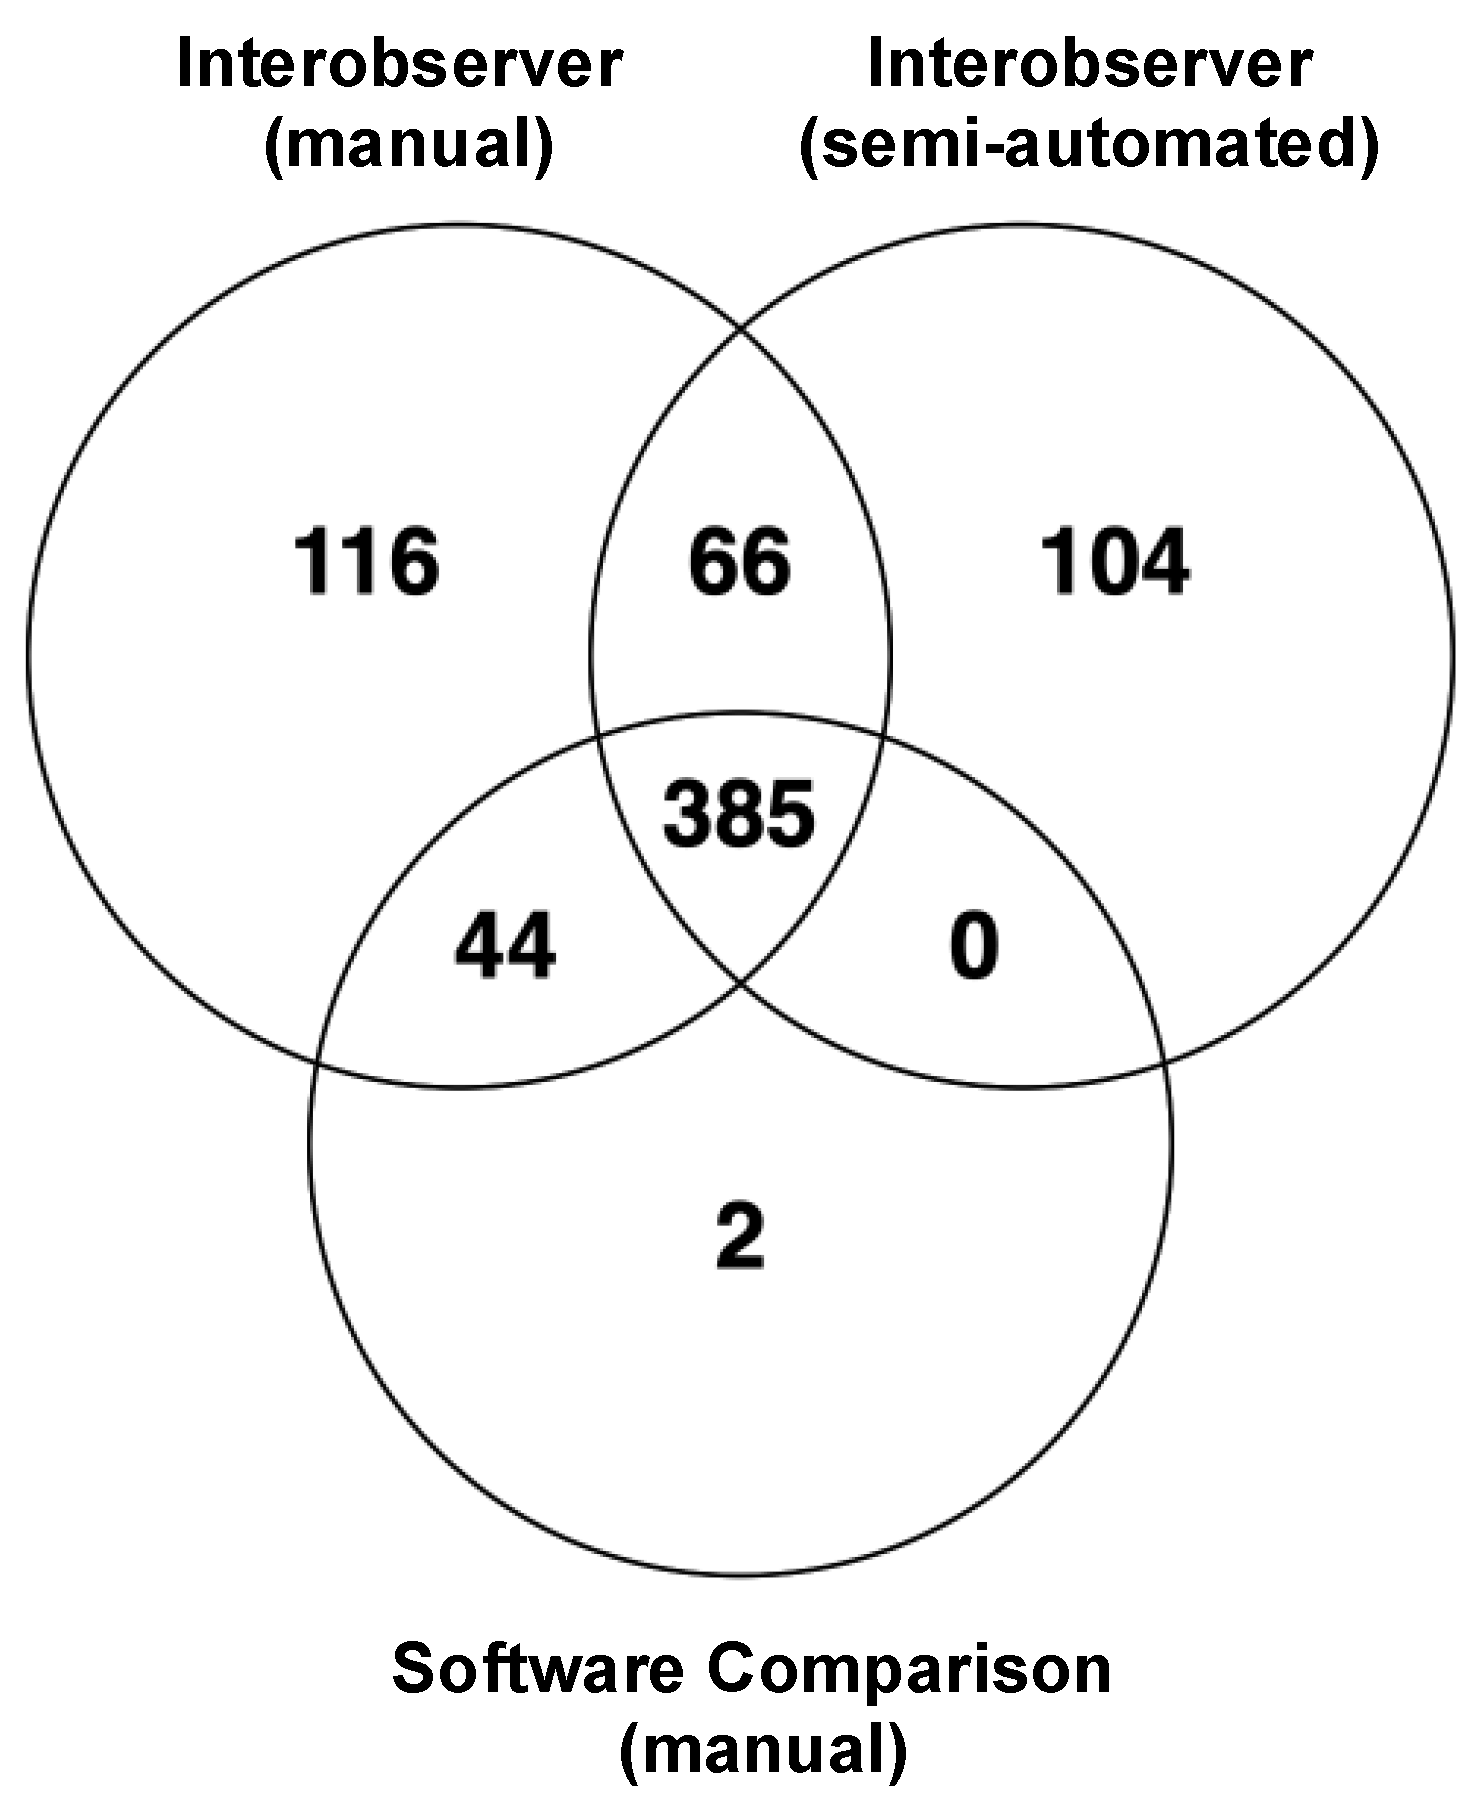
3.2. Reliability
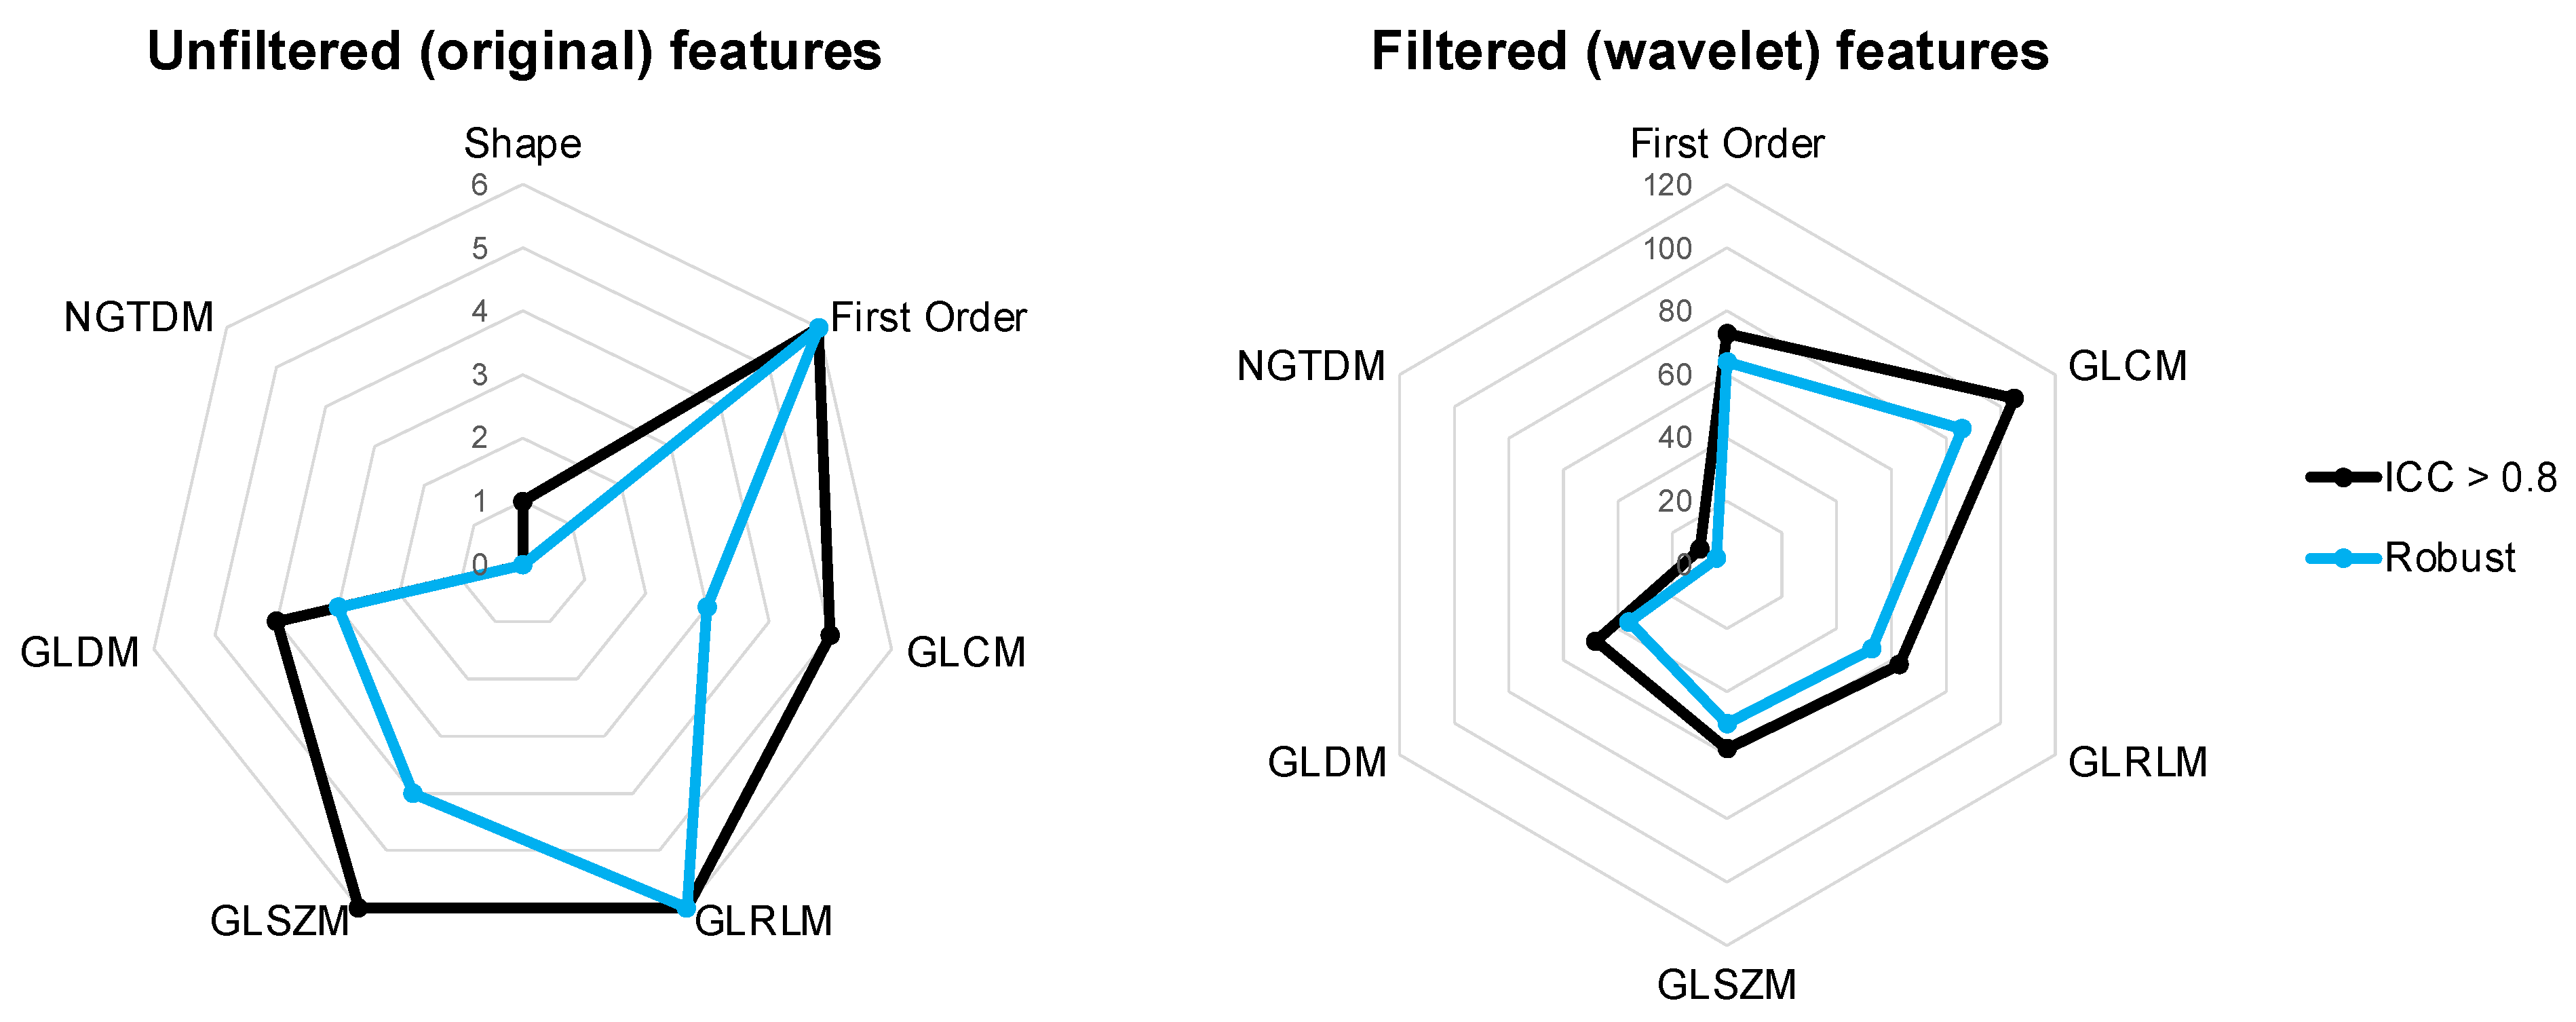
3.3. Robustness
4. Discussion
5. Conclusions
Supplementary Materials
Author Contributions
Funding
Institutional Review Board Statement
Informed Consent Statement
Data Availability Statement
Conflicts of Interest
References
- Grossmann, P.; Stringfield, O.; El-Hachem, N.; Bui, M.M.; Velazquez, E.R.; Parmar, C.; Leijenaar, R.T.H.; Haibe-Kains, B.; Lambin, P.; Gillies, R.J.; et al. Defining the biological basis of radiomic phenotypes in lung cancer. Elife 2017, 6, e23421. [Google Scholar] [CrossRef]
- He, L.; Huang, Y.; Yan, L.; Zheng, J.; Liang, C.; Liu, Z. Radiomics-based predictive risk score: A scoring system for preoperatively predicting risk of lymph node metastasis in patients with resectable non-small cell lung cancer. Chin. J. Cancer Res. 2019, 31, 641–652. [Google Scholar] [CrossRef]
- Astaraki, M.; Wang, C.; Buizza, G.; Toma-Dasu, I.; Lazzeroni, M. Early survival prediction in non-small cell lung cancer from PET/CT images using an intra-tumor partitioning method. Phys. Med. 2019, 60, 58–65. [Google Scholar] [CrossRef]
- Walls, G.M.; Osman, S.; Brown, K.; Butterworth, K.; Hanna, G.; Hounsell, A.; McGarry, C.; Leijenaar, R.; Lambin, P.; Cole, A.; et al. Radiomics for Predicting Lung Cancer Outcomes Following Radiotherapy: A Systematic Review. Clin. Oncol. 2021, 34, e107–e122. [Google Scholar] [CrossRef]
- Schlaak, R.A.; Senthilkumar, G.; Boerma, M.; Bergom, C. Advances in preclinical research models of radiation-induced cardiac toxicity. Cancers 2020, 12, 415. [Google Scholar] [CrossRef]
- Butterworth, K.T. Evolution of the Supermodel: Progress in Modelling Radiotherapy Response in Mice. Clin. Oncol. (R. Coll. Radiol.) 2019, 31, 272–282. [Google Scholar] [CrossRef]
- Brown, K.H.; Ghita, M.; Dubois, L.J.; de Ruysscher, D.; Prise, K.M.; Verhaegen, F.; Butterworth, K.T. A scoping review of small animal image-guided radiotherapy research: Advances, impact and future opportunities in translational radiobiology. Clin. Transl. Radiat. Oncol. 2022, 34, 112–119. [Google Scholar] [CrossRef]
- Eresen, A.; Yang, J.; Shangguan, J.; Li, Y.; Hu, S.; Sun, C.; Velichko, Y.; Yaghmai, V.; Benson, A.B.; Zhang, Z. MRI radiomics for early prediction of response to vaccine therapy in a transgenic mouse model of pancreatic ductal adenocarcinoma. J. Transl. Med. 2020, 18, 61. [Google Scholar] [CrossRef]
- Holbrook, M.D.; Blocker, S.J.; Mowery, Y.M.; Badea, A.; Qi, Y.; Xu, E.S.; Kirsch, D.G.; Johnson, G.A.; Badea, C. Mri-based deep learning segmentation and radiomics of sarcoma in mice. Tomography 2020, 6, 23–33. [Google Scholar] [CrossRef]
- Panth, K.M.; Leijenaar, R.T.; Carvalho, S.; Lieuwes, N.G.; Yaromina, A.; Dubois, L.; Lambin, P. Is there a causal relationship between genetic changes and radiomics-based image features? An in vivo preclinical experiment with doxycycline inducible GADD34 tumor cells. Radiother. Oncol. 2015, 116, 462–466. [Google Scholar] [CrossRef]
- Dutta, K.; Roy, S.; Whitehead, T.D.; Luo, J.; Jha, A.K.; Li, S.; Quirk, J.D.; Shoghi, K.I. Deep learning segmentation of triple-negative breast cancer (Tnbc) patient derived tumor xenograft (pdx) and sensitivity of radiomic pipeline to tumor probability boundary. Cancers 2021, 13, 3795. [Google Scholar] [CrossRef] [PubMed]
- Lappas, G.; Wolfs, C.J.A.; Staut, N.; Lieuwes, N.G.; Biemans, R.; van Hoof, S.J.; Dubois, L.J.; Verhaegen, F. Automatic contouring of normal tissues with deep learning for preclinical radiation studies. Phys. Med. Biol. 2022, 67, 044001. [Google Scholar] [CrossRef] [PubMed]
- Ramkumar, A.; Dolz, J.; Kirisli, H.A.; Adebahr, S.; Schimek-Jasch, T.; Nestle, U.; Massoptier, L.; Varga, E.; Jan Stappers, P.; Niessen, W.J. User Interaction in Semi-Automatic Segmentation of Organs at Risk: A Case Study in Radiotherapy. J. Digit. Imaging 2016, 29, 264–277. [Google Scholar] [CrossRef] [PubMed]
- Kothari, G.; Woon, B.; Patrick, C.J.; Korte, J.; Wee, L.; Hanna, G.G.; Kron, T.; Hardcastle, N.; Siva, S. The impact of inter-observer variation in delineation on robustness of radiomics features in non-small cell lung cancer. Sci. Rep. 2022, 12, 12822. [Google Scholar] [CrossRef]
- Pavic, M.; Bogowicz, M.; Würms, X.; Glatz, S.; Finazzi, T.; Riesterer, O.; Roesch, J.; Rudofsky, L.; Friess, M.; Veit-Haibach, P.; et al. Influence of inter-observer delineation variability on radiomics stability in different tumor sites. Acta Oncol. 2018, 57, 1070–1074. [Google Scholar] [CrossRef]
- Wong, J.; Baine, M.; Wisnoskie, S.; Bennion, N.; Zheng, D.; Yu, L.; Dalal, V.; Hollingsworth, M.A.; Lin, C.; Zheng, D. Effects of interobserver and interdisciplinary segmentation variabilities on CT-based radiomics for pancreatic cancer. Sci. Rep. 2021, 11, 16328. [Google Scholar]
- Hershman, M.; Yousefi, B.; Serletti, L.; Galperin-Aizenberg, M.; Roshkovan, L.; Luna, J.M.; Thompson, J.C.; Aggarwal, C.; Carpenter, E.L.; Kontos, D.; et al. Impact of interobserver variability in manual segmentation of non-small cell lung cancer (Nsclc) applying low-rank radiomic representation on computed tomography. Cancers 2021, 13, 5985. [Google Scholar] [CrossRef]
- Huang, Q.; Lu, L.; Dercle, L.; Lichtenstein, M.P.; Li, Y.; Yin, Q.; Zong, M.; Schwartz, L.; Zhao, B. Interobserver variability in tumor contouring affects the use of radiomics to predict mutational status. J. Med. Imaging 2017, 5, 011005. [Google Scholar] [CrossRef]
- van Griethuysen, J.J.M.; Fedorov, A.; Parmar, C.; Hosny, A.; Aucoin, N.; Narayan, V.; Beets-Tan, R.G.H.; Fillion-Robin, J.-C.; Pieper, S.; Aerts, H.J.W.L. Computational radiomics system to decode the radiographic phenotype. Cancer Res. 2017, 77, e104–e107. [Google Scholar] [CrossRef]
- Zwanenburg, A.; Leger, S.; Vallières, M.; Löck, S. Image biomarker standardisation initiative. RSNA J. 2016, 295. [Google Scholar] [CrossRef]
- Zou, K.H.; Warfield, S.K.; Bharatha, A.; Tempany, C.M.C.; Kaus, M.R.; Haker, S.J.; Wells, W.M.; Jolesz, F.A.; Kikinis, R. Statistical Validation of Image Segmentation Quality Based on a Spatial Overlap Index 1: Scientific Reports. Acad. Radiol. 2004, 11, 178–187. Available online: http://www.slicer.org (accessed on 26 July 2022). [CrossRef]
- Huttenlocher, D.P.; Klanderman, G.A.; Rucklidge, W.J. Comparing Images Using the Hausdorff Distance. IEEE Trans. Pattern Anal. Mach. Intell. 1993, 15, 850–863. [Google Scholar]
- Koo, T.K.; Li, M.Y. A Guideline of Selecting and Reporting Intraclass Correlation Coefficients for Reliability Research. J. Chiropr. Med. 2016, 15, 155–163. [Google Scholar] [CrossRef]
- Portney, L.G.; Watkins, M.P. Foundations of Clinical Research: Applications to Practice; Pentice Hall: Hoboken, NJ, USA, 2000. [Google Scholar]
- Rogers, W.; Seetha, S.T.; Refaee, T.A.G.; Lieverse, R.I.Y.; Granzier, R.W.Y.; Ibrahim, A.; Keek, S.A.; Sanduleanu, S.; Primakov, S.P.; Beuque, M.P.L.; et al. Radiomics: From qualitative to quantitative imaging. Br. J. Radiol. 2020, 93, 20190948. [Google Scholar]
- Wang, H.; Zhou, Y.; Wang, X.; Zhang, Y.; Ma, C.; Liu, B.; Kong, Q.; Yue, N.; Xu, Z.; Nie, K. Reproducibility and Repeatability of CBCT-Derived Radiomics Features. Front. Oncol. 2021, 11, 4788. [Google Scholar]
- Traverso, A.; Wee, L.; Dekker, A.; Gillies, R. Repeatability and Reproducibility of Radiomic Features: A Systematic Review. Int. J. Radiat. Oncol. Biol. Phys. 2018, 102, 1143–1158. [Google Scholar]
- Xue, C.; Yuan, J.; Lo, G.G.; Chang, A.T.Y.; Poon, D.M.C.; Wong, O.L.; Zhou, Y.; Chu, W.C.W. Radiomics feature reliability assessed by intraclass correlation coefficient: A systematic review. Quant. Imaging Med. Surg. 2021, 11, 4431–4460. [Google Scholar] [CrossRef]
- Shafiq-Ul-Hassan, M.; Latifi, K.; Zhang, G.; Ullah, G.; Gillies, R.; Moros, E. Voxel size and gray level normalization of CT radiomic features in lung cancer. Sci. Rep. 2018, 8, 10545. [Google Scholar]
- Parmar, C.; Velazquez, E.R.; Leijenaar, R.; Jermoumi, M.; Carvalho, S.; Mak, R.H.; Mitra, S.; Shankar, B.U.; Kikinis, R.; Haibe-Kains, B.; et al. Robust radiomics feature quantification using semiautomatic volumetric segmentation. PLoS ONE 2014, 9, e102107. [Google Scholar]
- Owens, C.A.; Peterson, C.; Tang, C.; Koay, E.J.; Yu, W.; Mackin, D.S.; Li, J.; Salehpour, M.R.; Fuentes, D.T.; Court, L.; et al. Lung tumor segmentation methods: Impact on the uncertainty of radiomics features for non-small cell lung cancer. PLoS ONE 2018, 13, e0205003. [Google Scholar]
- Hatt, M.; Majdoub, M.; Vallières, M.; Tixier, F.; Le Rest, C.C.; Groheux, D.; Hindié, E.; Martineau, A.; Pradier, O.; Hustinx, R.; et al. 18F-FDG PET uptake characterization through texture analysis: Investigating the complementary nature of heterogeneity and functional tumor volume in a multi-cancer site patient cohort. J. Nucl. Med. 2015, 56, 38–44. [Google Scholar] [PubMed]
- Yip, S.S.F.; Aerts, H.J.W.L. Applications and limitations of radiomics. Phys. Med. Biol. 2016, 61, R150–R166. [Google Scholar] [CrossRef] [PubMed]
- Vinod, S.K.; Min, M.; Jameson, M.G.; Holloway, L.C. A review of interventions to reduce inter-observer variability in volume delineation in radiation oncology. J. Med. Imaging Radiat. Oncol. 2016, 60, 393–406. [Google Scholar] [PubMed]
- Kalpathy-Cramer, J.; Zhao, B.; Goldgof, D.; Gu, Y.; Wang, X.; Yang, H.; Tan, Y.; Gillies, R.; Napel, S. A Comparison of Lung Nodule Segmentation Algorithms: Methods and Results from a Multi-institutional Study. J. Digit. Imaging 2016, 29, 476–487. [Google Scholar]
- Ashraf, H.; de Hoop, B.; Shaker, S.B.; Dirksen, A.; Bach, K.S.; Hansen, H.; Prokop, M.; Pedersen, J.H. Lung nodule volumetry: Segmentation algorithms within the same software package cannot be used interchangeably. Eur. Radiol. 2010, 20, 1878–1885. [Google Scholar]
- Sforazzini, F.; Salome, P.; Moustafa, M.; Zhou, C.; Schwager, C.; Rein, K.; Bougatf, N.; Kudak, A.; Woodruff, H.; Dubois, L.; et al. Deep Learning-based Automatic Lung Segmentation on Multiresolution CT Scans from Healthy and Fibrotic Lungs in Mice. Radiol. Artif. Intell. 2022, 4, e210095. [Google Scholar] [CrossRef]


Disclaimer/Publisher’s Note: The statements, opinions and data contained in all publications are solely those of the individual author(s) and contributor(s) and not of MDPI and/or the editor(s). MDPI and/or the editor(s) disclaim responsibility for any injury to people or property resulting from any ideas, methods, instructions or products referred to in the content. |
© 2023 by the authors. Licensee MDPI, Basel, Switzerland. This article is an open access article distributed under the terms and conditions of the Creative Commons Attribution (CC BY) license (https://creativecommons.org/licenses/by/4.0/).
Share and Cite
Brown, K.H.; Illyuk, J.; Ghita, M.; Walls, G.M.; McGarry, C.K.; Butterworth, K.T. Assessment of Variabilities in Lung-Contouring Methods on CBCT Preclinical Radiomics Outputs. Cancers 2023, 15, 2677. https://doi.org/10.3390/cancers15102677
Brown KH, Illyuk J, Ghita M, Walls GM, McGarry CK, Butterworth KT. Assessment of Variabilities in Lung-Contouring Methods on CBCT Preclinical Radiomics Outputs. Cancers. 2023; 15(10):2677. https://doi.org/10.3390/cancers15102677
Chicago/Turabian StyleBrown, Kathryn H., Jacob Illyuk, Mihaela Ghita, Gerard M. Walls, Conor K. McGarry, and Karl T. Butterworth. 2023. "Assessment of Variabilities in Lung-Contouring Methods on CBCT Preclinical Radiomics Outputs" Cancers 15, no. 10: 2677. https://doi.org/10.3390/cancers15102677
APA StyleBrown, K. H., Illyuk, J., Ghita, M., Walls, G. M., McGarry, C. K., & Butterworth, K. T. (2023). Assessment of Variabilities in Lung-Contouring Methods on CBCT Preclinical Radiomics Outputs. Cancers, 15(10), 2677. https://doi.org/10.3390/cancers15102677