Article

Somatostatin Receptor 2 Expression Profiles and Their Correlation with the Efficacy of Somatostatin Analogues in Gastrointestinal Neuroendocrine Tumors

1
Department of Pathology, Graduate School of Medicine, Tohoku University, Sendai 980-8575, Japan
2
Department of Surgery, Kansai Electric Power Hospital, Osaka 553-0003, Japan
3
Kansai Electric Power Medical Research Institute, Osaka 553-0003, Japan
4
Department of Hepatobiliary and Pancreatic Oncology, National Cancer Center, Tokyo 104-0045, Japan
5
Department of Gastroenterology, Aichi Cancer Center Hospital, Nagoya 464-0021, Japan
6
Department of Pathology and Clinical Laboratories, National Cancer Center, Tokyo 104-0045, Japan
7
Department of Hepato-Biliary-Pancreatic Surgery, Graduate School of Medicine, Tokyo Medical and Dental University, Tokyo 104-0045, Japan
8
Department of Surgery, Kyoto University Graduate School of Medicine, Kyoto 606-8507, Japan
9
Department of Gastroenterological Surgery II, Hokkaido University Graduate School of Medicine, Sapporo 060-8638, Japan
10
Department of Pathology, Osaki Citizen Hospital, Osaki 989-6183, Japan
11
Department of Gastroenterology, Tohoku University Graduate School of Medicine, Sendai 980-8574, Japan
12
Department of Health Record Informatics, Tohoku Medical Megabank Organization, Tohoku University, Sendai 980-8573, Japan
13
Department of Preventive Medicine and Epidemiology, Tohoku Medical Megabank Organization, Tohoku University, Sendai 980-8573, Japan
14
Department of Surgery I, Yamagata University Graduate School of Medical Science, Yamagata 990-2331, Japan
15
Department of Surgery, Graduate School of Medicine, Tohoku University, Sendai 980-8575, Japan
*
Author to whom correspondence should be addressed.
Cancers 2022, 14(3), 775; https://doi.org/10.3390/cancers14030775
Submission received: 9 December 2021 / Revised: 30 January 2022 / Accepted: 31 January 2022 / Published: 2 February 2022

Abstract

:

Simple Summary

Immunolocalization of somatostatin receptor 2 (SSTR2) could predict the therapeutic efficacy of somatostatin analogues (SSAs) in neuroendocrine tumors (NETs). Therefore, in this study, we evaluated SSTR2 immunoreactivity and elucidated its correlation with clinicopathological variables, including the therapeutic response to SSAs in gastrointestinal neuroendocrine tumors (GI-NETs) using digital image analysis (DIA) and other established methods of evaluation. SSTR2 immunoreactivity in foregut NETs was significantly higher than that in hindgut NETs. SSTR2 immunoreactivity was significantly negatively correlated with the Ki-67 labeling index in foregut NETs but positively correlated in hindgut NETs. Therefore, the significance of SSTR2 immunoreactivity in GI-NETs is considered to be different according to the primary sites. We also first demonstrated that DIA could provide a good alternative for predicting response to SSAs in evaluating SSTR2 immunoreactivity of GI-NETs.

Abstract

Somatostatin analogues (SSAs) are widely used to treat gastroenteropancreatic neuroendocrine tumors (GEP-NETs). Somatostatin receptor 2 (SSTR2) immunoreactivity serves as a predictive marker of the therapeutic efficacy of SSAs in pancreatic NETs. However, SSTR2 expression profiles in tumor cells and their association with the therapeutic efficacy of SSAs remains virtually unknown in gastrointestinal NETs (GI-NETs). Therefore, we evaluated the association between SSTR2 immunoreactivity and embryological origin and proliferative activity in 132 resected surgical tissues of GI-NETs. The correlation between SSAs’ therapeutic efficacy and SSTR2 immunoreactivity was evaluated in 14 GI-NETs treated with SSAs. SSTR2 immunoreactivity was evaluated using Volante scores, immunoreactive scores, and digital image analysis (DIA). SSTR2 immunoreactivity was significantly negatively and positively correlated with the Ki-67 labeling index in foregut and hindgut NETs, respectively. In the normal mucosa, neuroendocrine cells in the rectum had significantly lower positive rates of SSTR2 than those in the stomach and duodenum. SSTR2 expression profiles in GI-NETs could differ by primary sites, while the difference of those between foregut and hindgut NETs might be derived from the SSTR2 status of normal neuroendocrine cell counterparts. In addition, DIA could provide a good alternative for predicting response to SSAs in evaluating SSTR2 immunoreactivity of GI-NETs.

1. Introduction

The incidence of gastrointestinal neuroendocrine tumors (GI-NETs) has recently increased, possibly because of an increased administration of proton pump inhibitors and developments in detection equipment such as endoscopy [1,2,3]. GI-NETs are classified as foregut, midgut, and hindgut NETs according to their embryological origins and their clinicopathological features [4,5,6]. GI-NETs are both clinically and pathologically heterogeneous tumors [7,8,9]. This heterogeneity is also pronounced in their endocrine activities and tumor growth, possibly because GI-NETs originate from a variety of neuroendocrine cells located in different sites [10]. Almost all GI-NETs have been reported to express somatostatin receptors (SSTRs), and their expression profiles have also been known to be heterogeneous [7,8,11].
Somatostatin, a peptide hormone that binds to the SSTR, has been reported to be expressed in many parts of the body, including the pituitary glands, pancreas, and gastrointestinal tract [12,13,14]. Somatostatin was reported to be involved not only in the inhibition of hormonal activities but also in cell proliferation [9,12]. Somatostatin analogues (SSAs), including octreotide and lanreotide, have been widely used as therapeutic agents in gastroenteropancreatic neuroendocrine tumors (GEP-NETs) due to their anti-secretory and/or anti-proliferative activities [9,15].
SSTRs are composed of five different subtypes of G-protein-coupled transmembrane receptors (SSTR1–5) [12,15,16,17]. The SSTR2 status in NET tumor cells evaluated by immunohistochemistry has been reported to be associated with the therapeutic efficacy of SSAs in pancreatic NETs (PanNETs) [18,19] and acromegaly [20]. Recently, peptide receptor radionuclide therapy (PRRT) has been employed as a new therapy of NETs, and a correlation with SSTR2 status of NETs has been also suggested [21,22]. However, the association between SSTR2 expression profiles in tumor cells and the therapeutic efficacy of SSAs remains virtually unknown in GI-NETs, especially in foregut and hindgut NETs. Moreover, the detailed correlation between SSTR2 status and the proliferative activities of GI-NETs according to embryological classification has also remained unexplored at this juncture.
Various scoring systems of SSTR2 immunoreactivity based on eyeball analysis, such as Volante score [18,19] and Immunoreactivity Score [11,20], have been proposed in order to yield a more reproducible and subjective interpretation of results toward establishing a better correlation between SSTR2 immunohistochemistry results and SSAs’ therapeutic efficacy. However, these attempts have been mostly reported in PanNETs, not in GI-NETs. In addition, those analyses all had inevitable and/or intrinsic limitations, including inter-and intra-observer variability [23,24]. For example, when evaluating membranous SSTR2 immunoreactivity, it is challenging to determine whether the immunoreactivity obtained represents the complete or circumferential membrane based on manual and eyeball analysis [24]. Therefore, various attempts have been proposed to develop more objective methods, including digital image analysis (DIA) [24].
Therefore, in this study, we attempted to explore the followings in GI-NETs: 1) the possible association between SSTR2 immunoreactivity and the embryological origin and the proliferative activity of tumor cells, 2) the correlation between the therapeutic efficacy of SSAs and SSTR2 immunoreactivity in GI-NET patients treated with SSAs, with particular emphasis on immunoreactivity evaluated by DIA, and 3) SSTR2 immunoreactivity in the normal neuroendocrine cell counterparts from which tumor cells originate in order to account for the diversity of SSTR2 immunoreactivity in tumor cells.

2. Materials and Methods

2.1. Tissues and Patient Characteristics

In total, 145 GI-NET tissue specimens (Figure S1) obtained from 141 patients (Table S1) were retrieved retrospectively from the surgical pathology files at Hokkaido University Hospital, Tohoku University Hospital (Miyagi, Japan), Osaki Citizen Hospital (Miyagi, Japan), Aichi Prefectural Cancer Center Hospital (Nagoya, Japan), Noe Hospital (Osaka, Japan), Tokyo Medical and Dental University Hospital, Kansai Electric Power Hospital, and Kyoto University Hospital. We tentatively excluded the patients receiving chemotherapy before surgery and those with metastatic lesions. After applying the exclusion criteria following a careful review of patients’ charts, 132 cases of resected surgical tissues turned out to be available for examination (Figure S1, Group 2). Fourteen GI-NET cases treated with SSAs, octreotide or lanreotide, were also available for determining SSA therapeutic efficacy in order to explore the association between SSAs’ therapeutic efficacy and SSTR2 immunoreactivity (Figure S1, Group 3). SSAs’ therapeutic efficacy was determined according to the Response Evaluation Criteria in Solid Tumors (RECIST) [25]. When multiple tissue samples were available from a single patient, the tumor tissue sample that was therapy-naïve, collected shortly after SSA administration, or from the primary site was selected [18]. Complete response (CR) was detected in one patient, stable disease (SD) in nine patients, and progressive disease (PD) in four patients. To further explore the correlation between SSAs’ therapeutic efficacy and SSTR2 immunoreactivity, the patients were tentatively classified as “CR or SD” and “PD” in this study. Moreover, all GI-NET cases were categorized as foregut, midgut, or hindgut NETs according to their primary locations (gastric or duodenal NETs were considered foregut NETs, jejunal or ileal NETs were considered midgut NETs, and rectal NETs were considered hindgut NETs; [Figure S1]) [7], and as grade (G) 1, G2, or G3 according to histological grade based on World Health Organization (WHO) classification [26,27]. The research protocol of this particular study was approved by the IRB or Ethics committee of the institutions above.
Furthermore, 37 resected surgical tissue specimens (Group 4), including those from the non-neoplastic mucosa of the stomach, duodenum, and rectum from 32 patients who received surgery at Tohoku University Hospital from 2019–2020, were available for the evaluation of SSTR2 immunoreactivity of non-pathological neuroendocrine cells in corresponding tissues of the gastrointestinal tract. The inclusion criteria of the non-neoplastic mucosal tissues in this study were summarized as follows: (1) patients with no previous histories of NETs, endocrine diseases including diabetes mellitus, and inflammatory bowel diseases, (2) patients with no past histories of chemotherapy, and (3) the locations of the non-neoplastic mucosa tissue were different from the location of the tumors or previously resected sites. A total of 19 men and 13 women were included in this group. Three tissues included only gastric mucosa, nine included only duodenal mucosa, five included both gastric and duodenal mucosa, and fifteen included only rectal mucosa.
Serial tissue sections of 10% formalin-fixed paraffin-embedded (FFPE) tissues were prepared in this study. Two of the authors (HW and HS) independently reviewed the specimens and confirmed the histopathological diagnoses.

2.2. Single Immunohistochemistry

One representative tissue section containing the tumor with the greatest dimension was selected for each case, and corresponding serial tissue sections (3–4-μm thick) were prepared. The detailed protocols of immunohistochemistry used in this study are summarized in Table 1. All immunostained slides were scanned digitally using the Nanozoomer S360 (C13220-01, Hamamatsu Photonics, Shizuoka, Japan) for subsequent image analyses.

2.3. Double-Immunohistochemistry

Double immunohistochemical staining was performed using chromogranin A and SSTR2 in 32 Group 4 patients comprising non-neoplastic mucosa to study the immunoreactivity of SSTR2 only in neuroendocrine cells. SSTR2 immunostaining was performed using a single immunostaining method, and the antigen–antibody complexes were visualized using diaminobenzidine (DAB) (brown).
Antigen retrieval was subsequently performed using 10 mM citrate buffer (pH 6.0) by heating in a microwave at 210 W for 15 min. The slides were then washed with phosphate buffer saline (PBS) and incubated with protein blocking solution (Histofine Kit, Nichirei) at room temperature. The slides were then reacted with the primary antibody (chromogranin A) overnight at 4 °C and incubated with a secondary antibody and alkaline phosphatase-conjugated streptavidin (Nichirei). The antigen–antibody complex of chromogranin A was visualized in red color using fast-red (fast-red IIsubstrate kit; Nichirei) and counterstained with hematoxylin.

2.4. Evaluation of Ki-67 Labeling Index

The Ki-67 labeling index (LI) was evaluated according to the counting method defined by the WHO in 2019 with some modifications [26,27] using HALO® CytoNuclear v1.6 (Indica Laboratories, Corrales, NM, USA) as previously reported [5,24] and was rounded down to two decimal places.

2.5. Evaluation of Single Immunohistochemistry of SSTR2 Immunoreactivity Using Manual/Eyeball Analysis (Volante Scores and Immunoreactive Scores) and DIA

SSTR2 membranous immunoreactivity was evaluated using a quantitative or semi-quantitative method according to three different scoring systems: Volante scores [19], immunoreactive scores (IRSs) [20], and scoring using DIA [24]. The Volante scores and IRSs were both obtained independently by two of the authors (HW and HS). When disagreement occurred in the eyeball-based methods between these two observers above, consensus was obtained by simultaneous observation using a dual-headed light microscope with subsequent discussion. These scores were evaluated in the same manner as reported in previous studies [19,20]. Volante scores ranged from 0 to 3 and were evaluated by localization of the immunoreactivity (cytoplasm or cell membrane), the extent of membranous immunoreactivity (circumferential or incomplete), and positivity of the positively stained cells (more or less than 50%) [18,19]. IRSs ranged from 1 to 12 and were calculated by multiplying the positivity of the positively stained cells (0: 0%, 1: <10%, 2: 10–50%, 3: 51–80%, or 4: >80%) and the staining intensity (0: none, 1: weak, 2: moderate, or 3: strong staining) [20]. The representative illustrations of the SSTR2 immunoreactivity are summarized in Figure 1a–d.
DIA was performed using the HALO® Membrane v1.7 (Indica Laboratories, Corrales, NM, USA) [28]. After reviewing the entire tumor areas, the “hot spot” areas, which were annotated digitally, were tentatively selected. The “hot spot” areas demonstrated the most marked SSTR2 immunoreactivity, including 1000–2000 tumor cells. In this study, we avoided evaluating insufficiently fixed areas. When evaluating the results of the tumor cells, parameters such as “Nuclear size” and “Nuclear Roundness” were defined according to the method reported in a previous study [5]. For the recognition and scoring of SSTR2 immunoreactivity, the membrane stain optical densities of the DAB reaction product (RGB 0.268,0.570,0.776) for SSTR2 immunoreactivity were unified in all the cases examined in this study [28]. When detecting membranous immunopositive cells, the parameter of “Minimum Membrane Completeness” was set. This parameter was defined as the minimum completeness of the membrane, with the cell count being a percentage of the membrane immunoreactivity. This enabled the quantitative evaluation of the cell [24]. For example, when setting the parameter as 50%, tumor cells with membranous circumferential completeness under 50% were excluded from the calculation, and when setting the parameter as 0%, tumor cells with membranous circumferential completeness over 0% were included in the calculation (Figure S2) [24]. In order to further calculate the absolute values of SSTR2 immunoreactivity regardless of the positivity of the membranous circumferential completeness, we set the parameter as 0%. After setting these parameters, the data reflecting SSTR2 immunoreactivity, such as “% Positive cells” (percentage of positive cells), “Avg Positive Cell Membrane OD” (average membrane stain optical densities for the DAB reaction product of positive cells), and “Avg Positive Membrane Completeness” (average completeness or circumferential features of positive immunoreactivity), were automatically determined [24]. We calculated the quantitative SSTR2 immunoreactivity using DIA according to the following formula: “% Positive cells” × “Avg Positive Cell Membrane OD” x “Avg Positive Membrane Completeness.”

2.6. Evaluation of Double Immunohistochemical Staining of SSTR2 Immunoreactivity

All double-stained slides were evaluated using eyeball analysis. After reviewing the entire epithelial areas with care, we determined the “hot spot” areas, which contained the largest number of double positive-SSTR2 and chromogranin A cells, counting at least 10 chromogranin-positive cells in one or two high power fields (field number: 25). We then calculated the SSTR2 positive rates in the neuroendocrine cells as follows: “the number of SSTR2 and chromogranin A double-positive cells/number of chromogranin A-positive cells.” In the stomach, the epithelia with intestinal metaplasia were tentatively excluded from this evaluation. The difference between the two groups, the stomach and rectum, duodenum and rectum, were subsequently statistically evaluated. Representative illustrations of SSTR2 and chromogranin A double-positive cells are presented in Figure 1e,f.

2.7. Statistical Analyses

The correlations between Volante scores, IRSs, and SSTR2 immunoreactivities evaluated using DIA were analyzed using Wilcoxon/Kruskal–Wallis test and Spearman’s tests. A correlation coefficient (ρ) was obtained by using Spearman’s test. Differences of age, sex, histological grades or Volante scores, IRSs, and SSTR2 immunoreactivities evaluated using DIA among the GI-NETs, and the positive rate of SSTR2 of neuroendocrine cells of non-neoplastic mucosa were analyzed using the χ2 test or Wilcoxon/Kruskal–Wallis test. The significance level of the Wilcoxon test performed on the difference of the positive rate was corrected using Bonferroni’s inequality. The correlations between the Ki-67 LI, histological grades, and SSTR2 immunoreactivity according to the various scores were analyzed using Spearman’s tests and χ2 tests or Wilcoxon/Kruskal–Wallis tests, respectively. The concordance between the therapeutic efficacy of SSAs and the Volante scores, IRSs, and SSTR2 immunoreactivity evaluated by DIA were examined using receiver operating characteristic (ROC) curves, with calculations of the areas under the curves (AUCs), sensitivity, and specificity. AUCs were evaluated by the DeLong test. The significance level of the DeLong test was corrected using Bonferroni’s inequality. The statistical significance was set at p < 0.05. All the statistical analyses except for the DeLong test were performed using the JMP Pro ver. 16.0.0 (SAS Institute, Cary, NC, USA). The DeLong test was performed using R version 3.6.2 (R Foundation, Vienna, Austria).

3. Results

3.1. The Correlations of SSTR2 Immunoreactivity Evaluated by Three Scoring Systems

The correlations of SSTR2 immunoreactivity were evaluated using the three scoring systems in the cases of Group 2 or Group 3. Significant correlations were detected between the SSTR2 immunoreactivity evaluated using all three scoring systems (see Figure S3a–c: p < 0.0001; p < 0.0001, ρ = 0.5972; and p < 0.0001, ρ = 0.7549, respectively).

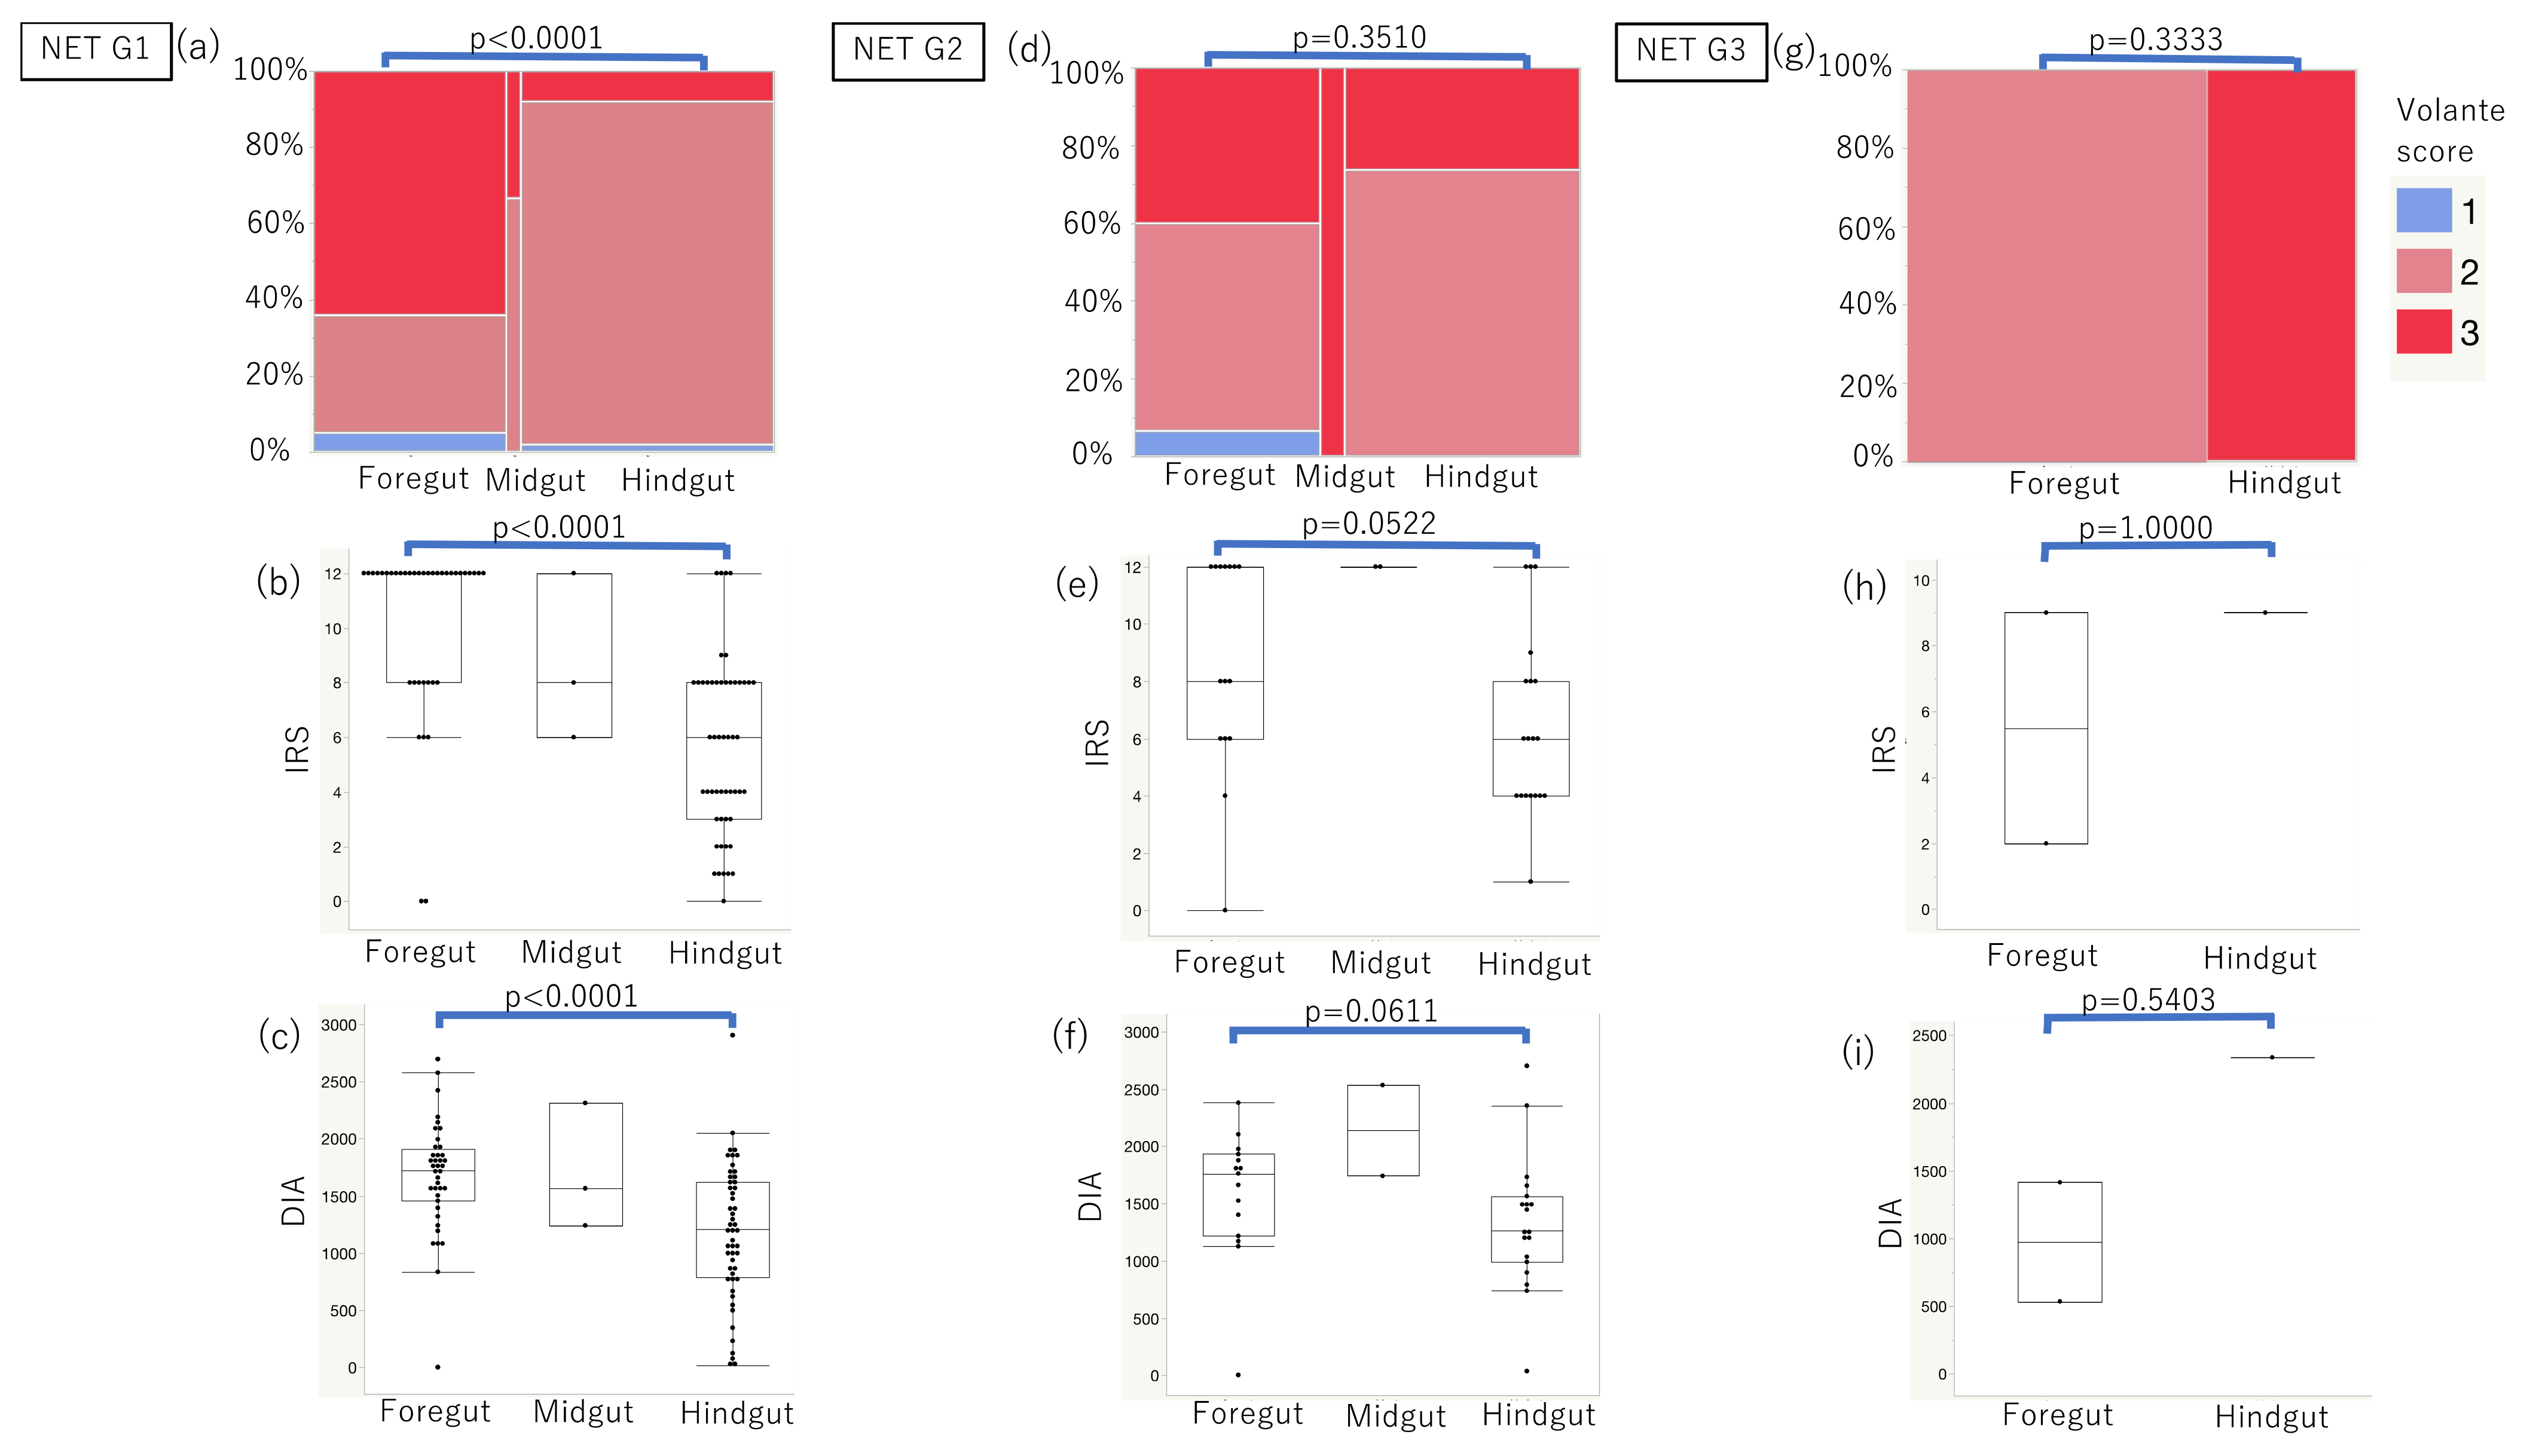
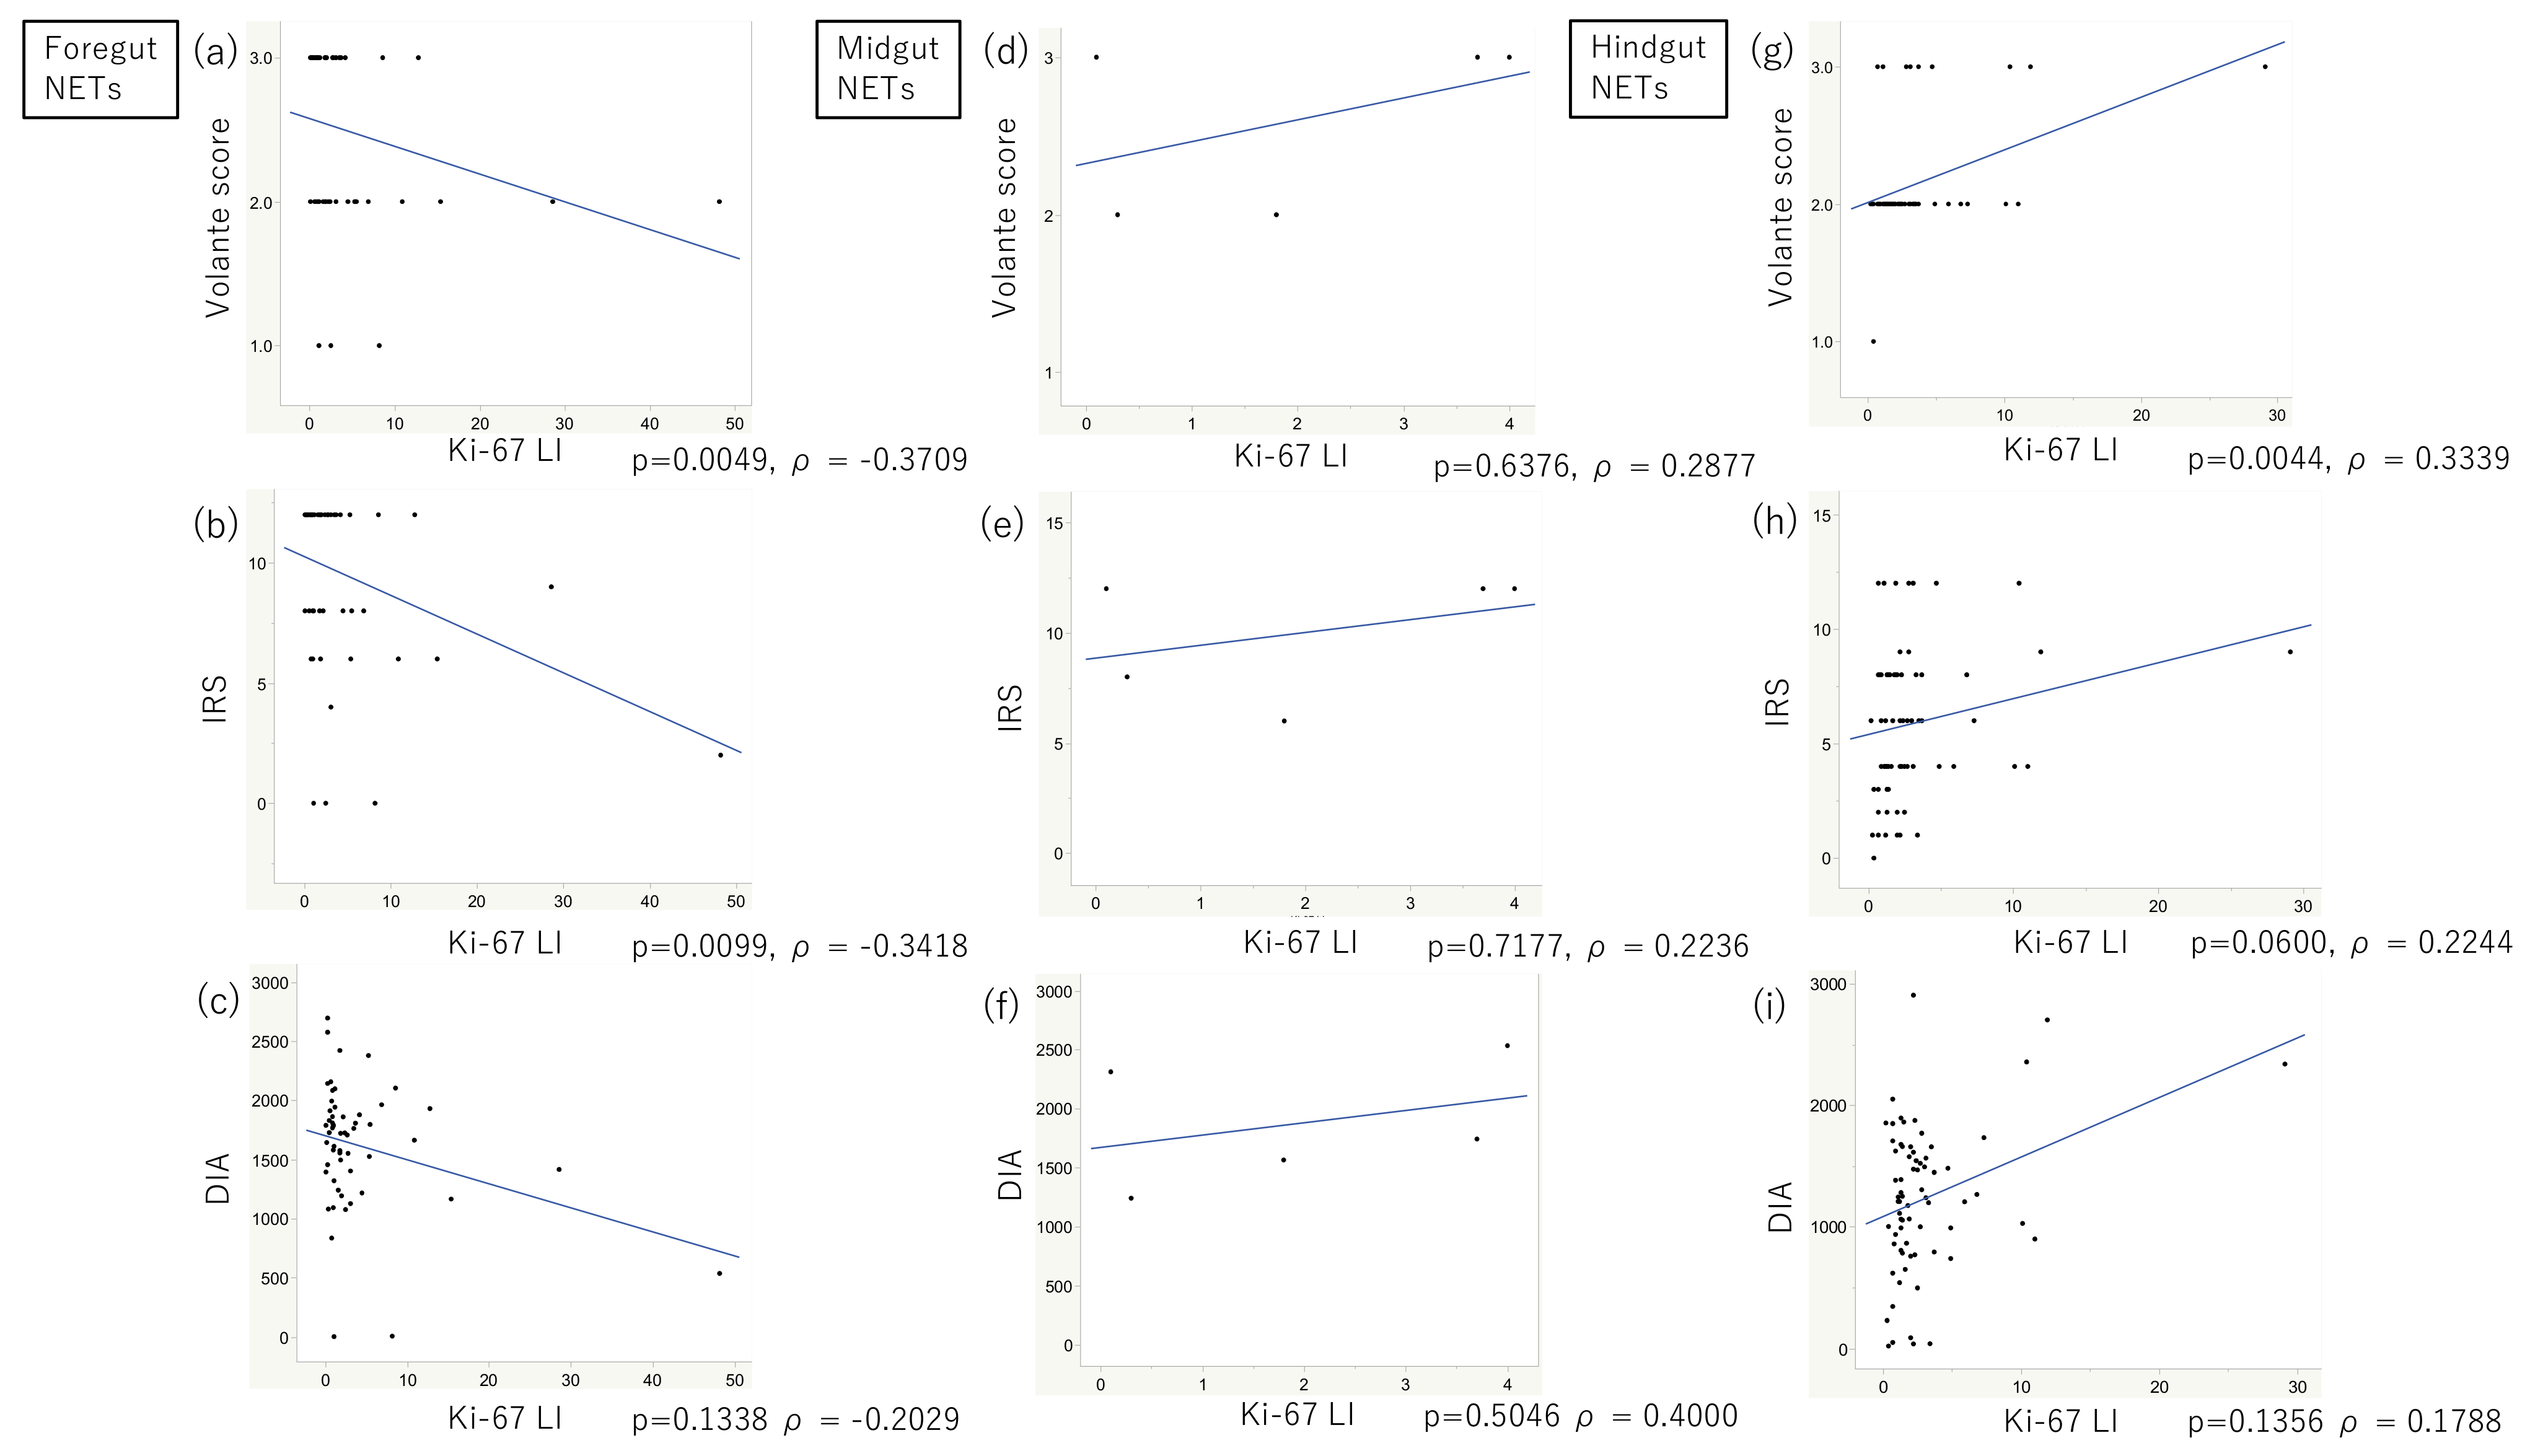
3.2. SSTR2 Immunoreactivity Evaluated by Three Scoring Systems and Their Correlations with Embryological Origins, Ki-67 LI, and Histological Grades in Group 2

Concerning the Volante scores, 31 out of 56, 3 out of 5, and 10 out of 71 cases yielded a score of 3 in the foregut, midgut, and hindgut NETs, respectively (Table 2). When all the GI-NET (Figure S4a–c) and NET Grade 1 (G1) cases (Figure 2a–c) were evaluated according to the scoring systems above, foregut NETs had significantly higher immunoreactivity than hindgut NETs (p < 0.0001). Concerning the GI-NET Grade 2 (G2), foregut NETs showed higher immunoreactivity than hindgut NETs using IRSs and DIA (p = 0.0522, p = 0.0611, respectively; Figure 2d–f). Regarding the GI-NET Grade 3 (G3), there were no significant differences in SSTR2 immunoreactivity between the foregut and hindgut NETs evaluated by all three scoring systems used (Figure 2g–i). The number of midgut NET cases was too small to be compared statistically with foregut or hindgut NETs.
In all the cases examined, no significant correlations were detected between the SSTR2 immunoreactivity evaluated using all the scoring systems and Ki-67 LI (Figure S4d–f). Furthermore, the SSTR2 immunoreactivity evaluated by all three scoring systems was not significantly different among the NET G1, G2, and G3 cases (Figure S4g–i). However, SSTR2 immunoreactivity was significantly inversely correlated with Ki-67 LI (Figure 3a–c) in the foregut NETs, especially when using the Volante scores and IRSs (Figure 3a,b, p = 0.0049, ρ = -0.3709 and p = 0.0099, ρ = -0.3418, respectively). SSTR2 immunoreactivity was not significantly different among G1, G2, and G3 cases (Figure S5a–c), but the results obtained by the IRSs were close to being significantly different (Figure S5b, p = 0.0631). In midgut NETs, SSTR2 immunoreactivity tended to be positively correlated with Ki-67 LI, although not significant (Figure 3d–f). SSTR2 immunoreactivity was also not significantly different between G1 and G2 (Figure S5d–f). In the hindgut NETs, SSTR2 immunoreactivity was positively correlated with Ki-67 LI (Figure 3g–i), especially when evaluated using the Volante scores and IRSs; the first correlation was significant (Figure 3g,h, p = 0.0044, ρ = 0.3339 and p = 0.0600, ρ = 0.2244). SSTR2 immunoreactivity was also significantly different among G1, G2, and G3 cases when using the Volante scores (Figure S5g, p = 0.0388), but not significantly different when using IRSs and DIA (Figure S5h,i).

3.3. SSTR2 Immunoreactivity and Its Correlation with the Therapeutic Efficacy of Somatostatin Analogues in Group 3 When Evaluated Using Three Scoring Systems

The clinicopathological characteristics of the Group 3 patients are summarized in Table 3. SSAs’ therapeutic efficacy was compared to the SSTR2 immunoreactivity evaluated by Volante scores, IRSs, and DIA with ROC curve analyses (Figure 4a–c). The AUC was highest when using DIA (AUC, 0.65; cut-off, 898.945; sensitivity, 80%; specificity, 75%), compared with Volante scores (AUC, 0.6125; cut-off, 2; sensitivity, 90%; specificity, 25%) and IRSs (AUC, 0.5875; cut-off, 4; sensitivity, 70%; specificity, 50%). No statistically significant differences were detected in those AUCs (Table S2). SSTR2 immunoreactivity scores greater than the cut-off value were tentatively regarded as positive, and those with less than the cut-off value were considered negative. For example, a Volante score of two or three was regarded as positive, and 0 or 1 as negative. Higher proportions of SD or CR were achieved in positive cases compared to negative ones regardless of the scoring systems employed (Figure 4d–f). Moreover, SSTR2 immunoreactivity evaluated by DIA was most closely associated with SSAs’ therapeutic efficacy (Figure 4f, p = 0.0949), compared to Volante scores and IRSs (Figure 4d,e).

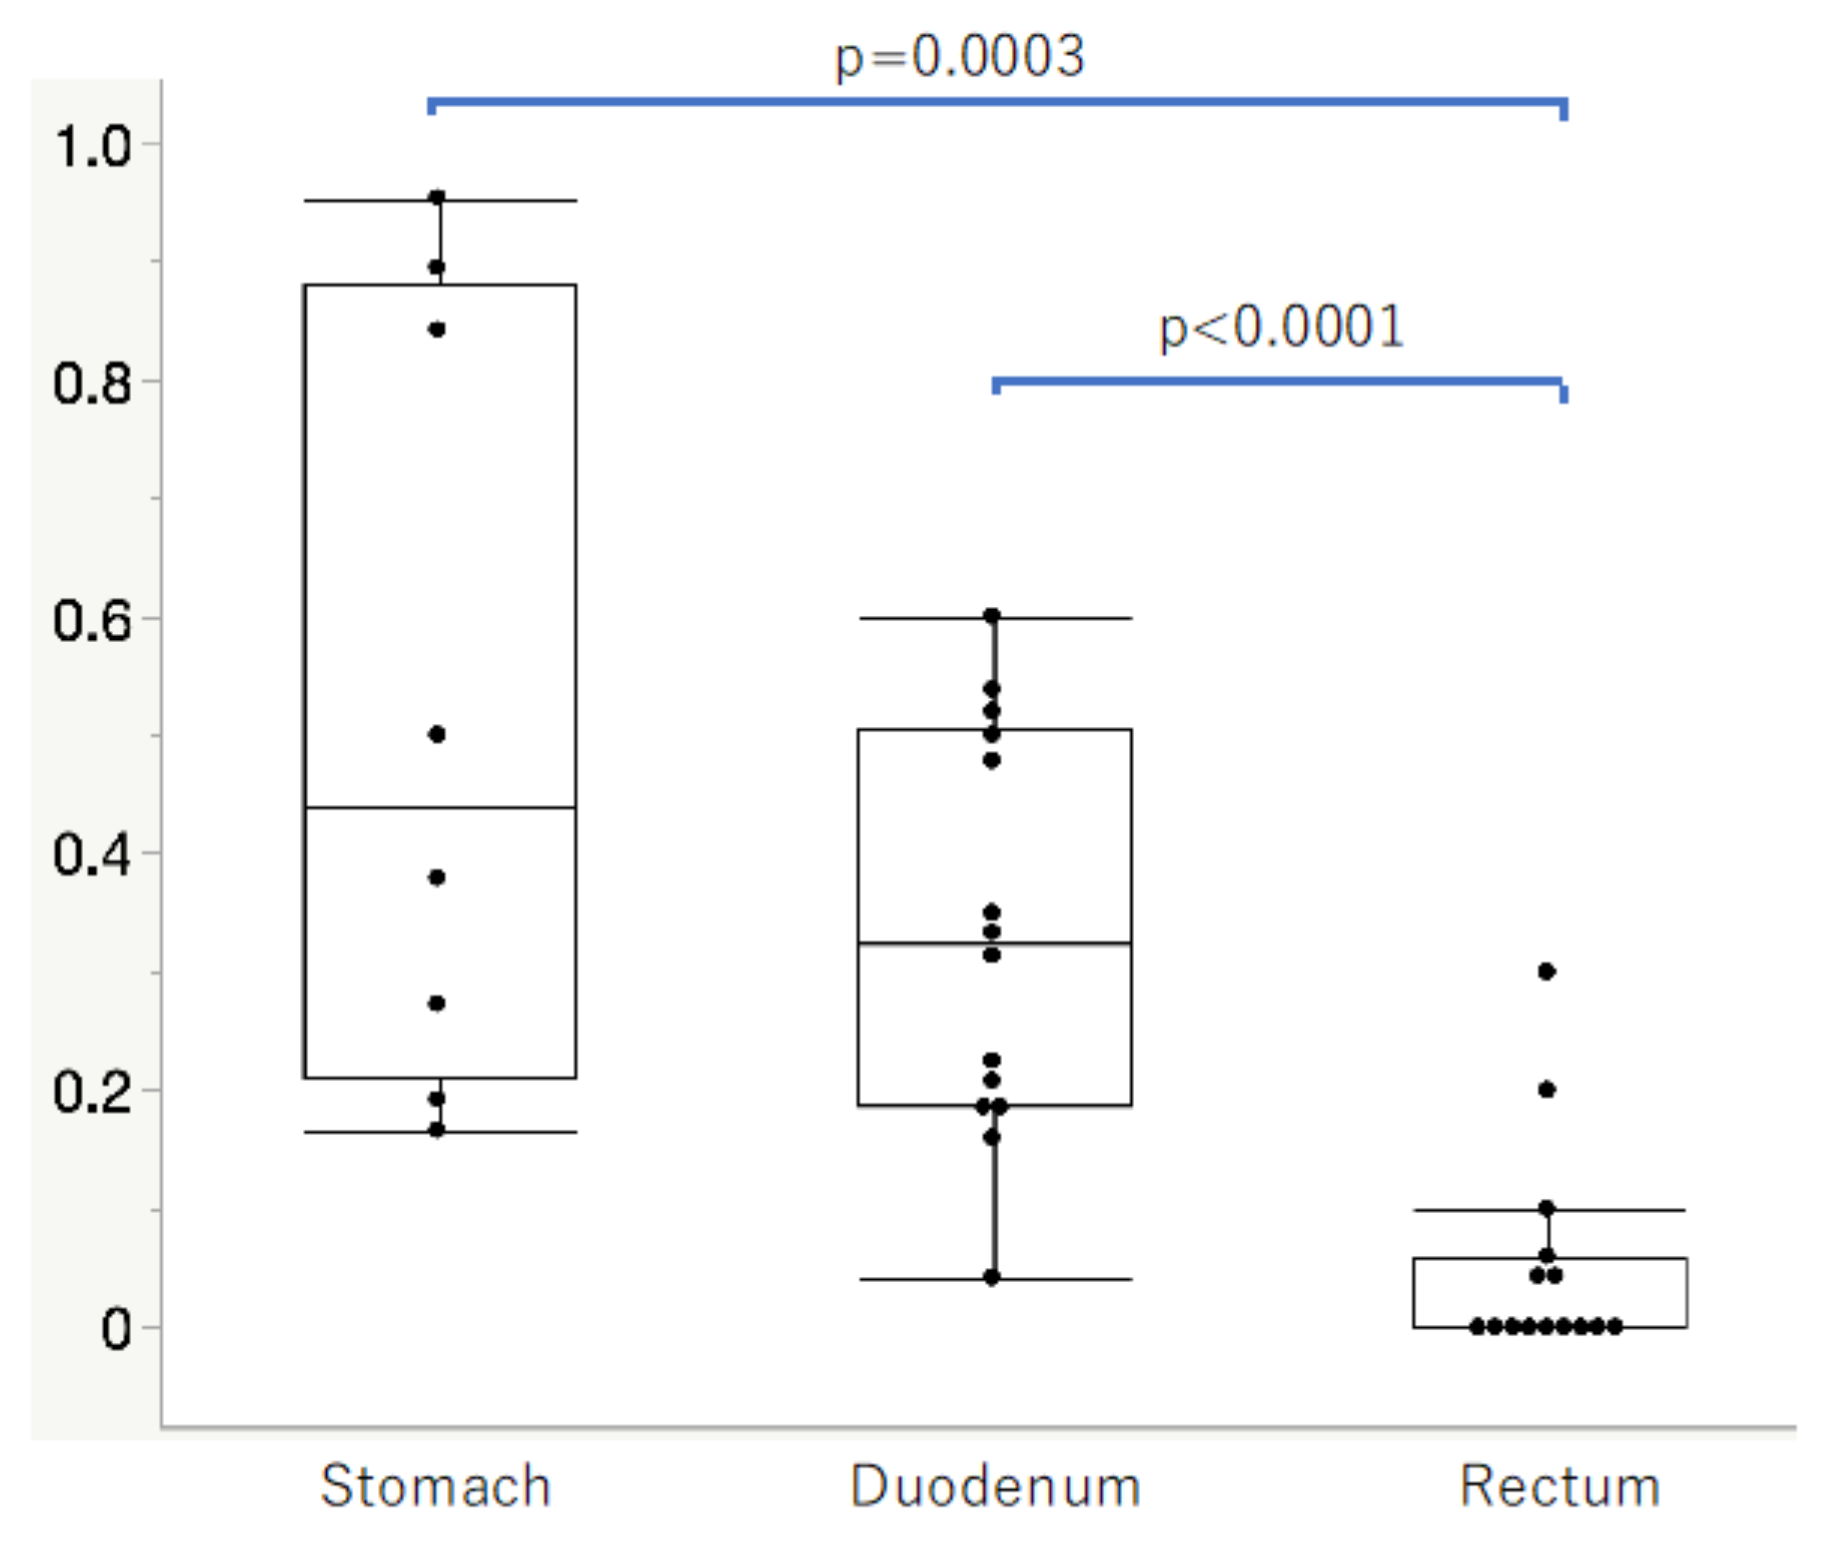
3.4. SSTR2-Positive Rates in Normal Neuroendocrine Cells of the Gastrointestinal Mucosa in Group 4

The tissue origins and clinical characteristics of the Group 4 patients and SSTR2-positive rates are summarized in Table 4. The SSTR2-positive rates in the stomach and duodenum were significantly higher than in the rectum (Figure 5, p = 0.0003, p < 0.0001, respectively).

4. Discussion

In this study, we first evaluated SSTR2 immunoreactivity in GI-NETs using both manual methods, including Volante scores [19] and IRSs [20] and DIA [24]. Furthermore, we also explored the association between the findings obtained by those analyses above and the primary sites of the GI tract, Ki-67 LI, histological grades, and SSAs’ therapeutic efficacy.
This study’s results demonstrated that SSTR2 immunoreactivity in foregut NETs was significantly higher than that in hindgut NETs, especially in NET G1, G2 cases (Figure 2). Moreover, SSTR2 immunoreactivity was significantly negatively correlated with Ki-67 LI in foregut NETs but positively in hindgut NETs (Figure 3). These results first demonstrated that SSTR2 expression profiles in GI-NETs could be different according to their primary sites. In addition, in the normal mucosa, neuroendocrine cells in the rectum showed less SSTR2 expression than those in the stomach and duodenum (Figure 5). In the normal gastric neuroendocrine cells, SSTR2 was reported to be present in enterochromaffin-like (ECL) cells [29], which is consistent with this study’s results. Therefore, based on those findings above, we hypothesized that the difference in SSTR2 profiles between foregut NETs and hindgut NETs was derived from the SSTR2 status of normal neuroendocrine cell counterparts (Figure 6). Low grade foregut NETs, mostly derived from their normal counterparts [30] with abundant SSTR2 expresssion, harbor relatively higher SSTR2 expression (Figure 6, left blue arrow). However, as the tumor progressed to higher histological grades, possibly in conjunction with genetic/epigenetic alterations such as the SSTR2 promoter hypermethylation [31,32], foregut NETs could be more deviated from the normal counterparts (Figure 6, right blue arrow) and demonstrate lower SSTR2 expression. In contrast, hindgut NETs derived from their normal counterparts, which had intrinsically low SSTR2 expression. Therefore, low grade hindgut NETs harboring relatively lower SSTR2 expression could result from neoplastic transformation of those normal counterparts (Figure 6, right red arrow). With tumor progression to higher histological grades, hindgut NETs could be more deviated from their normal counterparts and harbor higher SSTR2 expression (Figure 6, left red arrow). However, hindgut NETs in intermediate grades also yielded lower SSTR2 expression than foregut NETs (Figure 6). Further investigations are warranted to clarify this interesting hypothesis. In addition, it could be interesting to explore the differences of gene profiles between foregut and hindgut NETs resulting in that difference of SSTR2 expression profiles in future investigations.
Various histopathological scoring systems have been proposed to evaluate SSTR2 immunoreactivity to predict the potential therapeutic efficacy of SSAs, especially in PanNETs [19,20,33]. In our present study, we initially demonstrated that the SSTR2 immunoreactivity evaluated using the scoring systems above could serve as potential predictive markers when administering SSAs, especially in GI-NETs. A total of 75% of the Volante score and IRS positive cases presented therapeutic efficacy of SD or CR. However, it is also true that approximately half of the cases determined as the Volante score and IRS negative also demonstrated therapeutic efficacy of SD or CR in this study. Therefore, more objective and rigorous standardization of the SSTR2 immunoreactivity is required as well as possible standardization of pre-analytical, analytical, and post-analytical factors involved in immunohistochemistry [24]. ROC analyses in this study also revealed that DIA could provide a good alternative for predicting response to SSAs in evaluating SSTR2 immunoreactivity of GI-NETs. Eyeball-based analysis had high sensitivity but low specificity (Figure 4); DIA could be more sensitive and more specific, at least compared to the eyeball-based analysis (Figure 4). Potential application of DIA to the evaluation of human epidermal growth factor receptor 2 (HER2) or programmed death ligand-1 (PDL-1) immunoreactivity was reported to provide a more objective and accurate prediction of therapeutic response than that of eyeball examinations [28,34], which was consistent with this study’s results. In addition, evaluation of SSTR2 using DIA may also be useful in predicting the therapeutic efficacy of novel PRRT [21,22] and further studies are warranted to confirm this clinically important aspect.
The limitations of our present study were the relatively small number of midgut NETs and NET G3 cases as well as those receiving SSAs. This is why the AUC value is not so high and the AUCs showed no staristically significant differences. Furthermore, half of Group 3 patients had undergone preoperative therapy. Therefore, further analyses are also required for clarifying the potential value of SSTR2 analysis in predicting the therapeutic responses to SSAs.

5. Conclusions

We first demonstrated expression profiles of SSTR2 in GI-NETs among different embryological origins and their correlation with the responses to SSAs. In addition, we also demonstrated the potential usefulness of DIA compared to eyeball-based analysis in evaluating SSTR2 immunoreactivity of GI-NET. This study could lead to selecting the patients with GI-NETs who could benefit from SSA.

Supplementary Materials

The following supporting information can be downloaded at: https://www.mdpi.com/article/10.3390/cancers14030775/s1. Table S1. Summary of the clinicopathological characteristics of Group 1. Table S2. Summary of the DeLong test of Group 3. Figure S1. Case selection in this study. A total of 145 GI-NET tissues from 141 patients were collected from surgical pathology files. We excluded the cases receiving chemotherapy before surgery and those that had metastatic lesions in Group 1 patients. A total of 132 resected surgical tissues from 132 patients (Group 2) were available for evaluation. A total of 14 surgical tissues from 14 patients (Group 3) treated with somatostatin analogues (either octreotide or lanreotide) that were eligible for the comparison with therapeutic efficacy were collected from Group 1. Figure S2. Illustration of DIA detecting SSTR2 membranous positive cells with a setting parameter of “Minimum Membrane Completeness.” “Minimum Membrane Completeness” was minimum completeness of membrane to count the cells as a percentage of the membrane immunoreactivity to quantitatively evaluate the cells. For example, when setting “Minimum Membrane Completeness” at 50%, tumor cells with membranous circumferential completeness under 50% were excluded from the calculation, and when setting “Minimum Membrane Completeness” at 0%, tumor cells with membranous circumferential completeness over 0% were included in the calculation. Figure S3. Correlations between SSTR2 immunoreactivity evaluated by Volante score, IRS, and DIA. (a-c) Significant correlations were detected with the SSTR2 immunoreactivity evaluated using all the scoring systems (p < 0.0001). Figure S4. Correlation between SSTR2 immunoreactivity and embryonal sites of origin, Ki-67 LI, and histological grades in all GI-NET cases of Group 2. (a–c) Foregut NETs had significantly higher immunoreactivity than hindgut NETs (p < 0.0001). (d–f) When studying all the cases, no significant correlations were detected between SSTR2 immunoreactivity evaluated by all scoring systems and Ki-67 LI. (g–i) SSTR2 immunoreactivity evaluated using all the scoring systems were not significantly different among G1, G2, and G3 GI-NET cases. Figure S5. Correlations between SSTR2 immunoreactivity and histological grades in the foregut, midgut, and hindgut NETs. (a–c) When studying foregut NETs, SSTR2 immunoreactivity was not significantly different among G1, G2, and G3, but the results obtained by the IRSs were close to being significantly different (p = 0.0631). (d–f) In midgut NETs, SSTR2 was not significantly different between G1 and G2. (g–i) In hindgut NETs, SSTR2 was significantly different among G1, G2, and G3 when evaluated by the Volante scores (p = 0.0388), but not when evaluated using IRSs and DIA.

Author Contributions

H.W. and H.S. (Hironobu Sasano) designed the study. H.W. performed the digital image analysis. H.W. and H.S. (Hironobu Sasano) independently evaluated the immunohistochemical findings. H.W. performed the statistical analyses with support provided by T.N. and N.N. H.W. wrote the manuscript with support provided by F.F. and H.S. (Hironobu Sasano). I.K., M.I., S.H., K.H., Y.Y., A.K., T.M., T.T., K.S., H.S. (Hisashi Shiga), F.M., M.U., F.F., and H.S. (Hironobu Sasano) helped supervise the project. All authors have read and agreed to the published version of the manuscript.

Funding

Financial support for the present study was partly provided by Teijin Pharma Limited (Tokyo, Japan). Teijin Pharma Limited had no role in the study design, data collection, analysis, decision to publish, or preparation of the manuscript.

Institutional Review Board Statement

The study was conducted according to the guidelines of the Declaration of Helsinki and was approved by the Institutional Review Boards of Tohoku University Graduate School of Medicine (2020-1-7) and the participating institutions.

Informed Consent Statement

Information regarding this study including the purpose of the study has been disclosed by posting the information disclosure materials approved by the Ethics Committee on the website of the Graduate School of Medicine, Tohoku University, Sendai, Japan. Patient consent was waived.

Data Availability Statement

The data in this study are available from the corresponding authors. The data are not publicly available because of ethical restrictions.

Acknowledgments

We appreciate the timely help given by Yayoi Aoyama and Fouzia Guestini in preparing the histopathological specimens.

Conflicts of Interest

The authors declare no conflict of interest.

References

  1. Taal, B.G.; Visser, O. Epidemiology of neuroendocrine tumours. Neuroendocrinology 2004, 80, 3–7. [Google Scholar] [CrossRef] [PubMed]
  2. Ahmed, M. Gastrointestinal neuroendocrine tumors in 2020. World J. Gastrointest. Oncol. 2020, 12, 79–807. [Google Scholar] [CrossRef] [PubMed]
  3. McCarthy, D.M. Proton Pump Inhibitor Use, Hypergastrinemia, and Gastric Carcinoids-What Is the Relationship? Int. J. Mol. Sci. 2020, 21, 662. [Google Scholar] [CrossRef] [PubMed] [Green Version]
  4. Williams, E.D.; Sandler, M. The classification of carcinoid tum ours. Lancet 1963, 1, 238–239. [Google Scholar] [CrossRef]
  5. Watanabe, H.; Yamazaki, Y.; Fujishima, F.; Izumi, K.; Imamura, M.; Hijioka, S.; Toriyama, K.; Yatabe, Y.; Kudo, A.; Motoi, F.; et al. O(6)-methylguanine DNA methyltransferase and glucose transporter 2 in foregut and hindgut gastrointestinal neuroendocrine neoplasms. BMC Cancer 2020, 20, 1195. [Google Scholar] [CrossRef]
  6. Rindi, G.; Klöppel, G.; Couvelard, A.; Komminoth, P.; Körner, M.; Lopes, J.M.; McNicol, A.-M.; Nilsson, O.; Perren, A.; Scarpa, A.; et al. TNM staging of midgut and hindgut (neuro) endocrine tumors: A consensus proposal including a grading system. Virchows Arch. 2007, 451, 757–762. [Google Scholar] [CrossRef] [Green Version]
  7. Oronsky, B.; Ma, P.C.; Morgensztern, D.; Carter, C.A. Nothing But NET: A Review of Neuroendocrine Tumors and Carcinomas. Neoplasia 2017, 19, 991–1002. [Google Scholar] [CrossRef]
  8. Oberg, K.E.; Reubi, J.C.; Kwekkeboom, D.J.; Krenning, E.P. Role of somatostatins in gastroenteropancreatic neuroendocrine tumor development and therapy. Gastroenterology 2010, 139, 742–753.e1. [Google Scholar] [CrossRef]
  9. Öberg, K.E. Gastrointestinal neuroendocrine tumors. Ann. Oncol. 2010, 21, vii72–vii80. [Google Scholar] [CrossRef]
  10. Kim, J.Y.; Hong, S.M. Recent Updates on Neuroendocrine Tumors from the Gastrointestinal and Pancreatobiliary Tracts. Arch. Pathol. Lab. Med. 2016, 140, 437–448. [Google Scholar] [CrossRef] [Green Version]
  11. Elf, A.K.; Johanson, V.; Marin, I.; Bergström, A.; Nilsson, O.; Svensson, J.; Wangberg, B.; Bernhardt, P.; Elias, E. Evaluation of SSTR2 Expression in SI-NETs and Relation to Overall Survival after PRRT. Cancers 2021, 23, 2035. [Google Scholar] [CrossRef]
  12. Guillermet-Guibert, J.; Lahlou, H.; Cordelier, P.; Bousquet, C.; Pyronnet, S.; Susini, C. Physiology of somatostatin receptors. J. Endocrinol. Investig. 2005, 28, 5–9. [Google Scholar]
  13. Dalm, V.A.; van Hagen, P.M.; van Koetsveld, P.M.; Achilefu, S.; Houtsmuller, A.B.; Pols, D.H.; van der Lely, A.-J.; Lamberts, S.W.J.; Hofland, L.J. Expression of somatostatin, cortistatin, and somatostatin receptors in human monocytes, macrophages, and dendritic cells. Am. J. Physiol. Endocrinol. Metab. 2003, 285, E344–E353. [Google Scholar] [CrossRef] [PubMed]
  14. Ampofo, E.; Nalbach, L.; Menger, M.D.; Laschke, M.W. Regulatory Mechanisms of Somatostatin Expression. Int. J. Mol. Sci. 2020, 21, 4170. [Google Scholar] [CrossRef] [PubMed]
  15. Martín-Gago, P.; Rol, Á.; Todorovski, T.; Aragón, E.; Martin-Malpartida, P.; Verdaguer, X.; Miret, M.V.; Fernandez-Carneado, J.; Ponsati, B.; Macias, M.J.; et al. Peptide aromatic interactions modulated by fluorinated residues: Synthesis, structure and biological activity of Somatostatin analogs containing 3-(3’,5’difluorophenyl)-alanine. Sci. Rep. 2016, 6, 27285. [Google Scholar] [CrossRef] [Green Version]
  16. Somvanshi, R.K.; Kumar, U. Pathophysiology of GPCR Homo- and Heterodimerization: Special Emphasis on Somatostatin Receptors. Pharmaceuticals 2012, 5, 417–446. [Google Scholar] [CrossRef] [PubMed] [Green Version]
  17. Theodoropoulou, M.; Stalla, G.K. Somatostatin receptors: From signaling to clinical practice. Front. Neuroendocrinol. 2013, 34, 228–252. [Google Scholar] [CrossRef]
  18. Kasajima, A.; Papotti, M.; Ito, W.; Brizzi, M.P.; La Salvia, A.; Rapa, I.; Tachibana, T.; Yazdani, S.; Sasano, H.; Volante, M. High interlaboratory and interobserver agreement of somatostatin receptor immunohistochemical determination and correlation with response to somatostatin analogs. Hum. Pathol. 2018, 72, 144–152. [Google Scholar] [CrossRef] [PubMed]
  19. Volante, M.; Brizzi, M.P.; Faggiano, A.; La Rosa, S.; Rapa, I.; Ferrero, A.; Mansueto, G.; Righi, L.; Garancini, S.; Capello, C.; et al. Somatostatin receptor type 2A immunohistochemistry in neuroendocrine tumors: A proposal of scoring system correlated with somatostatin receptor scintigraphy. Mod. Pathol. 2007, 20, 1172–1182. [Google Scholar] [CrossRef] [PubMed]
  20. Gatto, F.; Feelders, R.A.; van der Pas, R.; Kros, J.M.; Waaijers, M.; Sprij-Mooij, D.; Neggers, S.J.C.M.M.; van der Lelij, A.-J.; Minuto, F.; Lamberts, S.W.J.; et al. Immunoreactivity score using an anti-sst2A receptor monoclonal antibody strongly predicts the biochemical response to adjuvant treatment with somatostatin analogs in acromegaly. J. Clin. Endocrinol. Metab. 2013, 98, E66–E71. [Google Scholar] [CrossRef] [Green Version]
  21. Cullinane, C.; Waldeck, K.; Kirby, L.; Rogers, B.E.; Eu, P.; Tothill, R.W.; Hicks, R.J. Enhancing the anti-tumour activity of 177Lu-DOTA-octreotate radionuclide therapy in somatostatin receptor-2 expressing tumour models by targeting PARP. Sci. Rep. 2020, 10, 10196. [Google Scholar] [CrossRef] [PubMed]
  22. Basu, S.; Parghane, R.V.; Chakrabarty, S. Peptide Receptor Radionuclide Therapy of Neuroendocrine Tumors. Semin. Nucl. Med. 2020, 50, 447–464. [Google Scholar] [CrossRef] [PubMed]
  23. Marcuzzo, T.; Giudici, F.; Ober, E.; Rizzardi, C.; Bottin, C.; Zanconati, F. Her2 immunohistochemical evaluation by traditional microscopy and by digital analysis, and the consequences for FISH testing. Pathol. Res. Pract. 2016, 212, 911–918. [Google Scholar] [CrossRef] [PubMed] [Green Version]
  24. Watanabe, H.; Ide, R.; Yamazaki, Y.; Fujishima, F.; Kasajima, A.; Yazdani, S.; Tachibana, T.; Motoi, F.; Unno, M.; Sasano, H. Quantitative digital image analysis of somatostatin receptor 2 immunohistochemistry in pancreatic neuroendocrine tumors. Med. Mol. Morphol. 2021, 54, 324–336. [Google Scholar] [CrossRef] [PubMed]
  25. Therasse, P.; Arbuck, S.G.; Eisenhauer, E.A.; Wanders, J.; Kaplan, R.S.; Rubinstein, L.; Verweij, J.; Van Glabbeke, M.; van Oosterom, A.T.; Christian, M.C.; et al. New guidelines to evaluate the response to treatment in solid tumors. European Organization for Research and Treatment of Cancer, National Cancer Institute of the United States, National Cancer Institute of Canada. J. Natl. Cancer Inst. 2000, 92, 205–216. [Google Scholar] [CrossRef] [PubMed] [Green Version]
  26. Nagtegaal, I.D.; Odze, R.D.; Klimstra, D.; Paradis, V.; Rugge, M.; Schirmacher, P.; Washington, K.M.; Carneiro, F.; Cree, I.A.; WHO Classification of Tumours Editorial Board. The 2019 WHO classification of tumours of the digestive system. Histopathology 2020, 76, 182–188. [Google Scholar] [CrossRef] [Green Version]
  27. Rindi, G.; Klimstra, D.S.; Abedi-Ardekani, B.; Asa, S.L.; Bosman, F.T.; Brambilla, E.; Busam, K.J.; de Krijger, R.R.; Dietel, M.; El-Naggar, A.K.; et al. A common classification framework for neuroendocrine neoplasms: An International Agency for Research on Cancer (IARC) and World Health Organization (WHO) expert consensus proposal. Mod. Pathol. 2018, 31, 1770–1786. [Google Scholar] [CrossRef]
  28. Koelzer, V.H.; Gisler, A.; Hanhart, J.C.; Griss, J.; Wagner, S.N.; Willi, N.; Cathomas, G.; Sachs, M.; Kempf, W.; Thommen, D.S.; et al. Digital image analysis improves precision of PD-L1 scoring in cutaneous melanoma. Histopathology 2018, 73, 397–406. [Google Scholar] [CrossRef]
  29. Borin, J.F.; Tang, L.H.; Kidd, M.; Miu, K.; Borteçen, K.H.; Sandor, A.; Modlin, I.M. Somatostatin receptor regulation of gastric enterochromaffin-like cell transformation to gastric carcinoid. Surgery 1996, 120, 1026–1032. [Google Scholar] [CrossRef]
  30. Rindi, G.; Bordi, C.; Rappel, S.; La Rosa, S.; Stolte, M.; Solcia, E. Gastric carcinoids and neuroendocrine carcinomas: Pathogenesis, pathology, and behavior. World J. Surg. 1996, 20, 168–172. [Google Scholar] [CrossRef]
  31. Klomp, M.J.; Dalm, S.U.; de Jong, M.; Feelders, R.A.; Hofland, J.; Hofland, L.J. Epigenetic regulation of somatostatin and somatostatin receptors in neuroendocrine tumors and other types of cancer. Rev. Endocr. Metab. Disord. 2021, 22, 495–510. [Google Scholar] [CrossRef] [PubMed]
  32. Butt, S.; Evans, J.; Mauri, F.; Sharma, R. Methylation of somatostatin receptor 2 gene in neuroendocrine tumours as a predictor of tumour response to peptide receptor radionuclide therapy. Clin. Med. 2019, 19, 123. [Google Scholar] [CrossRef]
  33. Kaemmerer, D.; Peter, L.; Lupp, A.; Schulz, S.; Sänger, J.; Baum, R.P.; Prasad, V.; Hommann, M. Comparing of IRS and Her2 as immunohistochemical scoring schemes in gastroenteropancreatic neuroendocrine tumors. Int. J. Clin. Exp. Pathol. 2012, 5, 187–194. [Google Scholar] [PubMed]
  34. Koopman, T.; de Bock, G.H.; Buikema, H.J.; Smits, M.M.; Louwen, M.; Hage, M.; Imholz, A.L.T.; van der Vegt, B. Digital image analysis of HER2 immunohistochemistry in gastric- and oesophageal adenocarcinoma: A validation study on biopsies and surgical specimens. Histopathology 2018, 72, 191–200. [Google Scholar] [CrossRef] [PubMed] [Green Version]
Figure 1. Representative illustrations of SSTR2 and chromogranin A immunohistochemistry. (a) Marked and circumferential, (b) moderate and incomplete, (c) weak and incomplete SSTR2 immunoreactivity in the membrane of tumor cells, (d) cytoplasmic SSTR2 immunoreactivity of tumor cells. Double immunostaining of SSTR2 and chromogranin A in the (e) stomach and (f) duodenum. Green arrows represent SSTR2 and chromogranin A double-positive neuroendocrine cells.
Cancers 14 00775 g001
Figure 2. Correlation between SSTR2 immunoreactivity and embryonal sites of origin in NET G1, G2, and G3, respectively. (ac) In GI-NETs G1, foregut NETs demonstrated significantly higher immunoreactivity than hindgut NETs according to all scoring systems (p < 0.0001). (df) In GI-NETs G2, foregut NETs showed close to significantly higher immunoreactivity than hindgut NETs using IRSs and DIA (p = 0.0522, p = 0.0611, respectively). (gi) In GI-NETs G3, there were no significant differences of SSTR2 immunoreactivity evaluated by all scoring systems between foregut and hindgut GI-NETs.
Cancers 14 00775 g002
Figure 3. Correlation between SSTR2 immunoreactivity and Ki-67 labeling index (LI). (ac) In the foregut NETs, SSTR2 was significantly inversely correlated with Ki-67 LI, especially when using the Volante scores and IRSs (p = 0.0049, ρ = −0.3709 and p = 0.0099, ρ = −0.3418, respectively). (df) In the midgut NETs, SSTR2 was positively correlated with Ki-67 LI, although not significantly. (gi) In the hindgut NETs, SSTR2 was positively correlated with Ki-67 LI, especially when evaluated using the Volante scores and IRSs; the former correlation was significant (p = 0.0044, ρ = 0.3339 and p = 0.0600, ρ = 0.2244, respectively).
Cancers 14 00775 g003
Figure 4. SSTR2 immunoreactivity was evaluated by three different scoring systems and their correlation with the therapeutic efficacy of SSAs in Group 3 patients. (ac) The area under the curve (AUC) was highest when evaluated using DIA (AUC, 0.65; cut-off, 898.945; sensitivity, 80%; specificity, 75%), compared with that when using Volante scores (AUC, 0.6125; cut-off, 2; sensitivity, 90%; specificity, 25%) and IRSs (AUC, 0.5875; cutoff, 4; sensitivity, 70%; specificity, 50%). (df) Higher proportions of SD or CR were detected in positive cases than in negative cases regardless of the scoring systems used. (f) SSTR2 immunoreactivity evaluated by DIA tended to be closely associated with the therapeutic efficacy of SSAs, but not when evaluated using the Volante scores and IRSs.
Cancers 14 00775 g004
Figure 5. SSTR2-positive rates in the normal neuroendocrine cells of gastrointestinal mucosa in Group 4 cases. SSTR2-positive rates in the stomach and duodenum were significantly higher than those in the rectum (p = 0.0003, p < 0.0001, respectively).
Cancers 14 00775 g005
Figure 6. We hypothesized that low grade foregut NETs, derived from their normal counterparts which harbor relatively abundant SSTR2 expression, could have high SSTR2 expression, while foregut NETs with more deviation from their normal counterparts and higher histological grades could have lower SSTR2 expressions. In contrast, hindgut NETs derived from their normal counterparts which harbor intrinsically low SSTR2 expression demonstrated low SSTR2 expression, while hindgut NETs with more deviations from their normal counterparts and higher histological grades had higher SSTR2 expression.
Cancers 14 00775 g006
Table 1. Summary of the protocols of immunohistochemistry used in this study.
AntibodySupplier (Catalogue Number)HostAntigen Retrieval TreatmentDilutionReaction Time of Primary AntibodyAntibody TypeSecondary AntibodyPositive Control
Ki-67Agilent technologies, US (IR626)MousePT Link (97 ℃, 20 min), Target Retrieval Solution High PHReady to use20 min, room temperatureMIB-1EnVision FLEXEpithelial cell
SSTR2Abcam, England (ab134152)RabbitAC (121 ℃, 5 min), pH 6.01:20004 ℃, overnightUMB1Histofine KitIslet of langerhans
Chromogranin AAgilent technologies, US (A0430)RabbitMicrowave (210 W, 15 min), pH 6.01:15004 ℃, overnightpolyclonalHistofine KitIslet of langerhans
Table 2. Summary of the clinicopathological characteristics of Group 2 patients.
GI-NETp-Value
ForegutMidgutHindgut
Total number 56571
AgeMedian (range)60.5 (33–88)62 (53–74)61 (36–82)NS
SexMale36346NS
Female20225
FunctionNon-function42370<0.0001
Gastrinoma1300
Carcinoid syndrome020
Not available101
Hereditary backgroundNot detected455710.0002
MEN11100
Volante score0000<0.0001
1301
222260
331310
IRSMedian (range)12 (0–12)12 (6–12)6 (0–12)<0.0001
DIA *Median (range)1723 (0–2695)1741 (1240–2533)1238 (19–2904)<0.0001
WHO2019NET G138351NS
NETG215219
NET G3201
Ki-67 LIMedian (range)1.7 (0.1–48.2)1.8 (0.2–29.1)1.9 (0.1–29.1)NS
* Round down after the decimal point. Abbreviations: GI—gastrointestinal; NS—not significant; IRS—immunoreactive score; DIA—digital image analysis; LI—labeling index.
Table 3. Summary of the clinicopathological characteristics of Group 3 patients.
Case No.SexAgePrimary LocationTissue OriginGradePreoperative TherapySSTR2 ImmunoreactivityTreatmentResponse to SSASD, CR = Positive PD = Negative
Volante ScoreIRSDIA *
1M63midgutprimary siteG1TS1, Octreotide24769Octreotide, UFTCRpositive
2F60hindgutprimary siteG2Not done261492LanreotideSDpositive
3M55midgutprimary siteG2Not done3121741LanreotideSDpositive
4M61hindgutprimary siteG2Octreotide10163OctreotideSDpositive
5F45hindgutprimary siteG1Octreotide, Lanreotide221075Octreotide, LanreotideSDpositive
6M65hindgutprimary siteG2Not done24898Octreotide, LanreotideSDpositive
7M48hindgutmetastatic site (liver)G2Octreotide, Lanreotide22830Octreotide, LanreotidePDnegative
8M72midgutmetastatic site (liver)G2Octreotide, Lanreotide24731Octreotide, LanreotidePDnegative
9M61foregutprimary siteG2Not done2122379OctreotidePDnegative
10M73foregutmetastatic site (liver)G2Not done10215LanreotidePDnegative
11M74midgutprimary siteG1Not done281240LanreotideSDpositive
12F65foregutmetastatic site (liver)G1Octreotide281467OctreotideSDpositive
13F67midgutprimary siteG1Octreotide, Everolimus22967OctreotideSDpositive
14F71hindgutprimary siteG2Not done2410275FU, CDDP, OctreotideSDpositive
* Round down after the decimal point. Abbreviations: IRS—immunoreactive score; DIA—digital image analysis; SSA—somatostatin analogue; UFT—uracil-tegafur; 5FU—5-fluorouracile; CDDP—cisplatin; SD—stable disease; CR—complete response; PD—progressive disease.
Table 4. Summary of the clinicopathological characteristics of Group 4.
Case No.SiteAgeSexPositive Rates *
1StomachPyloric gland64Male0.953
2Pyloric gland81Male0.842
3Fundic glands55Male0.5
4Pyloric gland83Female0.166
5Cardiac gland83Male0.379
6Fundic glands66Male0.894
7Fundic glands63Male0.192
8Cardiac gland58Female0.272
1DuodenumBulb of duodenum64Male0.52
2Bulb of duodenum81Male0.16
4Bulb of duodenum83Female0.333
5Bulb of duodenum83Male0.208
8Bulb of duodenum58Female0.6
9Bulb of duodenum73Male0.538
10Bulb of duodenum69Female0.5
11Second portion67Male0.187
12Second portion71Female0.041
13Second portion79Male0.218
14Second portion55Male0.185
15Second portion67Male0.346
16Second portion69Male0.478
17Second portion73Male0.313
18Rectum60Female0
1983Female0.3
2052Male0
2170Female0
2240Male0
2362Male0.1
2451Female0
2581Female0.2
2675Male0
2770Female0.043
2856Female0.043
2987Female0
3079Female0
3177Male0.058
3237Male0
* Round down to the fourth decimal place.
Publisher’s Note: MDPI stays neutral with regard to jurisdictional claims in published maps and institutional affiliations.

