
Exploring Response to Immunotherapy in Non-Small Cell Lung Cancer Using Delta-Radiomics

 ,
,  , , ,
, , ,  , ,
, ,  ,
, 
Abstract
:Simple Summary
Abstract
1. Introduction
2. Materials and Methods
2.1. Eligible Patients and Radiologic Lesions
2.2. CT Protocol and Images Reformatting
2.3. Segmentation and Radiomic Analysis
2.4. Delta-Radiomic Features Computation
2.5. Statistical Analysis
2.6. Radiomic–Radiological Correlation
3. Results
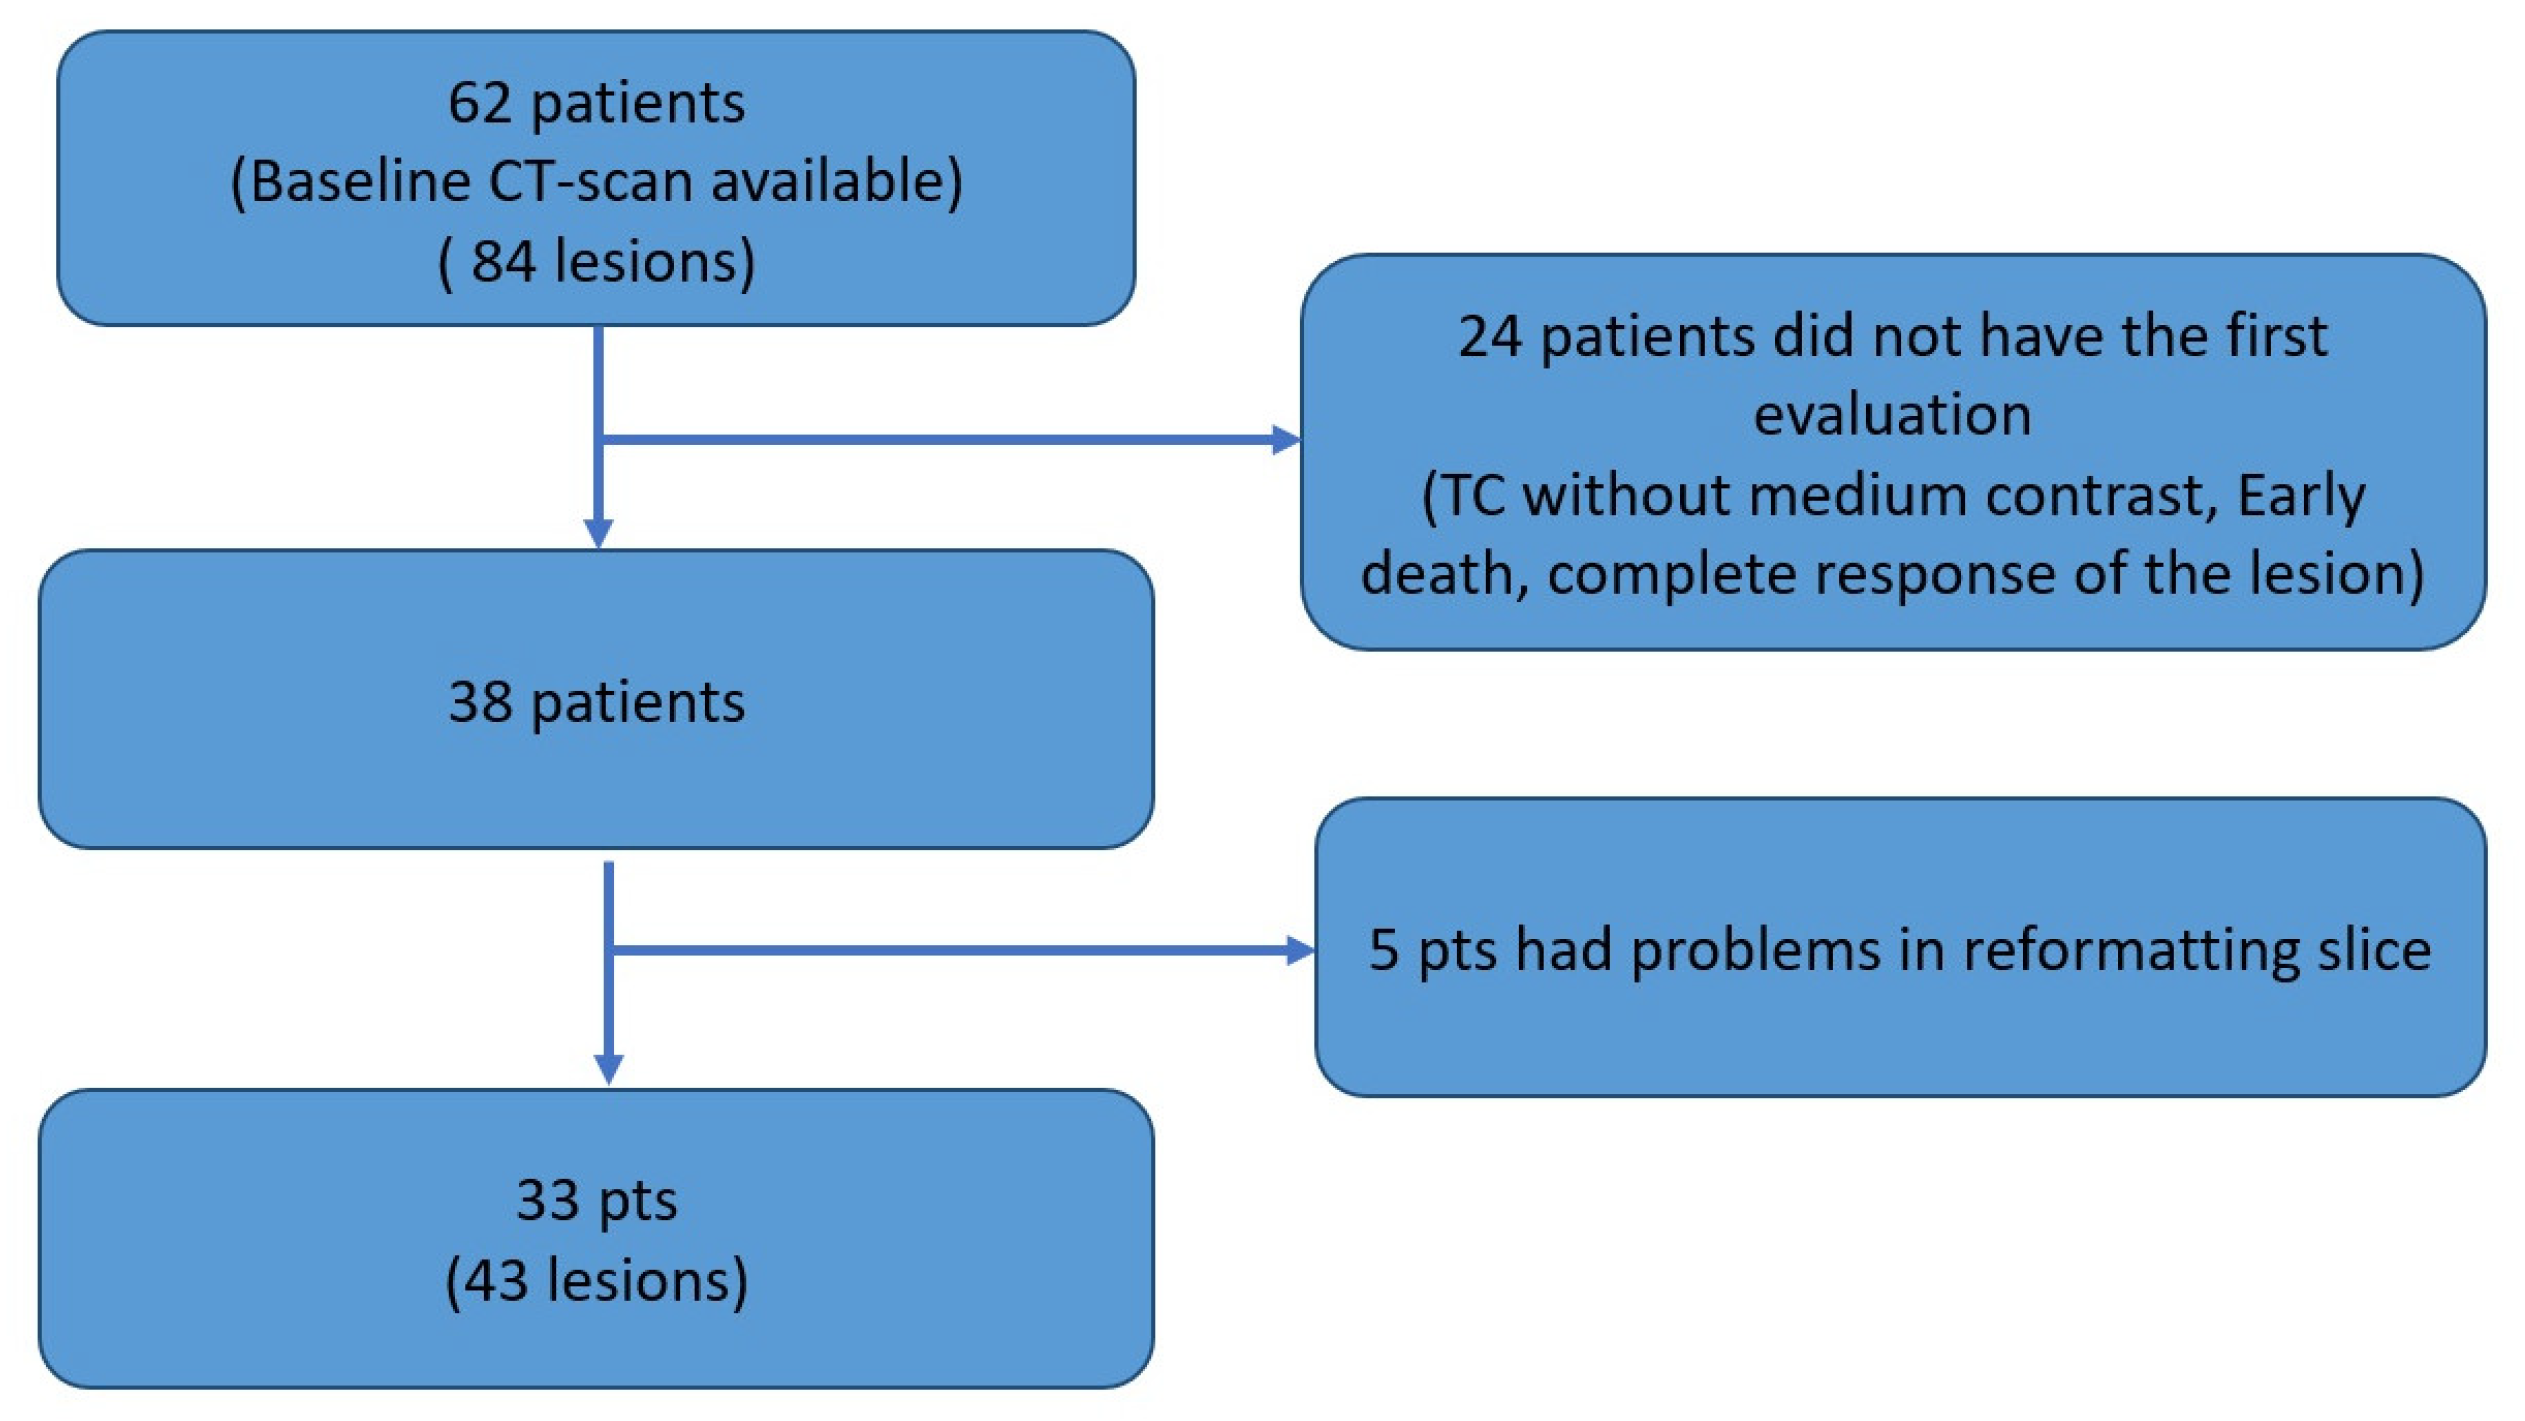
3.1. Patients
3.2. Features That Distinguish Response Classes
3.2.1. First-Order Features and Heterogeneity-Based Features
3.2.2. Gray-Level Run Length Matrix Features
3.2.3. Gray-Level Size Zone Matrix
3.3. Features That Distinguish PD and Pseudo-Progression
3.4. Univariate Analysis of Prognostic Clinical Factors
4. Discussion
5. Conclusions
Supplementary Materials
Author Contributions
Funding
Institutional Review Board Statement
Informed Consent Statement
Data Availability Statement
Acknowledgments
Conflicts of Interest
References
- Lambin, P.; Rios-Velazquez, E.; Leijenaar, R.; Carvalho, S.; van Stiphout, R.G.P.M.; Granton, P.; Zegers, C.M.L.; Gillies, R.; Boellard, R.; Dekker, A.; et al. Radiomics: Extracting More Information from Medical Images Using Advanced Feature Analysis. Eur. J. Cancer 2012, 48, 441–446. [Google Scholar] [CrossRef] [PubMed] [Green Version]
- Tomaszewski, M.R.; Gillies, R.J. The Biological Meaning of Radiomic Features. Radiology 2021, 298, 505–516. [Google Scholar] [CrossRef] [PubMed]
- Matzner-Lober, E.; Suehs, C.M.; Dohan, A.; Molinari, N. Thoughts on Entering Correlated Imaging Variables into a Multivariable Model: Application to Radiomics and Texture Analysis. Diagn. Interv. Imaging 2018, 99, 269–270. [Google Scholar] [CrossRef]
- Rossi, G.; Barabino, E.; Fedeli, A.; Ficarra, G.; Coco, S.; Russo, A.; Adamo, V.; Buemi, F.; Zullo, L.; Dono, M.; et al. Radiomic Detection of EGFR Mutations in NSCLC. Cancer Res. 2021, 81, 724–731. [Google Scholar] [CrossRef] [PubMed]
- Ma, Y.; Ma, W.; Xu, X.; Cao, F. How Does the Delta-Radiomics Better Differentiate Pre-Invasive GGNs From Invasive GGNs? Front. Oncol. 2020, 10, 1017. [Google Scholar] [CrossRef]
- Nasief, H.; Zheng, C.; Schott, D.; Hall, W.; Tsai, S.; Erickson, B.; Allen Li, X. A Machine Learning Based Delta-Radiomics Process for Early Prediction of Treatment Response of Pancreatic Cancer. NPJ Precis. Oncol. 2019, 3, 25. [Google Scholar] [CrossRef] [PubMed]
- Khorrami, M.; Prasanna, P.; Gupta, A.; Patil, P.; Velu, P.D.; Thawani, R.; Corredor, G.; Alilou, M.; Bera, K.; Fu, P.; et al. Changes in CT Radiomic Features Associated with Lymphocyte Distribution Predict Overall Survival and Response to Immunotherapy in Non-Small Cell Lung Cancer. Cancer Immunol. Res. 2020, 8, 108–119. [Google Scholar] [CrossRef] [PubMed]
- Fave, X.; Zhang, L.; Yang, J.; Mackin, D.; Balter, P.; Gomez, D.; Followill, D.; Jones, A.K.; Stingo, F.; Liao, Z.; et al. Delta-Radiomics Features for the Prediction of Patient Outcomes in Non-Small Cell Lung Cancer. Sci. Rep. 2017, 7, 588. [Google Scholar] [CrossRef]
- Seymour, L.; Bogaerts, J.; Perrone, A.; Ford, R.; Schwartz, L.H.; Mandrekar, S.; Lin, N.U.; Litière, S.; Dancey, J.; Chen, A.; et al. IRECIST: Guidelines for Response Criteria for Use in Trials Testing Immunotherapeutics. Lancet Oncol. 2017, 18, e143–e152. [Google Scholar] [CrossRef] [Green Version]
- Tazdait, M.; Mezquita, L.; Lahmar, J.; Ferrara, R.; Bidault, F.; Ammari, S.; Balleyguier, C.; Planchard, D.; Gazzah, A.; Soria, J.C.; et al. Patterns of Responses in Metastatic NSCLC during PD-1 or PDL-1 Inhibitor Therapy: Comparison of RECIST 1.1, IrRECIST and IRECIST Criteria. Eur. J. Cancer 2018, 88, 38–47. [Google Scholar] [CrossRef]
- Flavell, R.R.; Evans, M.J.; Villanueva-Meyer, J.E.; Yom, S.S. Understanding Response to Immunotherapy Using Standard of Care and Experimental Imaging Approaches. Int. J. Radiat. Oncol. Biol. Phys. 2020, 108, 242–257. [Google Scholar] [CrossRef]
- Ribas, A.; Chmielowski, B.; Glaspy, J.A. Do We Need a Different Set of Response Assessment Criteria for Tumor Immunotherapy? Clin. Cancer Res. 2009, 15, 7116–7118. [Google Scholar] [CrossRef] [PubMed] [Green Version]
- Fedorov, A.; Beichel, R.; Kalpathy-Cramer, J.; Finet, J.; Fillion-Robin, J.-C.; Pujol, S.; Bauer, C.; Jennings, D.; Fennessy, F.; Sonka, M.; et al. 3D Slicer as an Image Computing Platform for the Quantitative Imaging Network. Magn. Reson. Imaging 2012, 30, 1323–1341. [Google Scholar] [CrossRef] [PubMed] [Green Version]
- van Griethuysen, J.J.M.; Fedorov, A.; Parmar, C.; Hosny, A.; Aucoin, N.; Narayan, V.; Beets-Tan, R.G.H.; Fillion-Robin, J.-C.; Pieper, S.; Aerts, H.J.W.L. Computational Radiomics System to Decode the Radiographic Phenotype. Cancer Res. 2017, 77, e104–e107. [Google Scholar] [CrossRef] [PubMed] [Green Version]
- Kim, H.-Y. Analysis of Variance (ANOVA) Comparing Means of More than Two Groups. Restor. Dent. Endod. 2014, 39, 74–77. [Google Scholar] [CrossRef] [Green Version]
- Vargha, A.; Delaney, H.D. The Kruskal-Wallis Test and Stochastic Homogeneity. J. Educ. Behav. Stat. 1998, 23, 170–192. [Google Scholar] [CrossRef]
- Doroshow, D.B.; Sanmamed, M.F.; Hastings, K.; Politi, K.; Rimm, D.L.; Chen, L.; Melero, I.; Schalper, K.A.; Herbst, R.S. Immunotherapy in Non-Small Cell Lung Cancer: Facts and Hopes. Clin. Cancer Res. 2019, 25, 4592–4602. [Google Scholar] [CrossRef] [Green Version]
- Lu, S.; Stein, J.E.; Rimm, D.L.; Wang, D.W.; Bell, J.M.; Johnson, D.B.; Sosman, J.A.; Schalper, K.A.; Anders, R.A.; Wang, H.; et al. Comparison of Biomarker Modalities for Predicting Response to PD-1/PD-L1 Checkpoint Blockade: A Systematic Review and Meta-Analysis. JAMA Oncol. 2019, 5, 1195–1204. [Google Scholar] [CrossRef]
- Testa, U.; Castelli, G.; Pelosi, E. Lung Cancers: Molecular Characterization, Clonal Heterogeneity and Evolution, and Cancer Stem Cells. Cancers 2018, 10, 248. [Google Scholar] [CrossRef] [Green Version]
- Plautz, T.E.; Zheng, C.; Noid, G.; Li, X.A. Time Stability of Delta-Radiomics Features and the Impact on Patient Analysis in Longitudinal CT Images. Med. Phys. 2019, 46, 1663–1676. [Google Scholar] [CrossRef]
- Nardone, V.; Reginelli, A.; Guida, C.; Belfiore, M.P.; Biondi, M.; Mormile, M.; Banci Buonamici, F.; Di Giorgio, E.; Spadafora, M.; Tini, P.; et al. Delta-Radiomics Increases Multicentre Reproducibility: A Phantom Study. Med. Oncol. 2020, 37, 38. [Google Scholar] [CrossRef] [PubMed]
- Dercle, L.; Fronheiser, M.; Lu, L.; Du, S.; Hayes, W.; Leung, D.K.; Roy, A.; Wilkerson, J.; Guo, P.; Fojo, A.T.; et al. Identification of Non-Small Cell Lung Cancer Sensitive to Systemic Cancer Therapies Using Radiomics. Clin. Cancer Res. 2020, 26, 2151–2162. [Google Scholar] [CrossRef] [PubMed] [Green Version]
- Liu, Y.; Wu, M.; Zhang, Y.; Luo, Y.; He, S.; Wang, Y.; Chen, F.; Liu, Y.; Yang, Q.; Li, Y.; et al. Imaging Biomarkers to Predict and Evaluate the Effectiveness of Immunotherapy in Advanced Non-Small-Cell Lung Cancer. Front. Oncol. 2021, 11, 657615. [Google Scholar] [CrossRef] [PubMed]
- Miar, A.; Arnaiz, E.; Bridges, E.; Beedie, S.; Cribbs, A.P.; Downes, D.J.; Beagrie, R.A.; Rehwinkel, J.; Harris, A.L. Hypoxia Induces Transcriptional and Translational Downregulation of the Type I IFN Pathway in Multiple Cancer Cell Types. Cancer Res. 2020, 80, 5245–5256. [Google Scholar] [CrossRef]
- Selnø, A.T.H.; Schlichtner, S.; Yasinska, I.M.; Sakhnevych, S.S.; Fiedler, W.; Wellbrock, J.; Klenova, E.; Pavlova, L.; Gibbs, B.F.; Degen, M.; et al. Transforming Growth Factor Beta Type 1 (TGF-β) and Hypoxia-Inducible Factor 1 (HIF-1) Transcription Complex as Master Regulators of the Immunosuppressive Protein Galectin-9 Expression in Human Cancer and Embryonic Cells. Aging (Albany N. Y.) 2020, 12, 23478–23496. [Google Scholar] [CrossRef]


| Relative Variation | |||||
|---|---|---|---|---|---|
| Radiomic Features | Response | ||||
| Class | Name | PR | SD | PD | p-Value |
| firstorder | Median | 0.07389 | 0.04288 | −0.2143 | 0.0072 |
| Energy | 0.7002 | −0.02225 | −0.3811 | 0.0071 | |
| TotalEnergy | 0.8288 | −0.1987 | −0.4173 | 0.0038 | |
| 90Percentile | 0.1130 | 0.0006320 | −0.07377 | 0.02 | |
| gldm | DependenceNonUniformity | 0.6793 | −0.08826 | −0.2910 | 0.0034 |
| GrayLevelNonUniformity | 0.7474 | −0.1150 | −0.2443 | 0.0109 | |
| SmallDependenceEmphasis | −0.2645 | 0.1324 | 0.1725 | 0.0165 | |
| glcm | Contrast | −0.2338 | 0.07732 | 0.3687 | 0.0166 |
| DifferenceEntropy | −0.08534 | 0.01756 | 0.04661 | 0.0242 | |
| DifferenceVariance | −0.2241 | 0.04970 | 0.3384 | 0.006 | |
| DifferenceAverage | −0.1293 | 0.04207 | 0.07722 | 0.0284 | |
| glrlm | RunVariance | 0.1638 | −0.05781 | −0.1424 | 0.0419 |
| GrayLevelNonUniformity | 0.8304 | −0.09103 | −0.2589 | 0.0107 | |
| LongRunEmphasis | 0.1187 | −0.05526 | −0.08364 | 0.0185 | |
| RunLengthNonUniformity | 0.5123 | −0.1132 | −0.3272 | 0.0036 | |
| ShortRunEmphasis | −0.03467 | 0.01885 | 0.01652 | 0.0199 | |
| RunPercentage | −0.04131 | 0.02180 | 0.02883 | 0.0329 | |
| RunLengthNonUniformityNormalized | −0.06849 | 0.04196 | 0.03199 | 0.0414 | |
| glszm | ZoneVariance | 1.531 | −0.2942 | −0.5456 | 0.01 |
| GrayLevelNonUniformity | 0.1498 | −0.02237 | −0.2220 | 0.0147 | |
| LargeAreaEmphasis | 1.530 | −0.3100 | −0.5455 | 0.011 | |
| ZonePercentage | −0.3220 | 0.1571 | 0.2031 | 0.0188 | |
| LargeAreaLowGrayLevelEmphasis | 2.474 | −0.1821 | −0.6068 | 0.016 | |
| LargeAreaHighGrayLevelEmphasis | 2.114 | −0.1915 | −0.2531 | 0.0295 | |
| ngtdm | Coarseness | −0.4023 | 0.06068 | 0.2851 | 0.0062 |
| Strength | −0.4111 | 0.3760 | 0.6139 | 0.0259 | |
| Busyness | 0.8051 | −0.1563 | −0.3590 | 0.0205 | |
| Relative Variation | ||||
|---|---|---|---|---|
| Radiomic Features | Response | |||
| Class | Name | PD | pPD | p-Value |
| gldm | DependenceEntropy | 0.001323 | −0.05896 | 0.0072 |
| LowGrayLevelEmphasis | −0.03248 | 1.224 | 0.0036 | |
| glcm | Idmn | −0.0008908 | −0.01153 | 0.05 |
| Idn | 0.0002237 | −0.02028 | 0.0357 | |
| glrlm | ShortRunLowGrayLevelEmphasis | −0.02426 | 1.454 | 0.0036 |
| LowGrayLevelRunEmphasis | −0.05360 | 1.352 | 0.0071 | |
| RunLengthNonUniformity | −0.3272 | −0.7698 | 0.0328 | |
| glszm | GrayLevelNonUniformity | −0.2220 | −0.7201 | 0.0346 |
| LowGrayLevelZoneEmphasis | 0.03821 | 2.818 | 0.0199 | |
Publisher’s Note: MDPI stays neutral with regard to jurisdictional claims in published maps and institutional affiliations. |
© 2022 by the authors. Licensee MDPI, Basel, Switzerland. This article is an open access article distributed under the terms and conditions of the Creative Commons Attribution (CC BY) license (https://creativecommons.org/licenses/by/4.0/).
Share and Cite
Barabino, E.; Rossi, G.; Pamparino, S.; Fiannacca, M.; Caprioli, S.; Fedeli, A.; Zullo, L.; Vagge, S.; Cittadini, G.; Genova, C. Exploring Response to Immunotherapy in Non-Small Cell Lung Cancer Using Delta-Radiomics. Cancers 2022, 14, 350. https://doi.org/10.3390/cancers14020350
Barabino E, Rossi G, Pamparino S, Fiannacca M, Caprioli S, Fedeli A, Zullo L, Vagge S, Cittadini G, Genova C. Exploring Response to Immunotherapy in Non-Small Cell Lung Cancer Using Delta-Radiomics. Cancers. 2022; 14(2):350. https://doi.org/10.3390/cancers14020350
Chicago/Turabian StyleBarabino, Emanuele, Giovanni Rossi, Silvia Pamparino, Martina Fiannacca, Simone Caprioli, Alessandro Fedeli, Lodovica Zullo, Stefano Vagge, Giuseppe Cittadini, and Carlo Genova. 2022. "Exploring Response to Immunotherapy in Non-Small Cell Lung Cancer Using Delta-Radiomics" Cancers 14, no. 2: 350. https://doi.org/10.3390/cancers14020350
APA StyleBarabino, E., Rossi, G., Pamparino, S., Fiannacca, M., Caprioli, S., Fedeli, A., Zullo, L., Vagge, S., Cittadini, G., & Genova, C. (2022). Exploring Response to Immunotherapy in Non-Small Cell Lung Cancer Using Delta-Radiomics. Cancers, 14(2), 350. https://doi.org/10.3390/cancers14020350