
Attenuation of Muscle Damage, Structural Abnormalities, and Physical Activity in Respiratory and Limb Muscles following Treatment with Rucaparib in Lung Cancer Cachexia Mice


Simple Summary
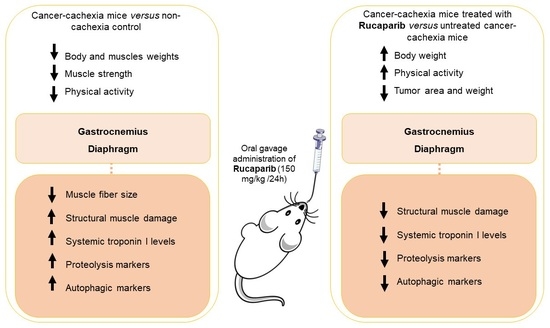
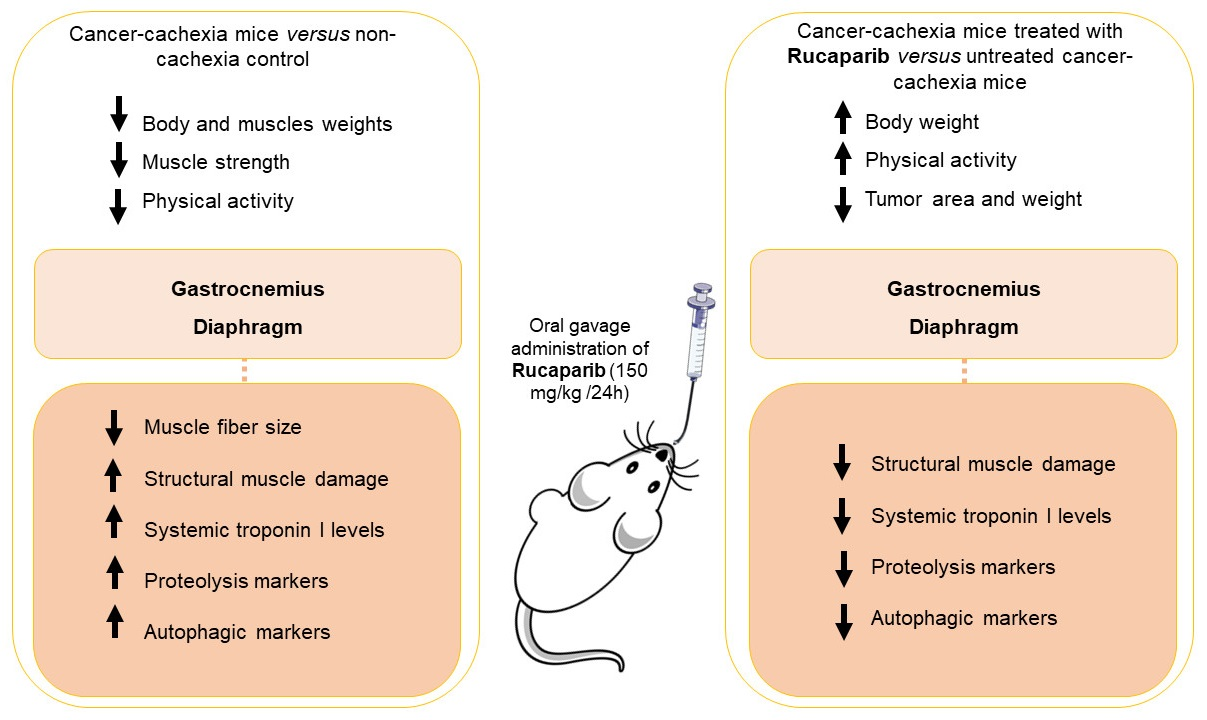
Abstract
1. Introduction
2. Materials and Methods
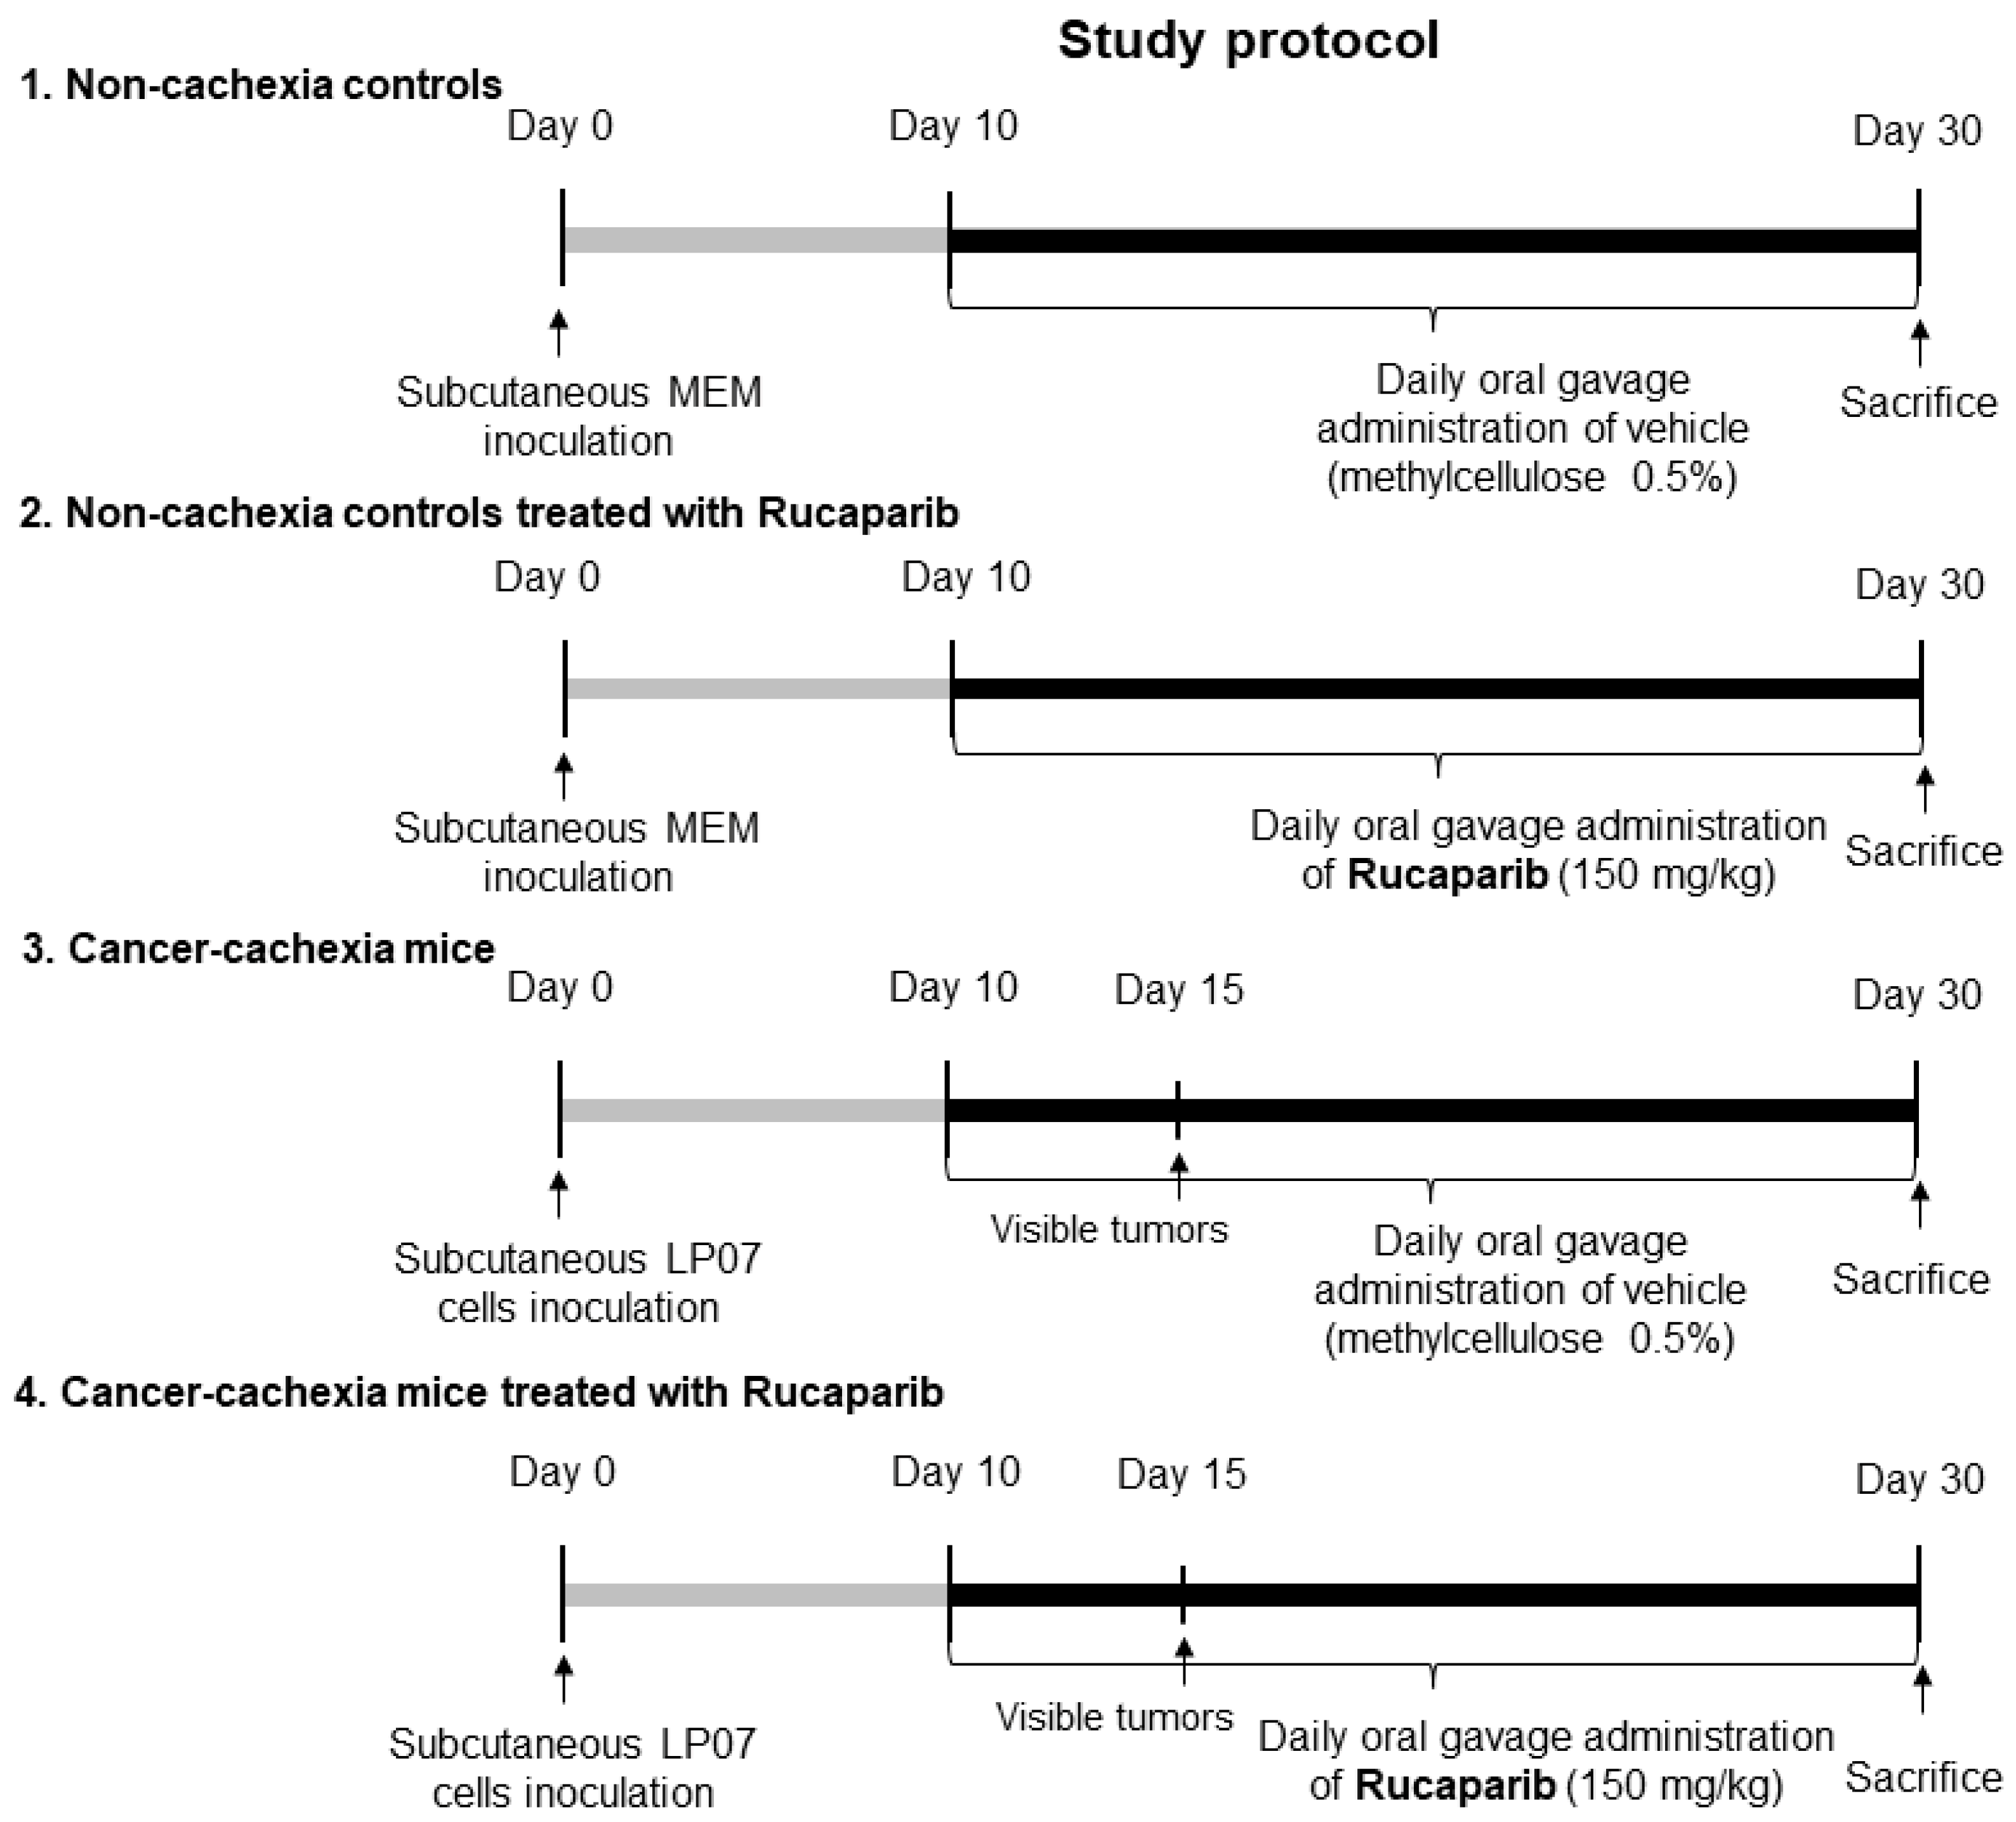
2.1. Experimental Model and Design
2.2. Sacrifice and Sample Collection
2.3. In Vivo Measurements in the Mice
2.4. Biological Analysis
2.4.1. PARP activity
2.4.2. Enzyme-Linked Immunosorbent Assay (ELISA) Plasma Skeletal Muscle Troponin I Levels
2.4.3. Muscle Structure Abnormalities
2.4.4. Muscle Fiber Typing and Morphometry
2.4.5. Immunoblotting
2.5. Statistical Analysis
3. Results
3.1. Rucaparib Influenced Body Weight and Physical Activity in Cancer Cachexia
3.2. Rucaparib Attenuated PARP Activity in Respiratory and Limb Muscles in Cancer Cachexia
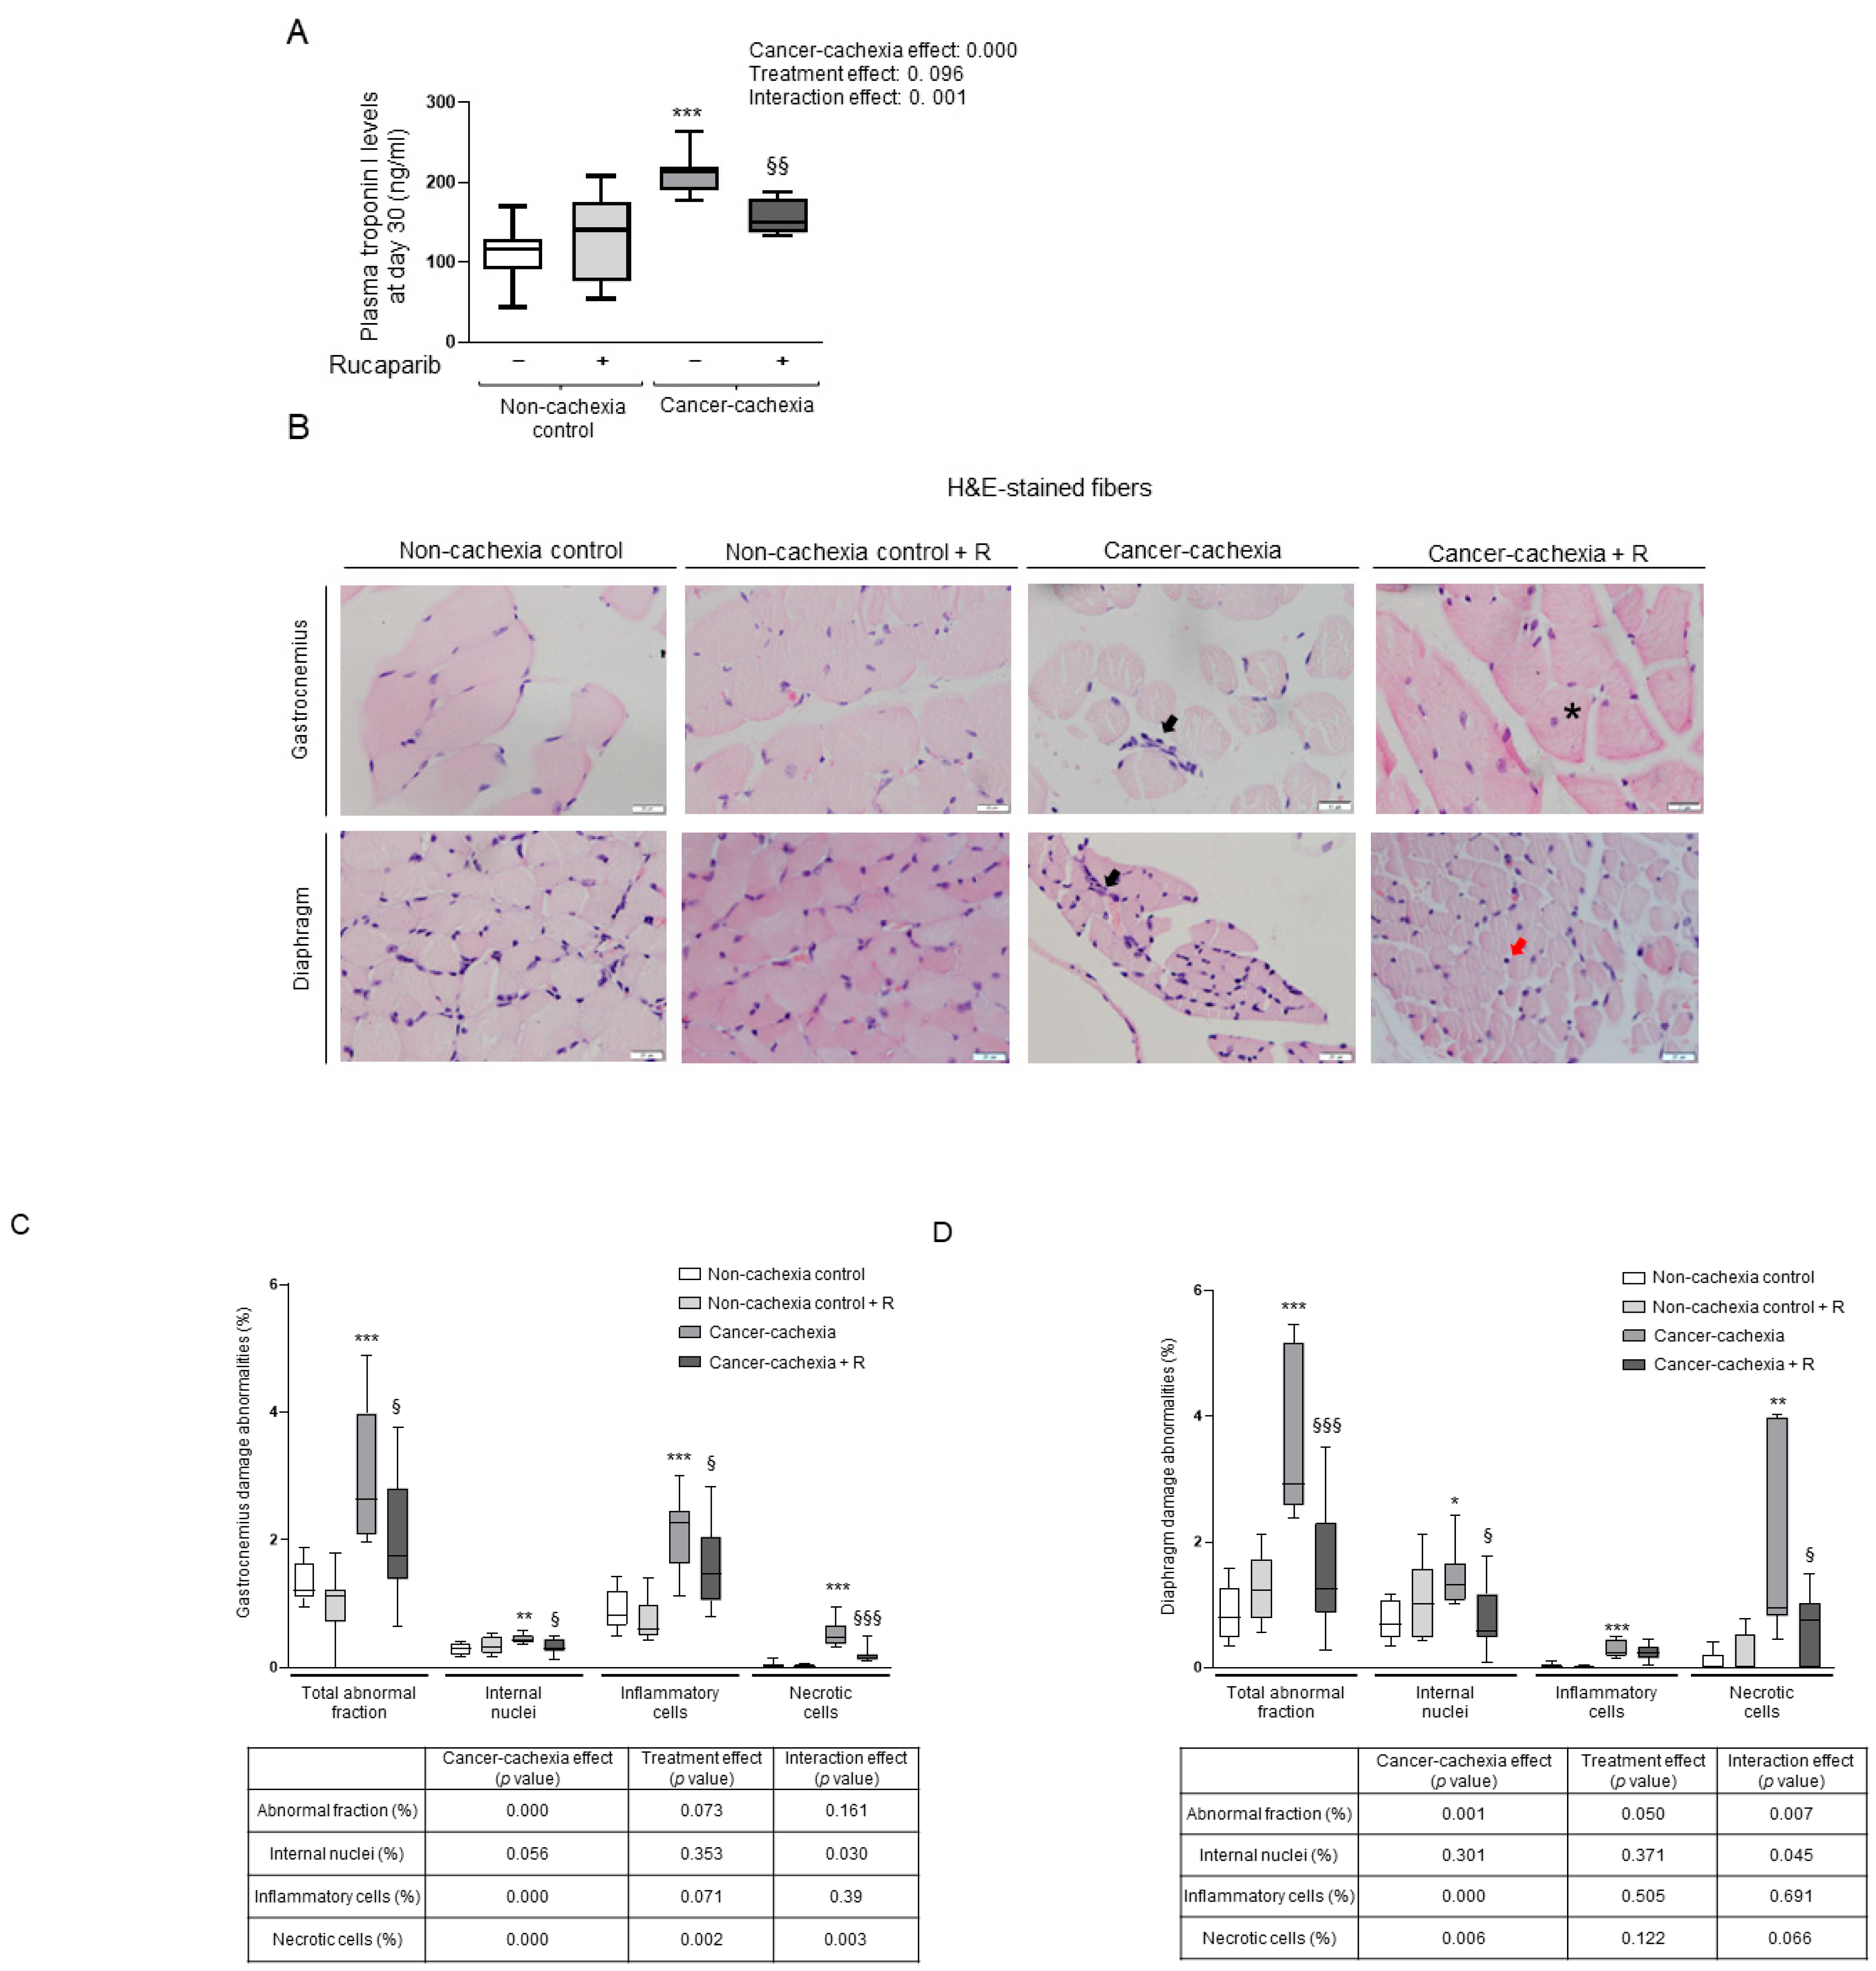
3.3. Effects of Rucaparib on Muscle Damage
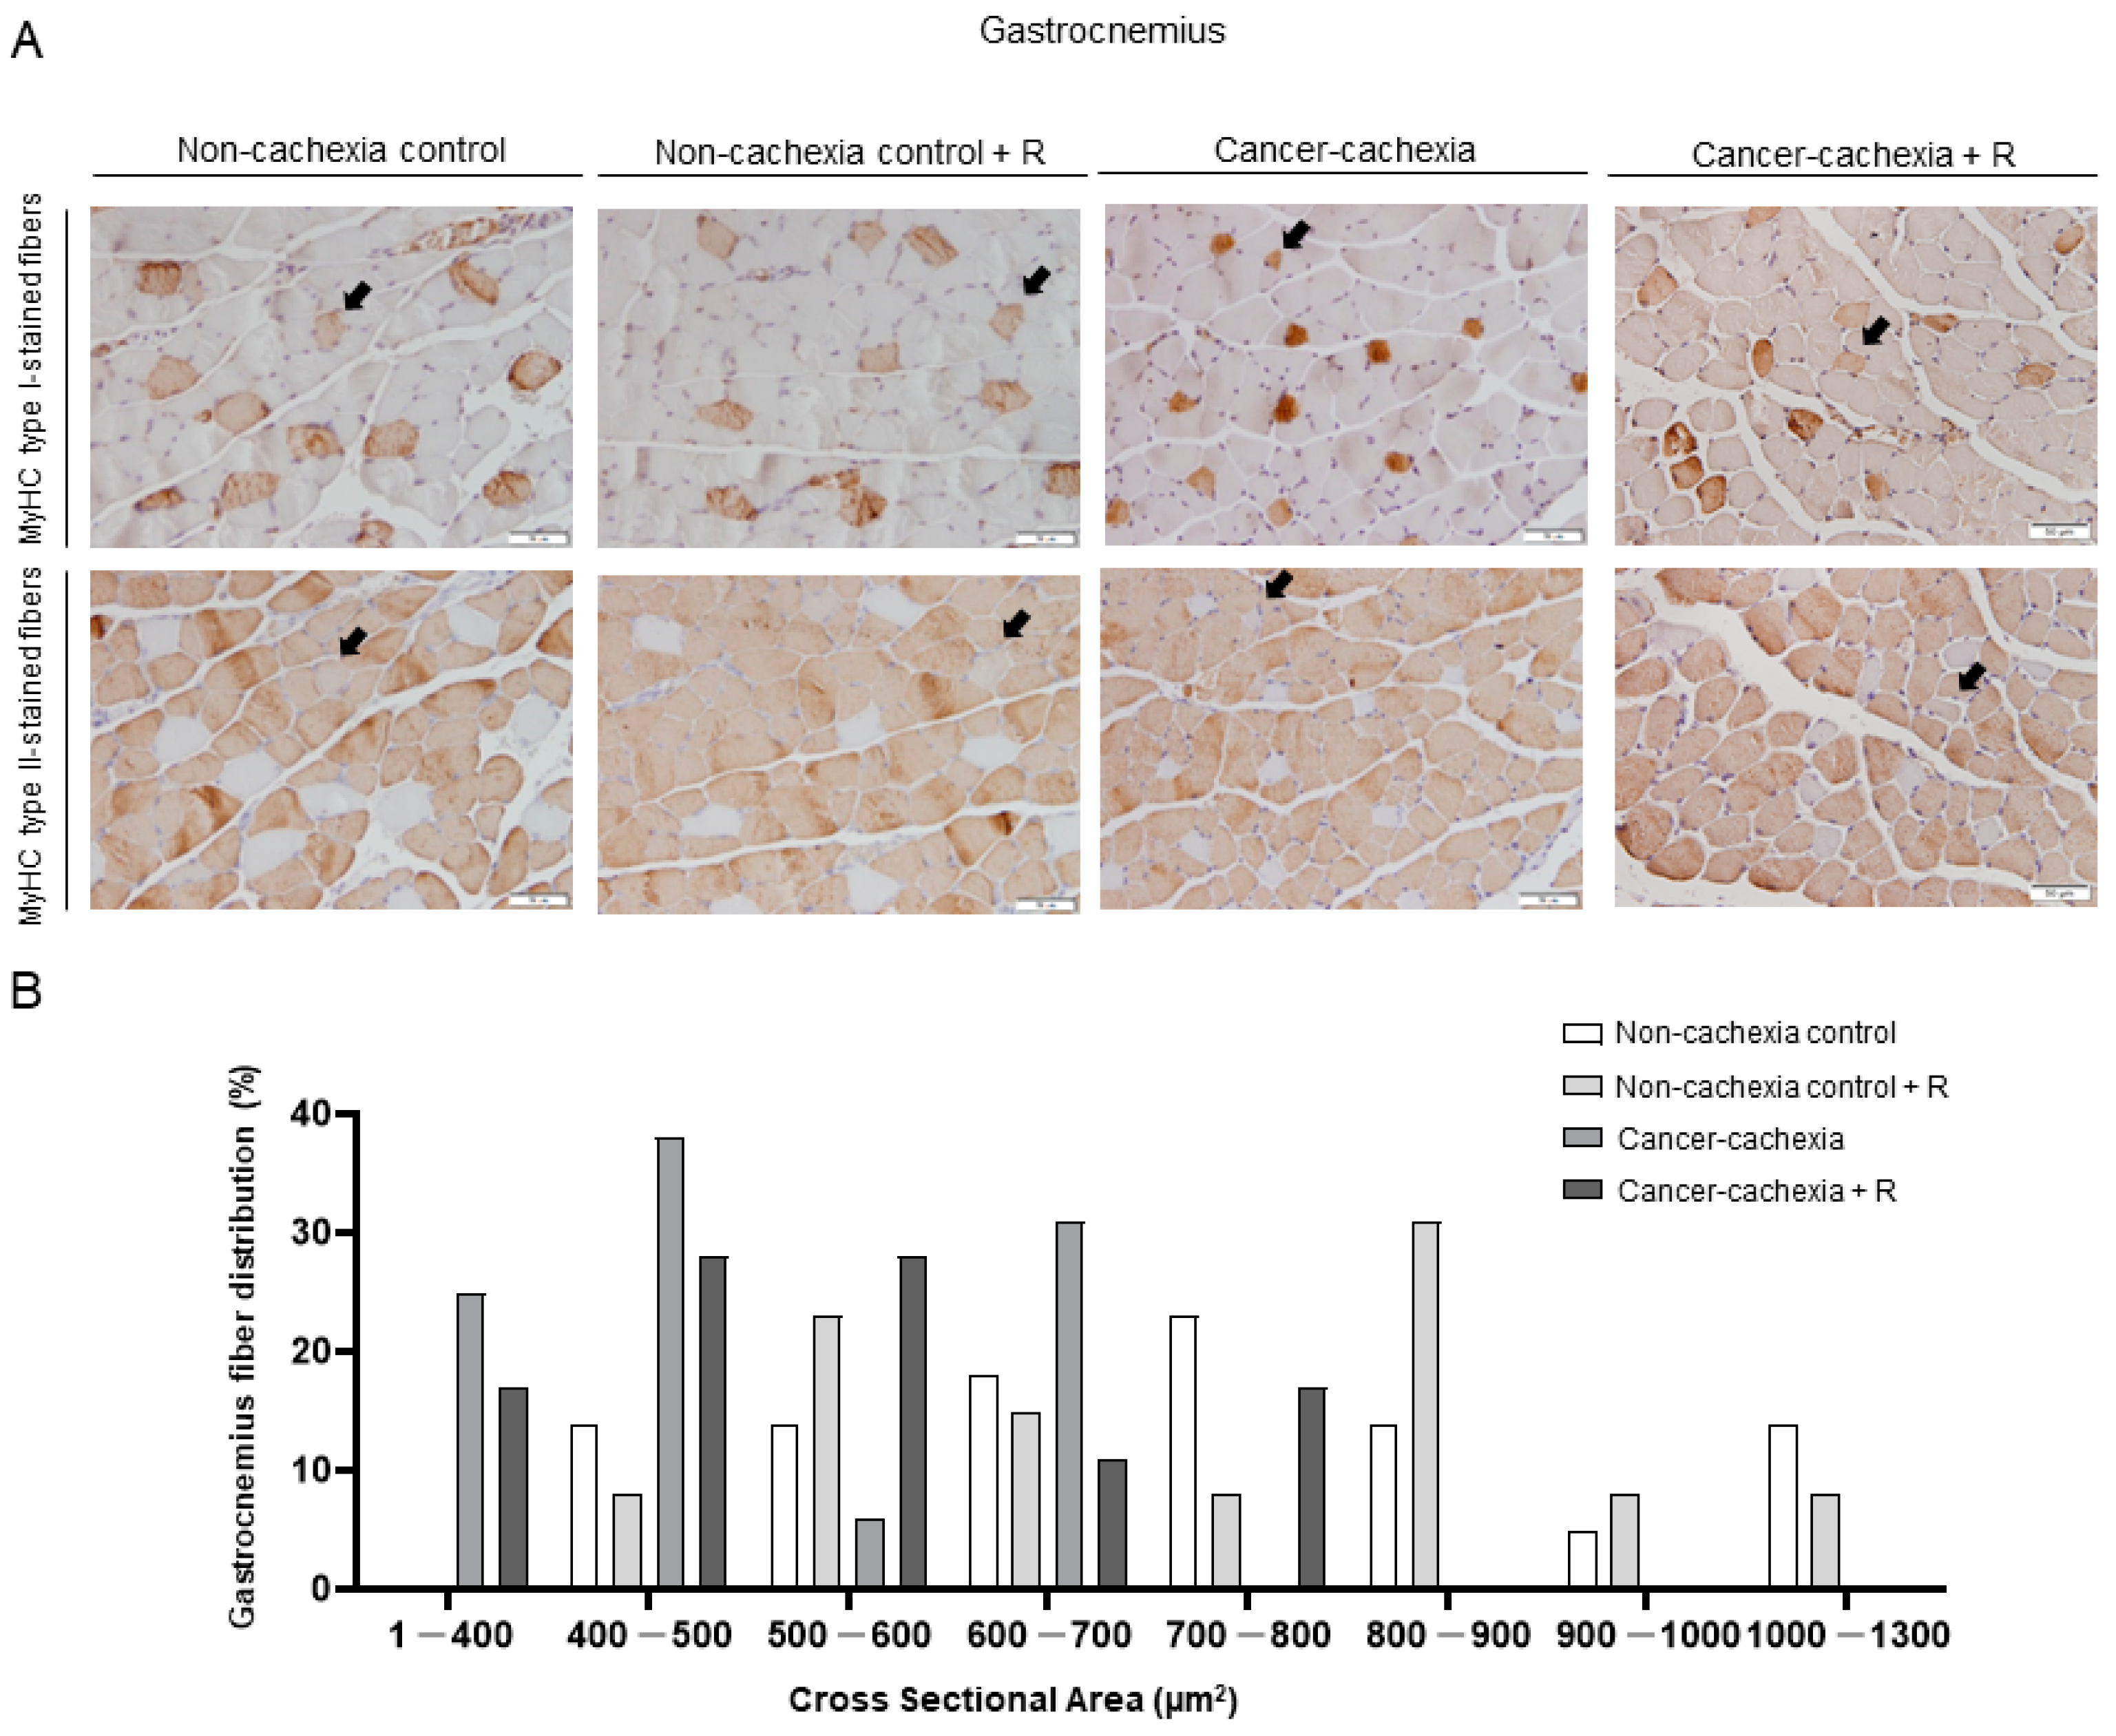
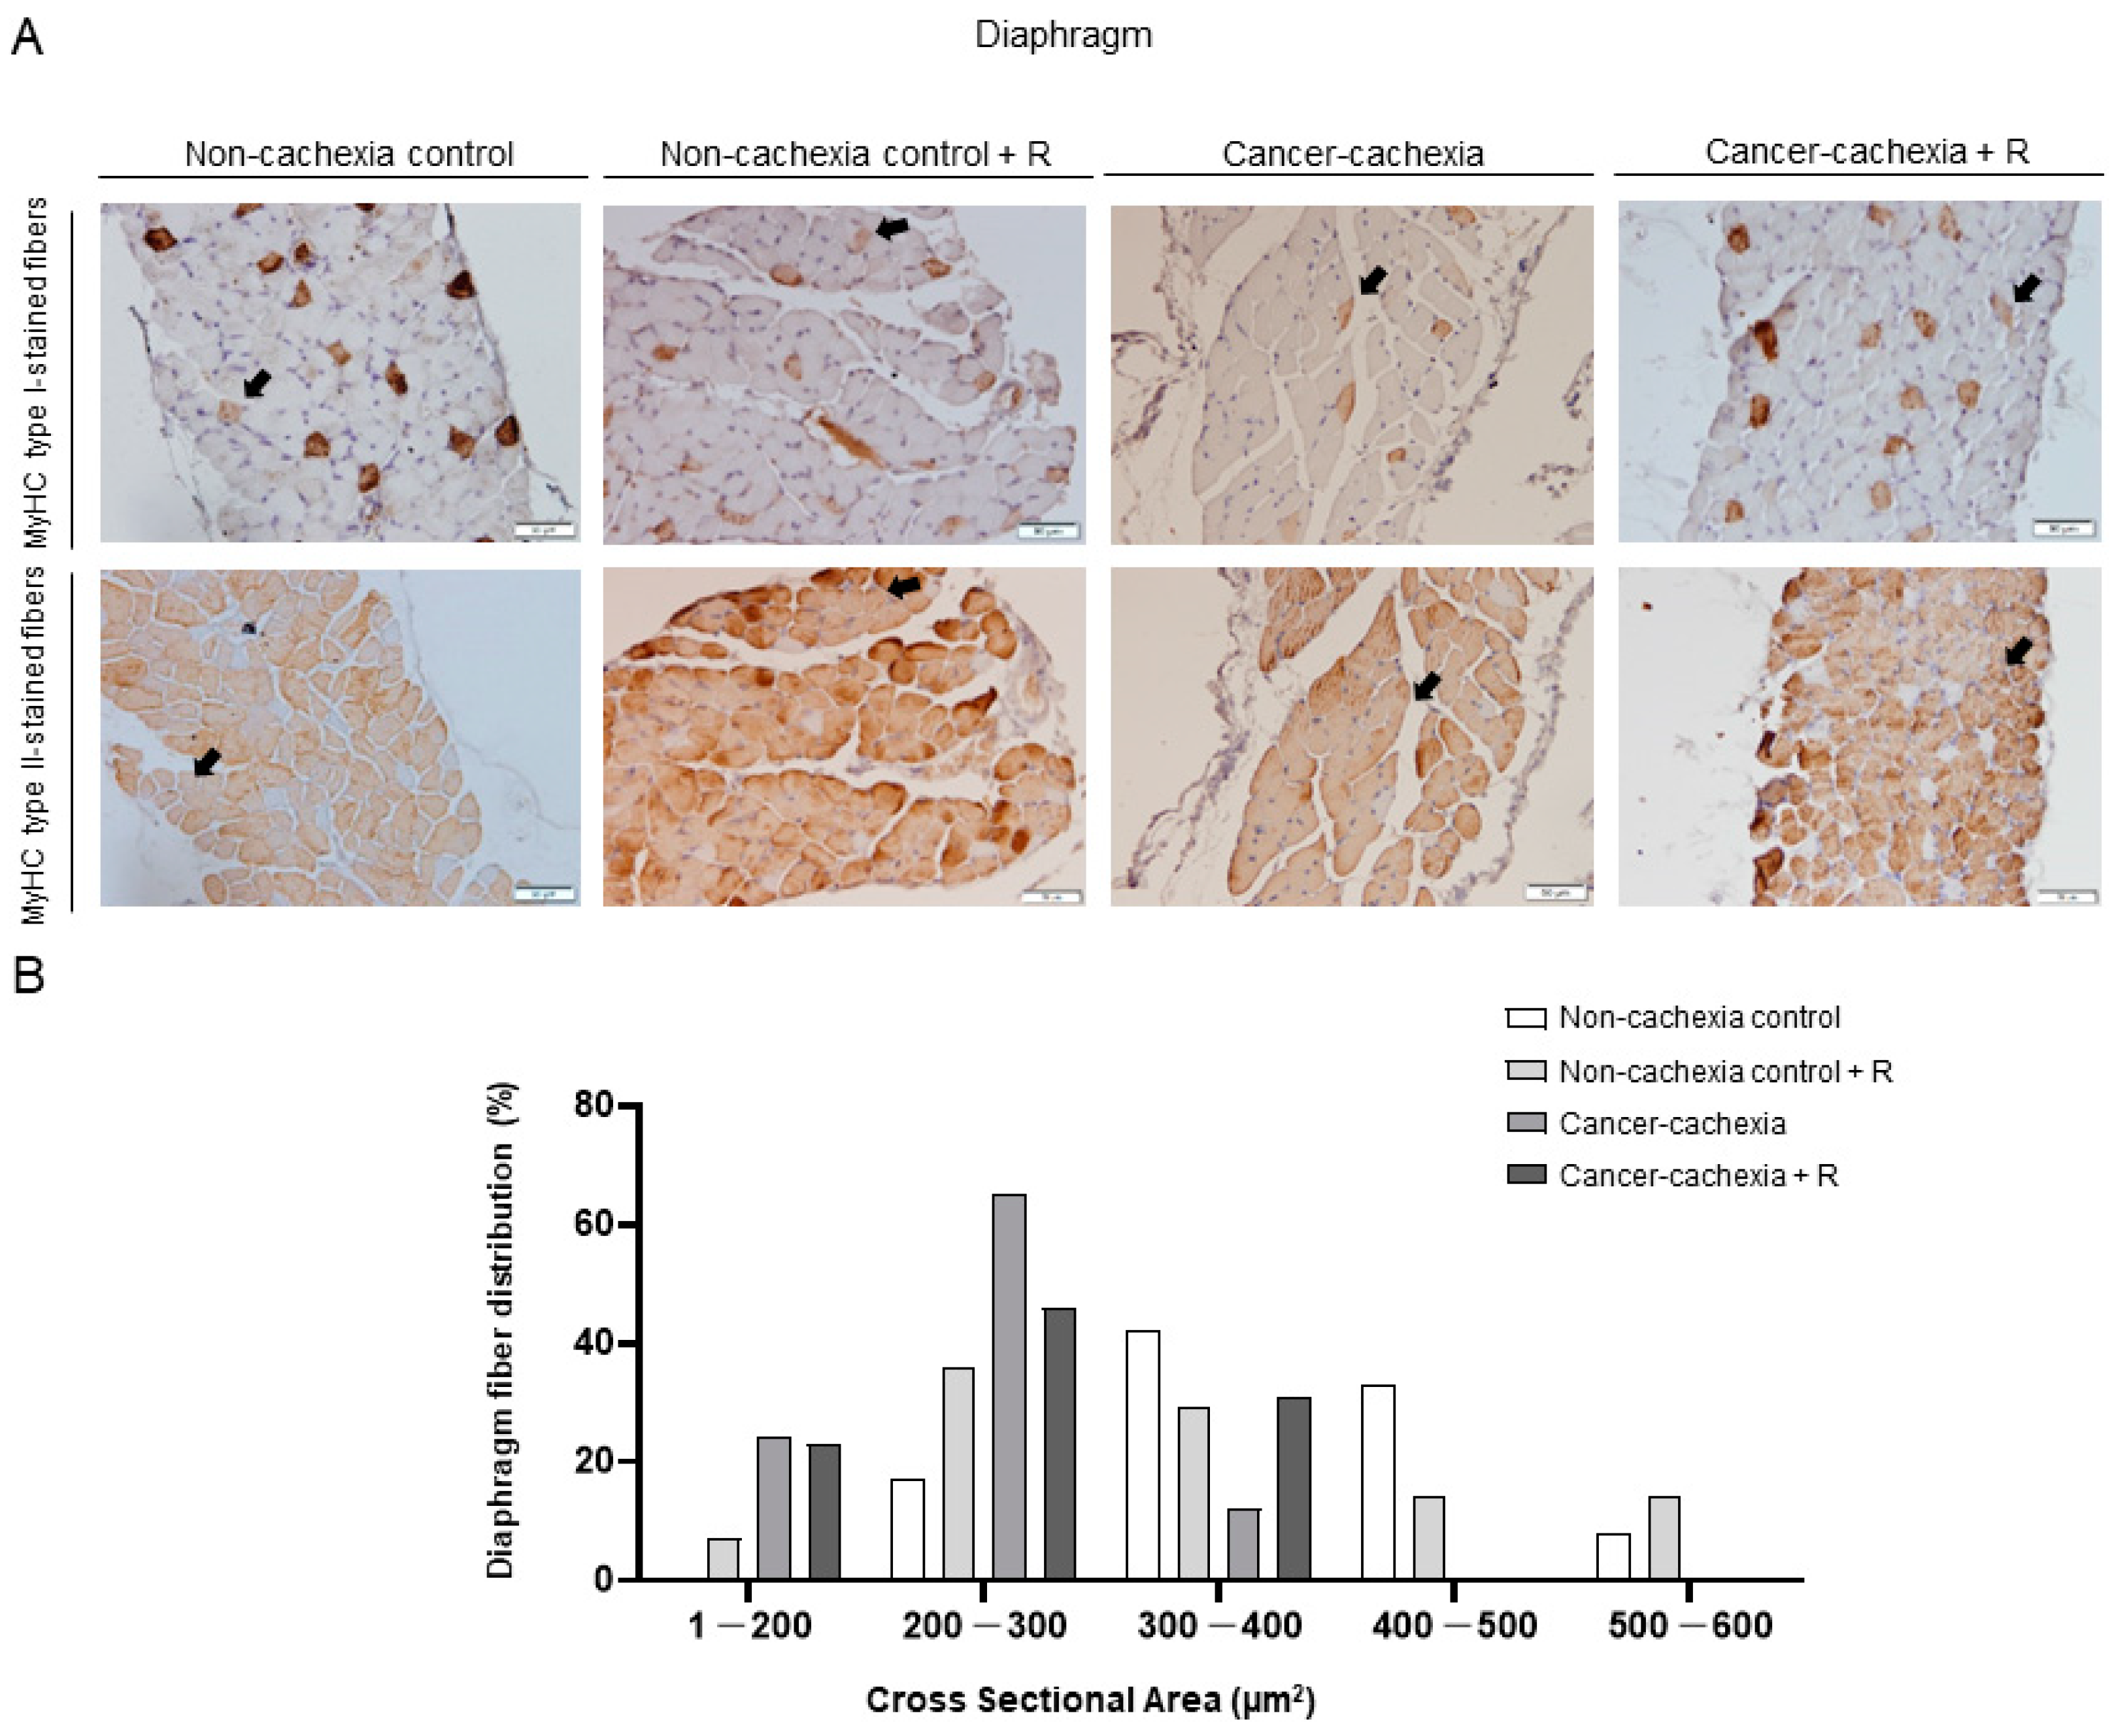
3.4. Muscle Phenotype and Morphometry
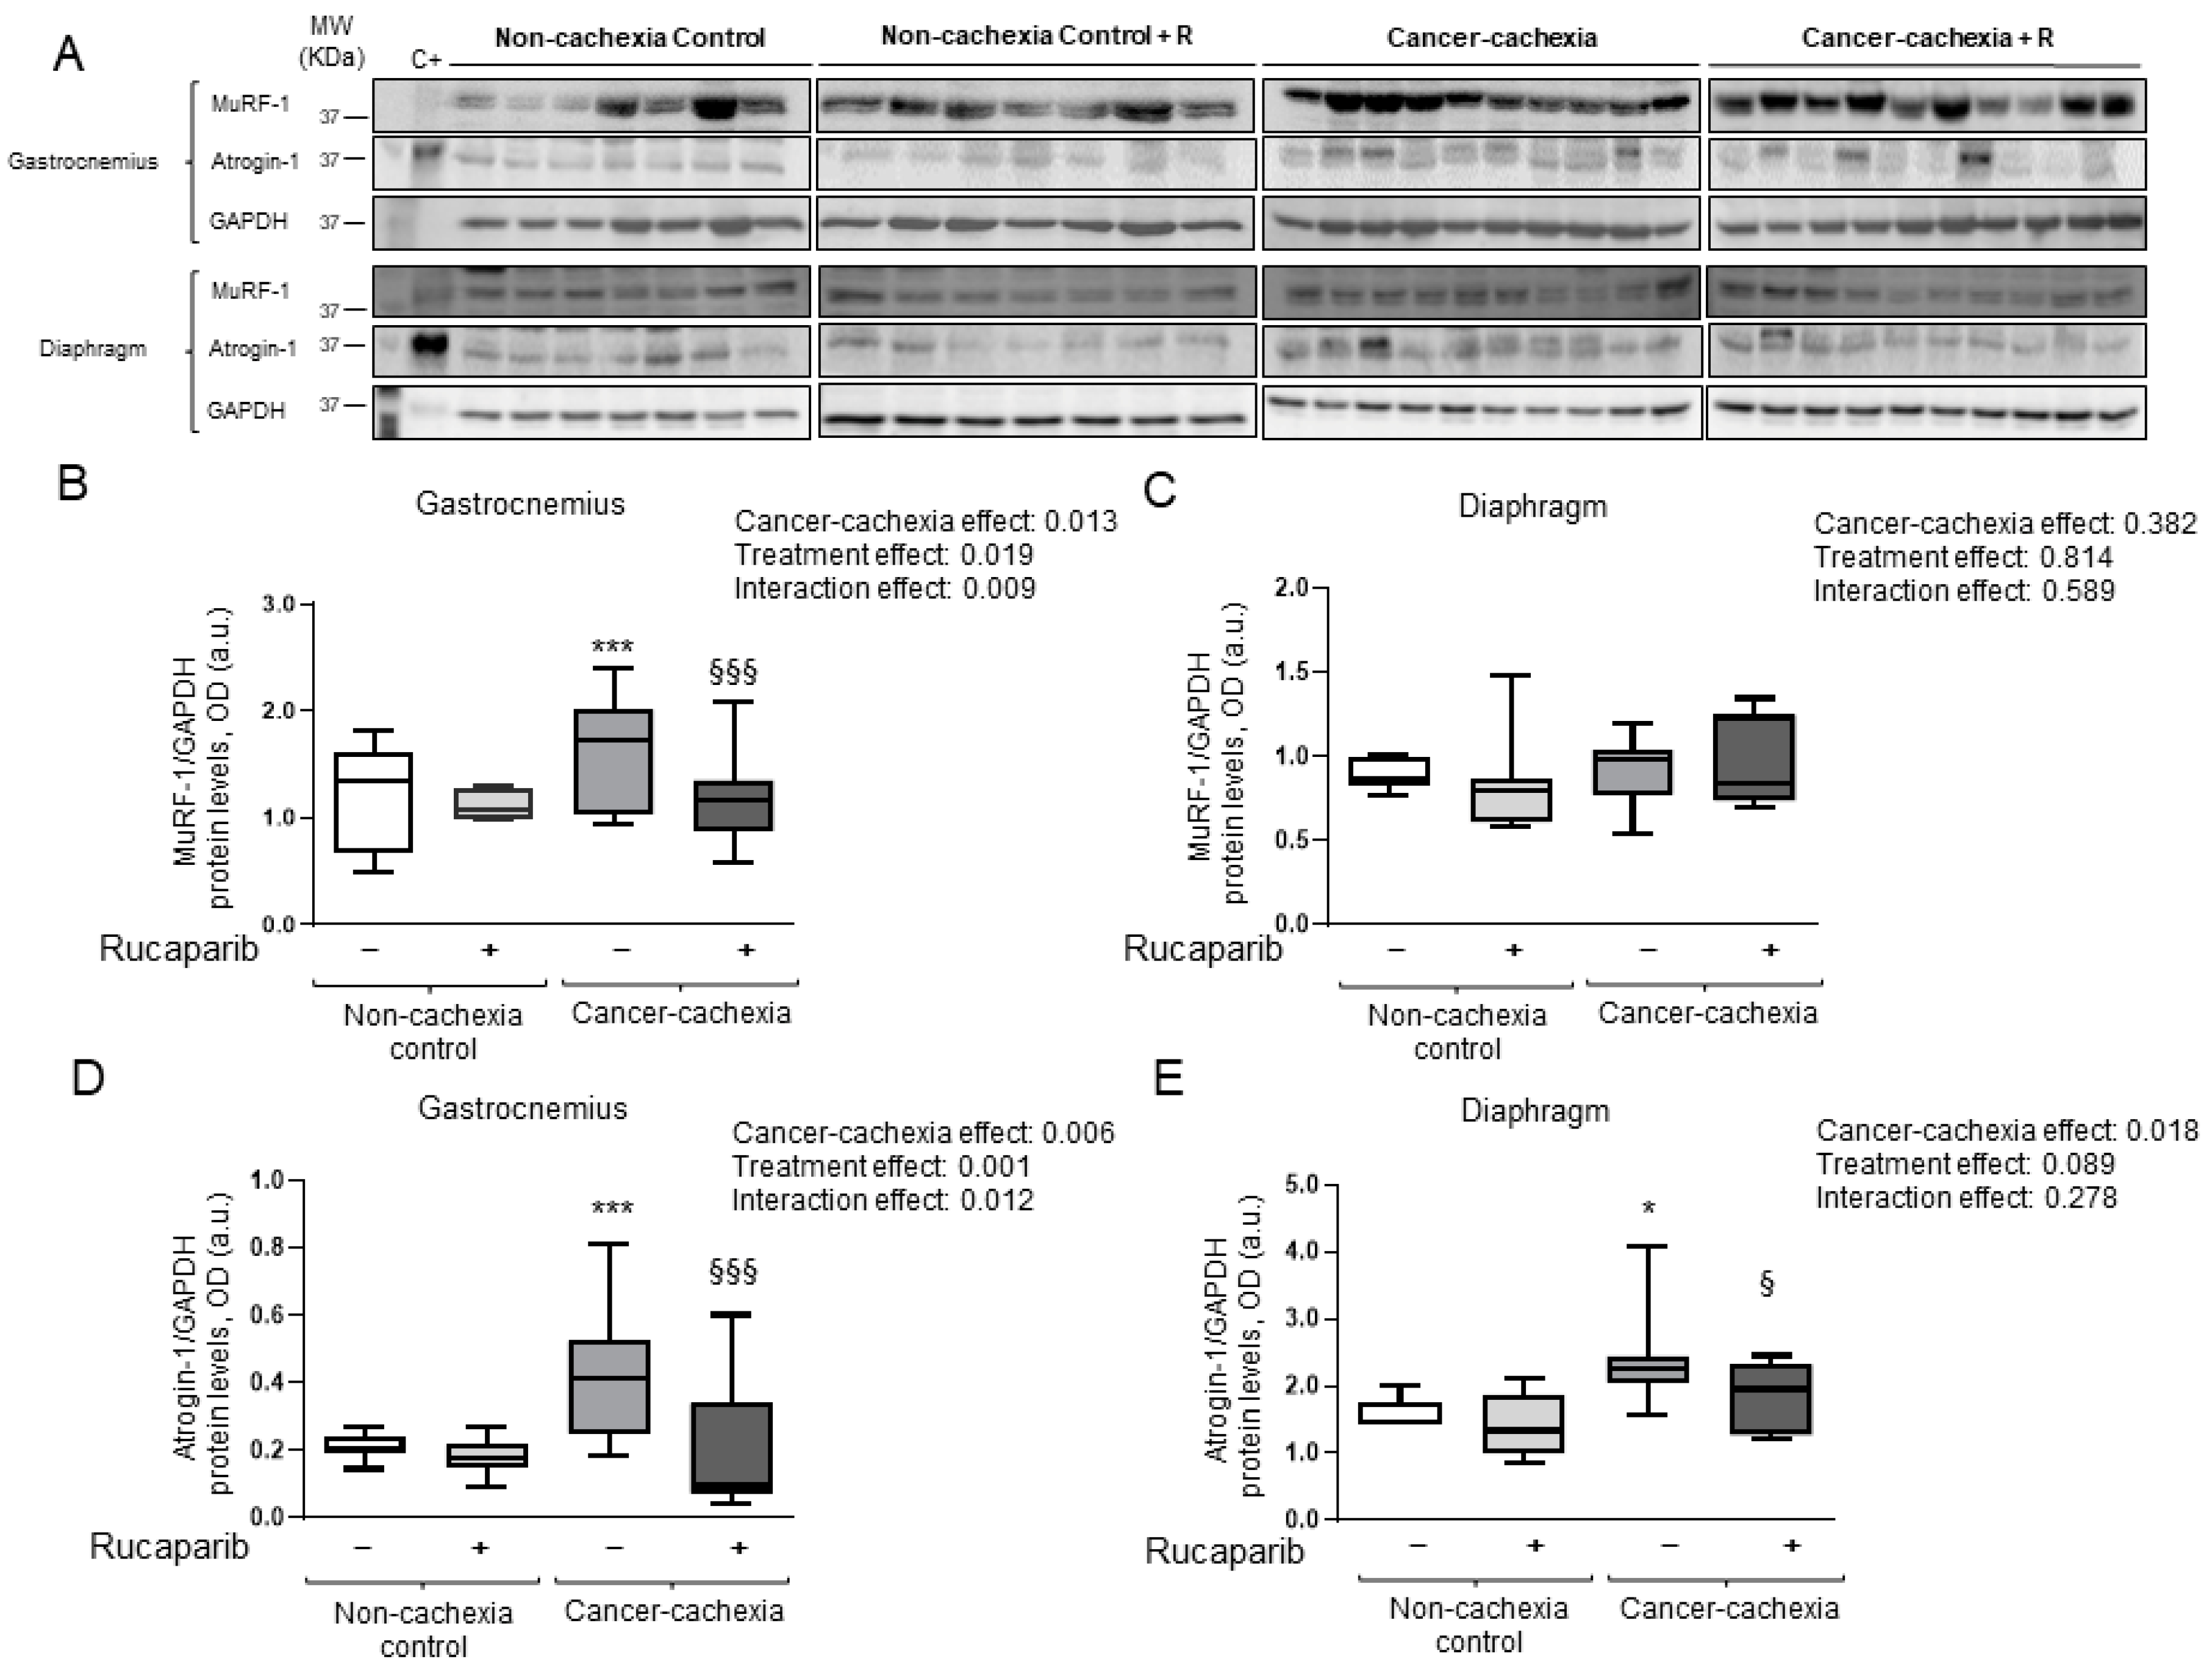
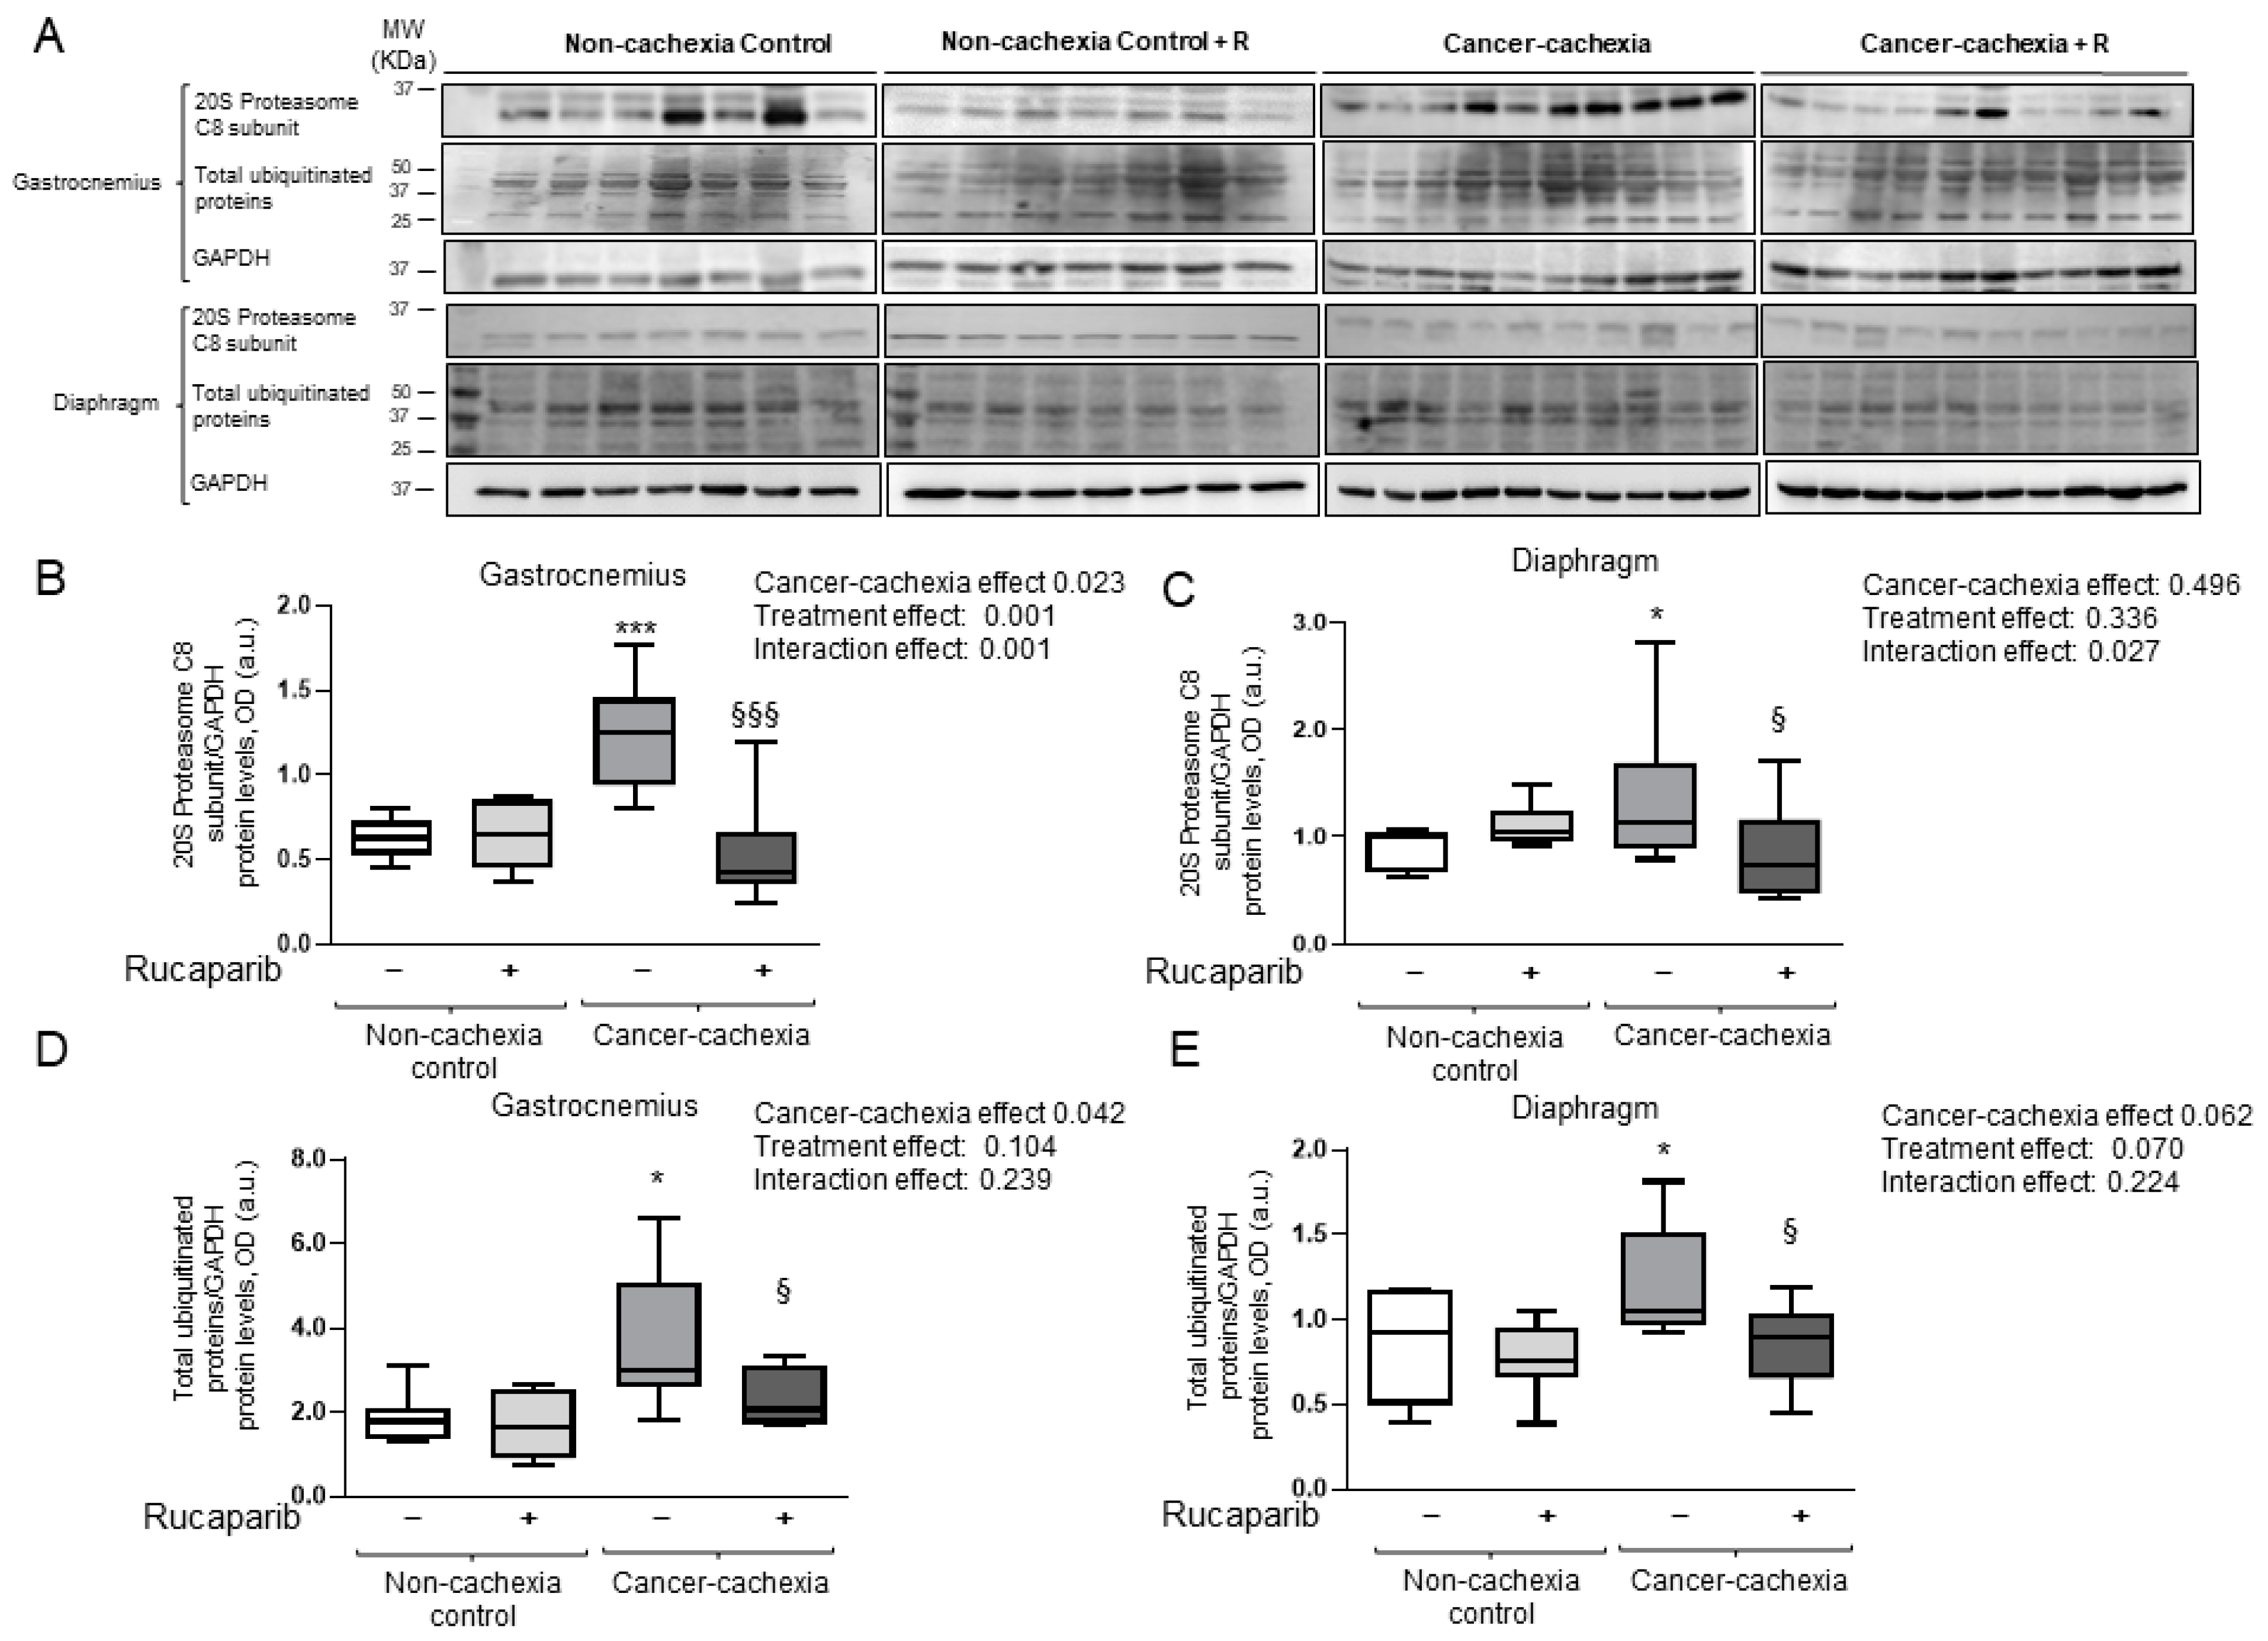
3.5. Rucaparib Attenuated Proteolytic Markers in Cancer Cachexia Mice
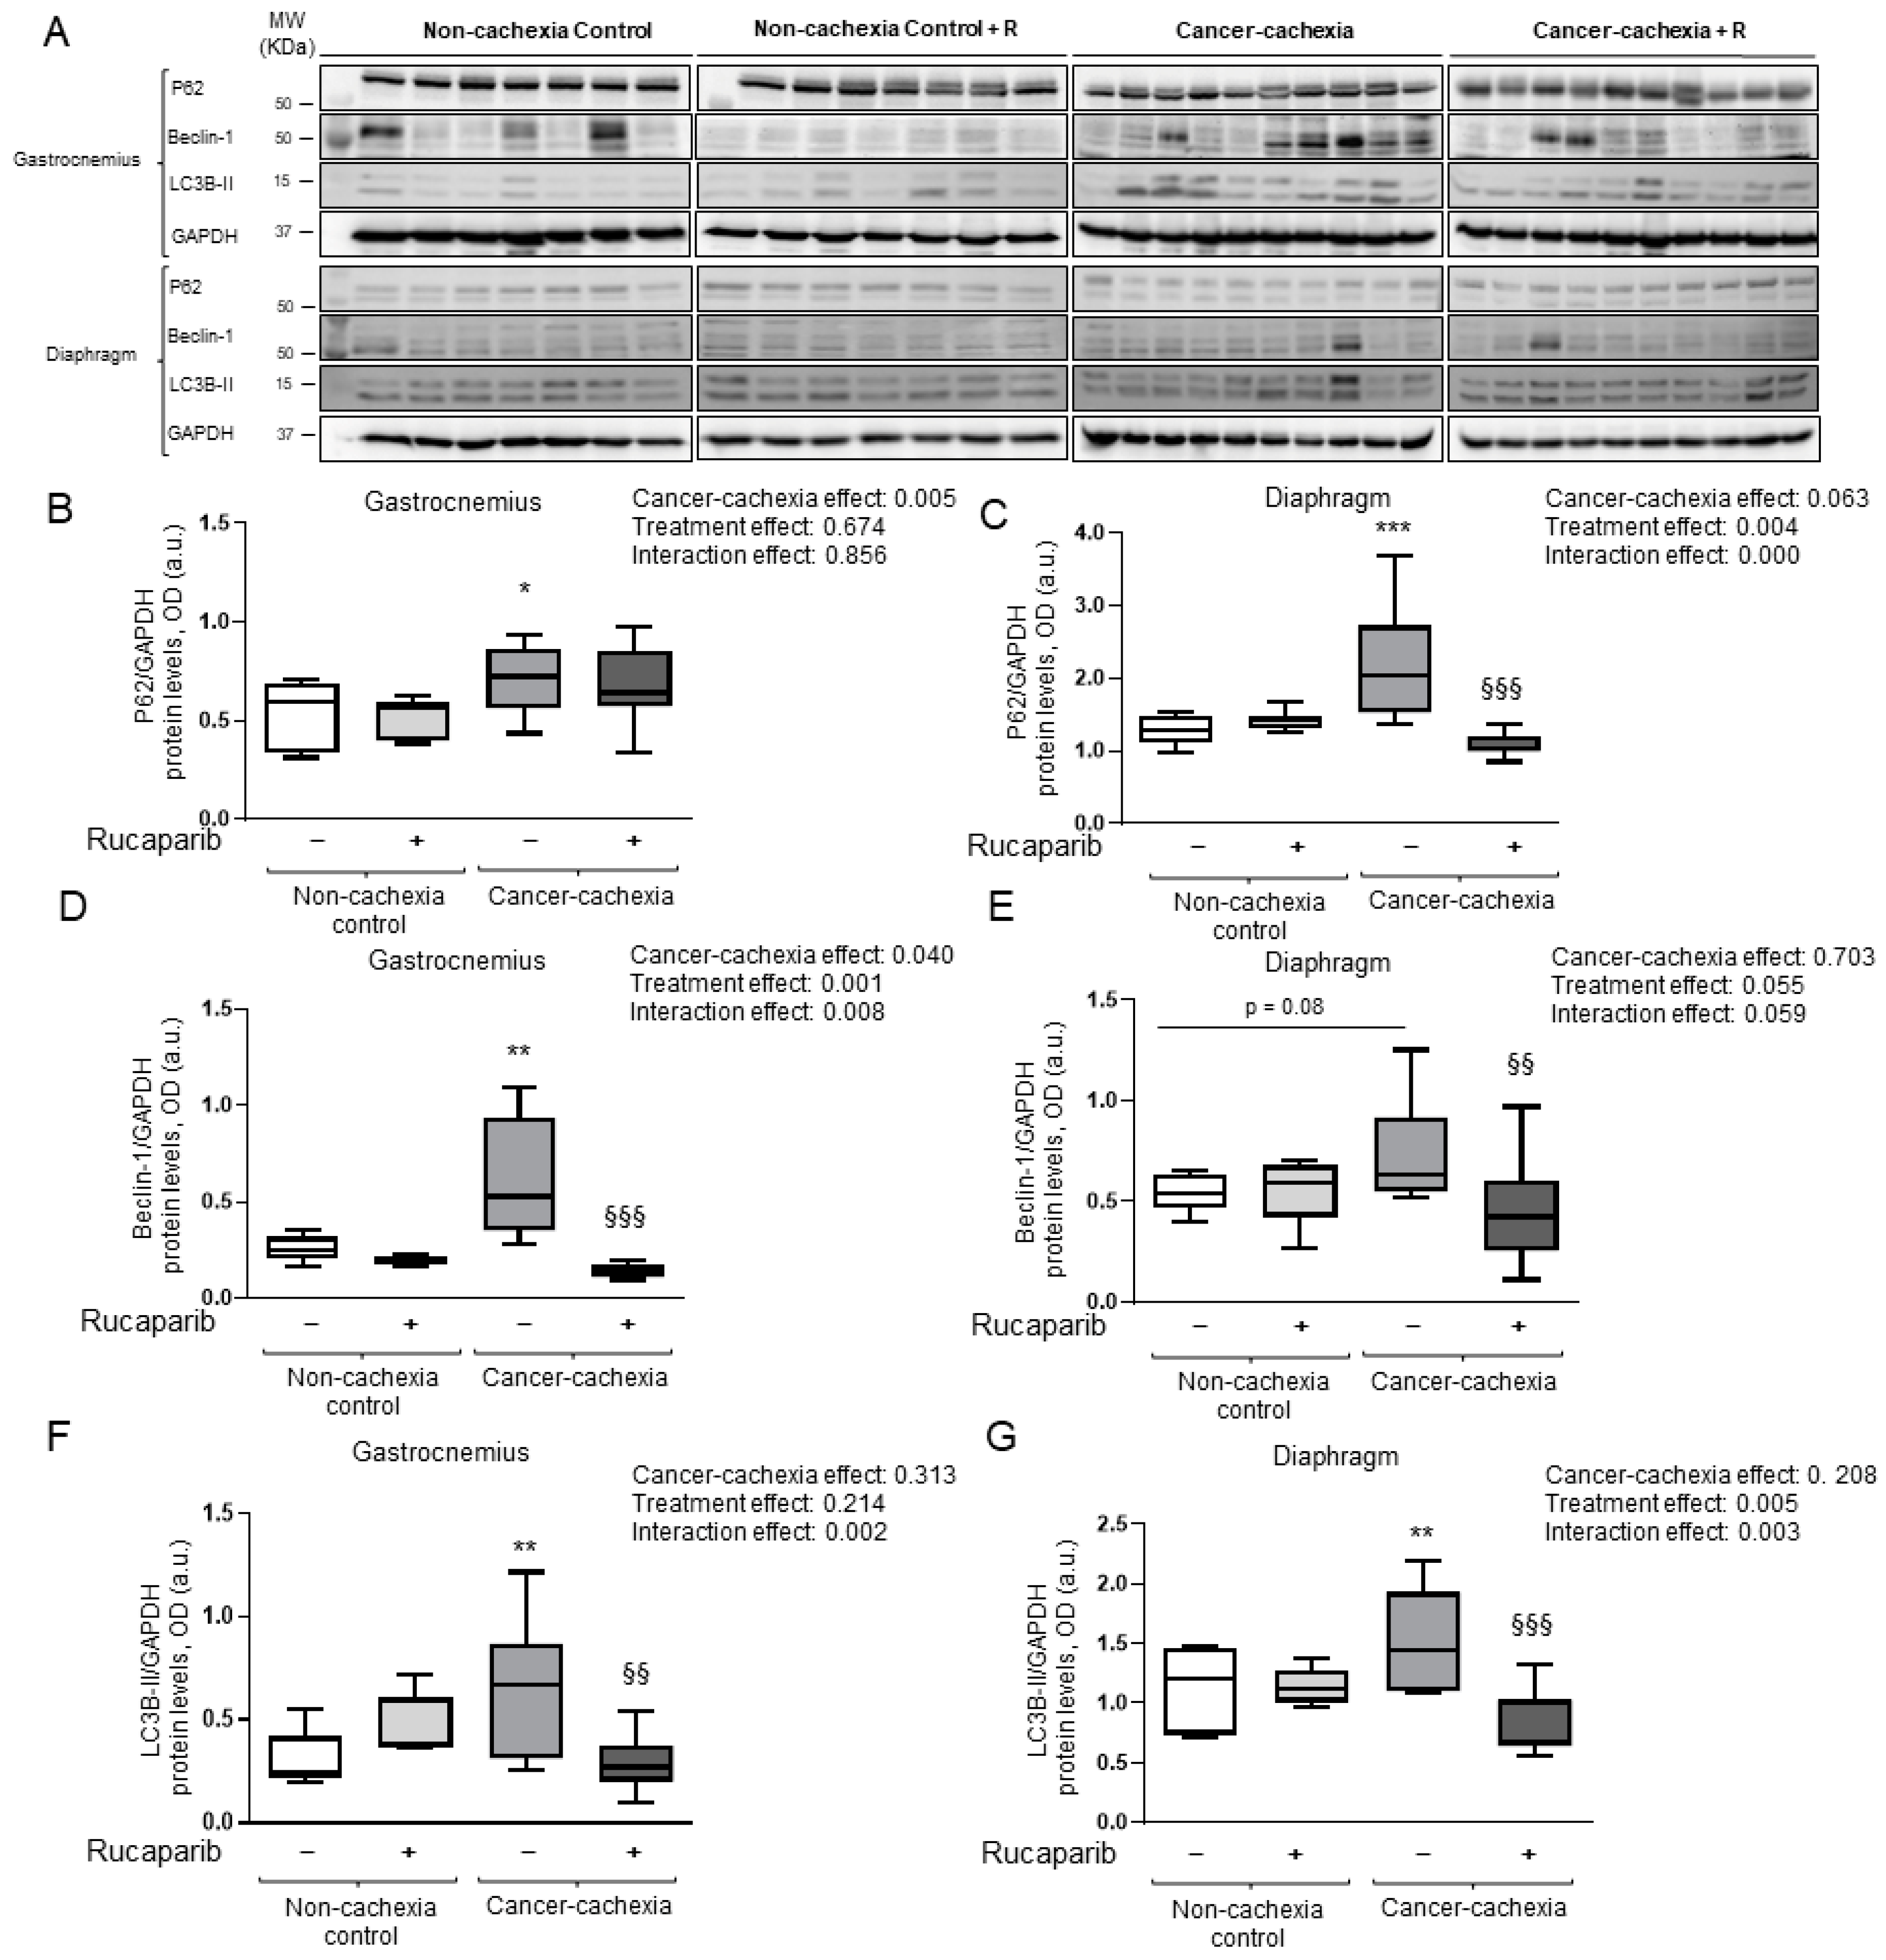
3.6. Effects of Rucaparib on Autophagy Markers in Respiratory and Limb Muscles
4. Discussion
Study Limitations
5. Conclusions
Supplementary Materials
Author Contributions
Funding
Institutional Review Board Statement
Informed Consent Statement
Data Availability Statement
Acknowledgments
Conflicts of Interest
References
- Argilés, J.M.; Busquets, S.; Felipe, A.; López-Soriano, F.J. Molecular mechanisms involved in muscle wasting in cancer and ageing: Cachexia versus sarcopenia. Int. J. Biochem. Cell Biol. 2005, 37, 1084–1104. [Google Scholar] [CrossRef] [PubMed]
- Muscaritoli, M.; Bossola, M.; Aversa, Z.; Bellantone, R.; Rossi Fanelli, F. Prevention and treatment of cancer cachexia: New insights into an old problem. Eur. J. Cancer 2006, 42, 31–41. [Google Scholar] [CrossRef] [PubMed]
- Tisdale, M.J. Cachexia in cancer patients. Nat. Rev. Cancer 2002, 2, 862–871. [Google Scholar] [CrossRef] [PubMed]
- Bossi, P.; Delrio, P.; Mascheroni, A.; Zanetti, M. The Spectrum of Malnutrition/Cachexia/Sarcopenia in Oncology According to Different Cancer Types and Settings: A Narrative Review. Nutrients 2021, 13, 1980. [Google Scholar] [CrossRef] [PubMed]
- Fearon, K.; Strasser, F.; Anker, S.D.; Bosaeus, I.; Bruera, E.; Fainsinger, R.L.; Jatoi, A.; Loprinzi, C.; MacDonald, N.; Mantovani, G.; et al. Definition and classification of cancer cachexia: An international consensus. Lancet Oncol. 2011, 12, 489–495. [Google Scholar] [CrossRef]
- Penet, M.F.; Bhujwalla, Z.M. Cancer cachexia, recent advances, and future directions. Cancer J. 2015, 21, 117–122. [Google Scholar] [CrossRef]
- Penedo-Vázquez, A.; Duran, X.; Mateu, J.; López-Postigo, A.; Barreiro, E. Curcumin and Resveratrol Improve Muscle Function and Structure through Attenuation of Proteolytic Markers in Experimental Cancer-Induced Cachexia. Molecules 2021, 26, 4904. [Google Scholar] [CrossRef]
- Mañas-García, L.; Penedo-Vázquez, A.; López-Postigo, A.; Deschrevel, J.; Durán, X.; Barreiro, E. Prolonged Immobilization Exacerbates the Loss of Muscle Mass and Function Induced by Cancer-Associated Cachexia through Enhanced Proteolysis in Mice. Int. J. Mol. Sci. 2020, 21, 8167. [Google Scholar] [CrossRef]
- Busquets, S.; Pérez-Peiró, M.; Salazar-Degracia, A.; Argilés, J.M.; Serpe, R.; Rojano-Toimil, A.; López-Soriano, F.J.; Barreiro, E. Differential structural features in soleus and gastrocnemius of carnitine-treated cancer cachectic rats. J. Cell. Physiol. 2020, 235, 526–537. [Google Scholar] [CrossRef]
- Naito, T.; Okayama, T.; Aoyama, T.; Ohashi, T.; Masuda, Y.; Kimura, M.; Shiozaki, H.; Murakami, H.; Kenmotsu, H.; Taira, T.; et al. Unfavorable impact of cancer cachexia on activity of daily living and need for inpatient care in elderly patients with advanced non-small-cell lung cancer in Japan: A prospective longitudinal observational study. BMC Cancer 2017, 17, 800. [Google Scholar] [CrossRef]
- Porporato, P.E. Understanding cachexia as a cancer metabolism syndrome. Oncogenesis 2016, 5, e200. [Google Scholar] [CrossRef] [PubMed]
- Dewys, W.D.; Begg, C.; Lavin, P.T.; Band, P.R.; Bennett, J.M.; Bertino, J.R.; Cohen, M.H.; Douglass, H.O.; Engstrom, P.F.; Ezdinli, E.Z.; et al. Prognostic effect of weight loss prior to chemotherapy in cancer patients. Eastern Cooperative Oncology Group. Am. J. Med. 1980, 69, 491–497. [Google Scholar] [CrossRef]
- Naito, T. Evaluation of the True Endpoint of Clinical Trials for Cancer Cachexia. Asia-Pac. J. Oncol. Nurs. 2019, 6, 227. [Google Scholar] [CrossRef] [PubMed]
- Thoresen, L.; Frykholm, G.; Lydersen, S.; Ulveland, H.; Baracos, V.; Prado, C.M.M.; Birdsell, L.; Falkmer, U. Nutritional status, cachexia and survival in patients with advanced colorectal carcinoma. Different assessment criteria for nutritional status provide unequal results. Clin. Nutr. 2013, 32, 65–72. [Google Scholar] [CrossRef]
- Peixoto da Silva, S.; Santos, J.M.O.; Costa e Silva, M.P.; Gil da Costa, R.M.; Medeiros, R. Cancer cachexia and its pathophysiology: Links with sarcopenia, anorexia and asthenia. J. Cachexia Sarcopenia Muscle 2020, 11, 619–635. [Google Scholar] [CrossRef]
- Salazar-Degracia, A.; Busquets, S.; Argilés, J.M.; López-Soriano, F.J.; Barreiro, E. Formoterol attenuates increased oxidative stress and myosin protein loss in respiratory and limb muscles of cancer cachectic rats. PeerJ 2017, 5, e4109. [Google Scholar] [CrossRef]
- Chacon-Cabrera, A.; Mateu-Jimenez, M.; Langohr, K.; Fermoselle, C.; García-Arumí, E.; Andreu, A.L.; Yelamos, J.; Barreiro, E. Role of PARP activity in lung cancer-induced cachexia: Effects on muscle oxidative stress, proteolysis, anabolic markers, and phenotype. J. Cell. Physiol. 2017, 232, 3744–3761. [Google Scholar] [CrossRef]
- Chacon-Cabrera, A.; Fermoselle, C.; Urtreger, A.J.; Mateu-Jimenez, M.; Diament, M.J.; De Kier Joffé, E.D.B.; Sandri, M.; Barreiro, E. Pharmacological strategies in lung cancer-induced cachexia: Effects on muscle proteolysis, autophagy, structure, and weakness. J. Cell. Physiol. 2014, 229, 1660–1672. [Google Scholar] [CrossRef]
- Fermoselle, C.; García-Arumí, E.; Puig-Vilanova, E.; Andreu, A.L.; Urtreger, A.J.; de Kier Joffé, E.D.B.; Tejedor, A.; Puente-Maestu, L.; Barreiro, E. Mitochondrial dysfunction and therapeutic approaches in respiratory and limb muscles of cancer cachectic mice. Exp. Physiol. 2013, 98, 1349–1365. [Google Scholar] [CrossRef]
- Marin-Corral, J.; Fontes, C.C.; Pascual-Guardia, S.; Sanchez, F.; Olivan, M.; Argilés, J.M.; Busquets, S.; López-Soriano, F.J.; Barreiro, E. Redox balance and carbonylated proteins in limb and heart muscles of cachectic rats. Antioxid. Redox Signal. 2010, 12, 365–380. [Google Scholar] [CrossRef]
- Barreiro, E.; De La Puente, B.; Busquets, S.; López-Soriano, F.J.; Gea, J.; Argilés, J.M. Both oxidative and nitrosative stress are associated with muscle wasting in tumour-bearing rats. FEBS Lett. 2005, 579, 1646–1652. [Google Scholar] [CrossRef] [PubMed]
- Martin, A.; Freyssenet, D. Phenotypic features of cancer cachexia-related loss of skeletal muscle mass and function: Lessons from human and animal studies. J. Cachexia Sarcopenia Muscle 2021, 12, 252–273. [Google Scholar] [CrossRef] [PubMed]
- Puig-Vilanova, E.; Rodriguez, D.A.; Lloreta, J.; Ausin, P.; Pascual-Guardia, S.; Broquetas, J.; Roca, J.; Gea, J.; Barreiro, E. Oxidative stress, redox signaling pathways, and autophagy in cachectic muscles of male patients with advanced COPD and lung cancer. Free Radic. Biol. Med. 2015, 79, 91–108. [Google Scholar] [CrossRef] [PubMed]
- Lüscher, B.; Ahel, I.; Altmeyer, M.; Ashworth, A.; Bai, P.; Chang, P.; Cohen, M.; Corda, D.; Dantzer, F.; Daugherty, M.D.; et al. ADP-ribosyltransferases, an update on function and nomenclature. FEBS J. 2021. [Google Scholar] [CrossRef]
- Schreiber, V.; Dantzer, F.; Amé, J.C.; De Murcia, G. Poly(ADP-ribose): Novel functions for an old molecule. Nat. Rev. Mol. Cell Biol. 2006, 7, 517–528. [Google Scholar] [CrossRef]
- Amé, J.C.; Rolli, V.; Schreiber, V.; Niedergang, C.; Apiou, F.; Decker, P.; Muller, S.; Höger, T.; Ménissier-de Murcia, J.; De Murcia, G. PARP-2, A novel mammalian DNA damage-dependent poly(ADP-ribose) polymerase. J. Biol. Chem. 1999, 274, 17860–17868. [Google Scholar] [CrossRef]
- Czapski, G.A.; Adamczyk, A.; Strosznajder, R.P.; Strosznajder, J.B. Expression and activity of PARP family members in the hippocampus during systemic inflammation: Their role in the regulation of prooxidative genes. Neurochem. Int. 2013, 62, 664–673. [Google Scholar] [CrossRef]
- Bai, P. Biology of Poly(ADP-Ribose) Polymerases: The Factotums of Cell Maintenance. Mol. Cell 2015, 58, 947–958. [Google Scholar] [CrossRef]
- Chacon-Cabrera, A.; Fermoselle, C.; Salmela, I.; Yelamos, J.; Barreiro, E. MicroRNA expression and protein acetylation pattern in respiratory and limb muscles of Parp-1(-/-) and Parp-2(-/-) mice with lung cancer cachexia. Biochim. Biophys. Acta 2015, 1850, 2530–2543. [Google Scholar] [CrossRef]
- Richard, I.A.; Burgess, J.T.; O’Byrne, K.J.; Bolderson, E. Beyond PARP1: The Potential of Other Members of the Poly (ADP-Ribose) Polymerase Family in DNA Repair and Cancer Therapeutics. Front. Cell Dev. Biol. 2022, 9, 3860. [Google Scholar] [CrossRef]
- Dantzer, F.; Amé, J.C.; Schreiber, V.; Nakamura, J.; Ménissier-de Murcia, J.; De Murcia, G. Poly(ADP-ribose) polymerase-1 activation during DNA damage and repair. Methods Enzymol. 2006, 409, 493–510. [Google Scholar] [CrossRef] [PubMed]
- Galindo-Campos, M.A.; Lutfi, N.; Bonnin, S.; Martínez, C.; Velasco-Hernandez, T.; García-Hernández, V.; Martín-Caballero, J.; Ampurdanés, C.; Gimeno, R.; Colomo, L.; et al. Distinct roles for PARP-1 and PARP-2 in c-Myc-driven B-cell lymphoma in mice. Blood 2022, 139, 228–239. [Google Scholar] [CrossRef] [PubMed]
- Fehr, A.R.; Singh, S.A.; Kerr, C.M.; Mukai, S.; Higashi, H.; Aikawa, M. The impact of PARPs and ADP-ribosylation on inflammation and host–pathogen interactions. Genes Dev. 2020, 34, 341–359. [Google Scholar] [CrossRef] [PubMed]
- Szántó, M.; Bai, P. The role of ADP-ribose metabolism in metabolic regulation, adipose tissue differentiation, and metabolism. Genes Dev. 2020, 34, 321. [Google Scholar] [CrossRef] [PubMed]
- Kiefmann, R.; Heckel, K.; Doerger, M.; Schenkat, S.; Kupatt, C.; Stoeckelhuber, M.; Wesierska-Gadek, J.; Goetz, A.E. Role of PARP on iNOS pathway during endotoxin-induced acute lung injury. Intensive Care Med. 2004, 30, 1421–1431. [Google Scholar] [CrossRef]
- Vaschetto, R.; Kuiper, J.W.; Chiang, S.R.; Haitsma, J.J.; Juco, J.W.; Uhlig, S.; Plötz, F.B.; Corte, F.D.; Zhang, H.; Slutsky, A.S. Inhibition of poly(adenosine diphosphate-ribose) polymerase attenuates ventilator-induced lung injury. Anesthesiology 2008, 108, 261. [Google Scholar] [CrossRef] [PubMed]
- Zheng, J.; Devalaraja-Narashimha, K.; Singaravelu, K.; Padanilam, B.J. Poly(ADP-ribose) polymerase-1 gene ablation protects mice from ischemic renal injury. Am. J. Physiol. Renal Physiol. 2005, 288, F387–F398. [Google Scholar] [CrossRef]
- Pacher, P.; Szabó, C. Role of poly(ADP-ribose) polymerase 1 (PARP-1) in cardiovascular diseases: The therapeutic potential of PARP inhibitors. Cardiovasc. Drug Rev. 2007, 25, 235–260. [Google Scholar] [CrossRef]
- Jagtap, P.; Szabo, C. Poly(ADP-ribose) polymerase and the therapeutic effects of its inhibitors. Nat. Rev. Drug Discov. 2005, 4, 421–440. [Google Scholar] [CrossRef]
- Kuenzler, M.B.; Nuss, K.; Karol, A.; Schär, M.O.; Hottiger, M.; Raniga, S.; Kenkel, D.; Von Rechenberg, B.; Zumstein, M.A. Neer Award 2016: Reduced muscle degeneration and decreased fatty infiltration after rotator cuff tear in a poly(ADP-ribose) polymerase 1 (PARP-1) knock-out mouse model. J. Shoulder Elb. Surg. 2017, 26, 733–744. [Google Scholar] [CrossRef]
- Ahmad, A.; Olah, G.; Herndon, D.N.; Szabo, C. The clinically used PARP inhibitor olaparib improves organ function, suppresses inflammatory responses and accelerates wound healing in a murine model of third-degree burn injury. Br. J. Pharmacol. 2018, 175, 232–245. [Google Scholar] [CrossRef] [PubMed]
- Haddad, G.; Saadé, M.C.; Eid, R.; Haddad, F.G.; Kourie, H.R. PARP inhibitors: A tsunami of indications in different malignancies. Pharmacogenomics 2020, 21, 221–230. [Google Scholar] [CrossRef] [PubMed]
- Yi, M.; Dong, B.; Qin, S.; Chu, Q.; Wu, K.; Luo, S. Advances and perspectives of PARP inhibitors. Exp. Hematol. Oncol. 2019, 8, 29. [Google Scholar] [CrossRef] [PubMed]
- Jiang, X.; Li, X.; Li, W.; Bai, H.; Zhang, Z. PARP inhibitors in ovarian cancer: Sensitivity prediction and resistance mechanisms. J. Cell. Mol. Med. 2019, 23, 2303–2313. [Google Scholar] [CrossRef] [PubMed]
- Scott, B. PARP Inhibitors in Advanced Ovarian Cancer: A Review of Long-term Efficacy and Survival Rates. Eur. Med. J. Oncol. 2021, 9, 2–12. [Google Scholar]
- Valabrega, G.; Scotto, G.; Tuninetti, V.; Pani, A.; Scaglione, F. Differences in PARP Inhibitors for the Treatment of Ovarian Cancer: Mechanisms of Action, Pharmacology, Safety, and Efficacy. Int. J. Mol. Sci. 2021, 22, 4203. [Google Scholar] [CrossRef]
- Konstantinopoulos, P.A.; Lheureux, S.; Moore, K.N. PARP Inhibitors for Ovarian Cancer: Current Indications, Future Combinations, and Novel Assets in Development to Target DNA Damage Repair. Am. Soc. Clin. Oncol. Educ. Book 2020, 40, e116–e131. [Google Scholar] [CrossRef]
- Peluffo, G.D.; Stillitani, I.; Rodríguez, V.A.; Diament, M.J.; Klein, S.M. Reduction of tumor progression and paraneoplastic syndrome development in murine lung adenocarcinoma by nonsteroidal antiinflammatory drugs. Int. J. Cancer 2004, 110, 825–830. [Google Scholar] [CrossRef]
- Urtreger, A.J.; Diament, M.J.; Ranuncolo, S.M.; Vidal, D.C.; Puricelli, L.I.; Klein, S.M.; De Kier Joffe, E.D. New murine cell line derived from a spontaneous lung tumor induces paraneoplastic syndromes. Int. J. Oncol. 2001, 18, 639–647. [Google Scholar] [CrossRef]
- Salazar-Degracia, A.; Granado-Martínez, P.; Millán-Sánchez, A.; Tang, J.; Pons-Carreto, A.; Barreiro, E. Reduced lung cancer burden by selective immunomodulators elicits improvements in muscle proteolysis and strength in cachectic mice. J. Cell. Physiol. 2019, 234, 18041–18052. [Google Scholar] [CrossRef]
- Pin, F.; Barreto, R.; Couch, M.E.; Bonetto, A.; O’Connell, T.M. Cachexia induced by cancer and chemotherapy yield distinct perturbations to energy metabolism. J. Cachexia Sarcopenia Muscle 2019, 10, 140–154. [Google Scholar] [CrossRef] [PubMed]
- Sung, B.; Hwang, S.Y.; Kim, M.J.; Kim, M.; Jeong, J.W.; Kim, C.M.; Chung, H.Y.; Kim, N.D. Loquat leaf extract enhances myogenic differentiation, improves muscle function and attenuates muscle loss in aged rats. Int. J. Mol. Med. 2015, 36, 792–800. [Google Scholar] [CrossRef] [PubMed]
- Lai, Y.C.; Aneja, R.K.; Satchell, M.A.; Clark, R.S.B. Detecting and quantifying pADPr in vivo. Methods Mol. Biol. 2011, 780, 117–134. [Google Scholar] [CrossRef] [PubMed]
- Puig-Vilanova, E.; Martínez-Llorens, J.; Ausin, P.; Roca, J.; Gea, J.; Barreiro, E. Quadriceps muscle weakness and atrophy are associated with a differential epigenetic profile in advanced COPD. Clin. Sci. 2015, 128, 905–921. [Google Scholar] [CrossRef]
- Salazar-Degracia, A.; Blanco, D.; Vilà-Ubach, M.; Biurrun, G.; Solórzano, C.O.; Montuenga, L.M.; Barreiro, E. Phenotypic and metabolic features of mouse diaphragm and gastrocnemius muscles in chronic lung carcinogenesis: Influence of underlying emphysema. J. Transl. Med. 2016, 14, 244. [Google Scholar] [CrossRef]
- Domínguez-Álvarez, M.; Gea, J.; Barreiro, E. Inflammatory Events and Oxidant Production in the Diaphragm, Gastrocnemius, and Blood of Rats Exposed to Chronic Intermittent Hypoxia: Therapeutic Strategies. J. Cell. Physiol. 2017, 232, 1165–1175. [Google Scholar] [CrossRef]
- Crawford, R.S.; Albadawi, H.; Atkins, M.D.; Jones, J.E.; Yoo, H.J.; Conrad, M.F.; Austen, W.G.; Watkins, M.T. Post Ischemic PARP Inhibition Reduces Ischemia Reperfusion Injury in a Hind-Limb Ischemia Model. Surgery 2010, 148, 110. [Google Scholar] [CrossRef][Green Version]
- Filipovic, D.M.; Meng, X.; Reeves, W.B. Inhibition of PARP prevents oxidant-induced necrosis but not apoptosis in LLC-PK1 cells. Am. J. Physiol. 1999, 277, F428–F436. [Google Scholar] [CrossRef]
- Mohamed, J.S.; Wilson, J.C.; Myers, M.J.; Sisson, K.J.; Alway, S.E. Dysregulation of SIRT-1 in aging mice increases skeletal muscle fatigue by a PARP-1-dependent mechanism. Aging 2014, 6, 820–834. [Google Scholar] [CrossRef]
- Pirinen, E.; Cantó, C.; Jo, Y.S.; Morato, L.; Zhang, H.; Menzies, K.J.; Williams, E.G.; Mouchiroud, L.; Moullan, N.; Hagberg, C.; et al. Pharmacological Inhibition of poly(ADP-ribose) polymerases improves fitness and mitochondrial function in skeletal muscle. Cell Metab. 2014, 19, 1034–1041. [Google Scholar] [CrossRef]
- Jankó, L.; Sári, Z.; Kovács, T.; Kis, G.; Szántó, M.; Antal, M.; Juhász, G.; Bai, P. Silencing of PARP2 Blocks Autophagic Degradation. Cells 2020, 9, 380. [Google Scholar] [CrossRef] [PubMed]


| Non-Cachexia Controls | Cancer Cachexia | Cancer Cachexia Effect 7 (p Value) | Treatment Effect (p Value) | Interaction Effect (p Value) | |||
|---|---|---|---|---|---|---|---|
| Rucaparib | − | + | − | + | |||
| Initial body weight (g) | 21.26 (0.77) | 20.76 (0.88) | 20.89 (0.77) | 20.45 (0.77) | 0.876 | 0.985 | 0.194 |
| Final body weight (g) | 21.43 (0.64) | 20.31 (1.03) | 19.77 (1.61) * | 20.91 (2.01) | 0.316 | 0.979 | 0.037 |
| Final body weight without tumor (g) | 21.43 (0.64) | 20.31 (1.03) | 18.36 (1.75) ** | 19.57 (2.38) | 0.003 | 0.941 | 0.057 |
| Body weight gain (%) | +0.79 (2.98) | −1.80 (2.04) | −7.40 (5.90) ** | +2.52 (8.71) §§ | 0.009 | 0.273 | 0.020 |
| Body weight gain without tumor (%) | +0.79 (2.98) | −1.80 (2.04) | −12.11 (7.91) *** | −4.08 (10.69) §§ | 0.007 | 0.335 | 0.042 |
| Tumor weight (g) | NA | NA | 1.70 (0.38) | 1.21 (0.53) § | NA | NA | NA |
| Tumor area (mm2) | NA | NA | 1860.93 (506.80) | 1296.75 (490.27) § | NA | NA | NA |
| Diaphragm weight (g) | 0.08 (0.01) | 0.07 (0.03) | 0.05 (0.01) *** | 0.06 (0.01) | 0.001 | 0.919 | 0.030 |
| Gastrocnemius weight (g) | 0.12 (0.01) | 0.11 (0.02) | 0.10 (0.02) ** | 0.11 (0.02) | 0.004 | 0.741 | 0.202 |
| Four-limb strength (g)/bw (g) | 12.01 (0.89) | 12.56 (1.06) | 9.59 (1.50) *** | 8.60 (1.85) | 0.000 | 0.657 | 0.129 |
| Four-limb grip strength gain (%) | +10.84 (5.17) | +14.04 (15.81) | −16.59 (11.09) *** | −17.41 (13.88) | 0.000 | 0.567 | 0.214 |
| Locomotor movements | 236.58 (67.55) | 223.98 (58.92) | 117.2 (30.2) *** | 200.81 (71.59) §§§ | 0.000 | 0.000 | 0.000 |
| Non-Cachexia Controls | Cancer Cachexia | Cancer Cachexia Effect (p Value) | Treatment Effect (p Value) | Interaction Effect (p Value) | ||||
|---|---|---|---|---|---|---|---|---|
| Rucaparib | − | + | − | + | ||||
| Fiber Type Composition | ||||||||
| Proportion of fiber type, % | ||||||||
| Type I fibers | Gastrocnemius | 11.4 (3.6) | 14.0 (3.3) | 10.1 (2.1) | 11.2 (2.5) | 0.107 | 0.181 | 0.602 |
| Diaphragm | 6.3 (1.7) | 7.1 (1.2) | 7.1 (2.9) | 9.3 (2.1) | 0.156 | 0.110 | 0.474 | |
| Type II fibers | Gastrocnemius | 87.3 (3.4) | 85.3 (3.2) | 89.1 (1.9) | 88.2 (2.4) | 0.050 | 0.177 | 0.600 |
| Diaphragm | 92.4 (1.7) | 92.2 (0.9) | 91.4 (3.4) | 90.1 (1.8) | 0.187 | 0.701 | 0.736 | |
| Hybrid fibers | Gastrocnemius | 1.3 (0.9) | 0.8 (0.8) | 0.8 (0.9) | 0.6 (0.6) | 0.290 | 0.318 | 0.632 |
| Diaphragm | 1.3 (0.5) | 0.9 (0.2) | 1.1 (0.3) | 0.7 (0.3) | 0.302 | 0.232 | 0.723 | |
| Fiber cross-sectional area, µm2 | ||||||||
| Type I fibers | Gastrocnemius | 758.1 (220.7) | 762.3 (132.5) | 460 (109.1) ** | 539.3 (123.3) | 0.001 | 0.518 | 0.561 |
| Diaphragm | 336.5 (72.8) | 300.5 (85.0) | 219.4 (40.2) ** | 226.2 (42.4) | 0.009 | 0.074 | 0.010 | |
| Type II fibers | Gastrocnemius | 848.0 (146.5) | 884.4 (321.0) | 592.9 (95.4) * | 603.0 (135.7) | 0.001 | 0.749 | 0.855 |
| Diaphragm | 418.9 (63.7) | 397.4 (76.5) | 271.8 (48.3) *** | 307.9 (24.6) | 0.000 | 0.772 | 0.274 | |
| Hybrid fibers | Gastrocnemius | 568.6 (174) | 540.7 (138.6) | 314.5 (132.2) * | 432.1 (83.4) | 0.024 | 0.536 | 0.324 |
| Diaphragm | 351.2 (78.8) | 335.8 (167.9) | 197.5 (16.9) * | 177.8 (27.2) | 0.007 | 0.722 | 0.964 | |
Publisher’s Note: MDPI stays neutral with regard to jurisdictional claims in published maps and institutional affiliations. |
© 2022 by the authors. Licensee MDPI, Basel, Switzerland. This article is an open access article distributed under the terms and conditions of the Creative Commons Attribution (CC BY) license (https://creativecommons.org/licenses/by/4.0/).
Share and Cite
Pérez-Peiró, M.; Duran, X.; Yélamos, J.; Barreiro, E. Attenuation of Muscle Damage, Structural Abnormalities, and Physical Activity in Respiratory and Limb Muscles following Treatment with Rucaparib in Lung Cancer Cachexia Mice. Cancers 2022, 14, 2894. https://doi.org/10.3390/cancers14122894
Pérez-Peiró M, Duran X, Yélamos J, Barreiro E. Attenuation of Muscle Damage, Structural Abnormalities, and Physical Activity in Respiratory and Limb Muscles following Treatment with Rucaparib in Lung Cancer Cachexia Mice. Cancers. 2022; 14(12):2894. https://doi.org/10.3390/cancers14122894
Chicago/Turabian StylePérez-Peiró, Maria, Xavier Duran, José Yélamos, and Esther Barreiro. 2022. "Attenuation of Muscle Damage, Structural Abnormalities, and Physical Activity in Respiratory and Limb Muscles following Treatment with Rucaparib in Lung Cancer Cachexia Mice" Cancers 14, no. 12: 2894. https://doi.org/10.3390/cancers14122894
APA StylePérez-Peiró, M., Duran, X., Yélamos, J., & Barreiro, E. (2022). Attenuation of Muscle Damage, Structural Abnormalities, and Physical Activity in Respiratory and Limb Muscles following Treatment with Rucaparib in Lung Cancer Cachexia Mice. Cancers, 14(12), 2894. https://doi.org/10.3390/cancers14122894