Simple Summary
Osteosarcoma (OS) is a highly heterogenous cancer, making the identification of genetic driving factors difficult. Genetic factors, such as heritable mutations of Rb1 and TP53, are associated with an increased risk of OS. We previously generated pigs carrying a mutated TP53 gene, which develop OS at high frequency. RNA sequencing and allelic expression imbalance analysis identified an amplification of YAP1 involved in p53- dependent OS progression. The inactivation of YAP1 inhibits proliferation, migration, and invasion, and leads to the silencing of TP63 and reconstruction of p16 expression in p53-deficient porcine OS cells. This study confirms the importance of p53/YAP1 network in cancer.
Abstract
Osteosarcoma (OS) is a primary bone malignancy that mainly occurs during adolescent growth, suggesting that bone growth plays an important role in the aetiology of the disease. Genetic factors, such as heritable mutations of Rb1 and TP53, are associated with an increased risk of OS. Identifying driver mutations for OS has been challenging due to the complexity of bone growth-related pathways and the extensive intra-tumoral heterogeneity of this cancer. We previously generated pigs carrying a mutated TP53 gene, which develop OS at high frequency. RNA sequencing and allele expression imbalance (AEI) analysis of OS and matched healthy control samples revealed a highly significant AEI (p = 2.14 × 10−39) for SNPs in the BIRC3-YAP1 locus on pig chromosome 9. Analysis of copy number variation showed that YAP1 amplification is associated with the AEI and the progression of OS. Accordingly, the inactivation of YAP1 inhibits proliferation, migration, and invasion, and leads to the silencing of TP63 and reconstruction of p16 expression in p53-deficient porcine OS cells. Increased p16 mRNA expression correlated with lower methylation of its promoter. Altogether, our study provides molecular evidence for the role of YAP1 amplification in the progression of p53-dependent OS.
Keywords:
YAP1; TP53; TP63; p16; allelic expression imbalance; copy number variation; bone cancer; pig 1. Introduction
Osteosarcoma (OS) is the most common form of primary bone cancer, mainly found in young people with the second highest incidence group being over the age of 50 [1]. OS is a highly aggressive cancer for which there have been no major therapeutic improvements over the last decades [2,3]. The five-year overall survival rates are 69% and 23% for primary and metastatic OS respectively [4]. Risk factors for OS include rapid bone growth [5], gender [6], a tall stature [6], and radiation as a source for secondary OS [7,8].
High heterogeneity of OS hinders the identification of driver mutations and therapeutic target genes. Genome-wide somatic alterations in OS include mutations and chromosomal lesions, such as structural and copy number variations in TP53 [9,10,11] and Rb1 [9,12], alternative lengthening of telomeres, and an aberrant epigenetic pattern [9,13,14,15,16,17,18].
Germline TP53 mutations predispose for developing different types of cancers including OS in Li- Fraumeni syndrome patients [19,20]. In mice, p53-deficiency leads to OS at low frequency, however conditional activation of p53 mutation such as R172H in osteoblasts has increased the aggressiveness of the disease [21,22].
We have generated genetically engineered pigs with a Cre-inducible oncogenic flTP53R167H mutation, homologous to the human hotspot mutation TP53R175H, a structural mutation with oncogenic function [23,24]. The flTP53R167H heterozygous and homozygous pigs carrying the uninduced allele frequently develop OS in long bones and skull. The porcine OS showed similar features to human OS, such as tumour cells with a highly abnormal karyotype, nuclei with atypical mitotic figures, and increased resistance to radiation [25].
To identify the genetic factors which contribute to the OS development in the flTP53R167H pigs, we have carried out RNA sequencing and allele expression imbalance (AEI) analysis. The AEI quantifies the stoichiometric difference in the expression of the two alleles of a genetic locus [26,27,28] or two haplotypes of a diploid individual which can be distinguished at heterozygous variation sites [29]. Compared to gene expression analysis, AEI has the advantage of using two alleles of one gene within individuals and thus better controlling the genetic background and environmental effects, and therefore can sensitively and accurately detect the genetic and epigenetic differences in highly heterocellular samples such as tumors [30,31]. AEI has been applied to detect driver mutations in various human cancers including colorectal and breast cancer [32,33].
2. Material and Methods
2.1. Animals
OS (n = 48) samples were collected from ten (8 male and 2 female) flTP53R167H/R167H reached sexual mature and 24 (13 male and 11 female) flTP53R167H/+ pigs aged 7–32 months. All animal experiments were approved by the Government of Upper Bavaria (permit number 55.2-1-54-2532-6-13) and performed according to the German Animal Welfare Act and European Union Normative for Care and Use of Experimental Animals.
2.2. Necropsy Examination and Tumour Analysis
Pigs were humanely killed and examined by complete necropsy at the Tiergesundheitsdienst Bayern (Bavarian Animal Health Service). In total, 48 OS and matched healthy bone samples from hetero- and homozygous flTP53R167H pigs were analysed, as previously described [34].
2.3. Next-Generation RNA Sequencing
Briefly, ten mg of OS and matched healthy samples was used for total RNA extraction using Zymo Direct-zol RNA MiniPrep kit (Zymo Research, Freiburg, Germany) according to the manufacturer’s instructions. The quality and quantity of RNA samples was measured using an Agilent RNA 6000 Nano kit (Agilent, Waldbronn, Germany) on a 2100 Bioanalyzer (Agilent) and a Nanodrop 2000 spectrophotometer (Thermo Scientific, Waltham, MA, USA). The RNA integrity values (RIN) ranged from 7.6 to 9.0. 400 ng total RNA was used for library preparation with the TruSeq RNA Library Preparation Kit v2 (Illumina, San Diego, CA, USA) according to the manufacturer’s instructions, as described in our earlier study [35]. Libraries were sequenced with a HiSeq2500 sequencing system (Illumina) to produce 100-base-paired end reads for 17 samples. An average of 56 million reads per sample was generated. Reads were pseudoaligned against an index of the porcine transcriptome (Sscrofa 11.1; Ensembl release 91, Hinxton, UK) and quantified using kallisto (version 0.43.1, Nicolas L Bray et al., Pasadena, CA, USA) [36]. The differential expression of transcripts was quantified using a likelihood-ratio test implemented in the R package sleuth (version 0.29.0, Hadley Wickham and Jenny Bryan, Auckland, New Zealand) [37]. Hierarchical clusters and heat maps for genes with the most pronounced different levels of expression were generated using the heatmap.2-function of the R package gplots [38].
For allele expression imbalance analysis, variant calling based on STAR alignments was performed according to GATK [39] best practice recommendations for RNAseq [40,41]. The GATK tool Split N Cigar Reads was used to split reads into exons and remove false variants resulting from overhangs. This step included reassignment of the STAR alignment mapping qualities. GATK recalibration of base scores was based on the Ensembl release 83 variant database. Variant calling was carried out using GATK Haplotype Caller with the don’t Used Soft Clipped Bases option. GATK Variant Filtration was applied to clusters of at least 3 SNPs within a window of 35 bases between them with the following parameters: Fisher strand value (FS) > 30.0 and a quality by depth value (QD) < 2.0. The probability of allelic imbalance for each SNP was calculated based on the number of references and alternate allele reads in heterozygous animals using a two-sided binomial test. p values were adjusted for false discovery rate (q value) to take account of multiple testing.
2.4. Gene Set Enrichment Analysis
Gene set enrichment analysis was performed using GSEA software (version 2.2.4, Tamayo et al., San Diego, CA, USA) [42]. The log2 fold change, adjusted p-value, and the Human Genome Organisation (HUGO) gene symbols were used to generate a pre-ranked file as input for the GSEA Preranked tool. Enrichment analysis was performed using the following specifications: classic enrichment statistics, 1000 permutations and hallmark gene sets from Molecular Signatures Database (MSigDB) (version 6.1, Tamayo et al., San Diego, CA, USA) [43].
2.5. Quantitative Real-Time RT-PCR
Breifly, 200 ng total RNA was used for cDNA synthesis using the Superscript IV (Thermo Fisher, Waltham, MA, USA) according to the manufacturer’s instructions. The detailed description of the qRT-PCR was previously described [35]. The relative expression was normalised to GAPDH expression and statistically compared using Students t-test. All primer sequences used in the study are shown in Table S1.
2.6. Pyrosequencing
Pyrosequencing assays were designed using PyroMark Assay Design 2.0 software (Qiagen, Düsseldorf, Germany). Thereby, 500 ng genomic DNA was bisulfite-converted with the EZ DNA Methylation-Direct kit (Zymo Research, Irvine, CA, USA) according to the manufacturer’s instructions. A detailed description of pyrosequencing was previously provided [35].
2.7. Droplet Digital PCR (ddPCR)
Genomic DNA was digested with HindIII (NEB, Frankfurt am Main, Germany) using 3 U/μg DNA. The detailed description of the ddPCR was previously described [44]. Reagents and equipment were from Bio-Rad Laboratories (Hercules, CA, USA) unless otherwise specified.
YAP1 promoter copy number was determined using the fluorescence-labelled YAP1-1 probe (5′FAM-cgcgggagggtttaagtgg-BHQ3′) and primers YAP1-F1 (5′-tgttacaggtaccattgtgctcca-3′) and YAP1-R1 (5′-cagtccccgggaaaggttg-3′) amplifying a 182 bp fragment. YAP1 exon 2 copy number was determined using the fluorescence labelled YAP1-2 probe (5′FAM-ttctagcgtttgcaaacata-BHQ3′) with primers YAP1-F2 (5′-agataacataggataggtct-3′) and YAP1-R2 (5′-tgcagagaatgcatagttt-3′) amplifying a 147 bp fragment. YAP1- 3′UTR copy number was determined using the fluorescence-labelled YAP1-3 probe (5′FAM-ttgcgaccttctggccaata-BHQ3′) and primers YAP1-F3 (5′-ccctcaggtagactgcattc-3′) and YAP1-R3 (5′-gaaagaatcttgctggacgtt-3′) amplifying a 138 bp fragment. Porcine GAPDH was used as reference [44]. Primers and probes were from Eurofins Genomic.
2.8. Western Analysis
Protein was isolated using T-PER Tissue Protein Extraction Reagent (Thermo Scientific) and Western analysis was carried out using iBind Western System (Thermo Scientific) according to the manufacturers’ instructions. Pig YAP1 was detected using polyclonal rabbit anti-YAP1 ARP50530 (diluted 1:1000) and horseradish peroxidase (HRP) labelled anti-rabbit sc-2004 (diluted 1:2000). GAPDH was detected using mouse monoclonal anti-GAPDH #G8795 (diluted 1:3000) and rabbit anti-mouse IgG H&L (HRP) ab6728 (diluted 1:5000).
2.9. Immunohistochemistry
Immunohistochemistry was performed as described previously [44]. OS samples (n = 6) from flTP53R167H homozygous pigs were fixed in 4% formalin and decalcified in Osteosoft® (Merck, Darmstadt, Germany). Four-micrometer sections were air-dried for 10 min at 60 °C on a glass slide. Antigen demasking was performed using the heat retrieval procedure (20 min, citrate buffer pH 6, pressure cooker in microwave medium intensity). Sections were stained with biotinylated rabbit anti-YAP1 antibody (diluted 1:200; ARP50530_P050, Aviva System Biology Cooperation, San Diego, CA, USA) and binding visualized with the avidin-peroxidase solution (ABC kit, Vector, Darmstadt, Germany) followed by DAB staining (Vector). Sections were lightly counterstained with haematoxylin (Merc, Darmstadt, Germany). Pig duodenum sections were used as a positive control. No incubation with primary antibody was used as a negative control.
2.10. Generation of sgRNA Construct
SgRNA construct targeting the ATG site in pig YAP1 was generated by cloning the gRNA oligonucleotides (gRNA_YAP1_1F:5′-GAGGCAGAAACCATGGATCC-3′; gRNA_YAP1_1R: 5′-GGATCCATGGTTTCTGCCTC-3′) into pX330-U6-Chimeric_BB-CBh- SpCas9 vector (Addgene plasmid # 42230; http:/n2t.net/addgene:4223O;RRID:Addgene_42230, accessed on 25 September 2020), which was digested with BbsI restriction enzyme, and cotransfected into pig flTP53R167H OS cells.
2.11. Immunofluorescence Assay
Porcine OS cells (YAP1−/−/flTP53R167H and flTP53R167H/GFP control) were plated on 6 well plates, cultivated till 80% confluency. For fixation, the cells were washed twice with PBS and incubated for 15 min at room temperature in Fixative. Afterward, the cells were washed two times with TBST, permeabilised for 20 min at room temperature with permeabilisation buffer, and blocked for 60 min with 5% BSA. The primary Ki67 antibody (diluted 1:200, MA5-14520, Invitrogen, Waltham, CA, USA) was incubated at 4 °C overnight, afterwards the secondary antibody (Goat Anti-rabbit IgG (H+L) Alexa Fluor Plus 488, diluted 1:300; A32731, Invitrogen) was added and incubated for 60 min at room temperature. 300 nM DAPI (D9564, Sigma) was incubated for 10 min at room temperature (protected from the light). The signal detection was performed under a fluorescence microscope.
2.12. Proliferation Assay
Porcine flTP53R167H OS cells were transfected with gRNA_YAP1 construct by electroporation using the EMC830 electroporation system (BTX). GFP vector was used as a control. Cells were selected by using 200 ng/μL of puromycin for 2 days. After selection and single-cell clone picking, 5 × 10⁵ YAP1−/−/flTP53R167H OS cells were plated on 6-well plates (3 times for each assay). Cells were counted after 24 h, 48 h, 72 h, 96 h, and 120 h of incubation using an automated cell counter (Invitrogen).
2.13. Migration and Invasion Assay
For the migration assays, 1 × 10⁵ OS cells (GFP control, YAP1−/−/flTP53R167H) were plated in the upper chambers of 24-well 8.0 μm transwell inserts (Corning Inc.). For invasion assay, 1 × 10⁵ cells were plated in 10% Matrigel-coated 24-well 8.0 μm transwell inserts (Corning Inc, Corning, NK, USA) Medium with FCS was added at the bottom of each transwell. For migration and invasion, chambers were incubated for 24 h. The medium was removed from 24-well plates and transwell inserts, cells were fixed with methanol and stained with Crystal Violet, washed six times with water, and air-dried overnight. Images were taken by a microscope camera, migration/invasion, and the total number of cells was counted. Each experiment was conducted in triplicate.
2.14. Availability of Data and Materials
This study utilised porcine reference genome 11.1 assembly which is publicly available from the NCBI assembly database.
The RNA sequencing data has been deposited at the European Nucleotide Archive (ENA) of EMBL-EBI (https://www.ebi.ac.uk/ena/, accessed on 24 February 2019) under primary accession number PRJEB30086. All other data generated during this study are included in this article and its additional files.
3. Results
3.1. Frequency of OS in flTP53R167H Pigs
A total of 39 flTP53R167H/+ heterozygous and ten flTP53R167H/R167H homozygous pigs were examined by necropsy. Out of 29 heterozygous animals, 18 developed bone tumours by the age of 36 months and 10 out of 10 homozygous pigs by the age of 16 months, all of which were classified histologically as osteoblastic osteosarcomas, as previously described [34].
3.2. Genome-Wide Allelic Expression Imbalance Analysis of OS
To identify the transcriptome changes in OS, we first compared RNA sequencing data between OS (n = 8) and matched healthy bones from flTP53R167H/R167H homozygous pigs. This analysis didn’t identify any significantly differentially expressed genes (DEGs) after multi-comparison testing (Figure S1). We concluded that the high heterogeneity of OS limited the identification of DEGs and therefore decided to perform allele expression imbalance (AEI) analysis.
In total, we identified 9657 heterozygous SNPs, of which 144 (p < 5.18 × 10⁻⁶, Bonferroni-adjusted significance threshold) showed AEI in OS samples. The most significant AEI (p < 2.73 × 10⁻¹⁹) was found for eight SNPs located on pig chromosomes 6, 9, 14 and 16 (Figure 1A, Table 1). Of these, the SNP:33044172A/G located in the 3′UTR of BIRC3 (Figure 1B) showed the greatest AEI = 0.78 in OS (p = 2.14 × 10−39). In the neighbourhood of BIRC3 is YAP1; both genes are transcribed in the sense direction. YAP1 is an evolutionary conserved transcription cofactor of the Hippo pathway, which regulates the development of organs and is deregulated in many human cancers [45]. Because of the functional relevance, our further analyses focused on the BIRC3-YAP1 locus. By pyrosequencing, we confirmed AEI for the SNP:33044172A/G (0.74 ± 0.12 vs. 0.4 ± 0.05; p = 1.35 × 10⁻⁹; Figure 1C) in a larger cohort (n = 48) of OS samples. Next, we aimed to identify the underlying mechanism by which OS achieved the AEI at this SNP. AEI might be linked to DNA polymorphism or associated with DNA methylation in regulatory regions, or resulting from copy number variations (CNV) in the target gene. The presence of DNA regulatory polymorphisms was searched in BIRC3 (−2000 bp upstream of transcription start site (TSS) on GenBank sequence XM_013979324) and YAP1 (GenBank XM_021062706) promoter regions in OS (n = 8) and adjacent healthy bone samples from flTP53R167H/R167H homozygous pigs. No polymorphism linked to the AEI of 9:33044172 SNP in the analysed promoter regions was found. Subsequently, CpG islands (CGI) (−379 bp to +42 bp) and (–297 bp and +65 bp) were identified in the promoters of BIRC3 and YAP1, respectively. Pyrosequencing of five CpG sites at BIRC3 CGI and eight CpG sites at YAP1 CGI revealed similar DNA methylation (<10% for BIRC3 and <5% for YAP1) in OS (n = 48) and matched healthy bone samples from flTP53R167H pigs (Figure S2). Moreover, the presence of CNVs was analysed using three digital droplet PCR (ddPCR) probes hybridising to the promoter, internal exon and 3′UTR in both genes. No CNV in BIRC3 in analysed OS (n = 48) was found.
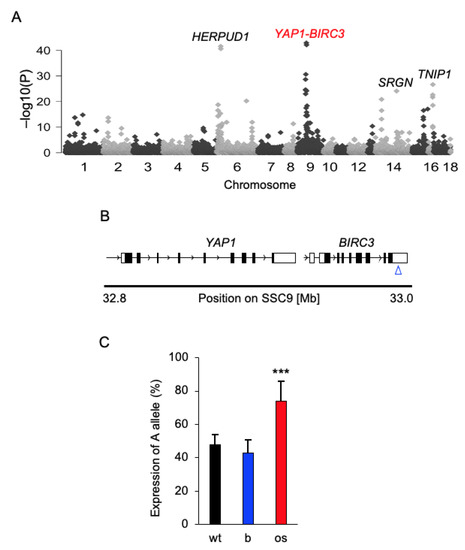
Figure 1.
Genome-wide allelic expression imbalance analysis in osteosarcoma. (A) A Manhattan plot showing the result of the genome-wide allelic imbalance analysis. The most significant SNPs were found on pig chromosomes 6, 9, 14 and 16. (B) Schematic genomic structure of the YAP1-BIRC3 locus on chromosome 9 in pigs. The blue arrow indicates the position of the 9:33044172 A/G SNP in the 3′UTR of BIRC3. (C) cDNA pyrosequencing result for the SNP 9:33044172 A/G in osteosarcoma (os, n = 48) and matched healthy bone (b) samples collected from flTP53R167H pigs. To test analysis the validity of the pyrosequencing assay, we used DNA samples (n = 5) extracted from wild-type pigs. *** p < 0.001.

Table 1.
The DNA variants showing the most significant allelic expression imbalance in OS.
In the YAP1, copy number ranged from 1 to 68 and was highly associated (n = 48; p = 1.76 × 10⁻⁸) with the AEI of 9:33044172A/G SNP (Figure 2A). The increased copy number of YAP1 correlated with higher expression of the 9:33044172 A allele. Two copies of the YAP1 were observed in wild-type and healthy bone samples of flTP53R167H pigs. The expression of the 9:33044172 A allele (Figure 2B) and copy number of YAP1 (Figure 2C) were positively correlated with the size (ranged 1.5–18 cm) of pig OS. Quantitative PCR (qPCR) and western blot analyses revealed an increased mRNA (n = 48; 1.8- fold, p < 0.01; Figure 2D) and protein (n = 16; 7.7- fold, p < 0.0001; Figure 2E) expression in OS compared to adjacent healthy bone samples. The immunostaining showed that YAP1 protein is expressed in the nucleus of pig OS (Figure 2F, Figure S3). Remarkable, no significant differential YAP1 mRNA expression in the RNA sequencing study was found. A detailed analysis of RNA sequencing data showed only 1.8- fold expression difference of YAP1 between the OS and healthy bone samples, which was below the two-fold threshold applied.
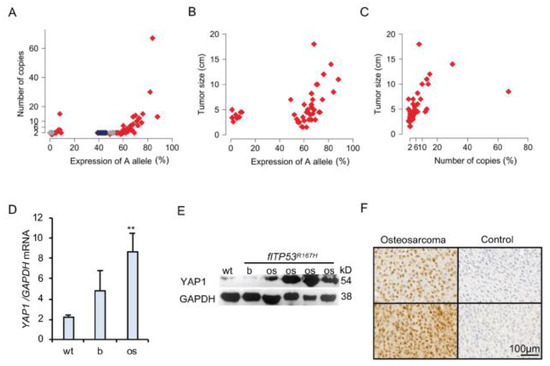
Figure 2.
YAP1 amplification in p53 deficient osteosarcoma. (A) Point plot showing the correlation between 9:33044172 A allele expression and YAP1 copy number. Gray and red points show expression of A allele in bone and OS samples, respectively. Blue points show the measurements in wild-type samples. (B) Point plot showing the correlation between 9:33044172 A allele expression and OS (n = 48) size. (C) Point plot showing the correlation between YAP1 copy number and OS (n = 48) size. (D) Quantitative PCR of YAP1 mRNA expression in wild type (wt, n = 5) bones, as well as OS (n = 48) and matched healthy bone samples from flTP53R167H pigs. (E) Representative Western blot showing YAP1 expression in wild type bone, OS and healthy bone samples from flTP53R167H pigs. The uncropped Western blots have been shown in Figure S4. (F) Immunohistochemistry staining showing the nuclear location of YAP1 in sections of osteosarcoma from flTP53R167H pigs. Control samples show staining without the first antibody. Scale bars- 100 μm. (** p < 0.01)
Together, these results suggested that the YAP1 amplification is responsible for the AEI of 9:33044172 A/G SNP and plays an important role in the growth of OS in flTP53R167H pigs.
3.3. YAP1 Deficiency Affects the Functional Properties of flTP53R167H OS Cells
To explore the functional impact of YAP1 knockout on p53-dependent bone tumorigenesis, a CRISPR-Cas9 system was used for targeting the ATG site of YAP1 in OS primary cells from flTP53R167H homozygous pigs. Sanger sequencing of the edited OS cells revealed a deletion of 22 nucleotides (+1bp to 22bp; GenBank NC_010451) (Figure 3A), which resulted in a loss of YAP1 expression (Figure 3B). The YAP1−/−/flTP53R167H OS cells showed rounded cell morphology (Figure 3C) compared to normal spindle-shaped OS morphology, reduced proliferation (Figure 3D), migration (Figure 3E,F), invasion (Figure 3E,G), and Ki67 expression (Figure 3H,I) compared to flTP53R167H OS cells. These data confirmed the importance of YAP1 expression for the p53-dependent progression of OS.
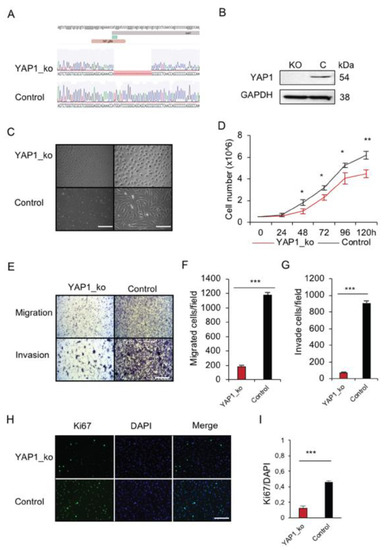
Figure 3.
In vitro functional analysis of YAP1 deficiency in p53 deficient primary osteosarcoma cells. (A) Sequence analysis showing the result of CRISPR/Cas9 editing of YAP1 in pig OS cells. (B) Western blot showing the lack of YAP1 protein in the edited flTP53R167H OS cells. (C) Representative microscopic view showing the morphology of YAP1−/−/flTP53R167H OS cells. As a control, flTP53R167H OS cells were transfected with the GFP control vector (left scale bars, 400μm; right scale bars, 200 μm) (D) Proliferation result for YAP1−/−/flTP53R167H and flTP53R167H OS cells. (E) Representative microscopic images showing a difference in migration and invasion between YAP1−/−/flTP53R167H and flTP53R167H OS cells (scale bars, 200 μm). Quantitative measurement of migration (F) and invasion (G). (H) Immunofluorescence staining for Ki67 and DAPI in YAP1−/−/flTP53R167H and flTP53R167H OS cells. (I) Quantification rates of the Ki67 positive cells. * p < 0.05, ** p < 0.01, *** p < 0.001.
3.4. YAP1 Deficiency Leads to Upregulation of p16 and Rb1 and Downregulation of TP63 in flTP53R167H OS Cells
Further, the effect of YAP1 deficiency on the expression of tumorigenesis-related genes (Rb1, WRAP53, TP53INP1, p14, p16, TP63, TP73) was studied. RT-PCR and qRT-PCR analyses revealed upregulation of p16 and Rb1 (2- fold) and downregulation of TP63 in YAP1−/−/flTP53R167H compared to flTP53R167H pig OS cells (Figure 4A,B). The downregulation of p63 was confirmed by Western blot (Figure 4C). In summary, the flTP53R167H OS cells expressed TP63 but not p16, while the knockout of YAP1 resulted in the silencing of p63 and reconstruction of p16 (Figure 4A,C).
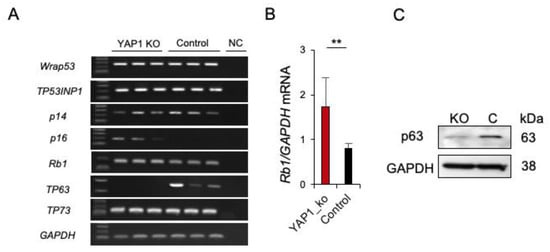
Figure 4.
Expression of p53 related genes in YAP1−/−/flTP53R167H OS cells. (A) RT-PCR result for WRAP53, TP53INP1, p14, p16, RB1, TP63, TP73 in YAP1−/−/flTP53R167H and flTP53R167H OS cells. Three independent transfections for each expression vector were performed. NC—negative control. (B) Quantitative RT-PCR of p16 mRNA expression. GAPDH mRNA expression was used as a reference. ** p < 0.01. (C) Western blot showing lack of p63 expression in YAP1−/−/flTP53R167H OS cells.
We then investigated whether the upregulation of p16 and Rb1 in YAP1−/−/flTP53R167H primary OS cells is associated with DNA methylation in the promoter regions of these genes. Using in silico analysis, genomic regions up to −2000bp from the putative transcription start site (TSS) were analysed and CGI at position −132bp to +108bp (GenBank NC_010443) in p16, and at position −210bp to −65bp (GenBank NC_010453) in Rb1 promoters were identified. Within these CGIs, methylation at 8 CpG sites in p16 and 9 CpG sites in Rb1 promoters in YAP1−/−/flTP53R167H (n = 3) and flTP53R167H pig OS (n = 3) cell lines was measured by pyrosequencing. For p16, 6 of 8 CpG sites showed significantly (p < 0.05) lower methylation in YAP1−/−/flTP53R167H compared to flTP53R167H pig OS cells (Figure 5A). Specifically, lower methylation was found at the CpG2 site (25% vs. 33%), CpG3 (6% vs. 59%), CpG4 (17% v 49%), CpG6 (42% vs. 49%), CpG7 (27% vs. 83%), and CpG8 (57% vs. 91%). For Rb1, the observed methylation differences were only slightly lower in YAP1−/−/flTP53R167H compared to flTP53R167H pig OS cells (Figure 5B). The methylation of the p16 promoter appeared to be correlated with its gene expression in YAP1−/−/flTP53R167H OS cells.
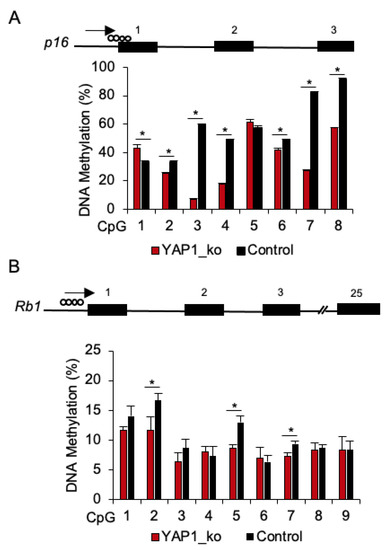
Figure 5.
DNA methylation analysis of the p16 and Rb1 promoter regions in YAP1−/−/flTP53R167H OS cells. (A) Pyrosequencing result at 8 CpG sites in the p16 promoter region in YAP1−/−/flTP53R167H (n = 3) and flTP53R167H (n = 3) OS cells. (B) Pyrosequencing result at 9 CpG sites in the Rb1 promoter region in YAP1−/−/flTP53R167H (n = 3) and flTP53R167H (n = 3) OS cells. * p < 0.05.
4. Discussion
Several next-generation sequencing studies have been performed to identify driver mutations in human OS [9,46,47]. These studies have detected either well-known cancer driver genes such as TP53, RB1, BRCA1, PTEN, ATRX, or likely passenger mutations [48].
In this work, we utilised the allele-specific expression analysis to reduce the impact of the tumoral heterogeneity on the gene expression and demonstrated the role of YAP1 amplification in OS progression in p53-deficient pigs. The YAP1 amplification led to an overexpression of nuclear YAP1 and correlated with OS progression. This finding is consistent with studies showing an increased expression of YAP1 associated with poor prognosis and chemical resistance in human OS [49,50]. Notably, the downregulation of YAP1 reduced the oncogenic potential of human OS cells [16,51].
Multiple mechanisms, such as the TEAD1 signalling pathway [52], an overexpression of Hedgehog (Hh) [51], suppression by miR-1285-3p [53], and circFAT1 [54] are involved in the regulation of YAP1 in tumours. Here, we show that YAP1 expression is associated with its gene amplification in p53-dependent OS. The amplification of YAP1 has been detected in different cancers including medulloblastoma [55], metastatic brain cancer [56] and oesophageal squamous cell carcinoma [57]. The coregulation of p53 and YAP1 has been reported in pancreatic cancer (PDAC) where p53-deficiency promoted YAP1 activity [58,59]. Moreover, YAP1 deletion blocked PDAC initiation driven by KRAS and p53 mutations [60]. In this study, we showed that YAP1 deficiency reduces the tumorigenic potential of p53 deficient OS cells.
We recently identified a mutant R167H-Δ152p53 isoform in flTP53R167H pigs, which is overexpressed in OS [34]. The cooperative role for the p53 pathway and YAP1 in mediating the tumorigenesis has been reported, reviewed in [61]. YAP1 interacts with mutant p53, including the R175H mutation and induces the expression of several pro-oncogenic genes [62]. Also, the nuclear localisation and activity of YAP1 are dependent on p53. While tumours with wild-type TP53 showed a lack of YAP1 nuclear localisation in pancreatic cancer [58], a loss of p53 in mutant KRASG12D lung cancer leads to increased YAP1 nuclear localisation [63]. We showed a high activity of nuclear YAP1 in OS from flTP53R167H pigs. Importantly, the nuclear YAP1 localisation is negatively associated with survival in OS patients [50]. These findings suggest an interaction between mutant p53 isoform and YAP1 in pig OS.
YAP1 physically interacts with p53 family members, p63, p73 [61], and regulates the p53/Rb1/p16 dependent cellular senescence [64]. The ΔNp63 isoform regulates translocation of YAP1 in squamous carcinoma [65] and in response to DNA damage. YAP1 functions also as a transcriptional coactivator of p73-mediated apoptosis [66]. In line with this data, we found that knockout of YAP1 silences p63 and upregulates p16 in p53-deficient OS cells. In addition, YAP1 deletion reduced the p16 promoter methylation. YAP1 functions as a key transcriptional regulator of multiple metabolic pathways including the synthesis of compounds such as S-adenosyl methionine (SAM) needed for DNA methylation. A previous study showed that YAP1 deletion downregulated SAM in primary pancreatic tumour cells [59].
5. Conclusions
Given the difficulties in restoring the wild-type function of p53 in cancer, YAP1 is potentially the central target for drug development to treat the oncogenic YAP/Hippo-p53 signalling. However, the complex interaction between p53 family members and YAP/Hippo pathway is still not fully understood. Recent studies have proven the importance of genetically engineered pigs as an animal model in oncology [67,68,69,70]. By using flTP53R167H pigs, we identified the role of YAP1 in the progression of p53- dependent OS. This study confirms the importance of p53/YAP1 network in cancer.
Supplementary Materials
The following are available online at https://www.mdpi.com/2072-6694/13/6/1364/s1, Table S1: List of primers used in the study, Figure S1: Heatmap of the top 20 differentially expressed genes in OS and partially matched healthy bone samples from flTP53R167H/R167H pigs, Figure S2: DNA Methylation of the BIRC3 promoter in OS and matched healthy control tissues, Figure S3: Immunostaining of YAP1 in OS samples, Figure S4: Unprocessed western blots.
Author Contributions
K.F. and A.E.S. designed the study; G.N., M.N., A.B., Y.Z., and T.F. carried out molecular experiments; K.F. and G.N. collected samples; H.P. performed statistical analysis; K.F., G.N., M.N., and A.E.S. wrote the manuscript with contributions from other authors. All authors have read and agreed to the published version of the manuscript.
Funding
This work was supported by the German Research Foundation grants nos. SCHN 971/3-2, SFB1321 and China Scholarship Council (CSC).
Institutional Review Board Statement
The study was performed according to the German Animal Welfare Act and European Union Normative for Care and Use of Experimental Animals and approved by the Government of Upper Bavaria (permit number 55.2-1-54-2532-6-13).
Informed Consent Statement
Not applicable.
Data Availability Statement
Data is contained within the article or supplementary material.
Acknowledgments
The authors thank Johanna Tebbing and IIka Simons for assistance with molecular biology, Steffen and Viola Löbnitz, Gerhard Kammermeier, Konrad Praller and Andres Sohn for animal husbandry.
Conflicts of Interest
The authors declare that they have no known competing financial interest or personal relationship that could have appeared to influence the work reported in this paper.
References
- Zambo, I.; Vesely, K. [WHO classification of tumours of soft tissue and bone 2013: The main changes compared to the 3rd edition]. Cesk. Patol. 2014, 50, 64–70. [Google Scholar] [PubMed]
- Kansara, M.; Teng, M.W.; Smyth, M.J.; Thomas, D.M. Translational biology of osteosarcoma. Nat. Rev. Cancer 2014, 14, 722–735. [Google Scholar] [CrossRef]
- Durfee, R.A.; Mohammed, M.; Luu, H.H. Review of Osteosarcoma and Current Management. Rheumatol. Ther. 2016, 3, 221–243. [Google Scholar] [CrossRef]
- Janeway, K.A.; Barkauskas, D.A.; Krailo, M.D.; Meyers, P.A.; Schwartz, C.L.; Ebb, D.H.; Seibel, N.L.; Grier, H.E.; Gorlick, R.; Marina, N. Outcome for adolescent and young adult patients with osteosarcoma: A report from the Children’s Oncology Group. Cancer 2012, 118, 4597–4605. [Google Scholar] [CrossRef]
- Pritchard-Jones, K.; Kaatsch, P.; Steliarova-Foucher, E.; Stiller, C.A.; Coebergh, J.W. Cancer in children and adolescents in Europe: Developments over 20 years and future challenges. Eur. J. Cancer 2006, 42, 2183–2190. [Google Scholar] [CrossRef] [PubMed]
- Cotterill, S.J.; Wright, C.M.; Pearce, M.S.; Craft, A.W.; UKCCSG/MRC Bone Tumour Working Group. Stature of young people with malignant bone tumors. Pediatr. Blood Cancer 2004, 42, 59–63. [Google Scholar] [CrossRef] [PubMed]
- Logue, J.P.; Cairnduff, F. Radiation induced extraskeletal osteosarcoma. Br. J. Radiol. 1991, 64, 171–172. [Google Scholar] [CrossRef]
- Le Vu, B.; de Vathaire, F.; Shamsaldin, A.; Hawkins, M.M.; Grimaud, E.; Hardiman, C.; Diallo, I.; Vassal, G.; Bessa, E.; Campbell, S.; et al. Radiation dose, chemotherapy and risk of osteosarcoma after solid tumours during childhood. Int. J. Cancer 1998, 77, 370–377. [Google Scholar] [CrossRef]
- Chen, X.; Bahrami, A.; Pappo, A.; Easton, J.; Dalton, J.; Hedlund, E.; Ellison, D.; Shurtleff, S.; Wu, G.; Wei, L.; et al. Recurrent somatic structural variations contribute to tumorigenesis in pediatric osteosarcoma. Cell Rep. 2014, 7, 104–112. [Google Scholar] [CrossRef] [PubMed]
- Wunder, J.S.; Gokgoz, N.; Parkes, R.; Bull, S.B.; Eskandarian, S.; Davis, A.M.; Beauchamp, C.P.; Conrad, E.U.; Grimer, R.J.; Healey, J.H.; et al. TP53 mutations and outcome in osteosarcoma: A prospective, multicenter study. J. Clin. Oncol. 2005, 23, 1483–1490. [Google Scholar] [CrossRef]
- Lonardo, F.; Ueda, T.; Huvos, A.G.; Healey, J.; Ladanyi, M. p53 and MDM2 alterations in osteosarcomas: Correlation with clinicopathologic features and proliferative rate. Cancer 1997, 79, 1541–1547. [Google Scholar] [CrossRef]
- Toguchida, J.; Ishizaki, K.; Sasaki, M.S.; Nakamura, Y.; Ikenaga, M.; Kato, M.; Sugimot, M.; Kotoura, Y.; Yamamuro, T. Preferential mutation of paternally derived RB gene as the initial event in sporadic osteosarcoma. Nature 1989, 338, 156–158. [Google Scholar] [CrossRef]
- Behjati, S.; Tarpey, P.S.; Haase, K.; Ye, H.; Young, M.D.; Alexandrov, L.B.; Farndon, S.J.; Collord, G.; Wedge, D.C.; Martincorena, I.; et al. Recurrent mutation of IGF signalling genes and distinct patterns of genomic rearrangement in osteosarcoma. Nat. Commun. 2017, 8, 15936. [Google Scholar] [CrossRef]
- Selvarajah, S.; Yoshimoto, M.; Ludkovski, O.; Park, P.C.; Bayani, J.; Thorner, P.; Maire, G.; Squire, J.A.; Zielenska, M. Genomic signatures of chromosomal instability and osteosarcoma progression detected by high resolution array CGH and interphase FISH. Cytogenet. Genome Res. 2008, 122, 5–15. [Google Scholar] [CrossRef]
- Bayani, J.; Selvarajah, S.; Maire, G.; Vukovic, B.; Al-Romaih, K.; Zielenska, M.; Squire, J.A. Genomic mechanisms and measurement of structural and numerical instability in cancer cells. Semin. Cancer Biol. 2007, 17, 5–18. [Google Scholar] [CrossRef]
- Atiye, J.; Wolf, M.; Kaur, S.; Monni, O.; Bohling, T.; Kivioja, A.; Tas, E.; Serra, M.; Tarkkanen, M.; Knuutila, S. Gene amplifications in osteosarcoma-CGH microarray analysis. Genes Chrom. Cancer 2005, 42, 158–163. [Google Scholar] [CrossRef] [PubMed]
- Sadikovic, B.; Yoshimoto, M.; Chilton-MacNeill, S.; Thorner, P.; Squire, J.A.; Zielenska, M. Identification of interactive networks of gene expression associated with osteosarcoma oncogenesis by integrated molecular profiling. Hum. Mol. Genet. 2009, 18, 1962–1975. [Google Scholar] [CrossRef] [PubMed]
- Kuijjer, M.L.; Hogendoorn, P.C.; Cleton-Jansen, A.M. Genome-wide analyses on high-grade osteosarcoma: Making sense of a genomically most unstable tumor. Int. J. Cancer 2013, 133, 2512–2521. [Google Scholar] [CrossRef] [PubMed]
- Ognjanovic, S.; Olivier, M.; Bergemann, T.L.; Hainaut, P. Sarcomas in TP53 germline mutation carriers: A review of the IARC TP53 database. Cancer 2012, 118, 1387–1396. [Google Scholar] [CrossRef] [PubMed]
- Srivastava, S.; Wang, S.; Tong, Y.A.; Pirollo, K.; Chang, E.H. Several mutant p53 proteins detected in cancer-prone families with Li-Fraumeni syndrome exhibit transdominant effects on the biochemical properties of the wild-type p53. Oncogene 1993, 8, 2449–2456. [Google Scholar]
- Mutsaers, A.J.; Ng, A.J.; Baker, E.K.; Russell, M.R.; Chalk, A.M.; Wall, M.; Liddicoat, B.J.; Ho, P.W.; Slavin, J.L.; Goradia, A.; et al. Modeling distinct osteosarcoma subtypes in vivo using Cre:lox and lineage-restricted transgenic shRNA. Bone 2013, 55, 166–178. [Google Scholar] [CrossRef] [PubMed]
- Guijarro, M.V.; Ghivizzani, S.C.; Gibbs, C.P. Animal models in osteosarcoma. Front. Oncol. 2014, 4, 189. [Google Scholar] [CrossRef] [PubMed]
- Leuchs, S.; Saalfrank, A.; Merkl, C.; Flisikowska, T.; Edlinger, M.; Durkovic, M.; Rezaei, N.; Kurome, M.; Zakhartchenko, V.; Kessler, B.; et al. Inactivation and inducible oncogenic mutation of p53 in gene targeted pigs. PLoS ONE 2012, 7, e43323. [Google Scholar] [CrossRef]
- Liu, D.P.; Song, H.; Xu, Y. A common gain of function of p53 cancer mutants in inducing genetic instability. Oncogene 2010, 29, 949–956. [Google Scholar] [CrossRef]
- Saalfrank, A.; Janssen, K.P.; Ravon, M.; Flisikowski, K.; Eser, S.; Steiger, K.; Flisikowska, T.; Muller-Fliedner, P.; Schulze, E.; Bronner, C.; et al. A porcine model of osteosarcoma. Oncogenesis 2016, 5, e210. [Google Scholar] [CrossRef]
- Montgomery, S.B.; Sammeth, M.; Gutierrez-Arcelus, M.; Lach, R.P.; Ingle, C.; Nisbett, J.; Guigo, R.; Dermitzakis, E.T. Transcriptome genetics using second generation sequencing in a Caucasian population. Nature 2010, 464, 773–777. [Google Scholar] [CrossRef] [PubMed]
- Lappalainen, T.; Sammeth, M.; Friedlander, M.R.; t Hoen, P.A.; Monlong, J.; Rivas, M.A.; Gonzalez-Porta, M.; Kurbatova, N.; Griebel, T.; Ferreira, P.G.; et al. Transcriptome and genome sequencing uncovers functional variation in humans. Nature 2013, 501, 506–511. [Google Scholar] [CrossRef]
- Pickrell, J.K.; Marioni, J.C.; Pai, A.A.; Degner, J.F.; Engelhardt, B.E.; Nkadori, E.; Veyrieras, J.B.; Stephens, M.; Gilad, Y.; Pritchard, J.K. Understanding mechanisms underlying human gene expression variation with RNA sequencing. Nature 2010, 464, 768–772. [Google Scholar] [CrossRef]
- Castel, S.E.; Levy-Moonshine, A.; Mohammadi, P.; Banks, E.; Lappalainen, T. Tools and best practices for data processing in allelic expression analysis. Genome Biol. 2015, 16, 195. [Google Scholar] [CrossRef]
- Liu, Z.; Dong, X.; Li, Y. A Genome-Wide Study of Allele-Specific Expression in Colorectal Cancer. Front. Genet. 2018, 9, 570. [Google Scholar] [CrossRef]
- Pastinen, T. Genome-wide allele-specific analysis: Insights into regulatory variation. Nat Rev Genet 2010, 11, 533–538. [Google Scholar] [CrossRef]
- Chen, X.; Weaver, J.; Bove, B.A.; Vanderveer, L.A.; Weil, S.C.; Miron, A.; Daly, M.B.; Godwin, A.K. Allelic imbalance in BRCA1 and BRCA2 gene expression is associated with an increased breast cancer risk. Hum. Mol. Genet. 2008, 17, 1336–1348. [Google Scholar] [CrossRef]
- Palin, K.; Pitkanen, E.; Turunen, M.; Sahu, B.; Pihlajamaa, P.; Kivioja, T.; Kaasinen, E.; Valimaki, N.; Hanninen, U.A.; Cajuso, T.; et al. Contribution of allelic imbalance to colorectal cancer. Nat. Commun. 2018, 9, 3664. [Google Scholar] [CrossRef]
- Niu, G.; Hellmuth, I.; Flisikowska, T.; Pausch, H.; Rieblinger, B.; Carrapeiro, A.; Schade, B.; Bohm, B.; Kappe, E.; Fischer, K.; et al. Porcine model elucidates function of p53 isoform in carcinogenesis and reveals novel circTP53 RNA. Oncogene 2021, 40, 1896–1908. [Google Scholar] [CrossRef]
- Flisikowska, T.; Stachowiak, M.; Xu, H.; Wagner, A.; Hernandez-Caceres, A.; Wurmser, C.; Perleberg, C.; Pausch, H.; Perkowska, A.; Fischer, K.; et al. Porcine familial adenomatous polyposis model enables systematic analysis of early events in adenoma progression. Sci. Rep. 2017, 7, 6613. [Google Scholar] [CrossRef]
- Bray, N.L.; Pimentel, H.; Melsted, P.; Pachter, L. Near-optimal probabilistic RNA-seq quantification. Nat. Biotechnol. 2016, 34, 525–527. [Google Scholar] [CrossRef] [PubMed]
- Pimentel, H.; Bray, N.L.; Puente, S.; Melsted, P.; Pachter, L. Differential analysis of RNA-seq incorporating quantification uncertainty. Nat. Methods 2017, 14, 687–690. [Google Scholar] [CrossRef] [PubMed]
- Warnes, G.R.; Bolker, B.; Bonebakker, L.; Genteman, R.; Liaw, W.H.A.; Lumley, T.; Maechler, M.; Magnusson, A.; Moeller, S.; Schwartz, M.; et al. gplots: Various R Programming Tools for Plotting Data. 2016. Available online: https://CRAN.R-project.org/package=gplots (accessed on 28 March 2019).
- McKenna, A.; Hanna, M.; Banks, E.; Sivachenko, A.; Cibulskis, K.; Kernytsky, A.; Garimella, K.; Altshuler, D.; Gabriel, S.; Daly, M.; et al. The Genome Analysis Toolkit: A MapReduce framework for analyzing next-generation DNA sequencing data. Genome Res. 2010, 20, 1297–1303. [Google Scholar] [CrossRef] [PubMed]
- DePristo, M.A.; Banks, E.; Poplin, R.; Garimella, K.V.; Maguire, J.R.; Hartl, C.; Philippakis, A.A.; del Angel, G.; Rivas, M.A.; Hanna, M.; et al. A framework for variation discovery and genotyping using next-generation DNA sequencing data. Nat. Genet. 2011, 43, 491–498. [Google Scholar] [CrossRef]
- Van der Auwera, G.A.; Carneiro, M.O.; Hartl, C.; Poplin, R.; Del Angel, G.; Levy-Moonshine, A.; Jordan, T.; Shakir, K.; Roazen, D.; Thibault, J.; et al. From FastQ data to high confidence variant calls: The Genome Analysis Toolkit best practices pipeline. Curr. Protoc. Bioinform. 2013, 43, 11.10.1–11.10.33. [Google Scholar] [CrossRef]
- Subramanian, A.; Tamayo, P.; Mootha, V.K.; Mukherjee, S.; Ebert, B.L.; Gillette, M.A.; Paulovich, A.; Pomeroy, S.L.; Golub, T.R.; Lander, E.S.; et al. Gene set enrichment analysis: A knowledge-based approach for interpreting genome-wide expression profiles. Proc. Natl. Acad. Sci. USA 2005, 102, 15545–15550. [Google Scholar] [CrossRef]
- Liberzon, A.; Birger, C.; Thorvaldsdottir, H.; Ghandi, M.; Mesirov, J.P.; Tamayo, P. The Molecular Signatures Database (MSigDB) hallmark gene set collection. Cell Syst. 2015, 1, 417–425. [Google Scholar] [CrossRef] [PubMed]
- Rieblinger, B.; Fischer, K.; Kind, A.; Saller, B.S.; Baars, W.; Schuster, M.; Wolf-van Buerck, L.; Schaffler, A.; Flisikowska, T.; Kurome, M.; et al. Strong xenoprotective function by single-copy transgenes placed sequentially at a permissive locus. Xenotransplantation 2018, 25, e12382. [Google Scholar] [CrossRef]
- Yu, F.X.; Zhao, B.; Guan, K.L. Hippo Pathway in Organ Size Control, Tissue Homeostasis, and Cancer. Cell 2015, 163, 811–828. [Google Scholar] [CrossRef]
- Kovac, M.; Blattmann, C.; Ribi, S.; Smida, J.; Mueller, N.S.; Engert, F.; Castro-Giner, F.; Weischenfeldt, J.; Kovacova, M.; Krieg, A.; et al. Exome sequencing of osteosarcoma reveals mutation signatures reminiscent of BRCA deficiency. Nat. Commun. 2015, 6, 8940. [Google Scholar] [CrossRef]
- Reimann, E.; Koks, S.; Ho, X.D.; Maasalu, K.; Martson, A. Whole exome sequencing of a single osteosarcoma case--integrative analysis with whole transcriptome RNA-seq data. Hum. Genom. 2014, 8, 20. [Google Scholar] [CrossRef]
- Rickel, K.; Fang, F.; Tao, J. Molecular genetics of osteosarcoma. Bone 2017, 102, 69–79. [Google Scholar] [CrossRef] [PubMed]
- Wang, D.Y.; Wu, Y.N.; Huang, J.Q.; Wang, W.; Xu, M.; Jia, J.P.; Han, G.; Mao, B.B.; Bi, W.Z. Hippo/YAP signaling pathway is involved in osteosarcoma chemoresistance. Chin. J. Cancer 2016, 35, 47. [Google Scholar] [CrossRef] [PubMed]
- Bouvier, C.; Macagno, N.; Nguyen, Q.; Loundou, A.; Jiguet-Jiglaire, C.; Gentet, J.C.; Jouve, J.L.; Rochwerger, A.; Mattei, J.C.; Bouvard, D.; et al. Prognostic value of the Hippo pathway transcriptional coactivators YAP/TAZ and beta1-integrin in conventional osteosarcoma. Oncotarget 2016, 7, 64702–64710. [Google Scholar] [CrossRef]
- Chan, L.H.; Wang, W.; Yeung, W.; Deng, Y.; Yuan, P.; Mak, K.K. Hedgehog signaling induces osteosarcoma development through Yap1 and H19 overexpression. Oncogene 2014, 33, 4857–4866. [Google Scholar] [CrossRef]
- Chai, J.; Xu, S.; Guo, F. TEAD1 mediates the oncogenic activities of Hippo-YAP1 signaling in osteosarcoma. Biochem. Biophys. Res. Commun. 2017, 488, 297–302. [Google Scholar] [CrossRef] [PubMed]
- Hu, X.H.; Dai, J.; Shang, H.L.; Zhao, Z.X.; Hao, Y.D. miR-1285-3p is a potential prognostic marker in human osteosarcoma and functions as a tumor suppressor by targeting YAP1. Cancer Biom. 2019, 25, 1–10. [Google Scholar] [CrossRef]
- Liu, G.; Huang, K.; Jie, Z.; Wu, Y.; Chen, J.; Chen, Z.; Fang, X.; Shen, S. CircFAT1 sponges miR-375 to promote the expression of Yes-associated protein 1 in osteosarcoma cells. Mol. Cancer 2018, 17, 170. [Google Scholar] [CrossRef]
- Fernandez, L.A.; Northcott, P.A.; Dalton, J.; Fraga, C.; Ellison, D.; Angers, S.; Taylor, M.D.; Kenney, A.M. YAP1 is amplified and up-regulated in hedgehog-associated medulloblastomas and mediates Sonic hedgehog-driven neural precursor proliferation. Genes Dev. 2009, 23, 2729–2741. [Google Scholar] [CrossRef] [PubMed]
- Shih, D.J.H.; Nayyar, N.; Bihun, I.; Dagogo-Jack, I.; Gill, C.M.; Aquilanti, E.; Bertalan, M.; Kaplan, A.; D’Andrea, M.R.; Chukwueke, U.; et al. Genomic characterization of human brain metastases identifies drivers of metastatic lung adenocarcinoma. Nat. Genet. 2020, 52, 371–377. [Google Scholar] [CrossRef]
- Dai, H.; Shao, Y.W.; Tong, X.; Wu, X.; Pang, J.; Feng, A.; Yang, Z. YAP1 amplification as a prognostic factor of definitive chemoradiotherapy in nonsurgical esophageal squamous cell carcinoma. Cancer Med. 2020, 9, 1628–1637. [Google Scholar] [CrossRef]
- Mello, S.S.; Valente, L.J.; Raj, N.; Seoane, J.A.; Flowers, B.M.; McClendon, J.; Bieging-Rolett, K.T.; Lee, J.; Ivanochko, D.; Kozak, M.M.; et al. A p53 Super-tumor Suppressor Reveals a Tumor Suppressive p53-Ptpn14-Yap Axis in Pancreatic Cancer. Cancer Cell 2017, 32, 460–473 e466. [Google Scholar] [CrossRef] [PubMed]
- Murakami, S.; Nemazanyy, I.; White, S.M.; Chen, H.; Nguyen, C.D.K.; Graham, G.T.; Saur, D.; Pende, M.; Yi, C. A Yap-Myc-Sox2-p53 Regulatory Network Dictates Metabolic Homeostasis and Differentiation in Kras-Driven Pancreatic Ductal Adenocarcinomas. Dev. Cell 2019, 51, 113–128 e119. [Google Scholar] [CrossRef] [PubMed]
- Zhang, W.; Nandakumar, N.; Shi, Y.; Manzano, M.; Smith, A.; Graham, G.; Gupta, S.; Vietsch, E.E.; Laughlin, S.Z.; Wadhwa, M.; et al. Downstream of mutant KRAS, the transcription regulator YAP is essential for neoplastic progression to pancreatic ductal adenocarcinoma. Sci. Signal 2014, 7, ra42. [Google Scholar] [CrossRef] [PubMed]
- Raj, N.; Bam, R. Reciprocal Crosstalk Between YAP1/Hippo Pathway and the p53 Family Proteins: Mechanisms and Outcomes in Cancer. Front. Cell Dev. Biol. 2019, 7, 159. [Google Scholar] [CrossRef] [PubMed]
- Di Agostino, S.; Sorrentino, G.; Ingallina, E.; Valenti, F.; Ferraiuolo, M.; Bicciato, S.; Piazza, S.; Strano, S.; Del Sal, G.; Blandino, G. YAP enhances the pro-proliferative transcriptional activity of mutant p53 proteins. EMBO Rep. 2016, 17, 188–201. [Google Scholar] [CrossRef] [PubMed]
- Mao, Y.; Sun, S.; Irvine, K.D. Role and regulation of Yap in KrasG12D-induced lung cancer. Oncotarget 2017, 8, 110877–110889. [Google Scholar] [CrossRef] [PubMed]
- Xie, Q.; Chen, J.; Feng, H.; Peng, S.; Adams, U.; Bai, Y.; Huang, L.; Li, J.; Huang, J.; Meng, S.; et al. YAP/TEAD-mediated transcription controls cellular senescence. Cancer Res. 2013, 73, 3615–3624. [Google Scholar] [CrossRef] [PubMed]
- Saladi, S.V.; Ross, K.; Karaayvaz, M.; Tata, P.R.; Mou, H.; Rajagopal, J.; Ramaswamy, S.; Ellisen, L.W. ACTL6A Is Co-Amplified with p63 in Squamous Cell Carcinoma to Drive YAP Activation, Regenerative Proliferation, and Poor Prognosis. Cancer Cell 2017, 31, 35–49. [Google Scholar] [CrossRef]
- Strano, S.; Monti, O.; Pediconi, N.; Baccarini, A.; Fontemaggi, G.; Lapi, E.; Mantovani, F.; Damalas, A.; Citro, G.; Sacchi, A.; et al. The transcriptional coactivator Yes-associated protein drives p73 gene-target specificity in response to DNA Damage. Mol. Cell 2005, 18, 447–459. [Google Scholar] [CrossRef]
- Flisikowska, T.; Kind, A.; Schnieke, A. Pigs as models of human cancers. Theriogenology 2016, 86, 433–437. [Google Scholar] [CrossRef]
- Kalla, D.; Kind, A.; Schnieke, A. Genetically Engineered Pigs to Study Cancer. Int. J. Mol. Sci. 2020, 21, 488. [Google Scholar] [CrossRef]
- Rogalla, S.; Flisikowski, K.; Gorpas, D.; Mayer, A.T.; Flisikowska, T.; Mandella, M.J.; Ma, X.; Casey, K.M.; Felt, S.A.; Saur, D.; et al. Biodegradable fluorescent nanoparticles for endoscopic detection of colorectal carcinogenesis. Adv. Funct. Mater. 2019, 29. [Google Scholar] [CrossRef]
- Yim, J.J.; Harmsen, S.; Flisikowski, K.; Flisikowska, T.; Namkoong, H.; Garland, M.; van den Berg, N.S.; Vilches-Moure, J.G.; Schnieke, A.; Saur, D.; et al. A protease-activated, near-infrared fluorescent probe for early endoscopic detection of premalignant gastrointestinal lesions. Proc. Natl. Acad. Sci. USA 2021, 118. [Google Scholar] [CrossRef]


Publisher’s Note: MDPI stays neutral with regard to jurisdictional claims in published maps and institutional affiliations. |
© 2021 by the authors. Licensee MDPI, Basel, Switzerland. This article is an open access article distributed under the terms and conditions of the Creative Commons Attribution (CC BY) license (http://creativecommons.org/licenses/by/4.0/).