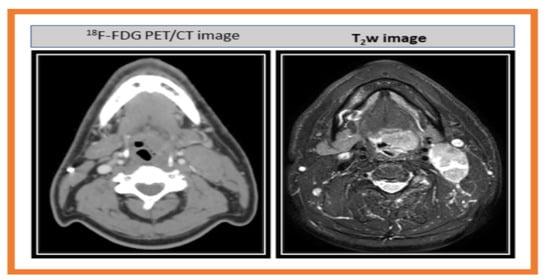
Article

Application of Community Detection Algorithm to Investigate the Correlation between Imaging Biomarkers of Tumor Metabolism, Hypoxia, Cellularity, and Perfusion for Precision Radiotherapy in Head and Neck Squamous Cell Carcinomas

1
Department of Medical Physics, Memorial Sloan Kettering Cancer Center, New York, NY 10065, USA
2
Department of Radiology, Memorial Sloan Kettering Cancer Center, New York, NY 10065, USA
3
Department of Radiation Oncology, Memorial Sloan Kettering Cancer Center, New York, NY 10065, USA
*
Author to whom correspondence should be addressed.
Contributed equally to this study as co-first authors.
Contributed equally to this study as co-senior authors.
Cancers 2021, 13(15), 3908; https://doi.org/10.3390/cancers13153908
Submission received: 29 May 2021 / Revised: 26 July 2021 / Accepted: 30 July 2021 / Published: 3 August 2021
(This article belongs to the Special Issue Human Papillomavirus and Head and Neck Cancer)

Abstract

:

Simple Summary

Integration of multimodality imaging (MMI) methods in head and neck squamous cell carcinomas (HNSCC) provides complementary information of the tumor and its microenvironment. Quantitative positron emission tomography (PET)/computed tomography (CT), DW- and DCE-MRI provide the functional information of tumor tissue based on metabolic process, diffusion of water molecules, and enhancement of water proton relaxation with a contrast agent, respectively. The present study aimed to investigate correlations at pre-treatment between quantitative imaging metrics derived from FDG-PET/CT(SUL), FMISO-PET/CT (K1, k3, TBR, and DV), DW-MRI (ADC, IVIM [D, D*, and f]), and FXR DCE-MRI [Ktrans, ve, and τi]) using a community detection algorithm (CDA) based on the “spin-glass model” and Spearman rank analysis in patients with HNSCC. Correlations between MMI-derived quantitative metrics evaluated using a CDA in addition to the Spearman analysis in a larger population may enable the identification of potential biomarkers for prognostication and management of patients with HNSCC.

Abstract

The present study aimed to investigate the correlation at pre-treatment (TX) between quantitative metrics derived from multimodality imaging (MMI), including 18F-FDG-PET/CT, 18F-FMISO-PET/CT, DW- and DCE-MRI, using a community detection algorithm (CDA) in head and neck squamous cell carcinoma (HNSCC) patients. Twenty-three HNSCC patients with 27 metastatic lymph nodes underwent a total of 69 MMI exams at pre-TX. Correlations among quantitative metrics derived from FDG-PET/CT (SUL), FMSIO-PET/CT (K1, k3, TBR, and DV), DW-MRI (ADC, IVIM [D, D*, and f]), and FXR DCE-MRI [Ktrans, ve, and τi]) were investigated using the CDA based on a “spin-glass model” coupled with the Spearman’s rank, ρ, analysis. Mean MRI T2 weighted tumor volumes and SULmean values were moderately positively correlated (ρ = 0.48, p = 0.01). ADC and D exhibited a moderate negative correlation with SULmean (ρ ≤ −0.42, p < 0.03 for both). K1 and Ktrans were positively correlated (ρ = 0.48, p = 0.01). In contrast, Ktrans and k3max were negatively correlated (ρ = −0.41, p = 0.03). CDA revealed four communities for 16 metrics interconnected with 33 edges in the network. DV, Ktrans, and K1 had 8, 7, and 6 edges in the network, respectively. After validation in a larger population, the CDA approach may aid in identifying useful biomarkers for developing individual patient care in HNSCC.

Graphical Abstract

1. Introduction

Head and neck squamous cell carcinoma (HNSCC) is a complex disease with remarkable intratumoral heterogeneity resulting in different treatment responses and outcomes [1]. HNSCC arises from the mucosa lining of the aerodigestive tract, including the oropharyngeal axis. Human papillomavirus (HPV)-related oropharyngeal cancers (OPCs) have molecular features and etiology distinct from those of smoking- and alcohol-related HNSCC [2,3]. Both qualitative and quantitative imaging, including computed tomography (CT), T1-weighted and T2-weighted magnetic resonance imaging (MRI), positron emission tomography (PET)/CT, diffusion-weighted (DW-), and dynamic contrast-enhanced (DCE)-MRI, have shown potential in staging, predicting treatment (TX) response, and post-TX follow-up of patients with HNSCC [4,5,6,7,8].
Quantitative analysis of multimodality imaging (MMI), including 18F-Fluorodeoxyglucose (FDG) PET/CT, 18F-Fluoromisonidazole (FMISO) PET/CT, DW- and DCE-MRI, data provide imaging metrics, reflecting the tumor metabolism, hypoxia, cellularity, and vessel permeability in HNSCC [6,9,10,11,12]. Therefore, the measurement of MMI-derived quantitative imaging (QI) metrics at pre-TX is vital for evaluating and planning precision radiotherapy in HNSCC. The standardized uptake value (SUV) from 18F-FDG-PET/CT assesses the changes in glucose uptake as a measure of response to radiotherapy (RT) [13]. Pharmacokinetic modeling of FMISO yields a metric, a biomarker of cell oxygenation (hypoxia), reflecting malignant tissue radiosensitivity [14]. Previous studies have reported that pre-TX 18F-FMISO-PET/CT could aid in predicting RT outcome and survival prognosis in HNSCC [9,15]. Riaz et al. recently demonstrated that dose de-escalation of radiotherapy to 30 Gy based on intra-treatment hypoxia using imaging response utilizing 18F-FMISO-PET/CT was feasible, safe, and associated with minimal toxicity [16].
The measurement of diffusion of water molecules in malignant tissue can reveal abnormalities of the tissue cellular organization and microstructure [17]. The ADC derived from monoexponential modeling of diffusion-weighted (DW) signal data with at least two b-values, a surrogate marker of tumor cellularity, has shown promise in predicting and detecting early response to chemo-RT HNSCC in metastatic lymph nodes (LNs) [18,19]. Quantitative imaging (QI) metrics derived from the intravoxel incoherent motion (IVIM) model [20] without contrast agent (CA), including perfusion fraction (f) and true diffusion coefficient (D), exhibited potential markers for early prediction of chemo-RT response in HNSCC patients [21,22,23]. Paudyal et al. further reported subtypes within human papillomavirus-positive (HVP+) patients with HNSCC treated with 70 Gy chemo-RT. This finding raises the question of whether every individual should be treated with the same dose of radiation [23].
DCE-MRI pharmacokinetics modeling estimates perfusion/permeability and volume fractions of the CA distribution spaces based on the changes in the time course of signal intensity from target tissue after a bolus administration of CA [24]. The post-TX DCE-MRI showed potential for identifying residual masses, both in primary tumors and in metastatic LNs, that had failed [25]. The extended Tofts model [24], assuming an infinitesimally fast water exchange kinetics between the tissue compartments, derived volume transfer constant (Ktrans), extravascular extracellular volume fraction [EES] (ve), and plasma volume fraction (vp) from primary tumors and metastatic LNs have shown promise in differentiating responders from non-responders [26]. Shukla-Dave et al. reported that the skewness of pre-TX Ktrans values was the strongest predictor of progression-free survival and overall survival in Stage IV HNSCC patients with the nodal disease [27]. Kim et al. implemented the fast exchange (FXR) model, accounting for the finite rate of transcytolemmal water exchange, and reported that the pre-TX Ktrans exhibited a potential to predict metastatic LNs treatment response to chemo-RT in HNSCC cancer patients [28]. The poor pre-TX tumor perfusion may be a common mechanism associated with radioresistance and the development of the distant metastatic phenotype [29]. Recent preclinical and clinical studies suggested that the FXR model-derived intracellular water molecule’s mean lifetime (τi) can be a surrogate marker of tumor cell metabolic activity [30,31]. Chawla et al. reported that the metric τi could be a prognostic marker in HNSCC patients [32].
Previous studies explored the correlation between metastatic LN tumor volume and 18F-FDG- PET/CT and 18F-FMISO-PET/CT derived QI metrics [15,33,34]. The correlations between ADC and 18F-FDG SUV results were inconsistent in HNSCC [33,34,35]. The mean Ktrans and SUVmax showed a trend towards a significant positive correlation in 28 primary tumors of HNSCC [11]. Jansen reported significantly lower median Ktrans and the rate constant of CA from the EES back into the plasma space, kep, values in hypoxic than in non-hypoxic nodes in HNSCC [36]. Wiedenmann demonstrated that the multiple parameters’ values differ significantly between hypoxic and non-hypoxic tumor regions, defined on FMISO-PET/CT in HNSCC [37].
A Spearman correlation analysis between MMI-derived QI metrics measures the strength of a monotonic relationship. Still, it does not explicitly show how and to what extent these metrics are interconnected within a group. These QI metrics can be represented as a network in which nodes (metrics) with similar characteristics are clustered to form sub-networks (communities) [38]. Herein, the community detection algorithm (CDA) based on a “spin-glass model” was employed to create a community for MMI-derived metrics [39]. In the network, nodes within the same groups are densely coupled. In contrast, nodes between the group’s nodes are sparsely connected, indicating the CDA approach can be helpful to identify the cancer biomarkers for understanding solid tumor biology. To our knowledge, this is the first study that introduces a CDA-based “spin-glass model” approach in patients with HNSCC.
Despite the significant advances in MMI methods, identifying useful QI metrics that can assess the effectiveness of RT response in patients with HNSCC is still a challenging task. We hypothesize that the CDA approach could help identify robust biomarkers in developing cutting-edge strategies for precision therapy in HNSCC patients. The present study aimed to investigate correlations between QI metrics derived from MMI methods using a CDA based on the “spin-glass model” in HNSCC patients.

2. Materials and Methods

2.1. Patient Selection

Our institutional review board approved this prospective study compliant with the Health Insurance Portability and Accountability Act. We obtained written informed consent from all eligible patients who had a biopsy-proven, newly diagnosed HN cancer; diagnostic biopsies were tested for human papillomavirus (HPV) status before the CT and MRI study. Patients with previous chemotherapy or radiation therapy planned for upfront surgery and other primaries than HNSCC were excluded from the study. Between December 2013 and November 2015, a total of twenty-three (N = 23) HPV (21 HPV positive [+]  and 2 HPV negative [−]) HN cancer patients (median age = 58 years, range = 45–82 years; Male/Female = 21/2) enrolled in the study and underwent a total of 69 pre-TX examinations, including 18F-FDG-PET/CT (N = 23), 18F-FMISO dynamic PET/CT (N = 23), and MRI (combined DW- and DCE-MRI; N = 23). Of the 23 patients included with HNSCC, 15 patients had tumor sites in the base of the tongue, seven patients with tumors in a tonsil, one patient had an unknown primary tumor site, and four patients had bilateral metastatic LNs. The patients were categorized according to the American Joint Committee on Cancer (AJCC) tumor, node, metastasis (TNM) system. The majority of patients had T2 (65%), N2 nodal mass was found in all 23 patients, and none had M0. Patients were treated with concurrent chemotherapy and radiotherapy (70 Gy).

2.2. PET Data Acquisition

Baseline FDG-PET scans on HNSCC patients were performed for radiotherapy planning purposes.
Patients were positioned on a flat-top couch wearing a customized radiotherapy treatment immobilization mask, which allows for accurate repositioning. The same immobilization mask was subsequently used for FMISO dynamic PET scans as detailed elsewhere [10,40]. Patients were administered an intravenous bolus injection of 390 ± 16 MBq of FMISO. Approximately 300–450MBq of FDG was administered after a fasting period of ≥6 h through intravenous lines inserted in antecubital veins. The PET acquisition commenced at 70–80 min post-injection on the General Electric Discovery ST scanner (GE Health Care Inc., Chicago, IL, USA) with an imaging time of 5 min per bed position. The corresponding x-ray computed tomography (CT) images were acquired immediately prior to commencement of the PET scan and with the following settings: 140 kVp, 250 mAs, and 3.8-mm slice thickness. Each FMISO dynamic PET acquisition consisted of 3 segments: (i) at time t = 0, a 30 min dynamic acquisition binned into 6 × 5-sec, 3 × 10-sec, 4 × 60-sec, 2 × 150-sec, 2 × 300-sec, and 1 × 600-sec frames; (ii) a 10 min static acquisition, starting at ~90 min, and; (iii) a 10 min static acquisition starting at ~160 min post-injection. Between scans, patients rested in quiet waiting rooms.

2.3. PET/CTData Analysis

All PET data were corrected for attenuation, scatter, and random events, and were iteratively reconstructed into a 256 × 256 × 47 matrix (voxel dimensions: 1.95 × 1.95 × 3.27 mm3) using the ordered subset expectation maximization algorithm provided by the manufacturer. 18F-FDG-PET and three 18F-FMISO-PET scans were spatially co-registered using the rigid-body transformation calculated with the General Co-Registration TM tool applied to their corresponding CT scans (Advantage Workstation v4.7; GE Healthcare, Chicago, IL, USA). Lesions were segmented using the adaptive threshold algorithm in PET VCARTM (Advantage Workstation 4.7; GE Healthcare, Chicago, IL, USA) semi-automated software based on the companion CT as a fiduciary marker and a count-based edge recognition algorithm.
FDG uptake was calculated as the standard uptake value (SUV) corrected by lean body mass (SUL). SUV normalized by total body weight overestimates metabolic activity in all patients. Thus, the SUL is recommended for more accurate SUV results for quantitative assessment of clinical PET [20]. Tumor lesions were delineated on the FDG PET/CT images, using the adaptive threshold algorithm in the PET VCAR™ (Volume Computer-Assisted Reading; General Electric Advantage Workstation v4.7) semi-automated software, based on the companion CT as a fiduciary marker and a count-based edge recognition algorithm. The resulting segmented lesson was used to calculate the metastatic LN volumes (Vt-PET) for PET/CT [41]. Pharmacokinetic modeling of FMISO dynamic PET data was conducted in PMOD v3.604 (PMOD Software, RRID: SCR_016547) as reported previously [10,40]. Briefly, an irreversible one-plasma two-tissue compartment model with a blood volume component was utilized to calculate surrogate biomarkers of tumor hypoxia (k3, tumor-to-blood ratio [TBR]), perfusion (K1), and total 18F-FMISO distribution volume (DV), i.e., the overall concentration of unbound FMISO relative to blood. Image-based input function (IF) was derived from the dynamic FMISO-PET images by segmenting the jugular vein on the early frame with the highest image intensity and fitting the time-activity curves with a triphasic exponential function.

2.4. MRI Data Acquisition

HNSCC patients underwent MRI examinations on a 3 Tesla (T) MRI scanner (Philips Ingenia; Philips Healthcare, Eindhoven, Netherlands) using a neurovascular phased-array coil. The standard MR multiplanar (axial, coronal, and sagittal) T2-weighted (T2w) and T1-weighted images were acquired as detailed elsewhere [23,42]. DW- and DCE-MRI acquisitions followed standard T1w and T2w imaging. The total MR acquisition time was approximately 30 min for the whole examination.
DW-MRI data were acquired using a single-shot echo-planar imaging (SS-EPI) sequence with the following MR parameters: repletion time (TR)/echo time (TE) = 4000/minimum (80) ms, NA = 2, matrix = 128 × 128, FOV = 20–24 cm, slices = 8–10, slice thickness = 5 mm, and ten b-values (i.e., b = 0, 20, 50, 80, 200, 300, 500, 800, 1500, and 2000 s/mm2). The spatial saturation bands were graphically prescribed on scout images by the technologist prior to DW-MRI scanning. Their angulation, center, and width were adjusted, depending on the neck anatomy of the patients. The total acquisition time was 5 min.
The T1w images for both pre-contrast (T10) and dynamic (i.e., before, during, and after an injection of CA) were acquired using a fast 3D T1w spoiled gradient recalled echo sequence. The pre-contrast T1 images were acquired with the multiple flip angles (FA) of 5°, 15°, and 30° with TR/TE = 7/2.7 ms; acquisition matrix = 256 ×1 28, FOV = 20–24 cm, slice thickness = 5 mm, and slices = 8–10. Dynamic series images were acquired using FA = 15° and other acquisition MR parameters, as mentioned above. A bolus of 0.1 mmol/kg Gd-based CA was injected through an antecubital vein catheter at two cc/s, followed by a 20-mL saline flush after acquiring 5–6 images as detailed elsewhere. A total of 40 dynamic images were obtained with a temporal resolution ranging from 7.20–8.96.0 s/image.

2.5. MRI Data Analysis

2.5.1. DWI Analysis

DW signal intensity data from multiple b-values were fitted to (i) a monoexponential (Equation (1)) and (ii) bi-exponential equation of the IVIM model (Equation (2)) [20]:
S ( b ) = S 0   e b × A D C
                                                S ( b ) = S 0 [ f e b × D * + ( 1 f ) e b × D ]
where S0 and Sb are the signal intensities without and with diffusion weighting, b is the diffusion weighting factor (s/mm2), D (mm2/s) is the true diffusion coefficient, D* (mm2/s) is the pseudo-diffusion coefficient (mm2/s), and f is the perfusion fraction.

2.5.2. Fast Exchange Regime DCE-MRI Analysis

The longitudinal relaxation rate constant-with time course for tissue R1t (R1t = 1/T1t) and EES R1e in the fast exchange limit is given by Equations (3) and (4) as follows [43]:
R 1 t ( t ) = R 10 + r 1 ( t ) C t ( t )
R 1 e ( t ) = R 10 e + r 1 ( t ) C e ( t )
where R10 and R10e are the precontrast longitudinal relation rate constants for tissue and EES, respectively, Ct(t) and Ce(t) are the CA concentration with time in tissue and EES. The r1 is the longitudinal relaxivity of CA.
The CA concentration with time in tissue is given by the standard Toft model (Equation (5)) [24].
C t ( t ) = K t r a n s 0 t e k e p ( t τ ) C p ( τ )   d τ
where Ktrans is the volume transfer constant, Cp is the plasma CA concentration (called arterial input function [AIF]), and kep (kep = Ktrans/ve) is the CA transfer rate constant from the EES to vascular space. The CA concentration in EES is given by Ce(t) = Ct(t))/ve.
The two-site water exchange (2SX) model (i.e., between the intracellular space [ICS] and EES) is derived from the three-site-two water exchange model formulated based on Bloch-McConnell’s, assuming a negligible vascular space [44,45]. The solution of Bloch-McConnell’s 2SX system yields two eigenvalues [46]. One of the eigenvalues represents the observable longitudinal relaxation rate R1 of the FXR model given by Equation (6) [16].
R 1 t ( t ) = 1 2 [ ( R 1 i + k i e + R 1 e + k e i ) ( R 1 i + k i e R 1 e k e i ) 2 + 4   k i e k e i ]
where R1i and R1e are the ICS and EES longitudinal relaxation rate constants. The kie (kie = 1/τi) and kei are the water exchange rates between ICS and EES and vice versa. The kie is related to P (A/vi), where P is the cell membrane water permeability coefficient, and A/vi is the ratio of surface area to volume of a cell. For DCE data analysis, the R1i value was set equal to that of R10.

2.6. MRI Tumor Regions of Interests Analysis

Regions of interest (ROIs) were manually delineated on the metastatic lymph nodes (LNs) on b = 0 (s/mm2) DW images and late phases of T1w dynamic images by a team of neuroradiologists based on T1w/T2w images using Image J [47]. The metastatic LN volumes (Vt-MRI) were calculated from the T2-weighted images as detailed elsewhere [23]. The AIF was extracted from the carotid artery in each patient [48]. Equations (2) and (6) were fitted on a voxel-wise basis with a nonlinear least-square curve fitting method [49,50]. T10 values were estimated on a voxel-wise basis from the multiple angles as described elsewhere [51,52]. DW and DCE post-image processing, including parametric map generation, were conducted using MRI-QAMPER (MRI Quantitative Analysis of Multi-Parameter Evaluation Routines) [42,50].

2.7. Statistical Analysis

QI metric values derived from MMI (FDG-PET/CT, FMISO-PET/CT, and DW- and DCE-MRI) were reported as mean ± standard deviation (SD). Wilcoxon signed-rank test (WSRT) was performed to compare the tumor volume obtained from MMI techniques. A nonparametric measure of the correlation, the Spearman’s rank (ρ) analysis, was performed to examine the relationship among MMI-derived QI metrics. The correlation coefficient (ρ) of <0.3 was considered weak, 0.3–0.5 moderate, and 0.5–1.0 strong. The significance level was set at p < 0.05.
To determine how and to what extent the MMI-derived QI metrics were interconnected on the network, the CDA algorithm based on the “spin-glass” model was employed for the QI metrics whose Spearman’s rank test p-value was <0.05 [39]. The spin-glass is a unique community detection algorithm based on the statistical mechanics of spin around the networks [39]. The CDA-based “spin-glass” model approach splits MMI-derived QI metrics into distinct communities [53]. Links or edges heavily or sparsely connect the groups that can also reveal strong or weak, including positive or negative correlations [53]. All statistical analyses were performed using R-4.0.3 software [54].

3. Results

Ninety-two imaging datasets (FDG-PET/CT, FMSIO-PET/CT, DW-, and DCE-MRI) were successfully analyzed from 27 metastatic LNs. The median Karnofsky Performance Status (KPS) was 90 (range 80–90).
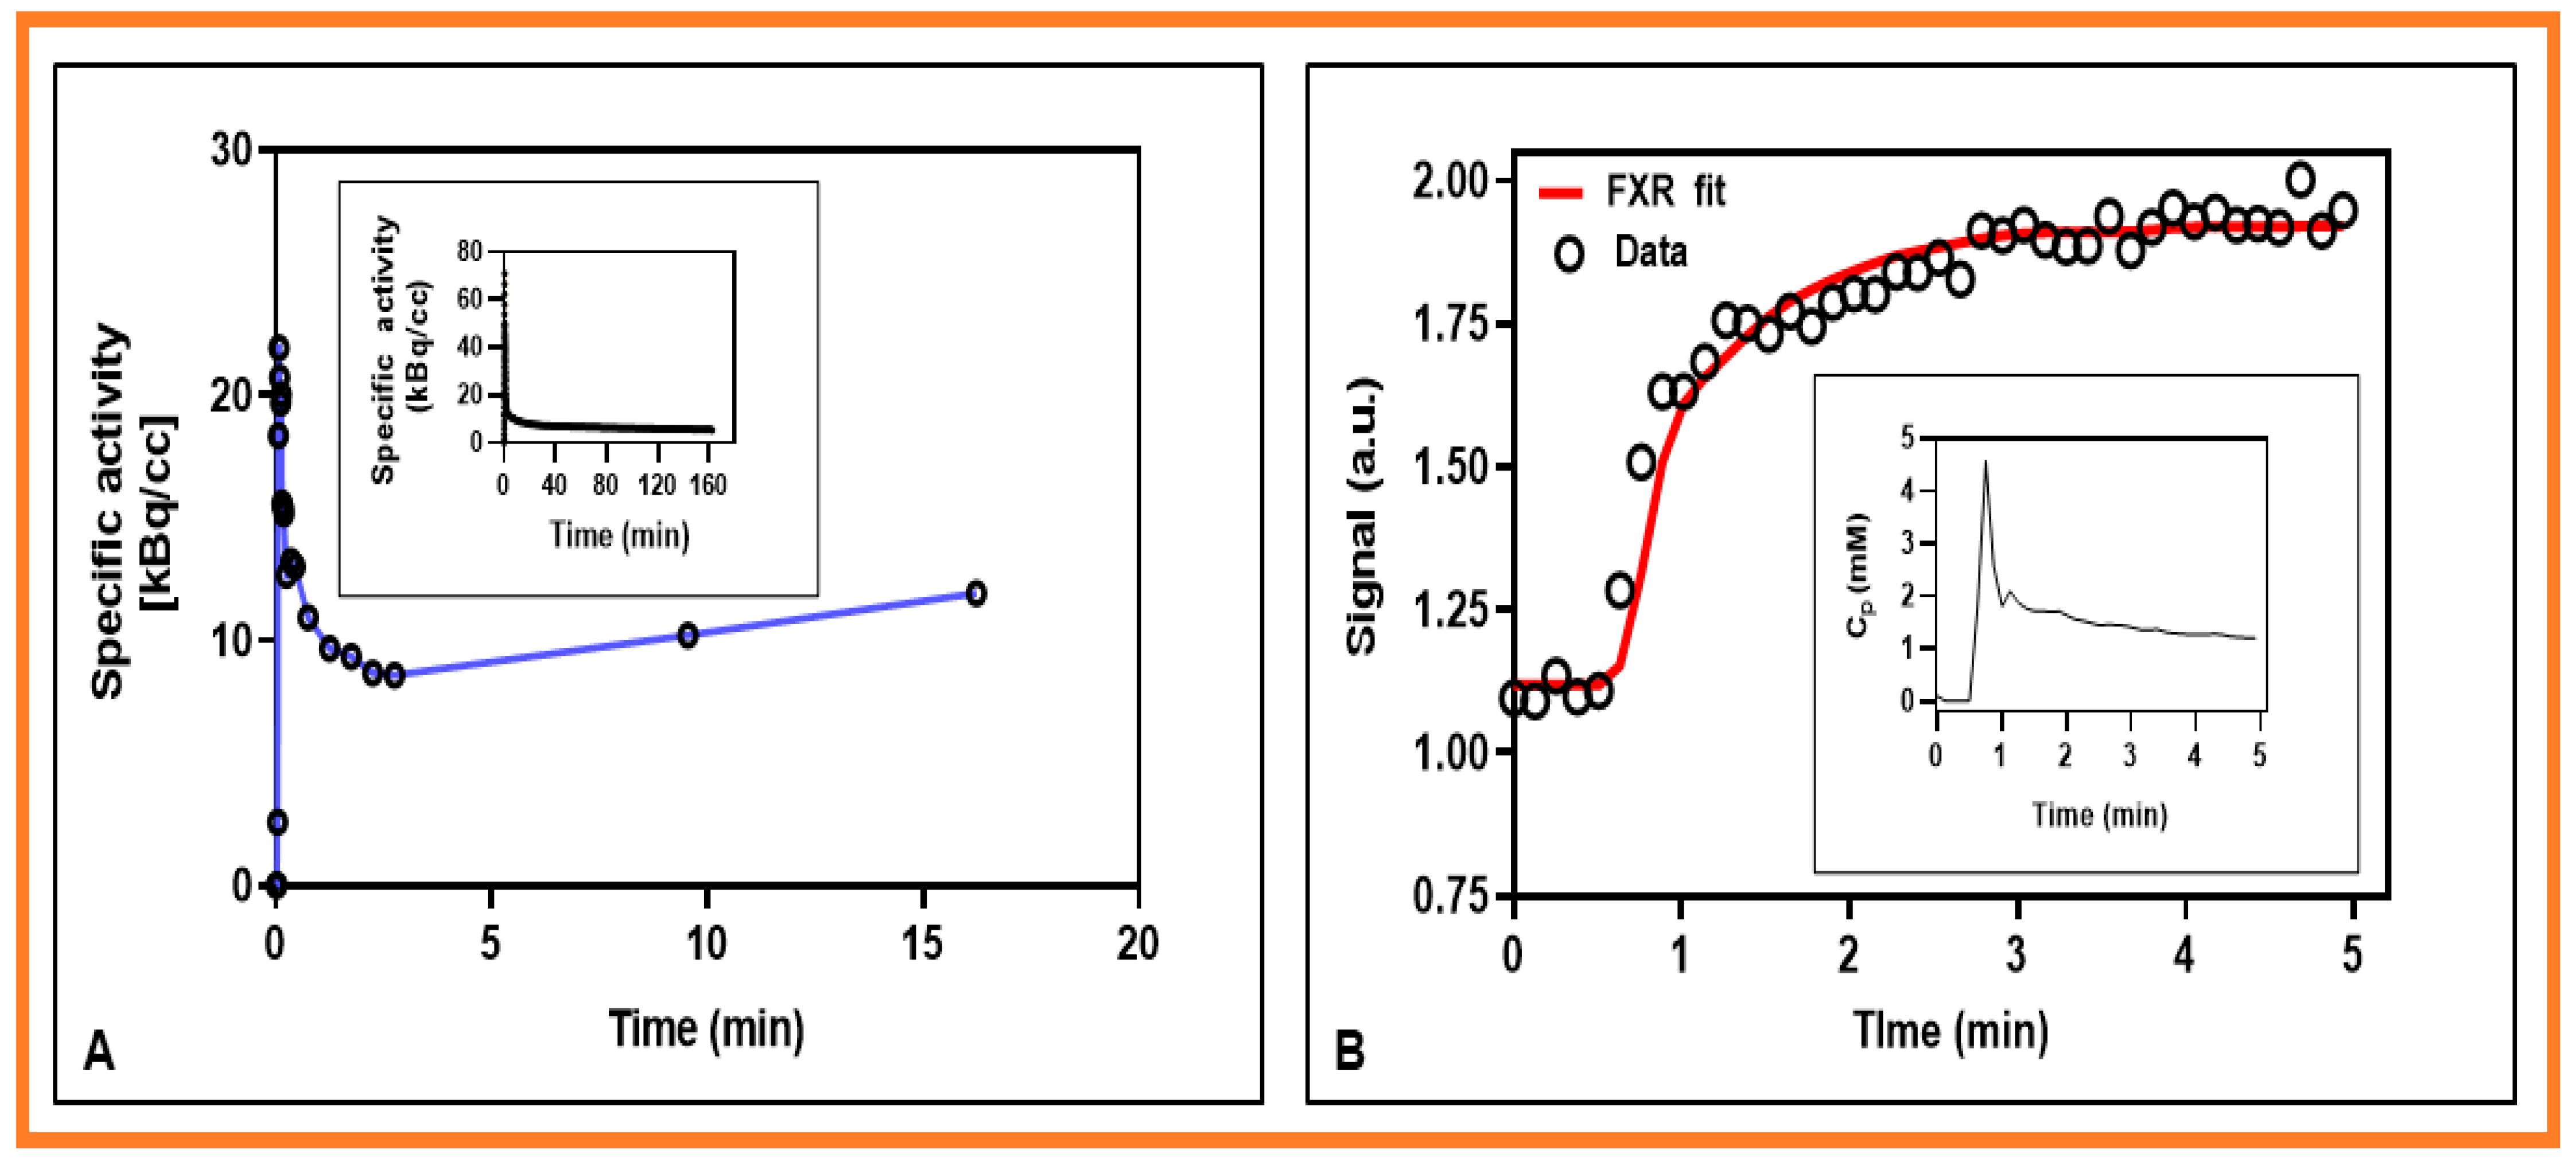
The representative signal versus b-values curve for DW data is displayed in Figure 1. The signal time representative curves for FMISO and DCE data are displayed in Figure 2A,B, respectively. The corresponding arterial input functions are also displayed. The FMISO data was taken from the metastatic LN displayed in Figure 3. Similarly, DW- and DCE-MRI data were extracted from ROIs shown in Figure 4.
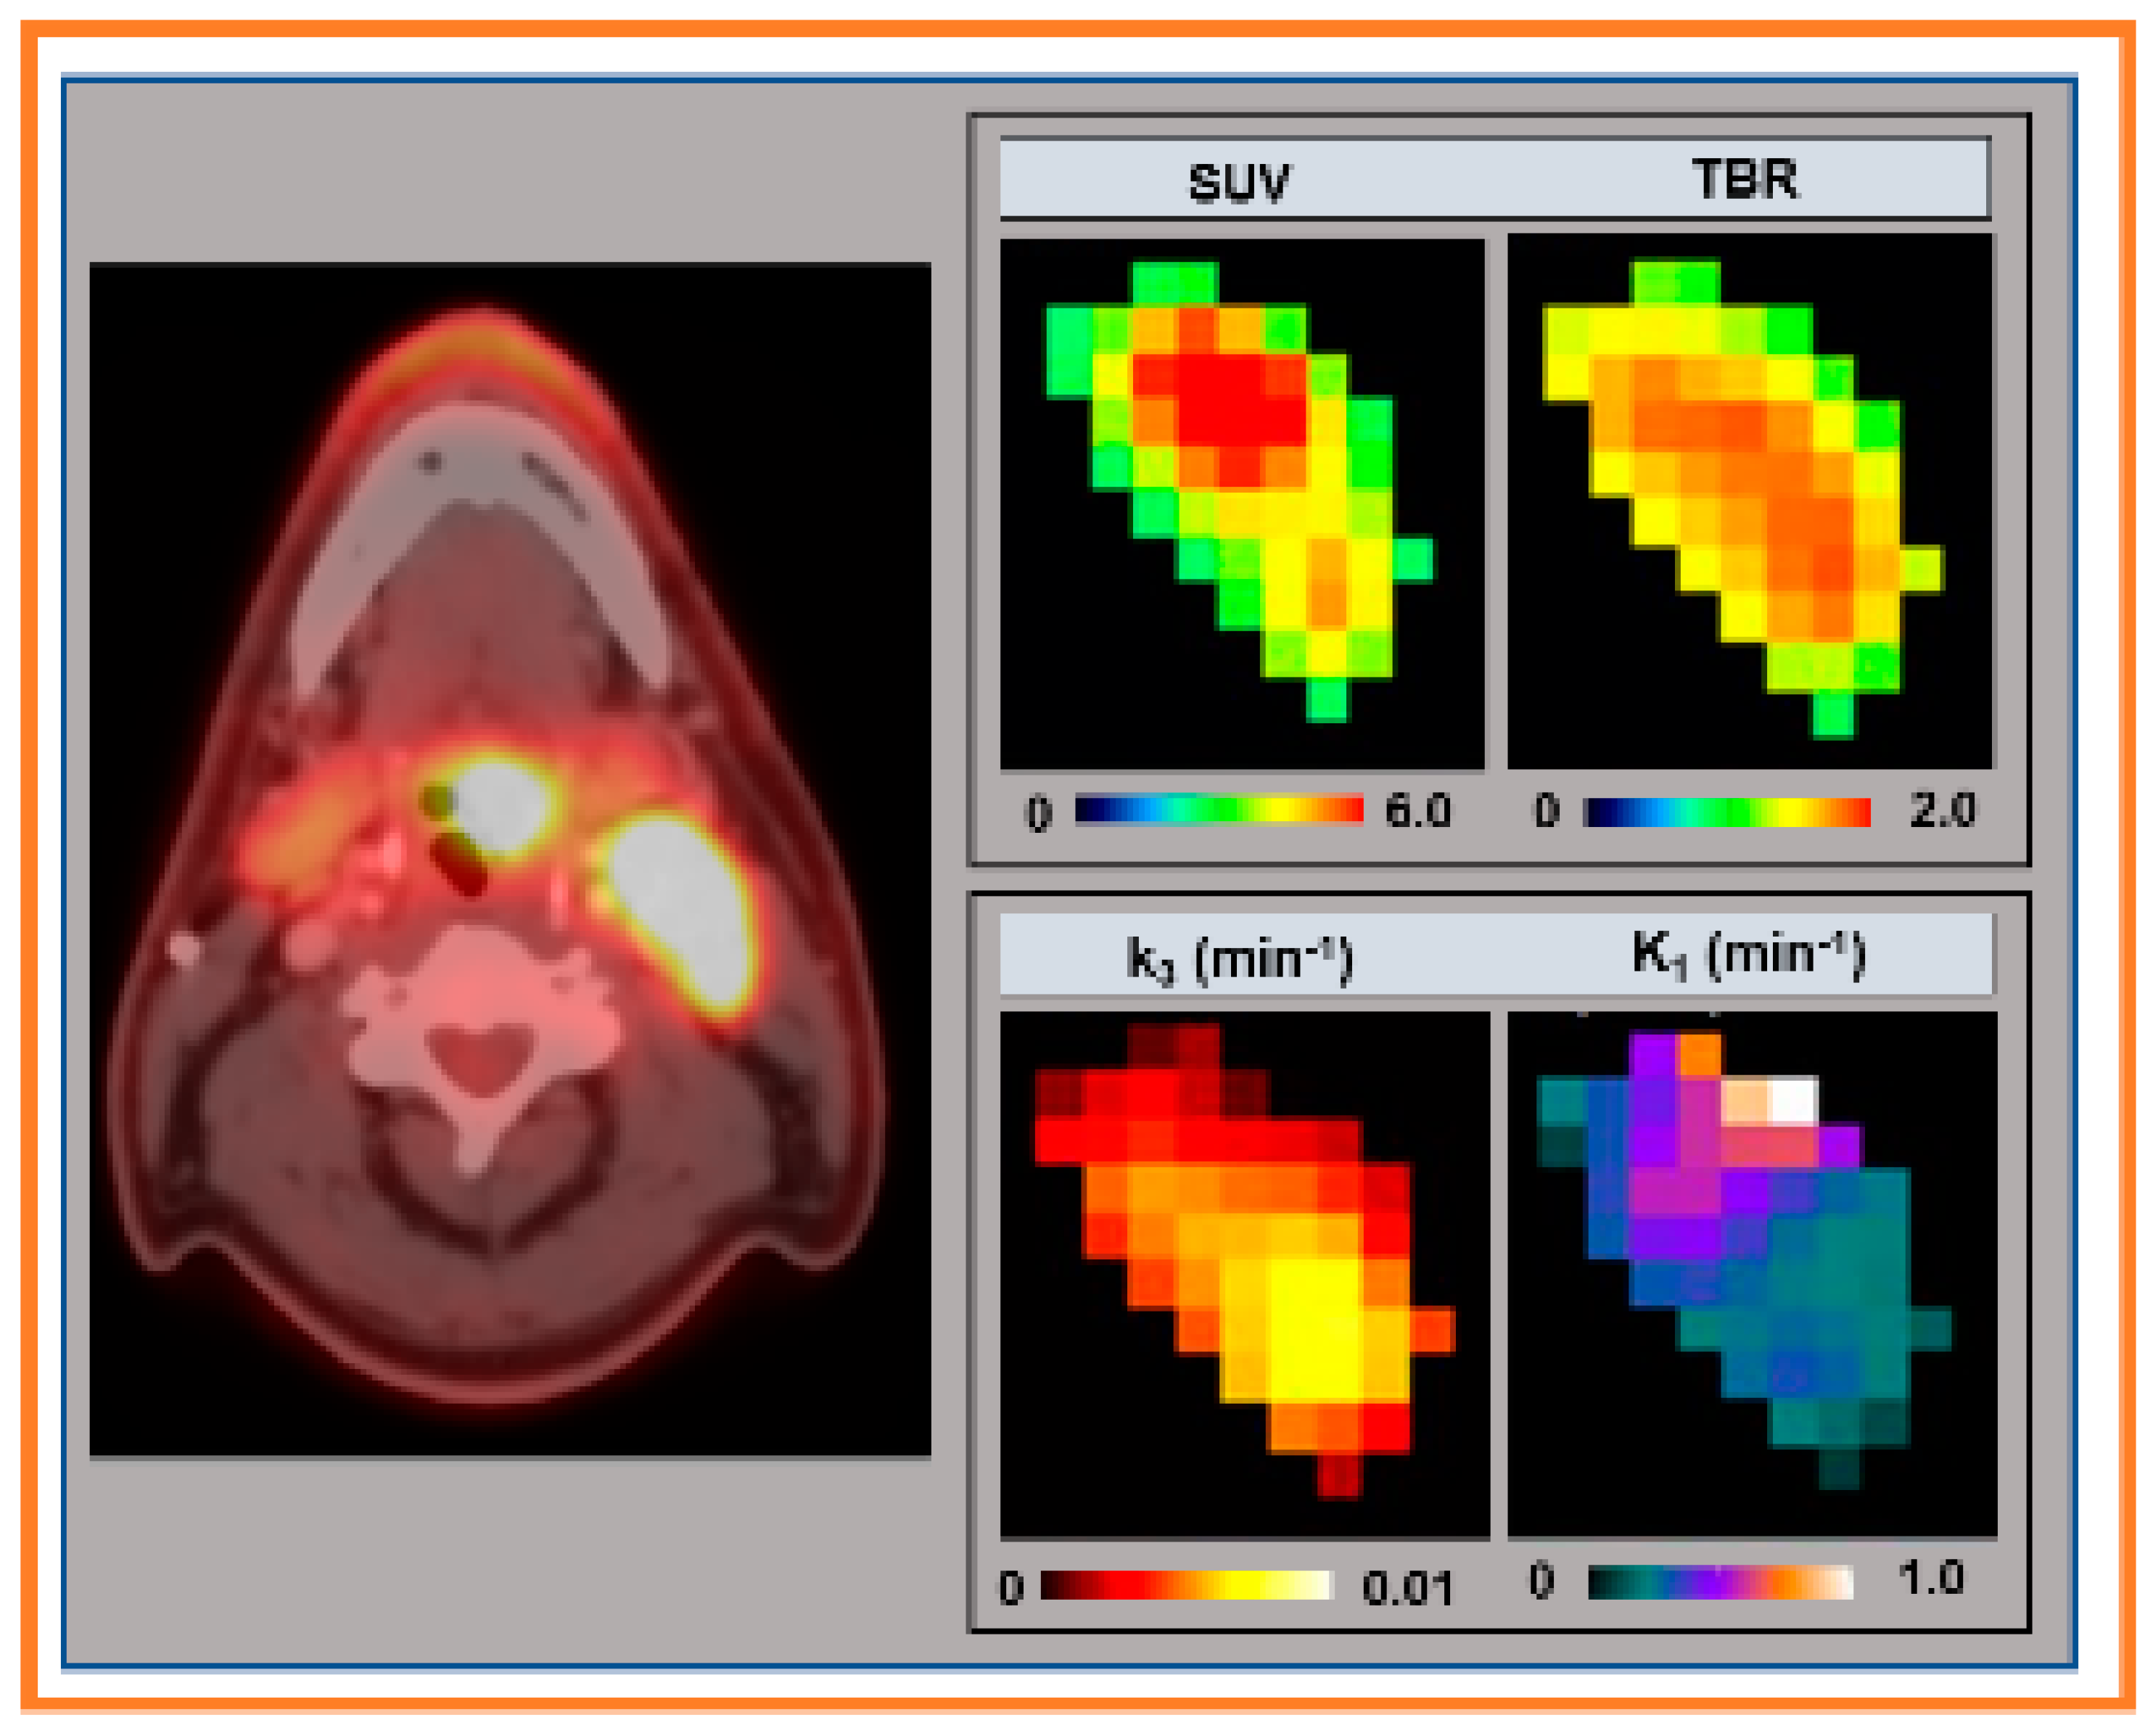
Figure 3 shows the representative PET/CT image and QI metrics extracted from the FDG-PET/CT and FMISO-PET/CT.
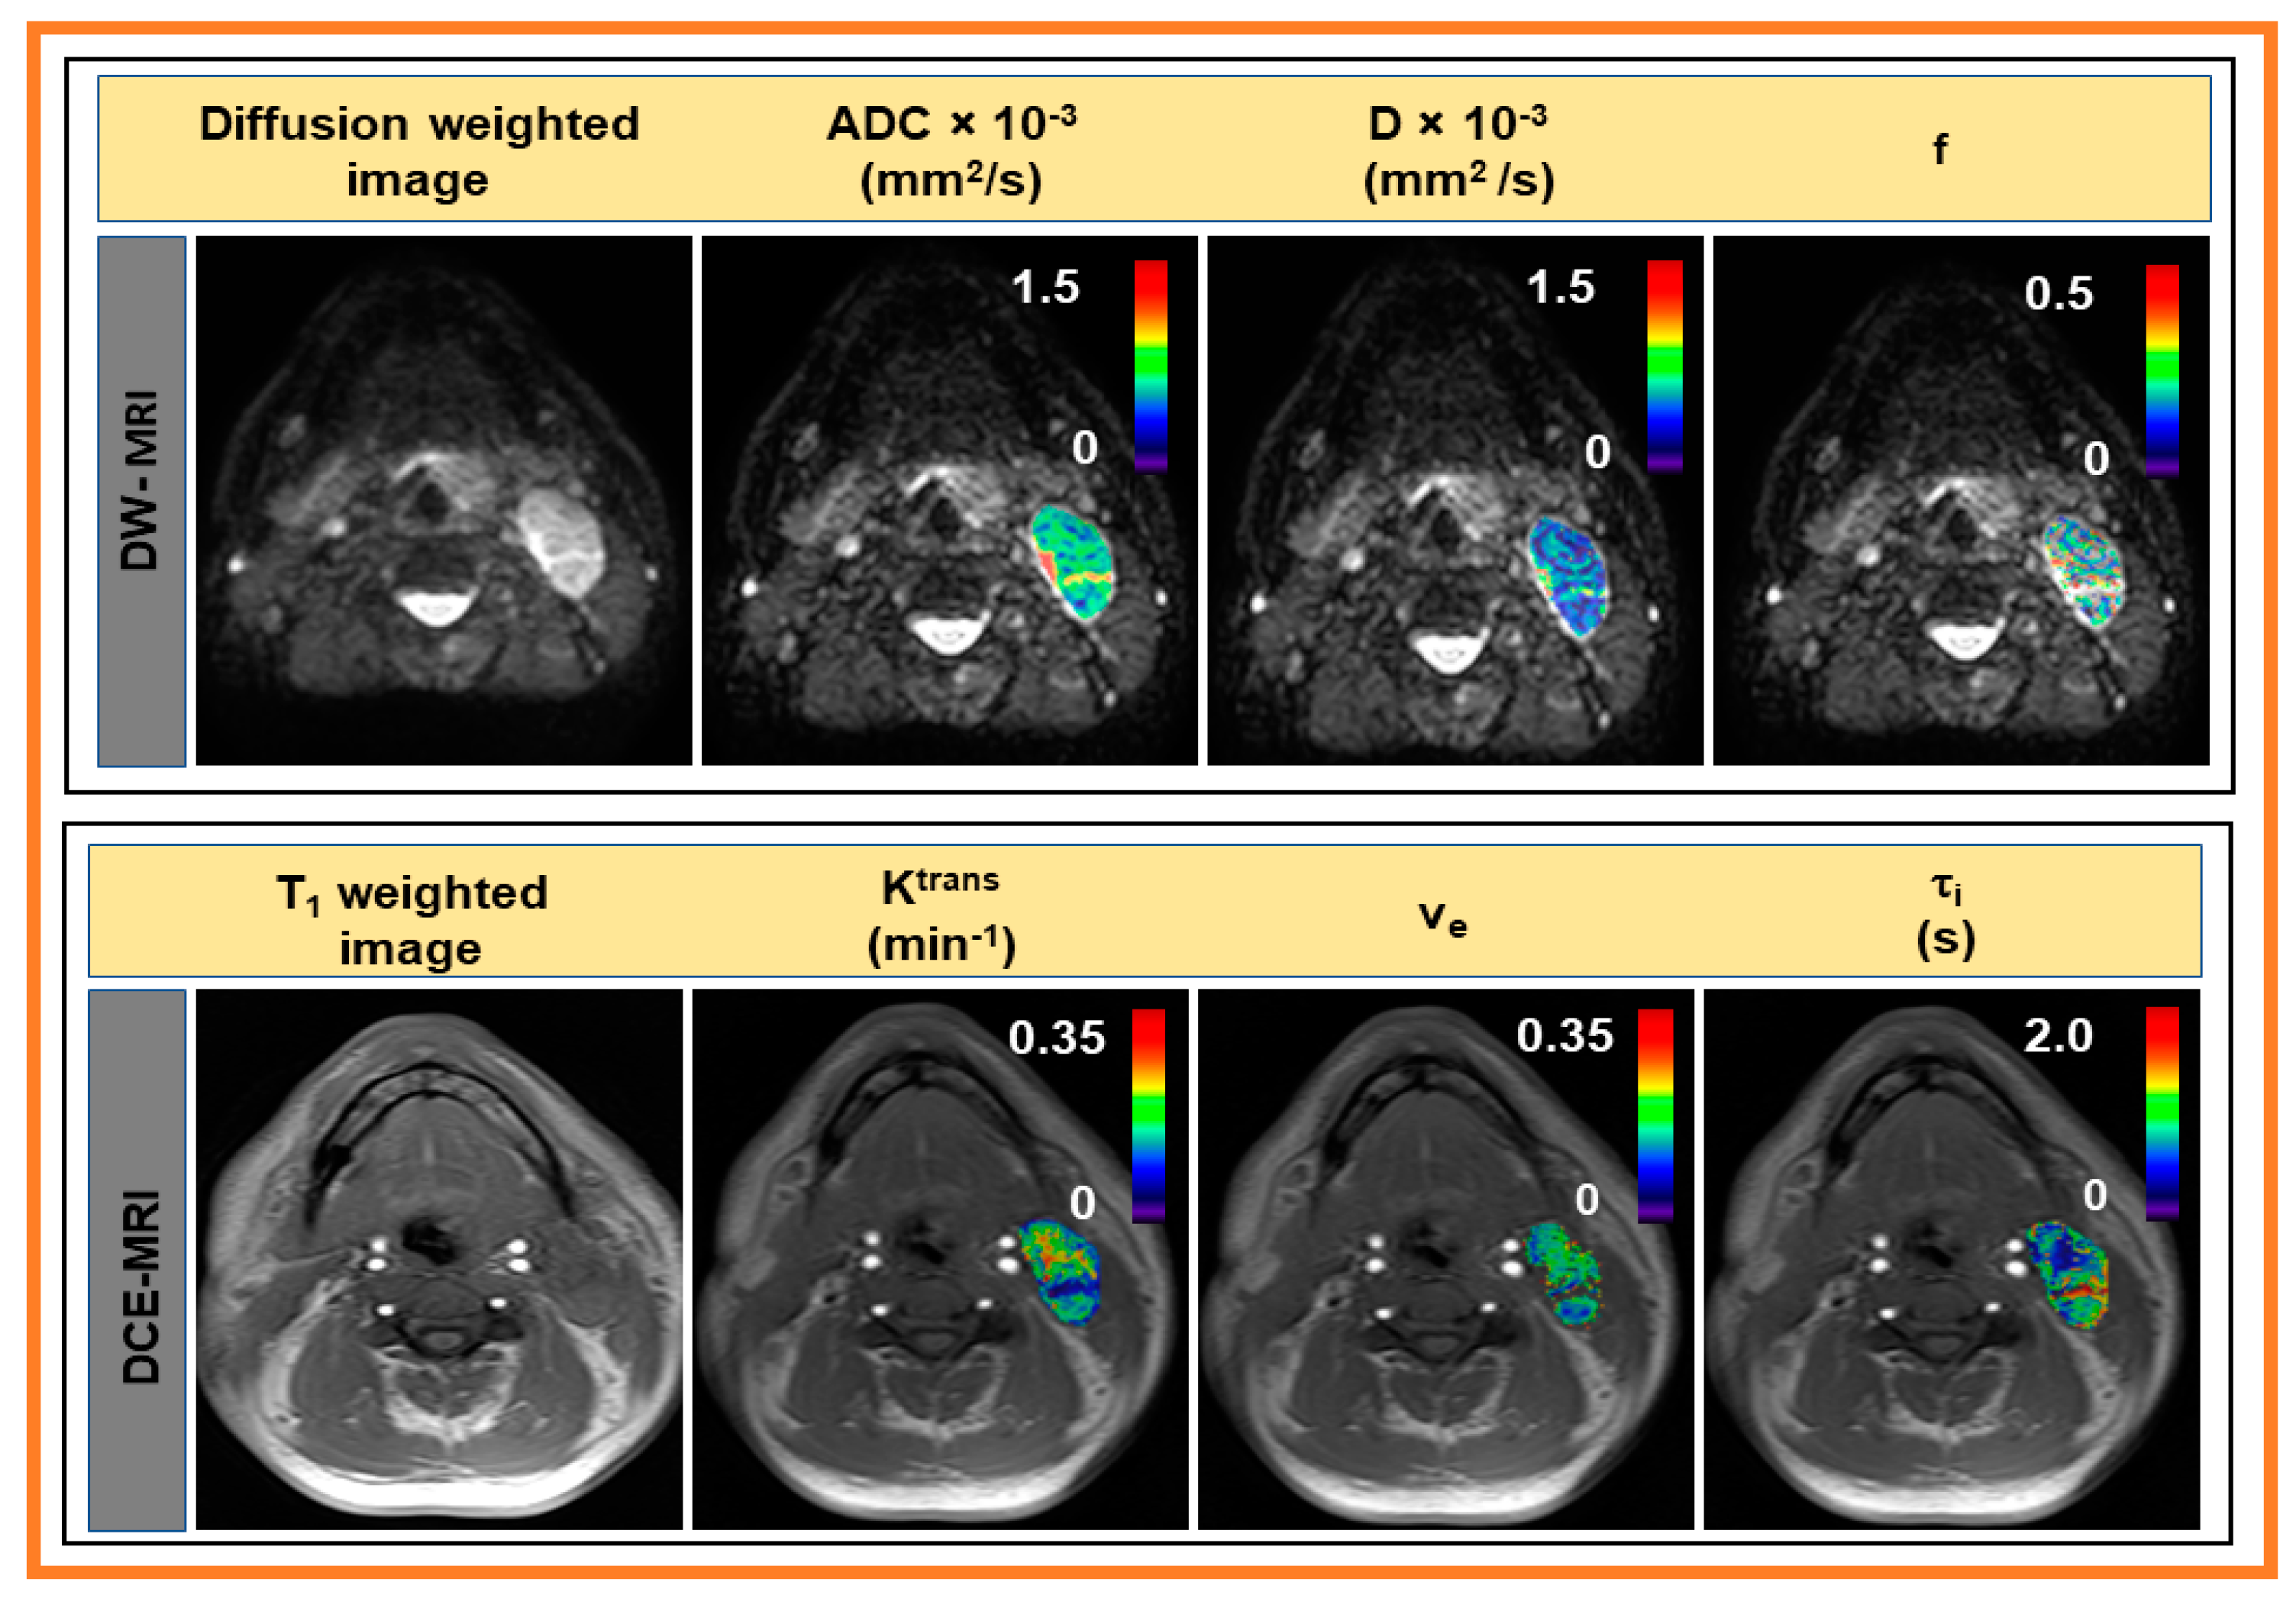
Representative DW, T1-weighted image, and QI metrics derived from IVIM and FXR model are displayed in Figure 4. The representative MRI images were from the same patient shown in Figure 2.
The mean tumor ROI volume and QI metrics values from MMI are given in Table 1.
Mean metastatic LN volumes obtained from PET (Vt- PET) and MRI (Vt- MRI) were significantly different (Vt-PET = 13.59 ± 7.65 cm3 vs. Vt-MRI = 11.41 ± 10.09 cm3, p = 0.005, WSRT) and were strongly positively correlated (ρ = 0.85, p < 0.0001) in HNSCC. Mean Vt-MRI was strongly positively correlated with 18F-FDG-PET/CT-derived metrics SULmean (ρ = 0.48, p = 0.01) and SULmax (ρ = 0.57, p = 0.0001) (Figure 5). The metrics SULmax and SULmean derived from FDG-PET/CT represent the standardized uptake value normalized to lean body mass, respectively. No significant correlations were found between Vt-PET and metrics obtained from 18F-FMISO-PET/CT, DW-, and DCE-MRI (p > 0.05). Vt-MRI also did not show a significant correlation with 18F-FMISO-PET/CT, DW-, and DCE-MRI derived metrics (p > 0.05).
Spearman correlation analysis identified several weak, moderate, and strong statistically significant, either positive or negative, correlations between QI metrics (surrogate markers of cellularity, glucose metabolism, perfusion, and hypoxia) derived from MMI data (Table 2). Herein, a summary of the Spearman correlation results is reported.
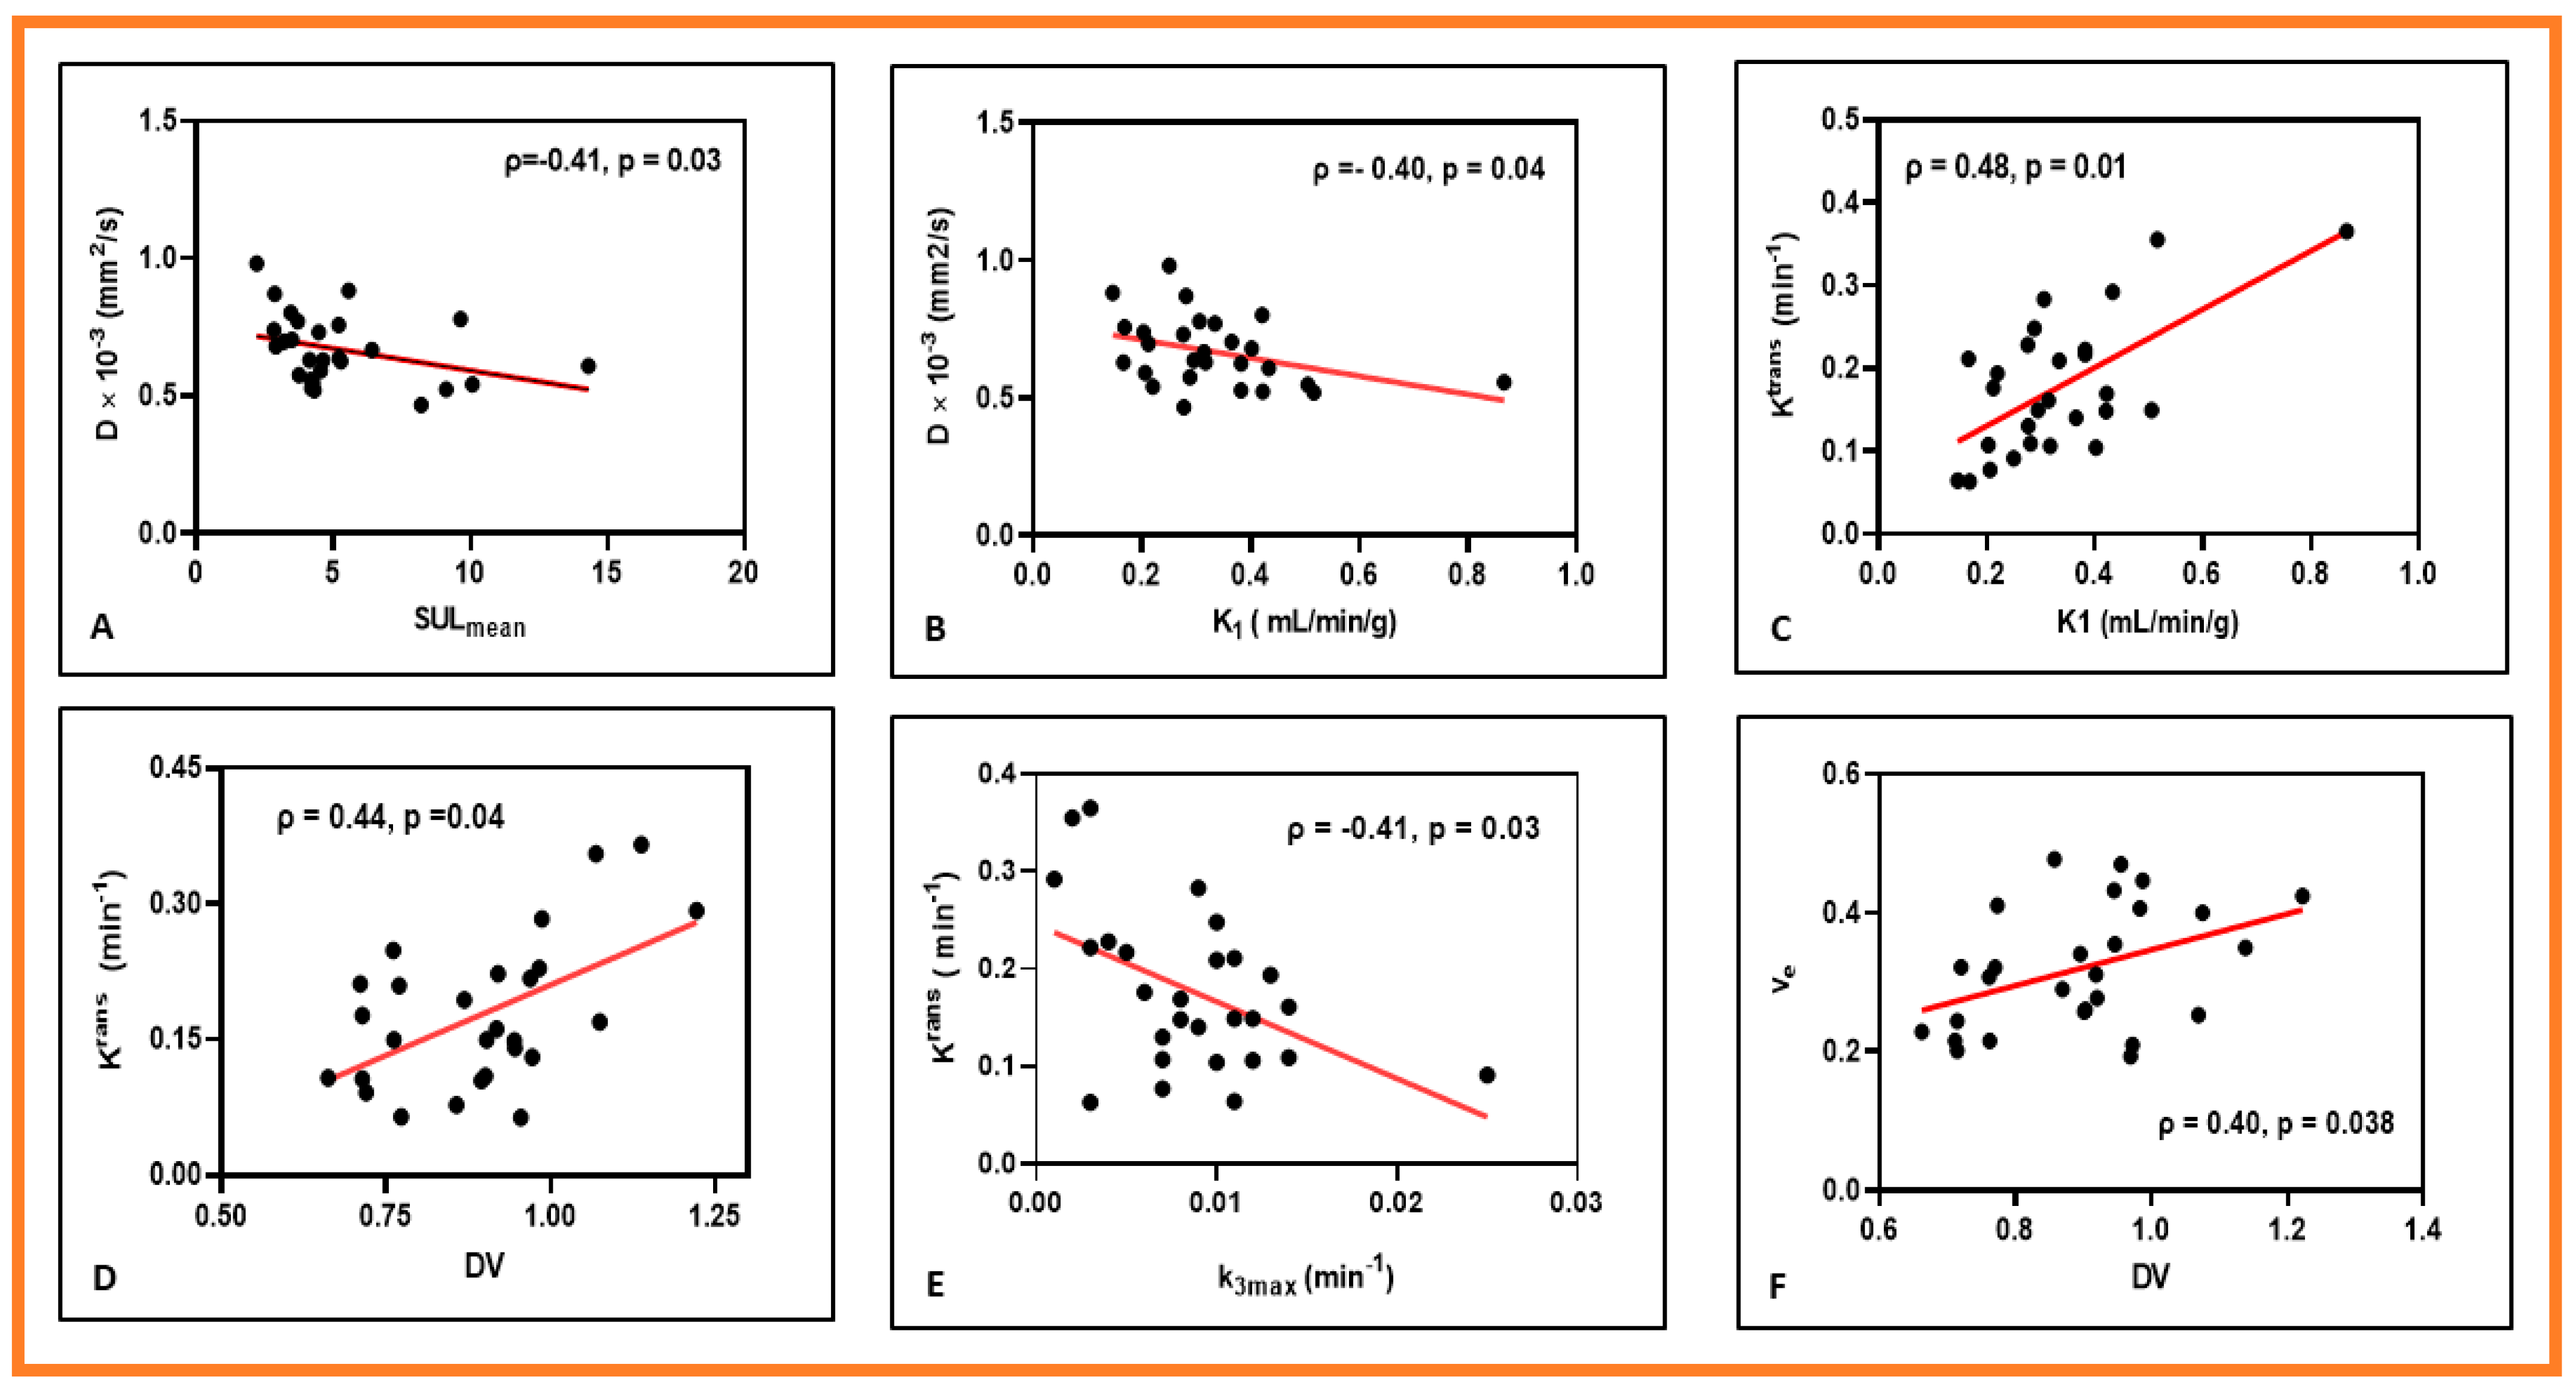
The metrics ADC and D, markers of tumor cellularity, exhibited a significant moderate negative correlation with SULmean, a feature of glycolytic activity (ρ = −0.42, p = 0.03 for ADC and ρ = −0.41, p = 0.03 for D). Additionally, there was a significant moderate negative correlation between D and Ktrans, a marker of tumor perfsuion//permeability (ρ = −0.43, p = 0.03), and D and τi, a maker of cell metabolic activity (ρ = −0.41, p = 0.04). ADC and ve, a leakage space for CA, showed a significant positive correlation (ρ = 0.46, p = 0.02). D showed a moderate negative correlation with K1, a measure of perfusion for FMISO (ρ = −0.40, p = 0.04).
The metric D*, a marker of capillary perfusion in tissue, showed a moderate positive correlation with Ktrans and K1 (ρ = 0.39, p = 0.04 for Ktrans and ρ = 0.40, p = 0.04 for K1). The perfusion fraction, f (the volume fraction occupied by capillaries), showed a moderate positive correlation with DV, a distribution volume of FMISO (ρ = 0.40, p = 0.04). In contrast, it showed a moderate negative correlation with k3max (ρ = −0.40, p = 0.02). The metrics Ktrans and K1 were moderately positively correlated (ρ = 0.48, p = 0.01). Ktrans and k3max, a marker of tumor hypoxia, were moderately negatively correlated (ρ = −0.41, p = 0.03). Ktrans and DV exhibited a moderate positive correlation (ρ = 0.44, p = 0.02). The metric ve and DV were moderately positively correlated (ρ = 0.40, p = 0.04).
Figure 6 shows the representative scatter plots between MMI-derived QI metrics.
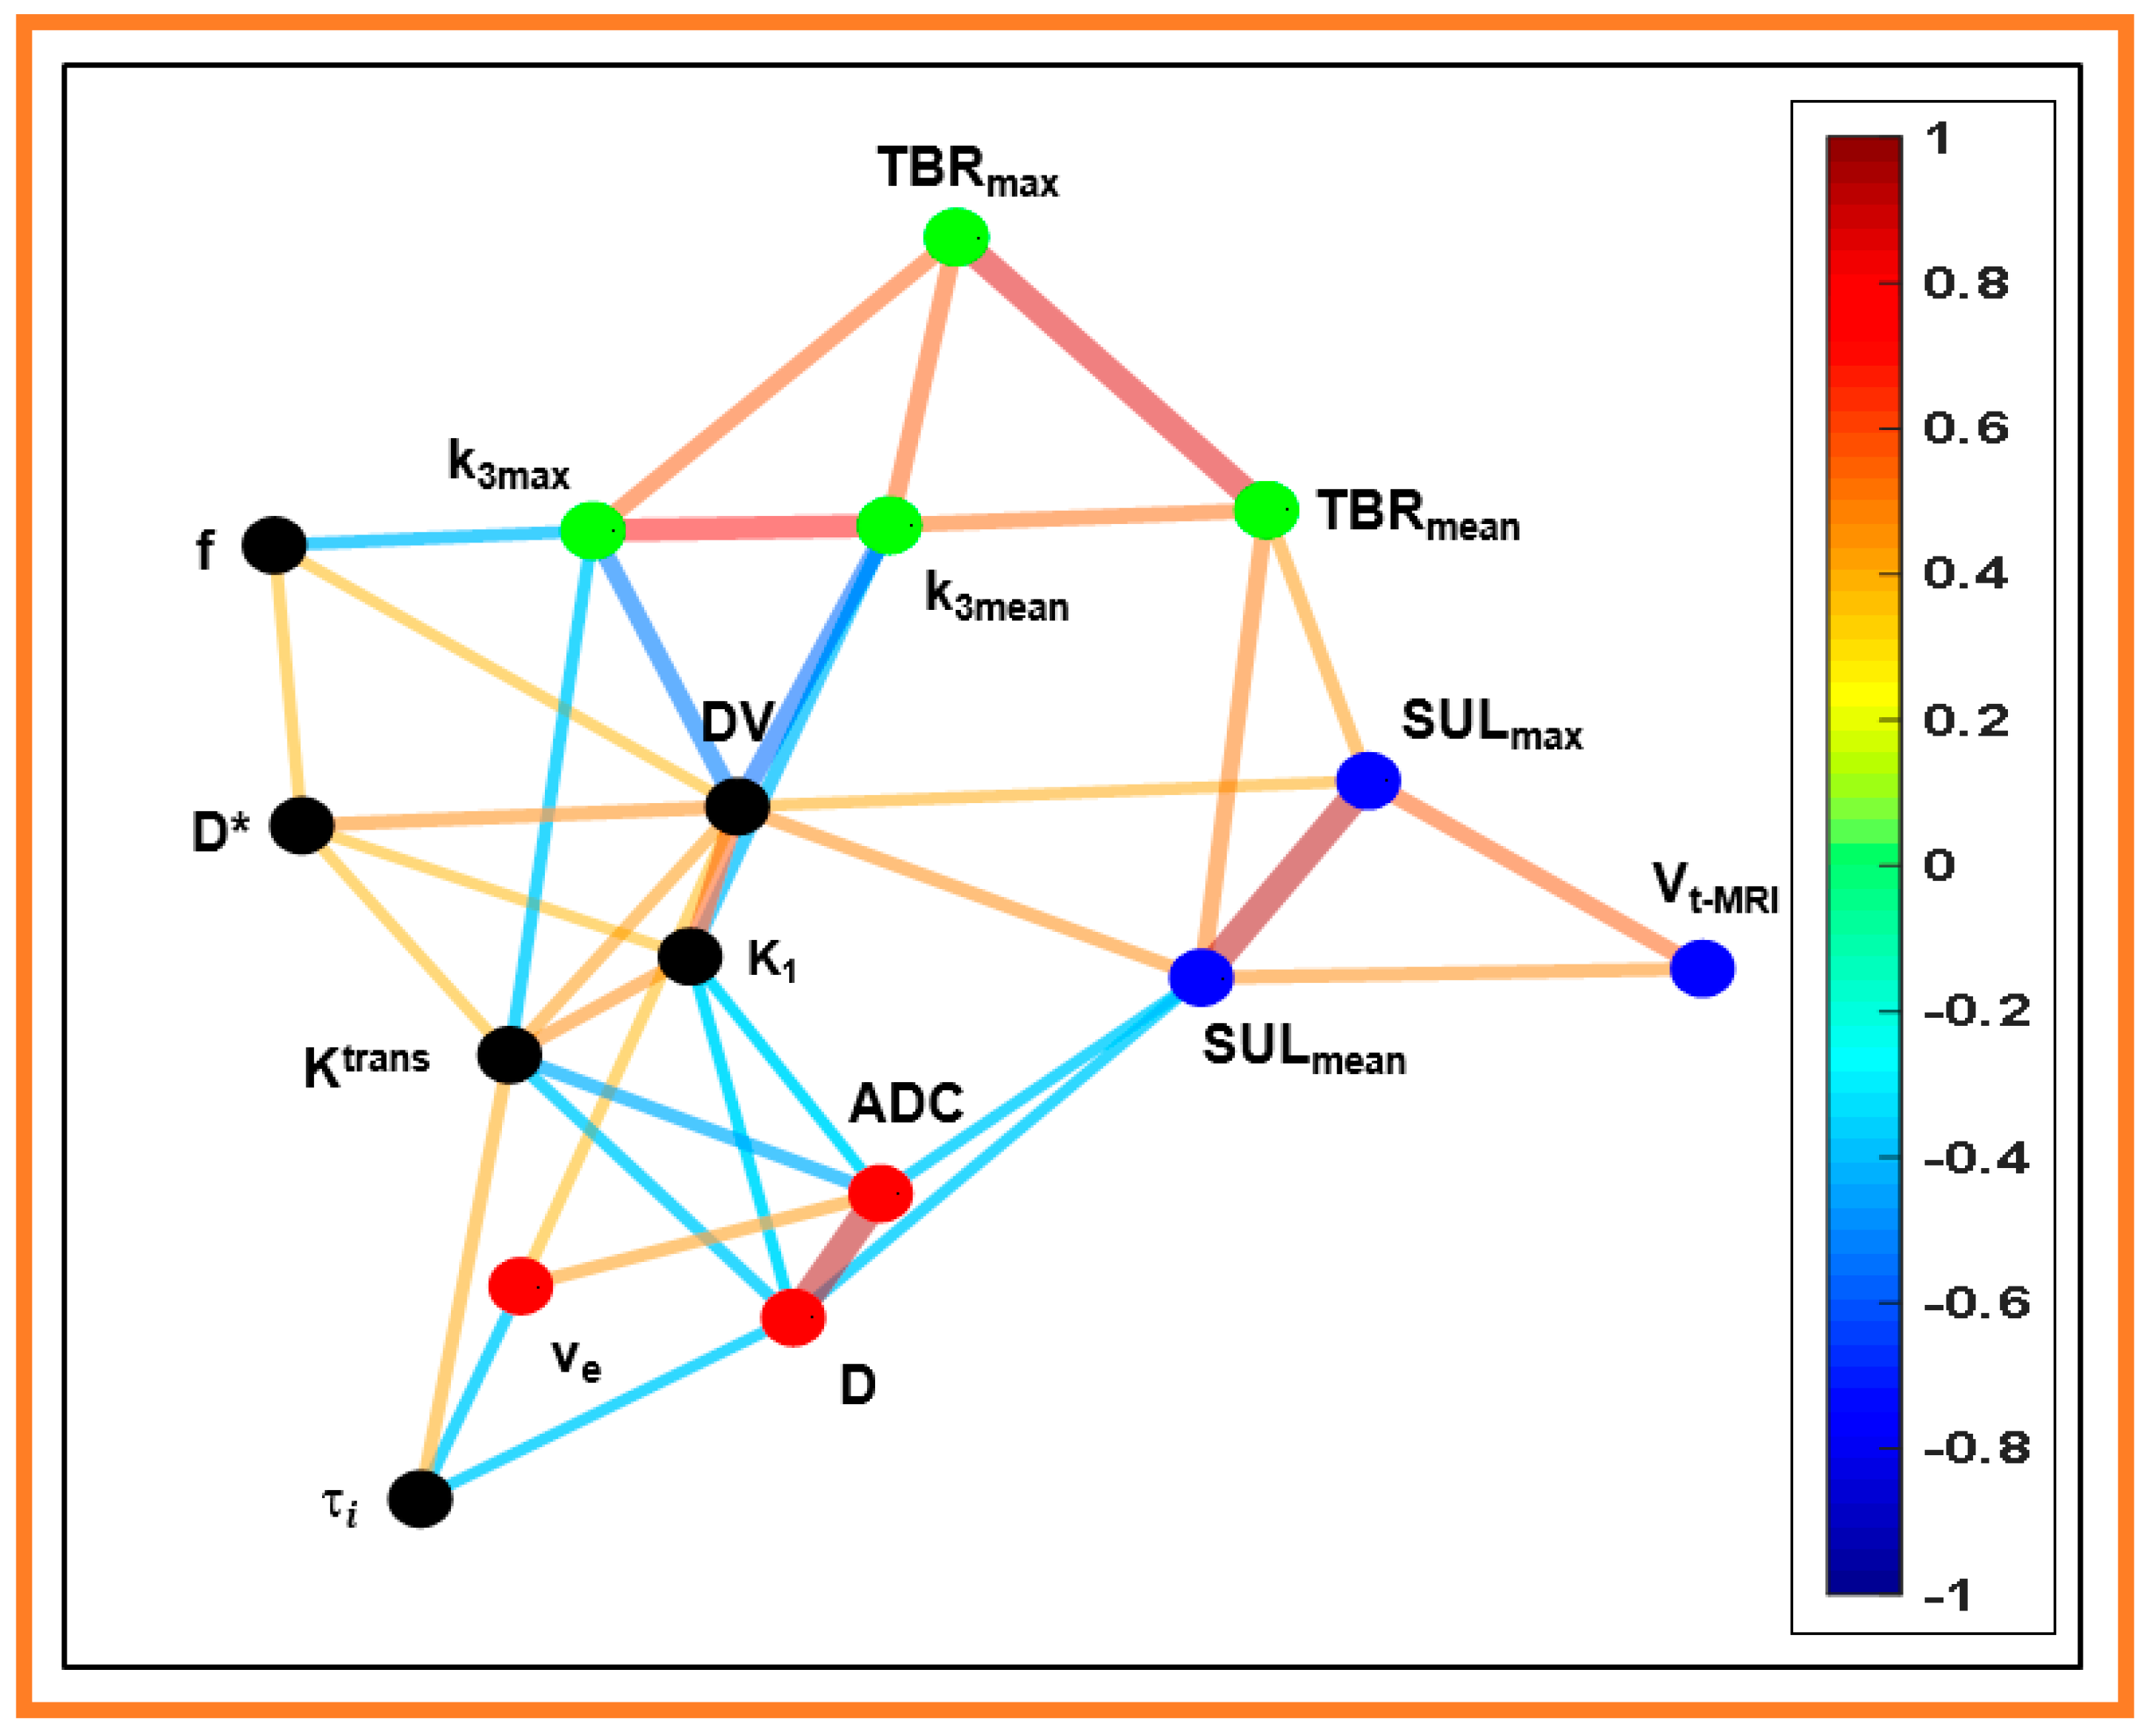
The network as a graph constructed from 16 MMI-derived QI metrics, including T2 weighted tumor volume (Vt-MRI), using the CDA-based “spin-glass” analysis, is illustrated in Figure 7. The CDA approach resulted in four communities with 33 edges in the network. As a note, the edges were constructed between the nodes that yielded a Spearman rank correlation value p < 0.05 (Table 2). The nodes within the community are densely coupled to each other. In contrast, these nodes are relatively sparsely connected with other communities in the same graph. The solid blue line represents the negative correlation. In contrast, the positive correlation is represented by the orange and red colors, respectively. The thickness of the lines representing the extent of correlation ranging from weak to strong between them.
Vt-MR is a community member in the network formed by FDG-PET/CT-derived metrics (SULmax,mean [3 nodes, blue color]). The quantitative metrics ADC, D, and ve formed the 2nd community network (3 nodes, red color). The metrics k3max,mean, and TBRmax,mean created the 3rd community (4 nodes, green color). The fourth community consisted of 6 nodes (black color), including K1 and DV (FMISO), f and D* (DW-MRI), and Ktrans and τi (DCE-MRI). CDA approach yielded 8, 7, and 6 edges for the metrics DV, Ktrans, and K1, respectively.
Ktrans is regarded as one of the most influential metrics to assess tumor microvasculature. Ktrans (a member of the black community) exhibits distinct relationships with nearby nodes (red community [ADC and D] and green community [k3.max]). In contrast, Ktrans did not directly link FDG-PET/CT-derived metrics and tumor volume in the network. The extent of the Ktrans relationship with nearby nodes (K1, DV, k3.max, and D*) was further evaluated using regression analysis. The combination of three nodes (K1, DV, and k3max) yielded a significant correlation (R2 = 0.45, adjusted R2 = 0.38, p = 0.002). In contrast, linear regression analysis between Ktrans and k3max yielded a meaningful inverse relationship (R2 = 0.23, adjusted R2 = 0.19, p = 0.011), indicating the influence of vascular permeability on radiotracer diffusion in hypoxic tumors.

4. Discussion

Integration of metabolic (18F-FDG-PET/CT and 18FMISO- PET/CT) and functional imaging (DW-, and DCE-MRI) aggregate the complementary information of tumor physiology [10,23,41,42]. The present study investigated a correlation at pre-TX between QIs obtained from MMI characterizing tumor = physiology, including glucose metabolism, perfusion, hypoxia, pseudo-diffusion in the capillary network, cellularity, and perfusion/permeability and metabolic activity markers using a CDA-based “spin-glass model” in addition to Spearman correlation in HNSCC patients. The CDA approach identified the four communities and revealed that Ktrans, a measure of perfusion/vascular permeability, links to seven edges in the community. Thus, detecting communities and identifying their relationship is an essential step to investigate robust imaging biomarkers for precision medicine in HNSCC. Our previous two separate studies used 18F-FMISO dynamic PET (dPET) to assess the tumor hypoxia and perfusion and monitor early response to chemo-RT in HNSCC [41]. The first study with 18F-FMISO dPET data provided parametric maps of tumor hypoxia, perfusion, and radiotracer distribution volume, improving the characterization of a tumor lesion [40]. The other study concluded that kinetic modeling of FMISO dPET data reveals a more detailed description of the tumor microenvironment and improved assessment of response to chemo-RT than a single static image [10]. In DW- MRI, IVIM derived QI metrics obtained at pre-TX and intra-TX weeks 1, 2, and 3 were used to characterize and monitor response to chemo-RT. Hierarchical clustering performed using the intra-TX IVIM derived QI metrics demonstrated the subtypes in HPV + patients in HNSCC [23].
Jansen et al. found a correlation between tumor volume and 18F-FMISO SUV in 13 HNSCC patients [36]. The present study also found a strong correlation between pre-TX MRI tumor volume with SULmax,mean. A moderate negative correlation between SULmean and ADC was consistent with previous studies in HNSCC [6,55]. FDG-PET/CT-derived SUV and DWI-MRI-derived ADC represent different aspects of the tumor cells. The glycolytic activity of tumor cells (reflected by FDG uptake) is related to high tumor cell density, consequently restricting water molecule diffusion and lowering ADC values. It has been reported that there was a strong negative correlation between the mean of pre-TX ADC and 18F-FDG PET SUV [56]. The present study did not find a significant positive correlation between K1 and SULmax,mean. In contrast, Vidiri et al. reported a significant negative correlation between Ktrans and 18F-FDG-PET/CT parameters in LNs of oropharyngeal squamous cell carcinoma [13]. Surov et al. reported a moderate positive correlation between SUVmax and kep [11]. In contrast, in the present study, SUL exhibited a nonsignificant negative correlation with kep derived from the FXR model. Chen et al. study concluded that qMRI could provide additional value in distinguishing metastatic nodes, particularly among small nodes, when used with FDG-PET [53].
Dynamic FMISO-PET/CT and DCE-MRI-derived QI metrics capture the tumor physiology through various mechanisms. The molecular weights of FMISO (189.14 Daltons) and Gd-based CA (Gd-DTPA ~ 547 Daltons) are different, and the transport mechanism across the vasculature is assessed differently. The FMISO is lipophilic, and its uptake is driven by passive diffusion out of the vasculature and through the cell membranes. The radiotracer eventually accumulates in hypoxic regions, largely independently of the perfusion. In contrast, the Ktrans measures the influx of a CA entering the EES, altering the T1 relaxation of the tissue water protons, but CA does not enter the cell. As τi is associated with cell size, τi = [(vi/A) × 1/P], where vi/A is the ratio of volume to the cell’s surface area and P is the cell membrane’s permeability. Thus, a decrease in metric τi value associated with shrinkage of a cell would correspond to an increase in ADC/D values. Previous studies reported the inconsistent correlation between τi and SUV in breast cancer [57] and hepatocellular carcinoma [58]. As a note, τi is mainly representing a cell metabolic activity characterized by adenosine triphosphate production [30]. In the present study, Ktrans and k3max exhibited a strong negative Spearman correlation.
Identifying the precise dose (e.g., dose escalation or de-escalation) for HNSCC patients is difficult because of heterogeneous populations of various disease sites, stages, and prognoses. HPV+ oropharyngeal cancer is a distinct biologic entity that shows a favorable prognosis with standard chemo-RT [59]. In contrast, HPV-negative tumors continue to have a poor prognosis despite treatment intensification. Thus, patient selection is vital for treating less aggressive radiotherapy regimens to maintain excellent standard therapy outcomes [60]. The utilities of MMI-derived biomarkers have been considerably improving tumor delineation accuracy, subvolume determination, longitudinal tracking of treatment response, permitting dose escalation or de-escalation to target tissues, and reducing toxicity to nearby tissues and organs [16], thus highlighting the need for robust biomarkers to be included in clinical trials.
Despite the significant advances in MMI methods, findings of reliable biomarkers that can effectively assess changes in tumor physiology after RT are still challenging, especially for precision therapy in HNSCC, given that we do not yet know which one of these imaging modalities is the gold standard. The present study CDA “spin-glass”-based analysis resulted in four communities for 16 MMI-derived metrics, clustering related metrics together in a network. This indicates a preferential linking between nodes to the other groups in the network exhibiting similar characteristics [39]. K1 and Ktrans, measures of the tumor perfusion and permeability for FMISO and Gd-based CA, showed a strong connection in the CDA network. Similarly, DV and ve, distribution volume for FMISO and CA, exhibited a similar relationship. In contrast, k3max, a hypoxia marker, was negatively correlated with the Ktrans and f. The metric k3 is related to the diffusive compartment, which is hypoxic, consistent with the view that tumor hypoxia results from inadequate oxygen supply to the tumor [61]. As a note, Ktrans represents a passive transport of CA across the capillary wall driven by diffusion, whereas k3max is the FMISO uptake in hypoxic tissues caused by convective transport [62]. Therefore, 18F-MISO-PET/CT and DCE-MRI can provide complementary information for characterizing the tumor microenvironments [63]. The community structure displayed by a CDA approach is visually interpretable to identify important biomarker metrics and infer their relationships. Thus, the CDA approach may improve in identifying the surrogate biomarkers for prognostication at pre-TX in HNSCC patients.
The present study is limited by the sample size for CDA analysis, which warrants validation in a larger sample. Motion artifacts in the MR images due to the voluntary and involuntary movements in the neck region, such as swallowing and breathing, can be minimized by carefully setting up the scan. Respiratory motion artifacts can be minimized with proper breath-holding and shortened scan duration. A robust co-registration method could improve the correlation between QIs. The present study was also limited to assessing the correlation between mean QI values rather than a voxel-by-voxel basis. A B1 non-uniformity due to varying the flip angle influences the accuracy and precision of DCE-MRI-derived QIs at higher field strength. Hence, acquiring the B1 mapping sequence can improve the accuracy of DCE-MRI-derived QI metrics. Despite these limitations, the CDA approach demonstrated its potential in assessing the correlation between the QI metrics.

5. Conclusions

Significant Spearman correlations, ranging from moderate to strong, were observed between few QI metrics. The CDA approach illustrated how and to what extent MMI-derived QI metrics were associated in the network. After validation in a larger HNSCC population, the present preliminary findings may help identify potential biomarkers in individualized patient care.

Author Contributions

Conceptualization, N.Y.L., J.L.H. and A.S.-D.; Methodology, R.P., M.G. and J.H.O.; validation, R.P., M.G. and J.H.O.; formal analysis, R.P., M.G., D.A.N. and J.H.O.; investigation, N.Y.L., J.L.H. and A.S.-D.; resources, N.Y.L. and J.L.H.; data curation, R.P., M.G. and J.H.O.; writing—original draft preparation, all authors; writing—review and editing, all authors; visualization, N.Y.L. and J.L.H.; supervision, N.Y.L., A.S.-D. and J.L.H.; funding acquisition, N.Y.L. All authors have read and agreed to the published version of the manuscript.

Funding

This research was funded by NIH, R01 CA238392-01A1 (NYL).

Institutional Review Board Statement

The study was approved by the Institutional Review Board (IRB protocol # 06-007, approved on 02/14/2006).

Informed Consent Statement

Informed consent was obtained from all subjects involved in the study.

Data Availability Statement

The data presented in this study will be provided upon reasonable request.

Acknowledgments

We are thankful to Alyssa Duck for editing the full manuscript.

Conflicts of Interest

The authors declare no conflict of interest.

References

  1. Lo Nigro, C.; Denaro, N.; Merlotti, A.; Merlano, M. Head and neck cancer: Improving outcomes with a multidisciplinary approach. Cancer Manag. Res. 2017, 9, 363–371. [Google Scholar] [CrossRef] [PubMed] [Green Version]
  2. Gillison, M. HPV and its effect on head and neck cancer prognosis. Clin. Adv. Hematol. Oncol. 2010, 8, 680–682. [Google Scholar] [PubMed]
  3. Psyrri, A.; Cohen, E. Oropharyngeal cancer: Clinical implications of the HPV connection. Ann. Oncol. Off. J. Eur. Soc. Med. Oncol. ESMO 2011, 22, 997–999. [Google Scholar] [CrossRef]
  4. King, A.D. Multimodality imaging of head and neck cancer. Cancer Imaging 2007, 7, S37–S46. [Google Scholar] [CrossRef] [Green Version]
  5. Rajendran, J.G.; Krohn, K.A. F-18 Fluoromisonidazole for Imaging Tumor Hypoxia: Imaging the Microenvironment for Personalized Cancer Therapy. Semin. Nucl. Med. 2015, 45, 151–162. [Google Scholar] [CrossRef] [Green Version]
  6. Leibfarth, S.; Simoncic, U.; Monnich, D.; Welz, S.; Schmidt, H.; Schwenzer, N.; Zips, D.; Thorwarth, D. Analysis of pairwise correlations in multi-parametric PET/MR data for biological tumor characterization and treatment individualization strategies. Eur. J. Nucl. Med. Mol. Imaging 2016, 43, 1199–1208. [Google Scholar] [CrossRef] [Green Version]
  7. Goel, R.; Moore, W.; Sumer, B.; Khan, S.; Sher, D.; Subramaniam, R.M. Clinical Practice in PET/CT for the Management of Head and Neck Squamous Cell Cancer. Am. J. Roentgenol. 2017, 209, 289–303. [Google Scholar] [CrossRef]
  8. Vidiri, A.; Gangemi, E.; Ruberto, E.; Pasqualoni, R.; Sciuto, R.; Sanguineti, G.; Farneti, A.; Benevolo, M.; Rollo, F.; Sperati, F. Correlation between histogram-based DCE-MRI parameters and 18F-FDG PET values in oropharyngeal squamous cell carcinoma: Evaluation in primary tumors and metastatic nodes. PLoS ONE 2020, 15, e0229611. [Google Scholar] [CrossRef] [PubMed]
  9. Kikuchi, M.; Yamane, T.; Shinohara, S.; Fujiwara, K.; Hori, S.Y.; Tona, Y.; Yamazaki, H.; Naito, Y.; Senda, M. 18F-fluoromisonidazole positron emission tomography before treatment is a predictor of radiotherapy outcome and survival prognosis in patients with head and neck squamous cell carcinoma. Ann. Nucl. Med. 2011, 25, 625–633. [Google Scholar] [CrossRef]
  10. Grkovski, M.; Lee, N.Y.; Schoder, H.; Carlin, S.D.; Beattie, B.J.; Riaz, N.; Leeman, J.E.; O’Donoghue, J.A.; Humm, J.L. Monitoring early response to chemoradiotherapy with (18)F-FMISO dynamic PET in head and neck cancer. Eur. J. Nucl. Med. Mol. Imaging 2017, 44, 1682–1691. [Google Scholar] [CrossRef] [PubMed]
  11. Surov, A.; Leifels, L.; Meyer, H.J.; Winter, K.; Sabri, O.; Purz, S. Associations Between Histogram Analysis DCE MRI Parameters and Complex F-18-FDG-PET Values in Head and Neck Squamous Cell Carcinoma. Anticancer Res. 2018, 38, 1637–1642. [Google Scholar] [CrossRef]
  12. Simoncic, U.; Leibfarth, S.; Welz, S.; Schwenzer, N.; Schmidt, H.; Reischl, G.; Pfannenberg, C.; la Fougere, C.; Nikolaou, K.; Zips, D.; et al. Comparison of DCE-MRI kinetic parameters and FMISO-PET uptake parameters in head and neck cancer patients. Med. Phys. 2017, 44, 2358–2368. [Google Scholar] [CrossRef]
  13. Minosse, S.; Marzi, S.; Piludu, F.; Boellis, A.; Terrenato, I.; Pellini, R.; Covello, R.; Vidiri, A. Diffusion kurtosis imaging in head and neck cancer: A correlation study with dynamic contrast enhanced MRI. Phys. Med. 2020, 73, 22–28. [Google Scholar] [CrossRef] [PubMed]
  14. Rajendran, J.G.; Schwartz, D.L.; O’Sullivan, J.; Peterson, L.M.; Ng, P.; Scharnhorst, J.; Grierson, J.R.; Krohn, K.A. Tumor hypoxia imaging with [F-18] fluoromisonidazole positron emission tomography in head and neck cancer. Clin. Cancer Res. 2006, 12, 5435–5441. [Google Scholar] [CrossRef] [PubMed] [Green Version]
  15. Bandurska-Luque, A.; Lock, S.; Haase, R.; Richter, C.; Zophel, K.; Abolmaali, N.; Seidlitz, A.; Appolda, S.; Krause, M.; Steinbach, J.; et al. FMISO-PET-based lymph node hypoxia adds to the prognostic value of tumor only hypoxia in HNSCC patients. Radiother. Oncol. 2019, 130, 97–103. [Google Scholar] [CrossRef] [PubMed] [Green Version]
  16. Riaz, N.; Sherman, E.; Pei, X.; Schoder, H.; Grkovski, M.; Paudyal, R.; Katabi, N.; Selenica, P.; Yamaguchi, T.N.; Ma, D.; et al. Precision Radiotherapy: Reduction in Radiation for Oropharyngeal Cancer in the 30 ROC Trial. J. Natl. Cancer Inst. 2021. [Google Scholar] [CrossRef] [PubMed]
  17. Le Bihan, D.; Breton, E.; Lallemand, D.; Grenier, P.; Cabanis, E.; Laval-Jeantet, M. MR imaging of intravoxel incoherent motions: Application to diffusion and perfusion in neurologic disorders. Radiology 1986, 161, 401–407. [Google Scholar] [CrossRef] [Green Version]
  18. Vandecaveye, V.; Dirix, P.; De Keyzer, F.; Op de Beeck, K.; Poorten, V.V.; Delaere, P.; Verbeken, E.; Hermans, R.; Nuyts, S. Accuracy of Diffusion-Weighted Mri for Nodal Staging and Radiotherapy Planning of Head and Neck Squamous Cell Carcinoma. Radiother. Oncol. 2008, 88, S152–S153. [Google Scholar]
  19. Kim, S.; Loevner, L.; Quon, H.; Sherman, E.; Weinstein, G.; Kilger, A.; Poptani, H. Diffusion-weighted magnetic resonance imaging for predicting and detecting early response to chemoradiation therapy of squamous cell carcinomas of the head and neck. Clin. Cancer Res. 2009, 15, 986–994. [Google Scholar] [CrossRef] [Green Version]
  20. Le Bihan, D. Intravoxel incoherent motion imaging using steady-state free precession. Magn. Reson. Med. 1988, 7, 346–351. [Google Scholar] [CrossRef]
  21. Hauser, T.; Essig, M.; Jensen, A.; Laun, F.B.; Munter, M.; Maier-Hein, K.H.; Stieltjes, B. Prediction of treatment response in head and neck carcinomas using IVIM-DWI: Evaluation of lymph node metastasis. Eur. J. Radiol. 2014, 83, 783–787. [Google Scholar] [CrossRef]
  22. Ding, Y.; Hazle, J.D.; Mohamed, A.S.; Frank, S.J.; Hobbs, B.P.; Colen, R.R.; Gunn, G.B.; Wang, J.; Kalpathy-Cramer, J.; Garden, A.S.; et al. Intravoxel incoherent motion imaging kinetics during chemoradiotherapy for human papillomavirus-associated squamous cell carcinoma of the oropharynx: Preliminary results from a prospective pilot study. NMR Biomed. 2015. [Google Scholar] [CrossRef] [PubMed]
  23. Paudyal, R.; Oh, J.H.; Riaz, N.; Venigalla, P.; Li, J.; Hatzoglou, V.; Leeman, J.; Nunez, D.A.; Lu, Y.; Deasy, J.O.; et al. Intravoxel incoherent motion diffusion-weighted MRI during chemoradiation therapy to characterize and monitor treatment response in human papillomavirus head and neck squamous cell carcinoma. J. Magn. Reson. Imaging 2017, 45, 1013–1023. [Google Scholar] [CrossRef]
  24. Hou, B.L.; Hu, J. MRI and MRS of human brain tumors. Methods Mol. Biol. 2009, 520, 297–314. [Google Scholar] [CrossRef]
  25. King, A.D.; Chow, S.K.; Yu, K.H.; Mo, F.K.; Yeung, D.K.; Yuan, J.; Law, B.K.; Bhatia, K.S.; Vlantis, A.C.; Ahuja, A.T. DCE-MRI for Pre-Treatment Prediction and Post-Treatment Assessment of Treatment Response in Sites of Squamous Cell Carcinoma in the Head and Neck. PLoS ONE 2015, 10, e0144770. [Google Scholar] [CrossRef]
  26. Chawla, S.; Kim, S.; Dougherty, L.; Wang, S.; Loevner, L.A.; Quon, H.; Poptani, H. Pretreatment diffusion-weighted and dynamic contrast-enhanced MRI for prediction of local treatment response in squamous cell carcinomas of the head and neck. AJR Am. J. Roentgenol. 2013, 200, 35–43. [Google Scholar] [CrossRef] [PubMed] [Green Version]
  27. Shukla-Dave, A.; Lee, N.Y.; Jansen, J.F.; Thaler, H.T.; Stambuk, H.E.; Fury, M.G.; Patel, S.G.; Moreira, A.L.; Sherman, E.; Karimi, S.; et al. Dynamic contrast-enhanced magnetic resonance imaging as a predictor of outcome in head-and-neck squamous cell carcinoma patients with nodal metastases. Int. J. Radiat. Oncol. Biol. Phys. 2012, 82, 1837–1844. [Google Scholar] [CrossRef] [PubMed] [Green Version]
  28. Kim, S.; Loevner, L.A.; Quon, H.; Kilger, A.; Sherman, E.; Weinstein, G.; Chalian, A.; Poptani, H. Prediction of response to chemoradiation therapy in squamous cell carcinomas of the head and neck using dynamic contrast-enhanced MR imaging. AJNR Am. J. Neuroradiol. 2010, 31, 262–268. [Google Scholar] [CrossRef] [Green Version]
  29. Quon, H.; Kim, S.; Loevner, L.; Rosen, M.; Sherman, E.; Kilger, A.; Poptani, H. DCE-MRI perfusion imaging of head and neck squamous cell carcinoma nodal metastasis: Identifying radioresistance and the distant metastatic phenotyp. J. Clin. Oncol. 2008, 26, 6041. [Google Scholar] [CrossRef]
  30. Nath, K.; Paudyal, R.; Nelson, D.; Pickup, S.; Zhou, R.; Leeper, D.; Heitjan, D.; Poptani, H.; Glickson, J. Acute changes in cellular-interstitial water exchange rate in DB-1 melanoma xenografts after lonidamine administration as a marker of tumor energetics and ion transport. Proc. Intl. Soc. Mag. Reson. Med. 2014, 22, 2757. [Google Scholar]
  31. Springer, C.S., Jr.; Li, X.; Tudorica, L.A.; Oh, K.Y.; Roy, N.; Chui, S.Y.; Naik, A.M.; Holtorf, M.L.; Afzal, A.; Rooney, W.D.; et al. Intratumor mapping of intracellular water lifetime: Metabolic images of breast cancer? NMR Biomed. 2014, 27, 760–773. [Google Scholar] [CrossRef]
  32. Chawla, S.; Loevner, L.A.; Kim, S.G.; Hwang, W.T.; Wang, S.; Verma, G.; Mohan, S.; LiVolsi, V.; Quon, H.; Poptani, H. Dynamic Contrast-Enhanced MRI-Derived Intracellular Water Lifetime (tau i): A Prognostic Marker for Patients with Head and Neck Squamous Cell Carcinomas. AJNR Am. J. Neuroradiol. 2018, 39, 138–144. [Google Scholar] [CrossRef] [Green Version]
  33. Choi, S.H.; Paeng, J.C.; Sohn, C.H.; Pagsisihan, J.R.; Kim, Y.J.; Kim, K.G.; Jang, J.Y.; Yun, T.J.; Kim, J.H.; Han, M.H.; et al. Correlation of 18F-FDG uptake with apparent diffusion coefficient ratio measured on standard and high b value diffusion MRI in head and neck cancer. J. Nucl. Med. 2011, 52, 1056–1062. [Google Scholar] [CrossRef] [PubMed] [Green Version]
  34. Nakamatsu, S.; Matsusue, E.; Miyoshi, H.; Kakite, S.; Kaminou, T.; Ogawa, T. Correlation of apparent diffusion coefficients measured by diffusion-weighted MR imaging and standardized uptake values from FDG PET/CT in metastatic neck lymph nodes of head and neck squamous cell carcinomas. Clin. Imaging 2012, 36, 90–97. [Google Scholar] [CrossRef] [PubMed] [Green Version]
  35. Zwirner, K.; Thorwarth, D.; Winter, R.M.; Welz, S.; Weiss, J.; Schwenzer, N.F.; Schmidt, H.; la Fougere, C.; Nikolaou, K.; Zips, D.; et al. Voxel-wise correlation of functional imaging parameters in HNSCC patients receiving PET/MRI in an irradiation setup. Strahlenther. Onkol. 2018, 194, 719–726. [Google Scholar] [CrossRef] [PubMed]
  36. Jansen, J.F.; Schoder, H.; Lee, N.Y.; Wang, Y.; Pfister, D.G.; Fury, M.G.; Stambuk, H.E.; Humm, J.L.; Koutcher, J.A.; Shukla-Dave, A. Noninvasive assessment of tumor microenvironment using dynamic contrast-enhanced magnetic resonance imaging and 18F-fluoromisonidazole positron emission tomography imaging in neck nodal metastases. Int. J. Radiat. Oncol. Biol. Phys. 2010, 77, 1403–1410. [Google Scholar] [CrossRef] [Green Version]
  37. Wiedenmann, N.; Grosu, A.L.; Buchert, M.; Rischke, H.C.; Ruf, J.; Bielak, L.; Majerus, L.; Ruhle, A.; Bamberg, F.; Baltas, D.; et al. The utility of multiparametric MRI to characterize hypoxic tumor subvolumes in comparison to FMISO PET/CT. Consequences for diagnosis and chemoradiation treatment planning in head and neck cancer. Radiother. Oncol. J. Eur. Soc. Ther. Radiol. Oncol. 2020, 150, 128–135. [Google Scholar] [CrossRef] [PubMed]
  38. Girvan, M.; Newman, M.E. Community structure in social and biological networks. Proc. Natl. Acad. Sci. USA 2002, 99, 7821–7826. [Google Scholar] [CrossRef] [PubMed] [Green Version]
  39. Reichardt, J.; Bornholdt, S. Statistical mechanics of community detection. Phys. Rev. E 2006, 74, 016110. [Google Scholar] [CrossRef] [Green Version]
  40. Grkovski, M.; Schoder, H.; Lee, N.Y.; Carlin, S.D.; Beattie, B.J.; Riaz, N.; Leeman, J.E.; O’Donoghue, J.A.; Humm, J.L. Multiparametric Imaging of Tumor Hypoxia and Perfusion with (18)F-Fluoromisonidazole Dynamic PET in Head and Neck Cancer. J. Nucl. Med. 2017, 58, 1072–1080. [Google Scholar] [CrossRef] [Green Version]
  41. Beichel, R.R.; Smith, B.J.; Bauer, C.; Ulrich, E.J.; Ahmadvand, P.; Budzevich, M.M.; Gillies, R.J.; Goldgof, D.; Grkovski, M.; Hamarneh, G. Multi-site quality and variability analysis of 3D FDG PET segmentations based on phantom and clinical image data. Med. Phys. 2017, 44, 479–496. [Google Scholar] [CrossRef]
  42. Paudyal, R.; Konar, A.S.; Obuchowski, N.A.; Hatzoglou, V.; Chenevert, T.L.; Malyarenko, D.I.; Swanson, S.D.; LoCastro, E.; Jambawalikar, S.; Liu, M.Z.; et al. Repeatability of Quantitative Diffusion-Weighted Imaging Metrics in Phantoms, Head-and-Neck and Thyroid Cancers: Preliminary Findings. Tomogr. A J. Imaging Res. 2019, 5, 15–25. [Google Scholar] [CrossRef]
  43. Yankeelov, T.E.; Rooney, W.D.; Li, X.; Springer, C.S., Jr. Variation of the relaxographic "shutter-speed" for transcytolemmal water exchange affects the CR bolus-tracking curve shape. Magn. Reson. Med. 2003, 50, 1151–1169. [Google Scholar] [CrossRef] [PubMed]
  44. Paudyal, R.; Bagher-Ebadian, H.; Nagaraja, T.N.; Fenstermacher, J.D.; Ewing, J.R. Modeling of Look-Locker estimates of the magnetic resonance imaging estimate of longitudinal relaxation rate in tissue after contrast administration. Magn. Reson. Med. 2011, 66, 1432–1444. [Google Scholar] [CrossRef] [Green Version]
  45. McConnell, H.M. Reaction Rates by Nuclear Magnetic Resonance. J. Chem. Phys. 1958, 28, 430–431. [Google Scholar] [CrossRef] [Green Version]
  46. Paudyal, R.; Poptani, H.; Cai, K.; Zhou, R.; Glickson, J.D. Impact of transvascular and cellular–interstitial water exchange on dynamic contrast-enhanced magnetic resonance imaging estimates of blood to tissue transfer constant and blood plasma volume. J. Magn. Reson. Imaging 2013, 37, 435–444. [Google Scholar] [CrossRef] [PubMed]
  47. Schneider, C.A.; Rasband, W.S.; Eliceiri, K.W. NIH Image to ImageJ: 25 years of image analysis. Nat. Methods 2012, 9, 671–675. [Google Scholar] [CrossRef]
  48. Shukla-Dave, A.; Lee, N.; Stambuk, H.; Wang, Y.; Huang, W.; Thaler, H.T.; Patel, S.G.; Shah, J.P.; Koutcher, J.A. Average arterial input function for quantitative dynamic contrast enhanced magnetic resonance imaging of neck nodal metastases. BMC Med. Phys. 2009, 9, 4. [Google Scholar] [CrossRef] [Green Version]
  49. Lu, Y.; Jansen, J.F.; Mazaheri, Y.; Stambuk, H.E.; Koutcher, J.A.; Shukla-Dave, A. Extension of the intravoxel incoherent motion model to non-gaussian diffusion in head and neck cancer. J. Magn. Reson. Imaging 2012, 36, 1088–1096. [Google Scholar] [CrossRef] [Green Version]
  50. Paudyal, R.; Chen, L.; Oh, J.; Zakeri, K.; Hatzoglou, V.; Tsai, C.; Lee, N.; Shukla-Dave, A. Nongaussian intravoxel Incoherent motion diffusion weighted and fast exchange regime dynamic contrast-enhanced-MRI of nasopharyngeal carcinoma: Preliminary study for predicting locoregional failure. Cancers 2021, 15, 1158. [Google Scholar] [CrossRef]
  51. LoCastro, E.; Paudyal, R.; Mazaheri, Y.; Hatzoglou, V.; Oh, J.H.; Lu, Y.; Konar, A.S.; Vom Eigen, K.; Ho, A.; Ewing, J.R.; et al. Computational Modeling of Interstitial Fluid Pressure and Velocity in Head and Neck Cancer Based on Dynamic Contrast-Enhanced Magnetic Resonance Imaging: Feasibility Analysis. Tomogr. A J. Imaging Res. 2020, 6, 129–138. [Google Scholar] [CrossRef]
  52. Bagher-Ebadian, H.; Jain, R.; Nejad-Davarani, S.P.; Mikkelsen, T.; Lu, M.; Jiang, Q.; Scarpace, L.; Arbab, A.S.; Narang, J.; Soltanian-Zadeh, H.; et al. Model selection for DCE-T1 studies in glioblastoma. Magn. Reson. Med. 2012, 68, 241–251. [Google Scholar] [CrossRef] [PubMed] [Green Version]
  53. Newman, M.E.J. Detecting community structure in networks. Eur Phys. J. B 2004, 38, 321–330. [Google Scholar] [CrossRef]
  54. R Development Core Team. A Language and Environment for Statistical Computing; R Foundation for Statistical Computing: Vienna, Austria, 2020; Available online: http://www.R-project.org.
  55. Nakajo, M.; Nakajo, M.; Kajiya, Y.; Tani, A.; Kamiyama, T.; Yonekura, R.; Fukukura, Y.; Matsuzaki, T.; Nishimoto, K.; Nomoto, M.; et al. FDG PET/CT and Diffusion-Weighted Imaging of Head and Neck Squamous Cell Carcinoma Comparison of Prognostic Significance Between Primary Tumor Standardized Uptake Value and Apparent Diffusion Coefficient. Clin. Nucl. Med. 2012, 37, 475–480. [Google Scholar] [CrossRef]
  56. Aramburu, D.N.; Medina, A.L.; Iglesias, M.M.; Gomez, F.S.; Dave, A.; Hatzoglou, V.; Paudyal, R.; Calzado, A.; Deasy, J.O.; Shukla-Dave, A.; et al. Multimodality functional imaging using DW-MRI and F-18-FDG-PET/CT during radiation therapy for human papillomavirus negative head and neck squamous cell carcinoma: Meixoeiro Hospital of Vigo Experience. World J. Radiol. 2017, 9, 17–26. [Google Scholar] [CrossRef]
  57. Inglese, M.; Cavaliere, C.; Monti, S.; Forte, E.; Incoronato, M.; Nicolai, E.; Salvatore, M.; Aiello, M. A multi-parametric PET/MRI study of breast cancer: Evaluation of DCE-MRI pharmacokinetic models and correlation with diffusion and functional parameters. NMR Biomed. 2019, 32, e4026. [Google Scholar] [CrossRef] [PubMed]
  58. Hectors, S.J.; Wagner, M.; Besa, C.; Huang, W.; Taouli, B. Multiparametric FDG-PET/MRI of Hepatocellular Carcinoma: Initial Experience. Contrast Media Mol. Imaging 2018, 2018, 5638283. [Google Scholar] [CrossRef] [Green Version]
  59. Chen, T.C.; Wu, C.T.; Ko, J.Y.; Yang, T.L.; Lou, P.J.; Wang, C.P.; Chang, Y.L. Clinical characteristics and treatment outcome of oropharyngeal squamous cell carcinoma in an endemic betel quid region. Sci. Rep. 2020, 10, 526. [Google Scholar] [CrossRef] [Green Version]
  60. O’Sullivan, B.; Huang, S.H.; Siu, L.L.; Waldron, J.; Zhao, H.; Perez-Ordonez, B.; Weinreb, I.; Kim, J.; Ringash, J.; Bayley, A.; et al. Deintensification candidate subgroups in human papillomavirus-related oropharyngeal cancer according to minimal risk of distant metastasis. J. Clin. Oncol. 2013, 31, 543–550. [Google Scholar] [CrossRef]
  61. Koch, C.J.; Jenkins, W.T.; Jenkins, K.W.; Yang, X.Y.; Shuman, A.L.; Pickup, S.; Riehl, C.R.; Paudyal, R.; Poptani, H.; Evans, S.M. Mechanisms of blood flow and hypoxia production in rat 9L-epigastric tumors. Tumor Microenviron. Ther. 2013, 1, 1–13. [Google Scholar] [CrossRef] [Green Version]
  62. Asgari, H.; Soltani, M.; Sefidgar, M. Modeling of FMISO [F(18)] nanoparticle PET tracer in normal-cancerous tissue based on real clinical image. Microvasc. Res. 2018, 118, 20–30. [Google Scholar] [CrossRef] [PubMed]
  63. Gertsenshteyn, I.; Epel, B.; Barth, E.; Leoni, L.; Markiewicz, E.; Tsai, H.M.; Fan, X.; Giurcanu, M.; Bodero, D.; Zamora, M.; et al. Improving Tumor Hypoxia Location in (18)F-Misonidazole PET with Dynamic Contrast-enhanced MRI Using Quantitative Electron Paramagnetic Resonance Partial Oxygen Pressure Images. Radiol. Imaging Cancer 2021, 3, e200104. [Google Scholar] [CrossRef] [PubMed]
Figure 1. Representative mean semilogarithmic signal intensity decay curve as a function of the multiple b-value (black circle). The data were fitted with the monoexponential model (solid red line) and intravoxel incoherent motion (IVIM) model (solid blue line).
Cancers 13 03908 g001
Figure 2. Representative multimodality imaging signal plots with time for data obtained from the metastatic neck lymph node in a patient with head and neck squamous cell carcinomas. (A) Measured mean FMISO-PET/CT time-activity curve (circles) data connected with a solid line (blue), and the corresponding input function (in the inset). (B) Signal intensity time curves fitted with the fast exchange regime (FXR) model. The circle (black) and solid line (red) represent the data and FXR model fit. Insert: Plasma contrast agent concentration, Cp with time.
Cancers 13 03908 g002
Figure 3. Left column: Representative axial images of 18F-fluoromisonidazole (18F-FMISO) positron emission tomography (PET/CT) from HPV-positive head and neck squamous carcinoma patient. Right column: 18F-fluorodeoxyglucose-PET/CT derived standard uptake value (SUV) and FMISO-PET derived tumor to blood ratio (TBR), k3, and K1 maps.
Cancers 13 03908 g003
Figure 4. Top: Representative diffusion-weighted image (b = 0 s/mm2) and monoexponential and intravoxel incoherent motion models-derived parametric maps overlaid on diffusion-weighted image (b = 0 s/mm2). Bottom: Representative precontrast T1 weighted (T1w) image and fast exchange regime model-derived parametric maps overlaid on precontrast T1w images.
Cancers 13 03908 g004
Figure 5. Scatter plot showing a correlation between 18F-FDG-PET/CT-derived maximum standardized uptake value normalized to lean body mass (SULmax) and metastatic lymph node volumes from T2 weighted MRI (Vt- MRI). Circles represent the data, and the solid line denotes the line of best fit.
Cancers 13 03908 g005
Figure 6. Representative scatter plots showing the relationships between quantitative imaging metrics derived from multimodality imaging methods. (A) True diffusion coefficient (D) vs. mean of the maximum standardized uptake value normalized to lean body mass (SULmean). (B) D vs. K1 (Perfusion constant for FMISO). (C) Ktrans (Volume transfer constant for Gd-based contrast agent) vs. K1. (D) Ktrans vs. DV (FMISO distribution volume). (E) Ktrans vs. k3max. (F) ve (Volume fraction of the extravascular extracellular space ) vs. DV.
Cancers 13 03908 g006
Figure 7. Sample network with 16 nodes and 33 edges constructed from a community detection algorithm (CDA) based on the spin-glass model. The nodes represent the quantitative imaging (QI) metrics derived from four multimodality imaging which are connected by lines or edges in the graph. The perfusion metric, K1, and distribution volume (DV) derived from the 18FMISO-PET/CT overlap with DW- and DCE-MRI metrics and are densely interconnected compared to other metrics in the network ( blue color: 3 nodes [Vt-MRI, SULmax, mean], green color: 4 nodes [TBRmax, mean, and k3max,mean] black color 6 nodes [K1, DV, D* and f, Ktrans and τi], and red color: 3 nodes [ADC, D, and ve]). A solid blue line represents the negative correlation, whereas the orange and red colors represent the positive correlation among the QIs. The thickness of lines indicates the extent of a correlation (weak, moderate, and strong). The value in the color bar scale represents either negative or positive links detected by the CDA approach in networks.
Cancers 13 03908 g007
Table 1. Summary of multimodality imaging derived quantitative imaging metrics values.
MethodModel ParameterValue 1
18F-FDG-PET/CTSULmax8.91 ± 3.94
SULmean5.26 ± 2.76
18F-FMISO-PET/CTK1 (min−1)0.33 ± 0.15
k3 max (min−1)0.0087 ± 0.0049
k3 mean (min−1)0.0034 ± 0.0021
TBRmax1.76 ± 0.53
TBRmean1.29 ± 0.27
DV0.89 ± 0.14
DWADC × 10−3 (mm2/s)0.93 ± 0.14
D × 10−3 (mm2/s)0.67 ± 0.13
D* × 1 0−3 (mm2/s)9.02 ± 1.80
f0.16 ± 0.06
DCEKtrans (min−1)0.18 ± 0.06
ve0.32 ± 0.09
τi (s)0.670 ± 0.15
FDG-PET tumor volumeVt-PET (cm3)13.59 ± 7.65
T2w MRI tumor volumeVt-MRI (cm3)11.41 ± 10.09
Note: 1 Data are represented as mean ± SD.
Table 2. Summary of Spearman rank correlation analysis (ρ) results between the quantitative metrics derived from multimodality imaging data.
Quantitative metricPET volumeMR T2 weighted volumeADCDD*fKtransveτikepSULmaxSULmeanK1k3.maxk3.meanDVTBR MaxTBR Mean
PET volume 0.84 *−0.09−0.100.28−0.060.19−0.090.160.170.58 *0.42 *0.260.290.130.160.300.20
MRI T2 weighted volume −0.17−0.180.070.010.14−0.140.120.260.57 *0.48 *0.170.300.310.040.250.27
ADC 0.95 *−0.34−0.18−0.48 *0.46 *−0.360.18−0.29−0.42 *−0.40 *0.260.15−0.310.07−0.14
D −0.26−0.18−0.43 *0.32−0.41 *0.23−0.31−0.41 *−0.40 *0.320.23−0.320.14−0.08
D* 0.39 *0.39 *−0.110.010.040.210.240.40 *−0.25−0.350.49 *0.090.13
f 0.310.180.14−0.140.060.200.20−0.45 *−0.300.40 *−0.180.12
Ktrans −0.100.43 *0.120.170.280.48 *−0.41 *−0.270.44 *−0.17−0.03
ve −0.41 *−0.150.170.150.02−0.20−0.260.40 *0.140.13
τi −0.030.060.110.08−0.170.05−0.04−0.23−0.12
kep −0.11−0.160.200.340.20−0.23−0.09−0.20
SULmax 0.94 *−0.01−0.09−0.020.42 *0.360.44 *
SULmean 0.003−0.15−0.020.48 *0.380.53*
K1 −0.26−0.46 *0.59 *−0.18−0.19
k3.max 0.79 *−0.57 *0.57 *0.34
k3.mean −0.60 *0.57 *0.54 *
DV 0.130.23
TBRmax 0.88 *
TBRmean
The p-value < 0.05 is denoted by an asterisk *. ADC: Apparent diffusion coefficient, D: true diffusion coefficient, D*: pseudo-diffusion constant, f: perfusion fraction, Ktrans: volume transfer constant, ve: volume fraction of extravascular extracellular space (EES), τi: mean lifetime of water molecules, kep: transport constant for contrast agent form EES to blood plasma space, SUL: standardized uptake values of 18F-fluorodeoxyglucose divided by lean body mass, K1: transport rate constant of tracer from the plasma to the tissue for 18F-fluoromisonidazole (FMISO), k3: kinetic rate constant approximating the rate of irreversible binding of FMISO, TBR: Tumor-to-Blood Ratio, and DV: total 18F-FMISO distribution volume.
Publisher’s Note: MDPI stays neutral with regard to jurisdictional claims in published maps and institutional affiliations.