
From Sampling to Sequencing: A Liquid Biopsy Pre-Analytic Workflow to Maximize Multi-Layer Genomic Information from a Single Tube

 ,
, 

Abstract
Simple Summary
Abstract
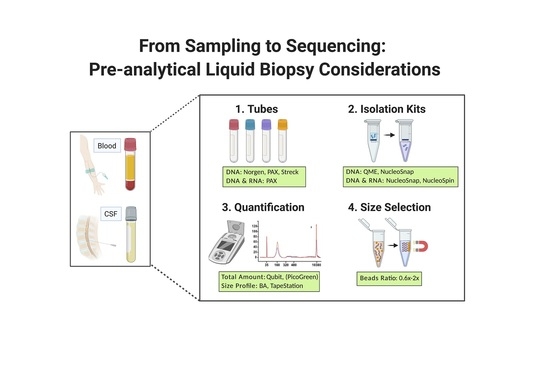
1. Introduction
2. Results
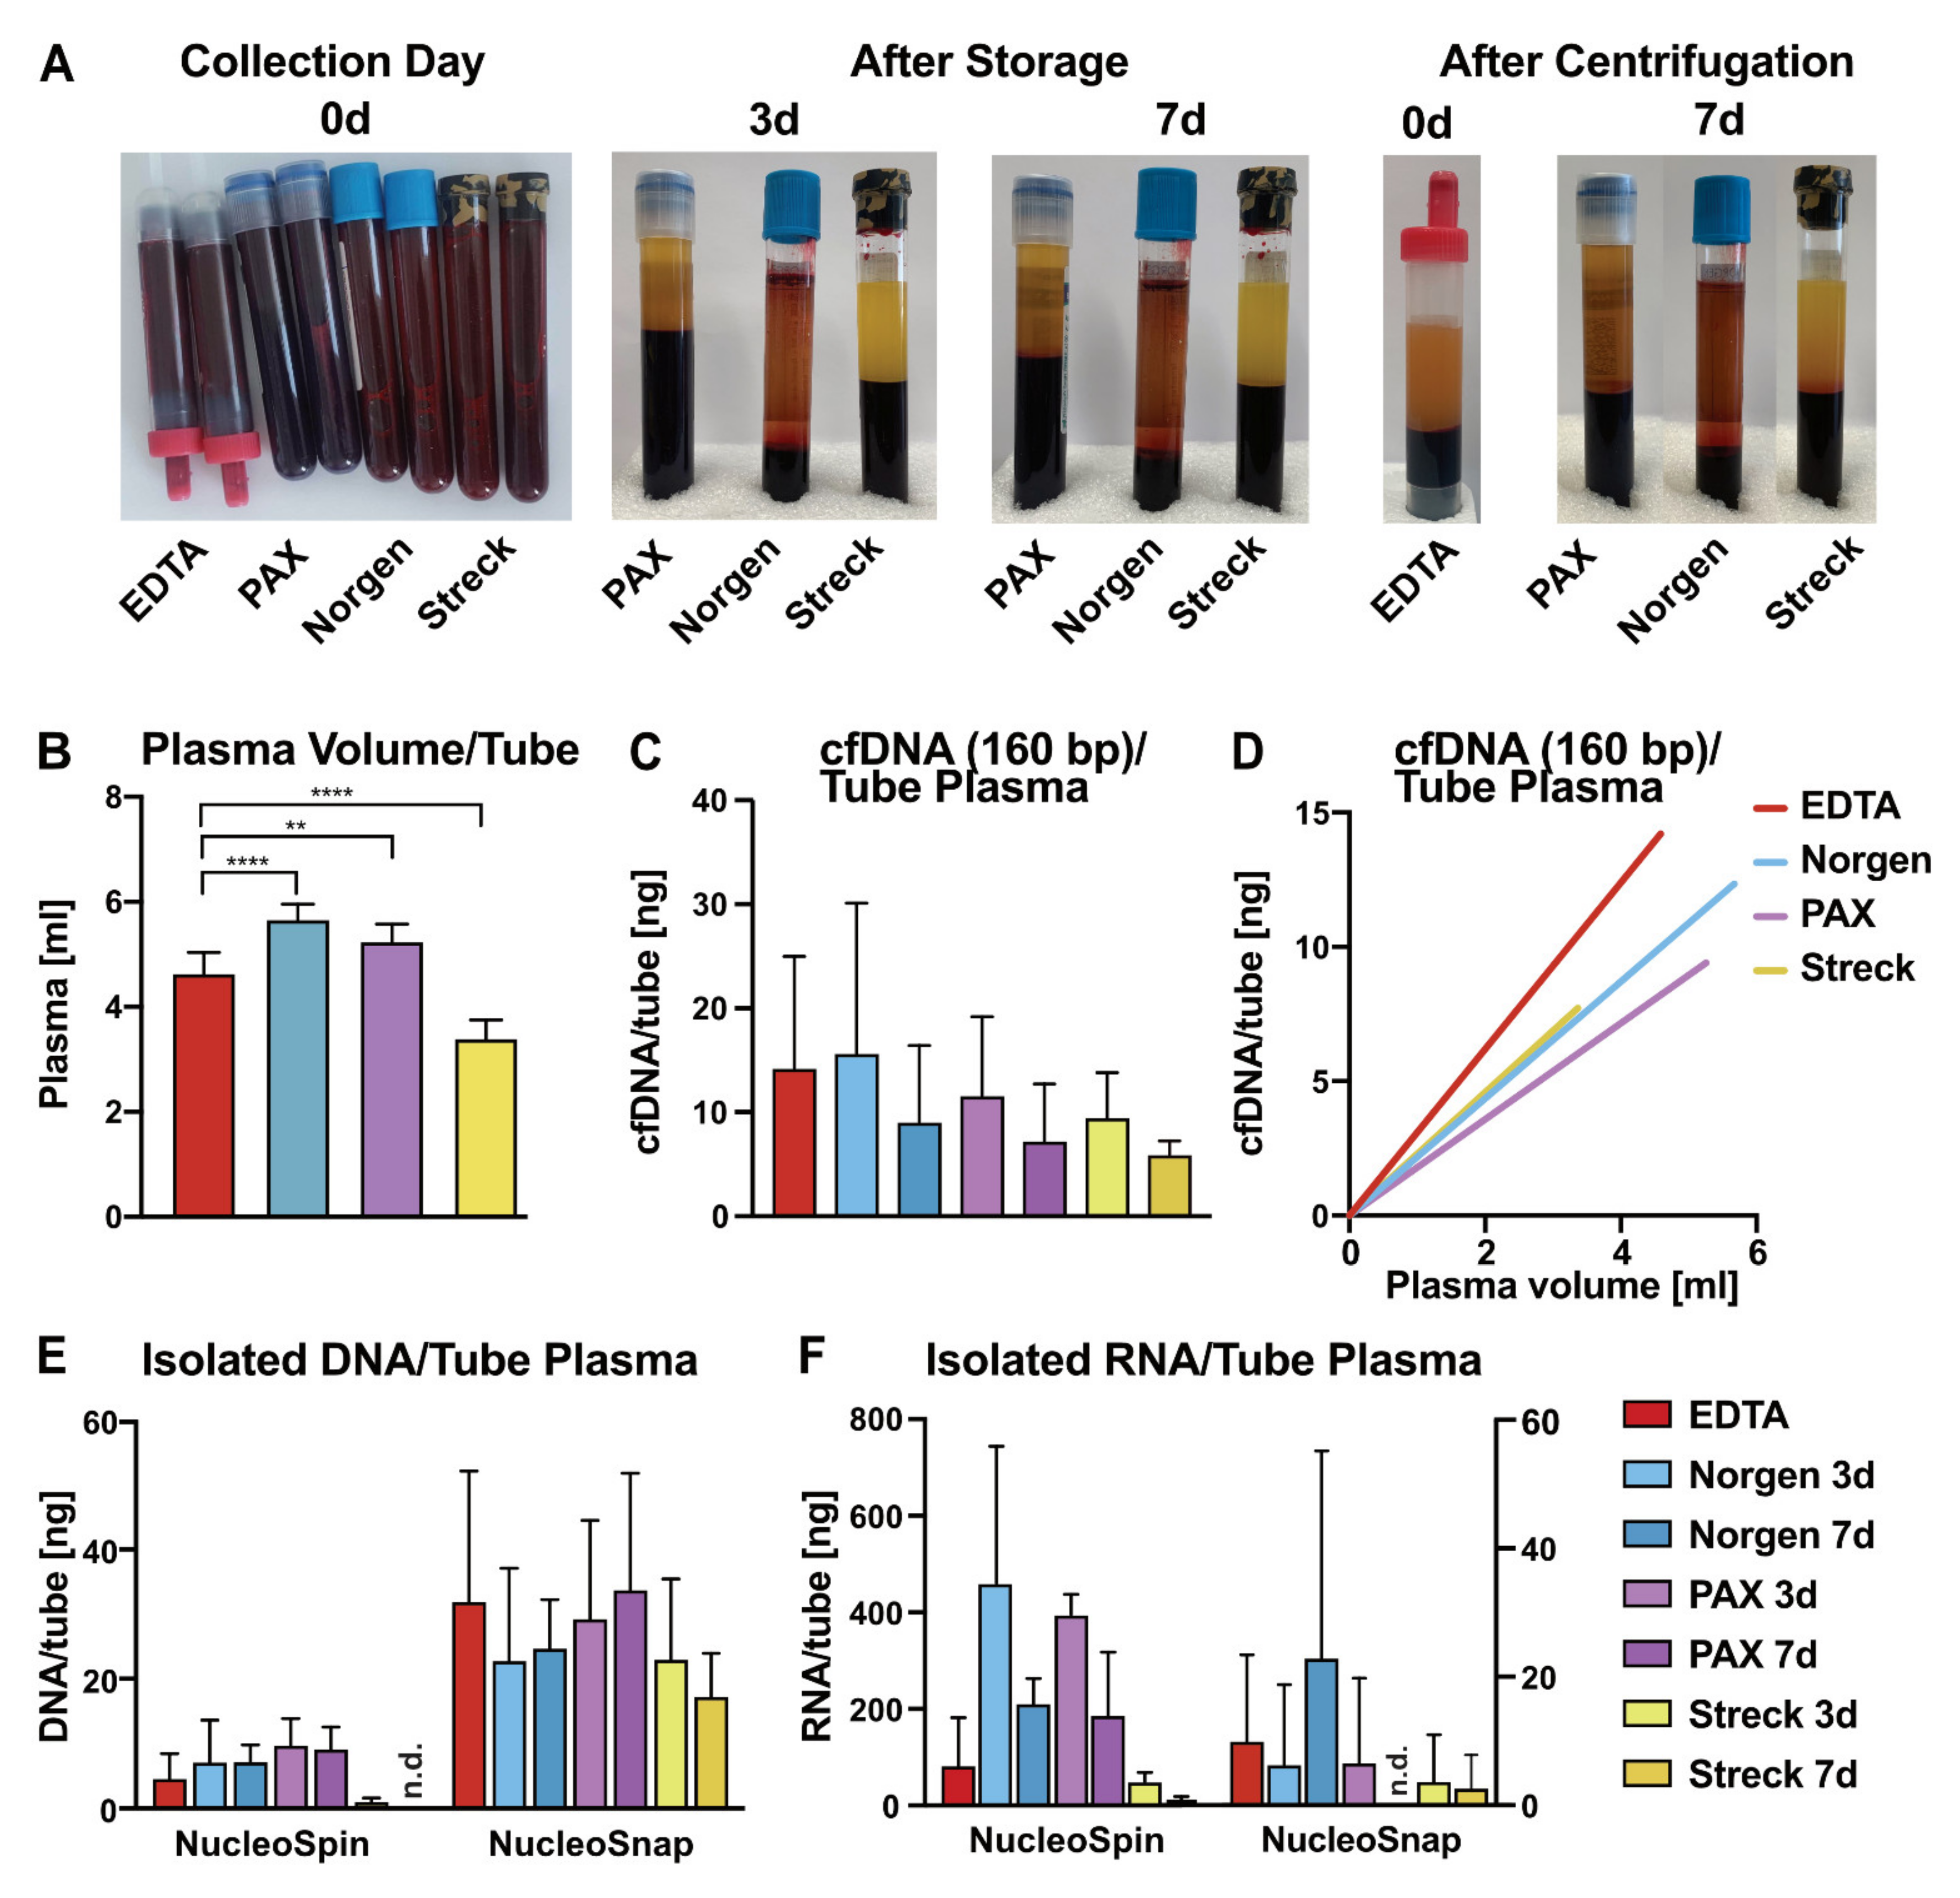
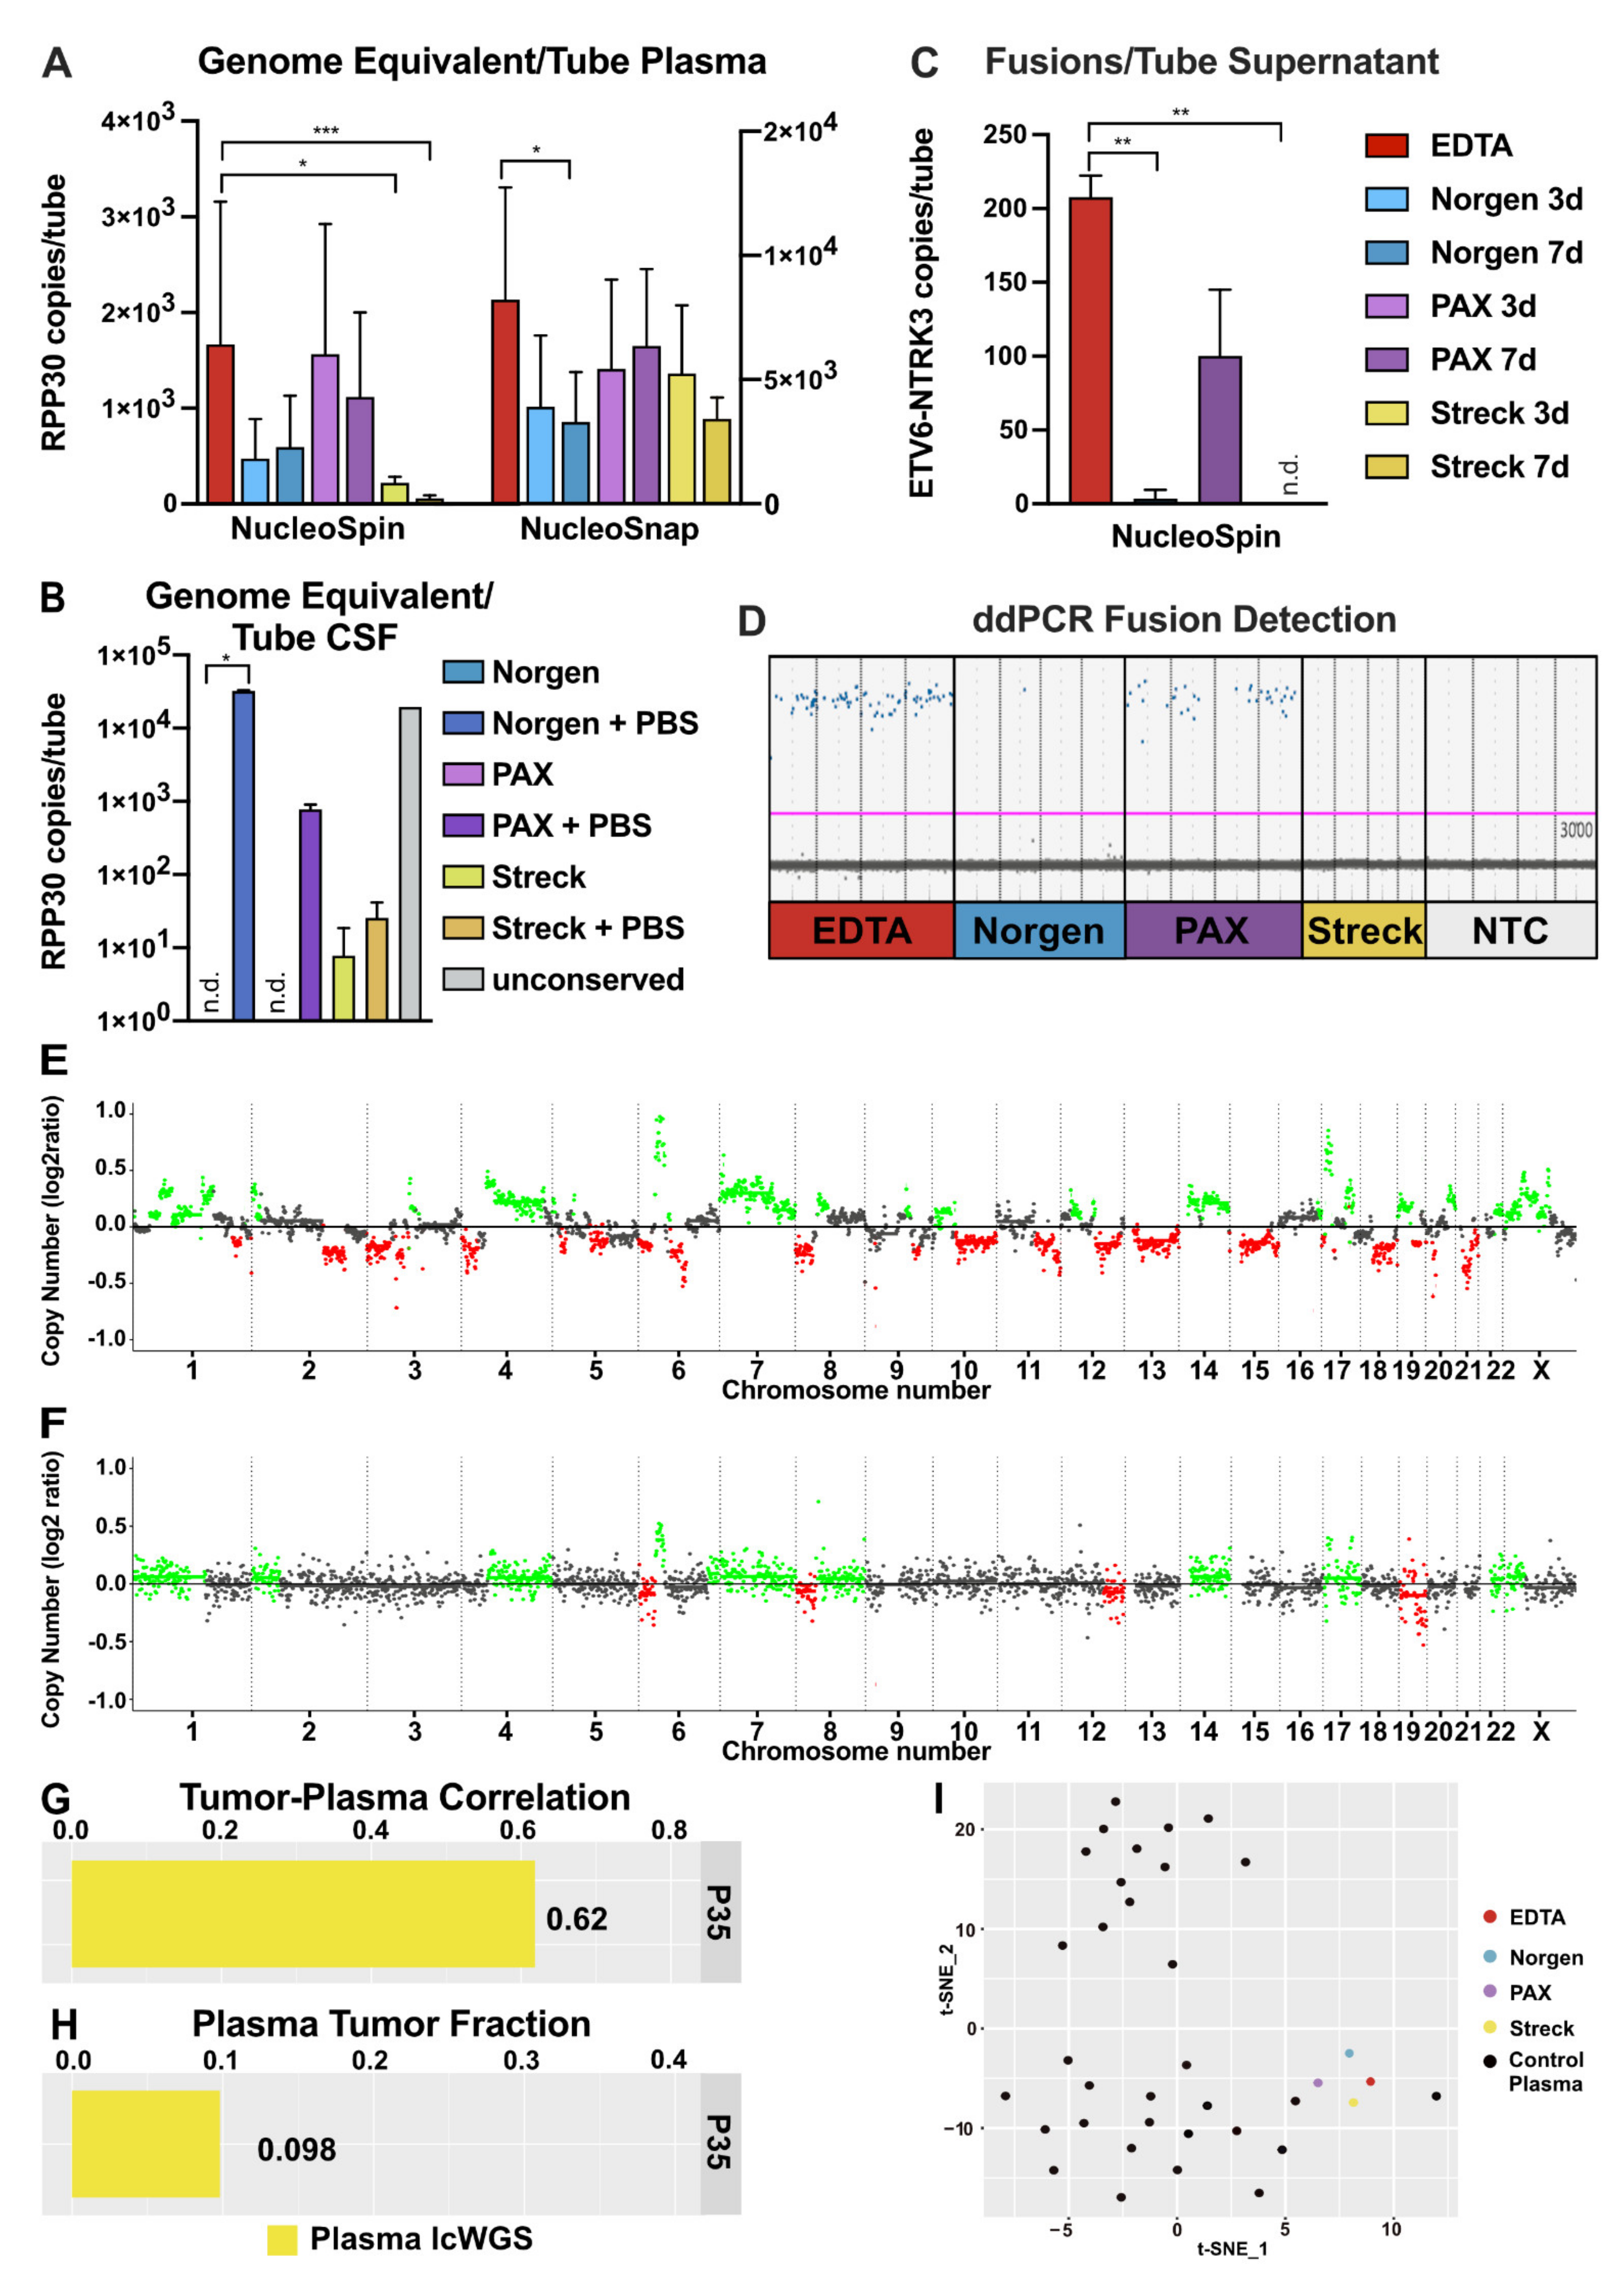
2.1. Impact of Liquid Biopsy Collection Tubes on Plasma cfDNA Yield and Purity
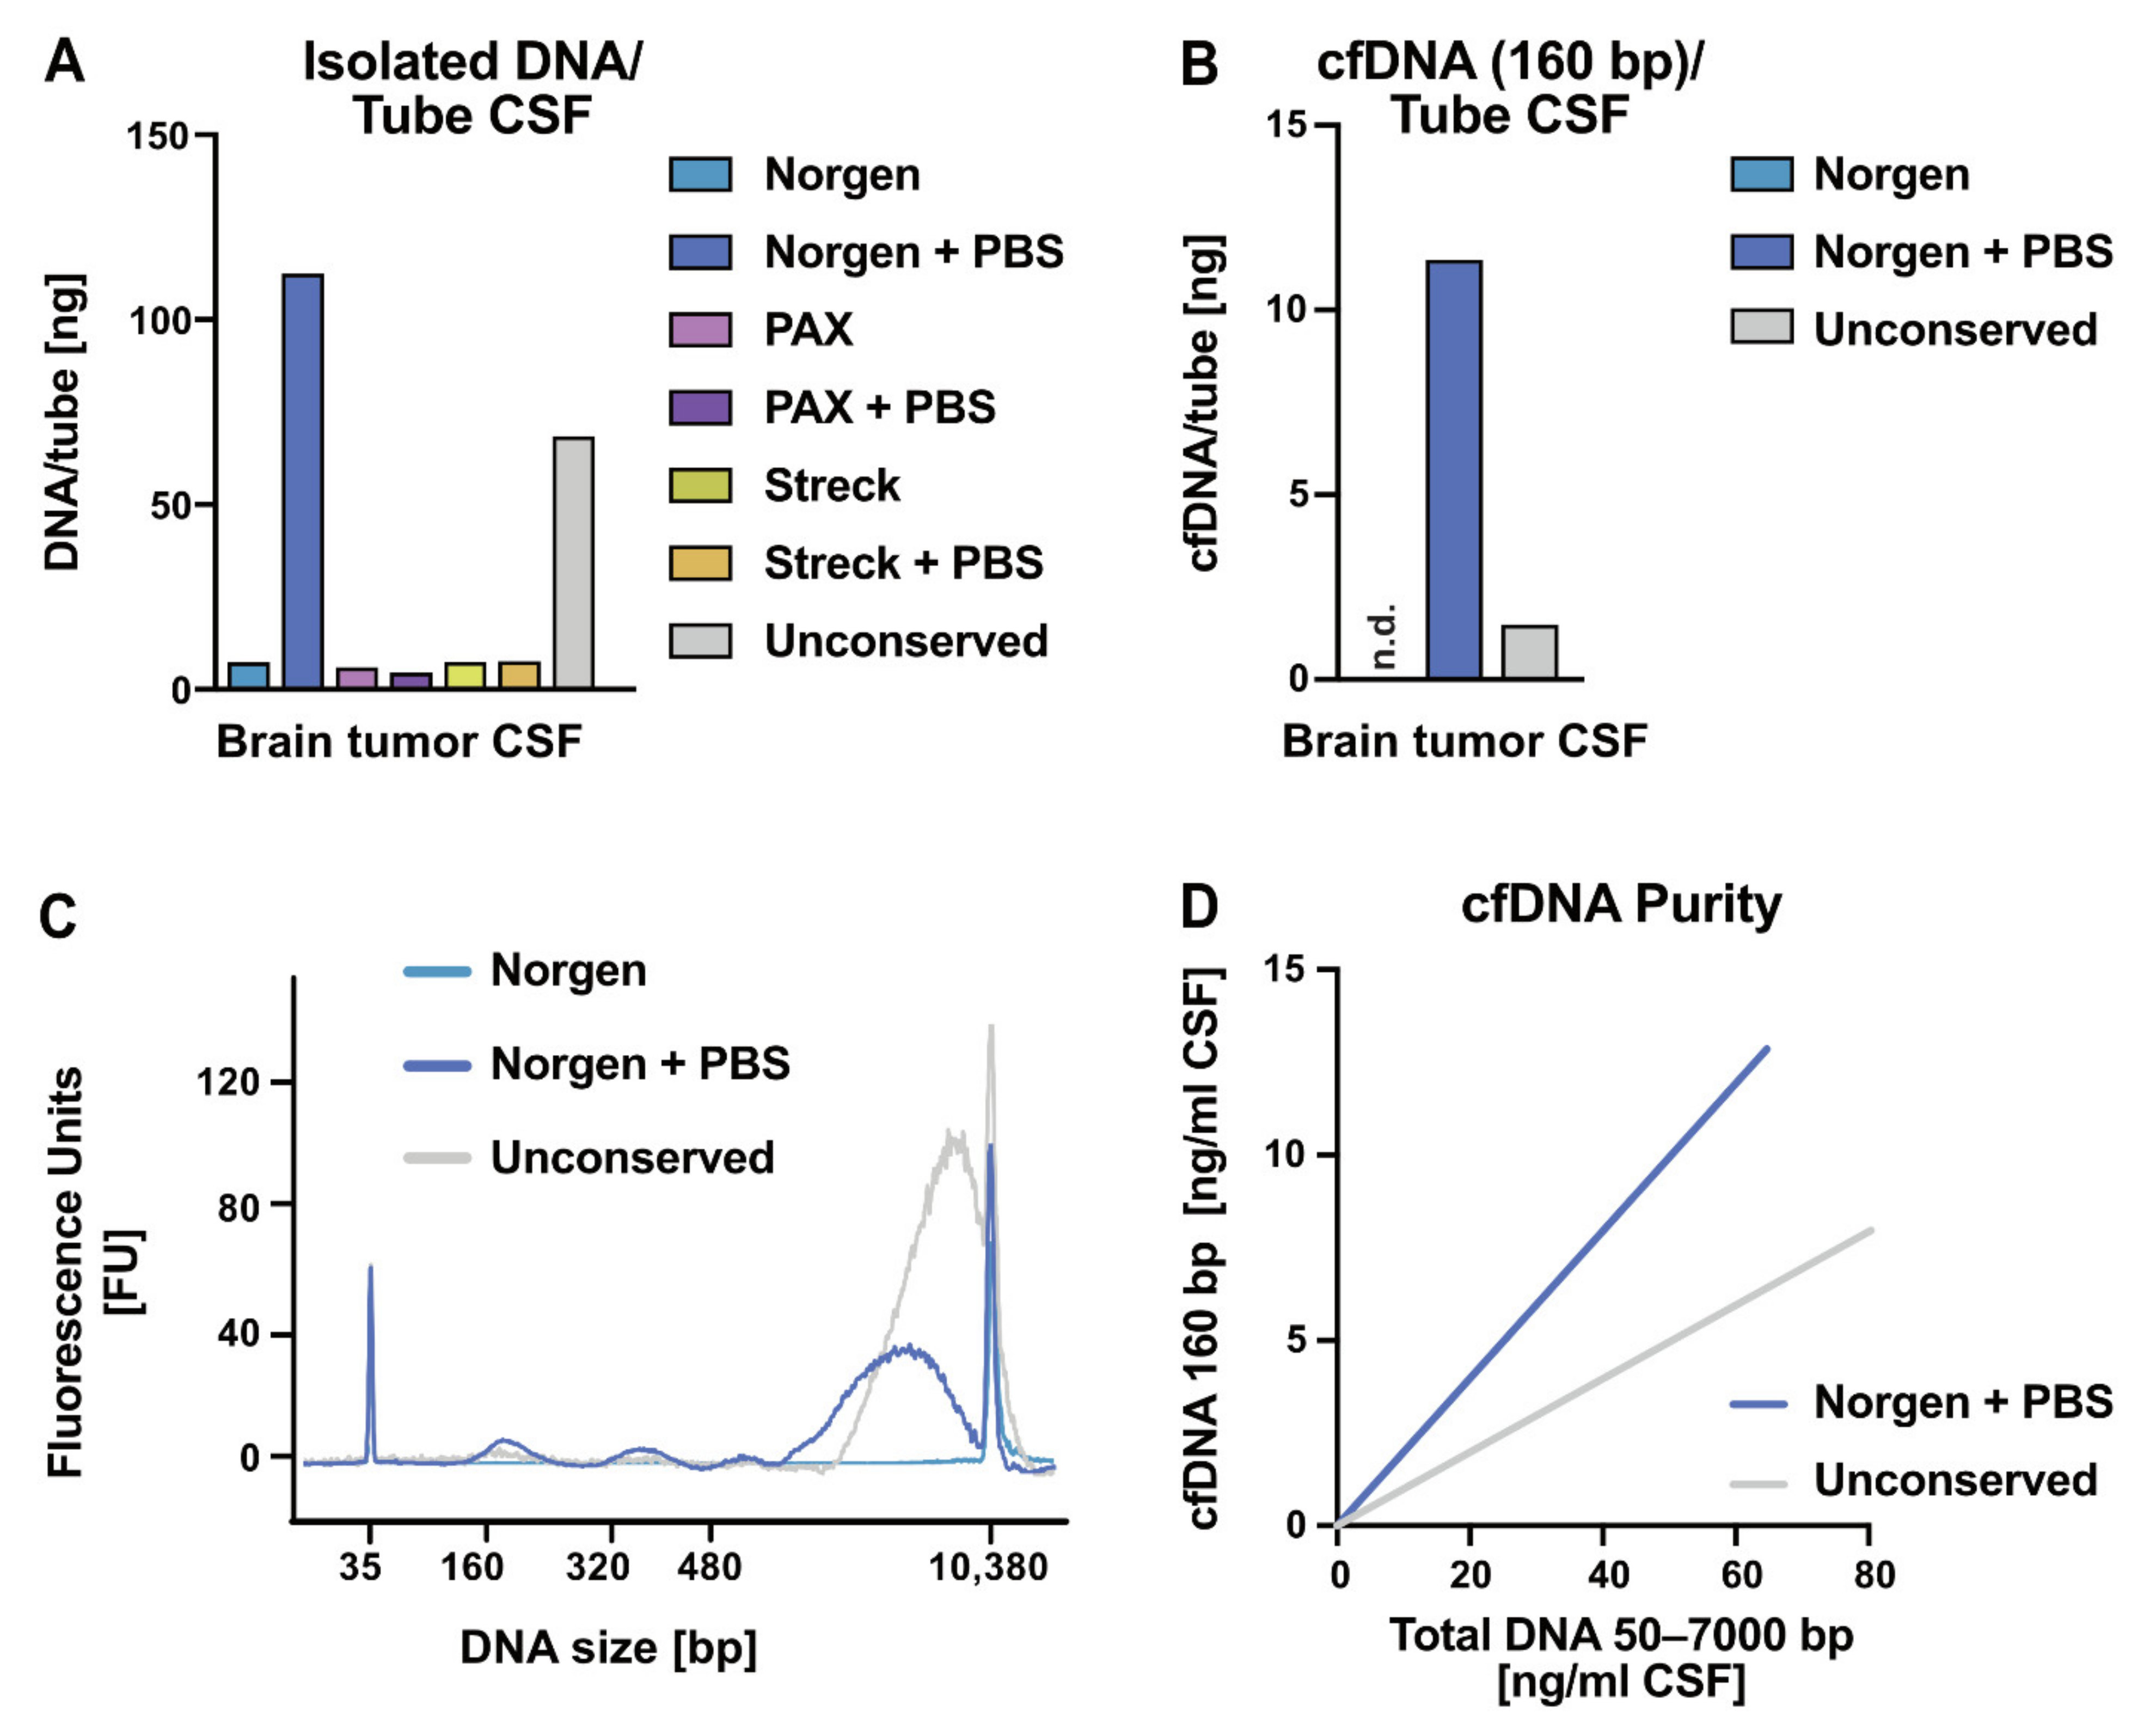
2.2. Impact of Liquid Biopsy Collection Tubes on Cerebrospinal Fluid cfDNA Yield and Purity
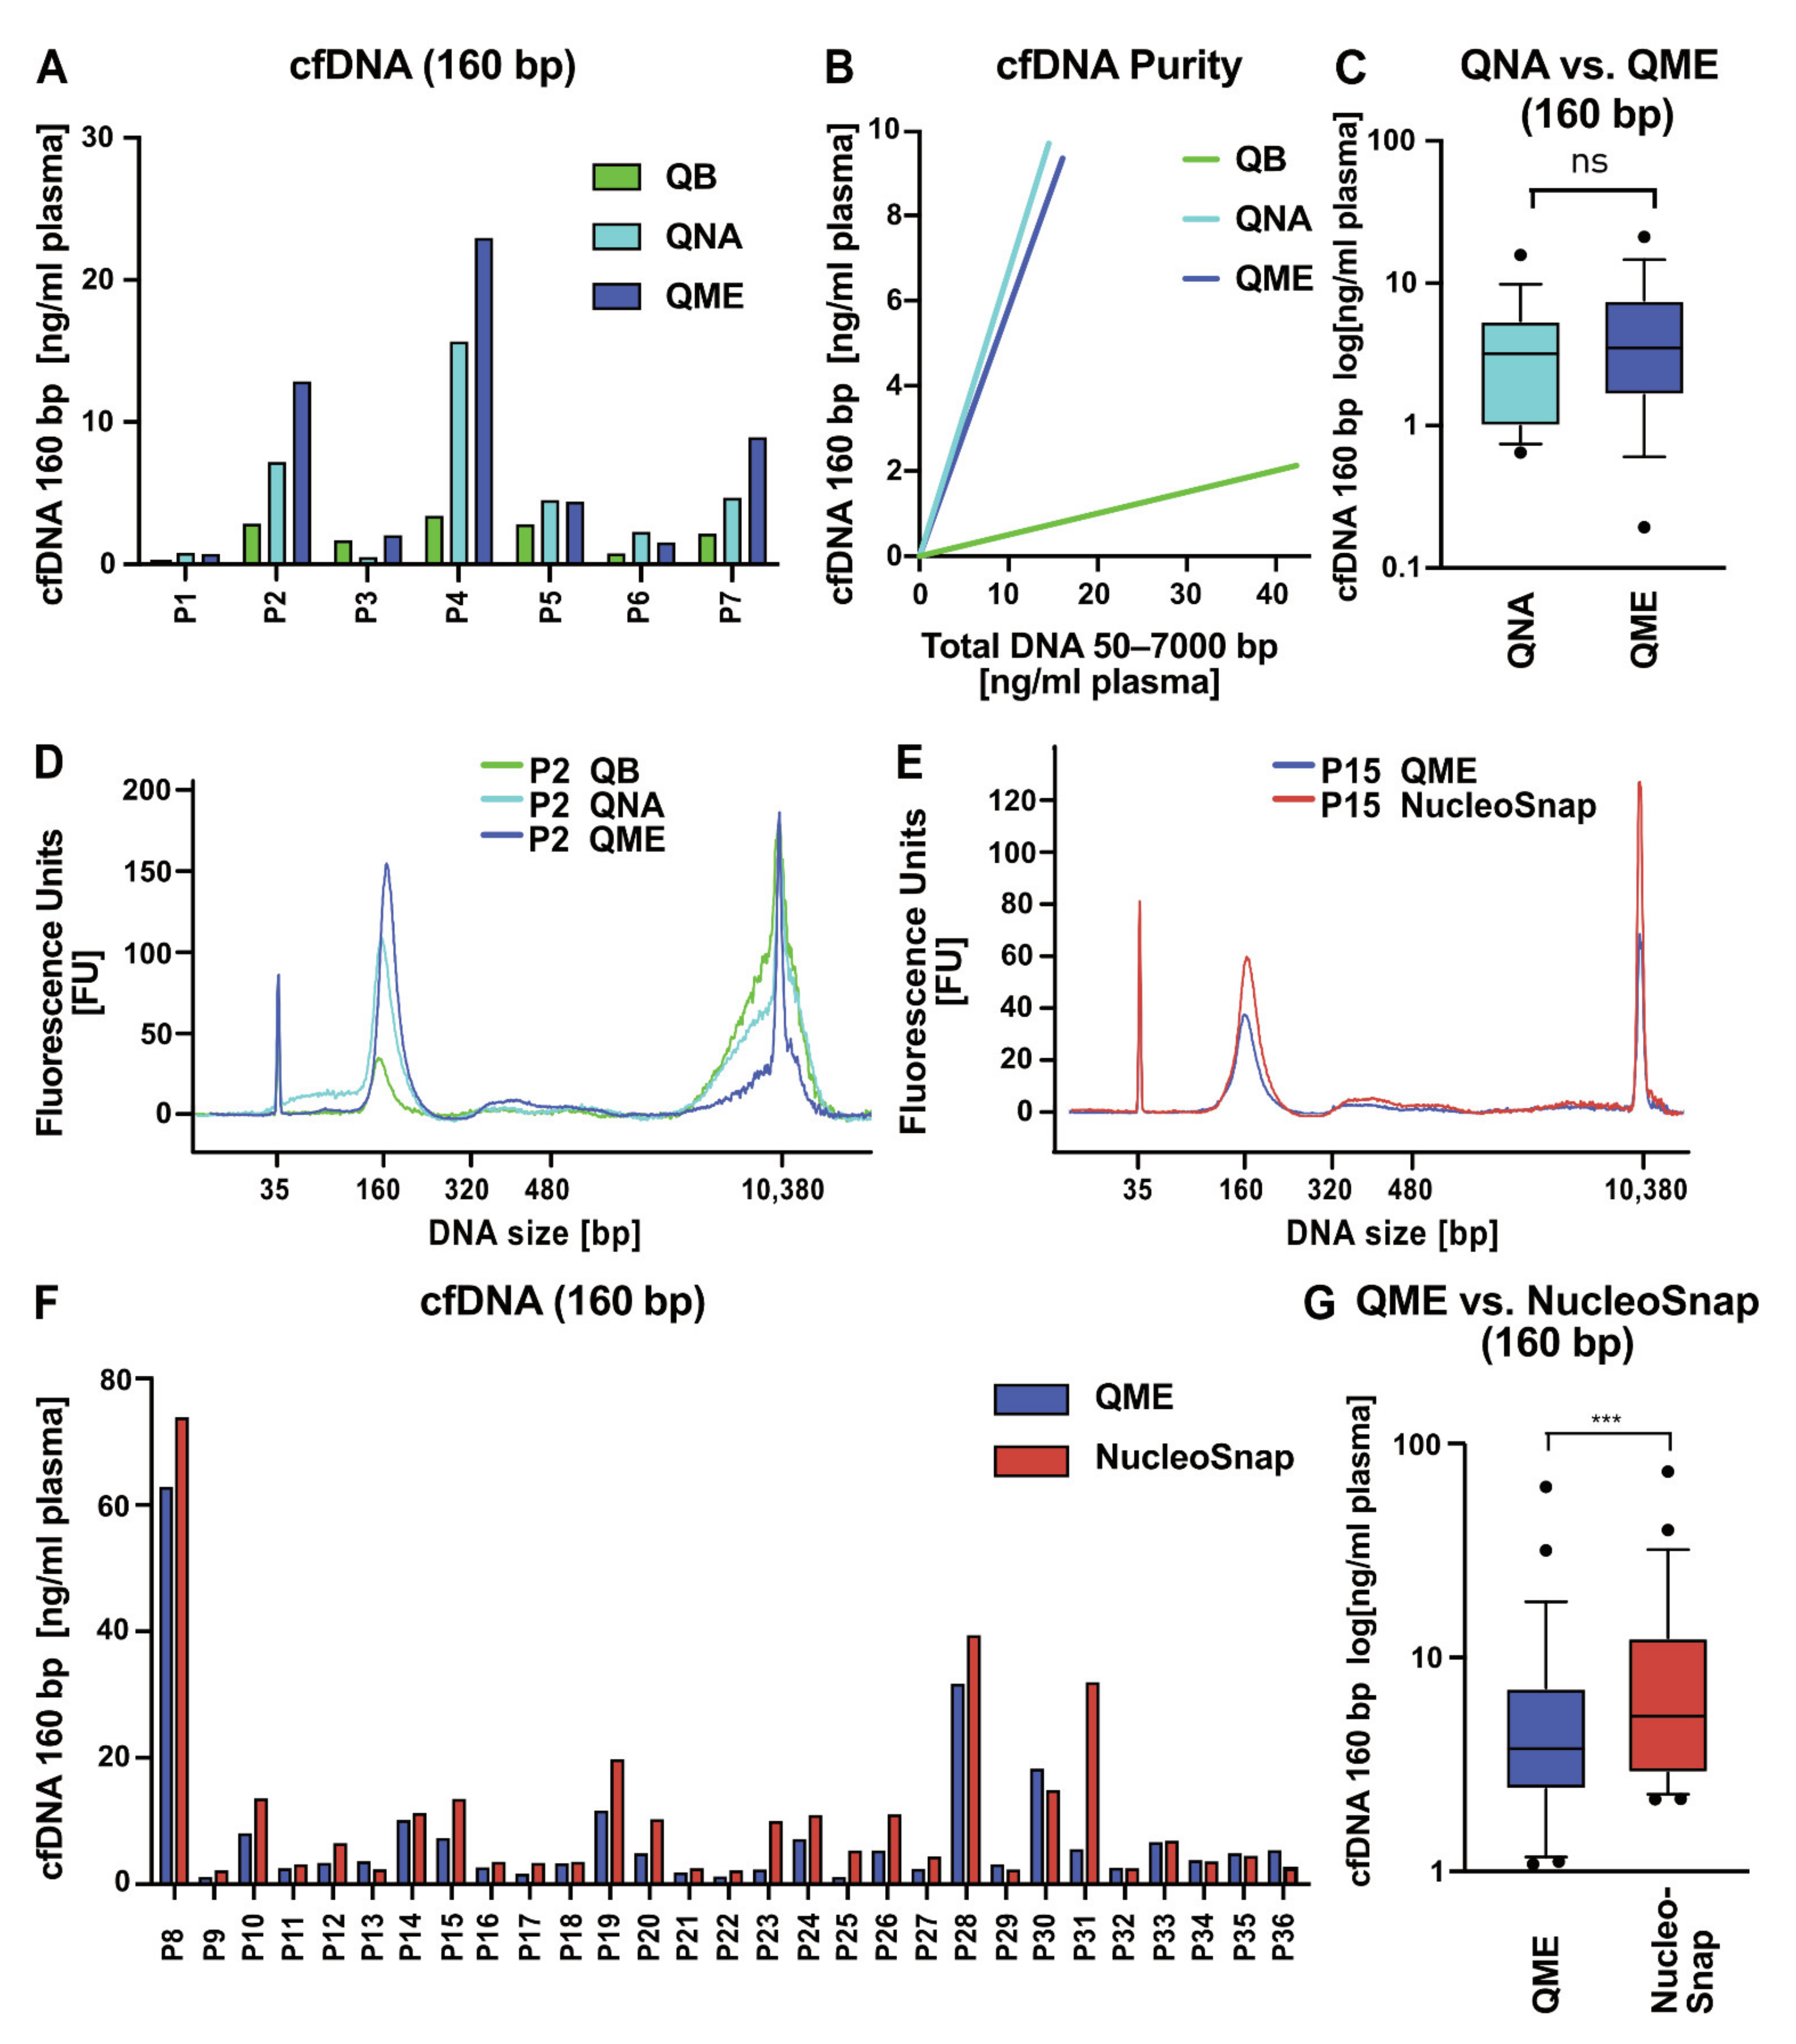
2.3. Comparative Analysis of Different cfNA Isolation Kits
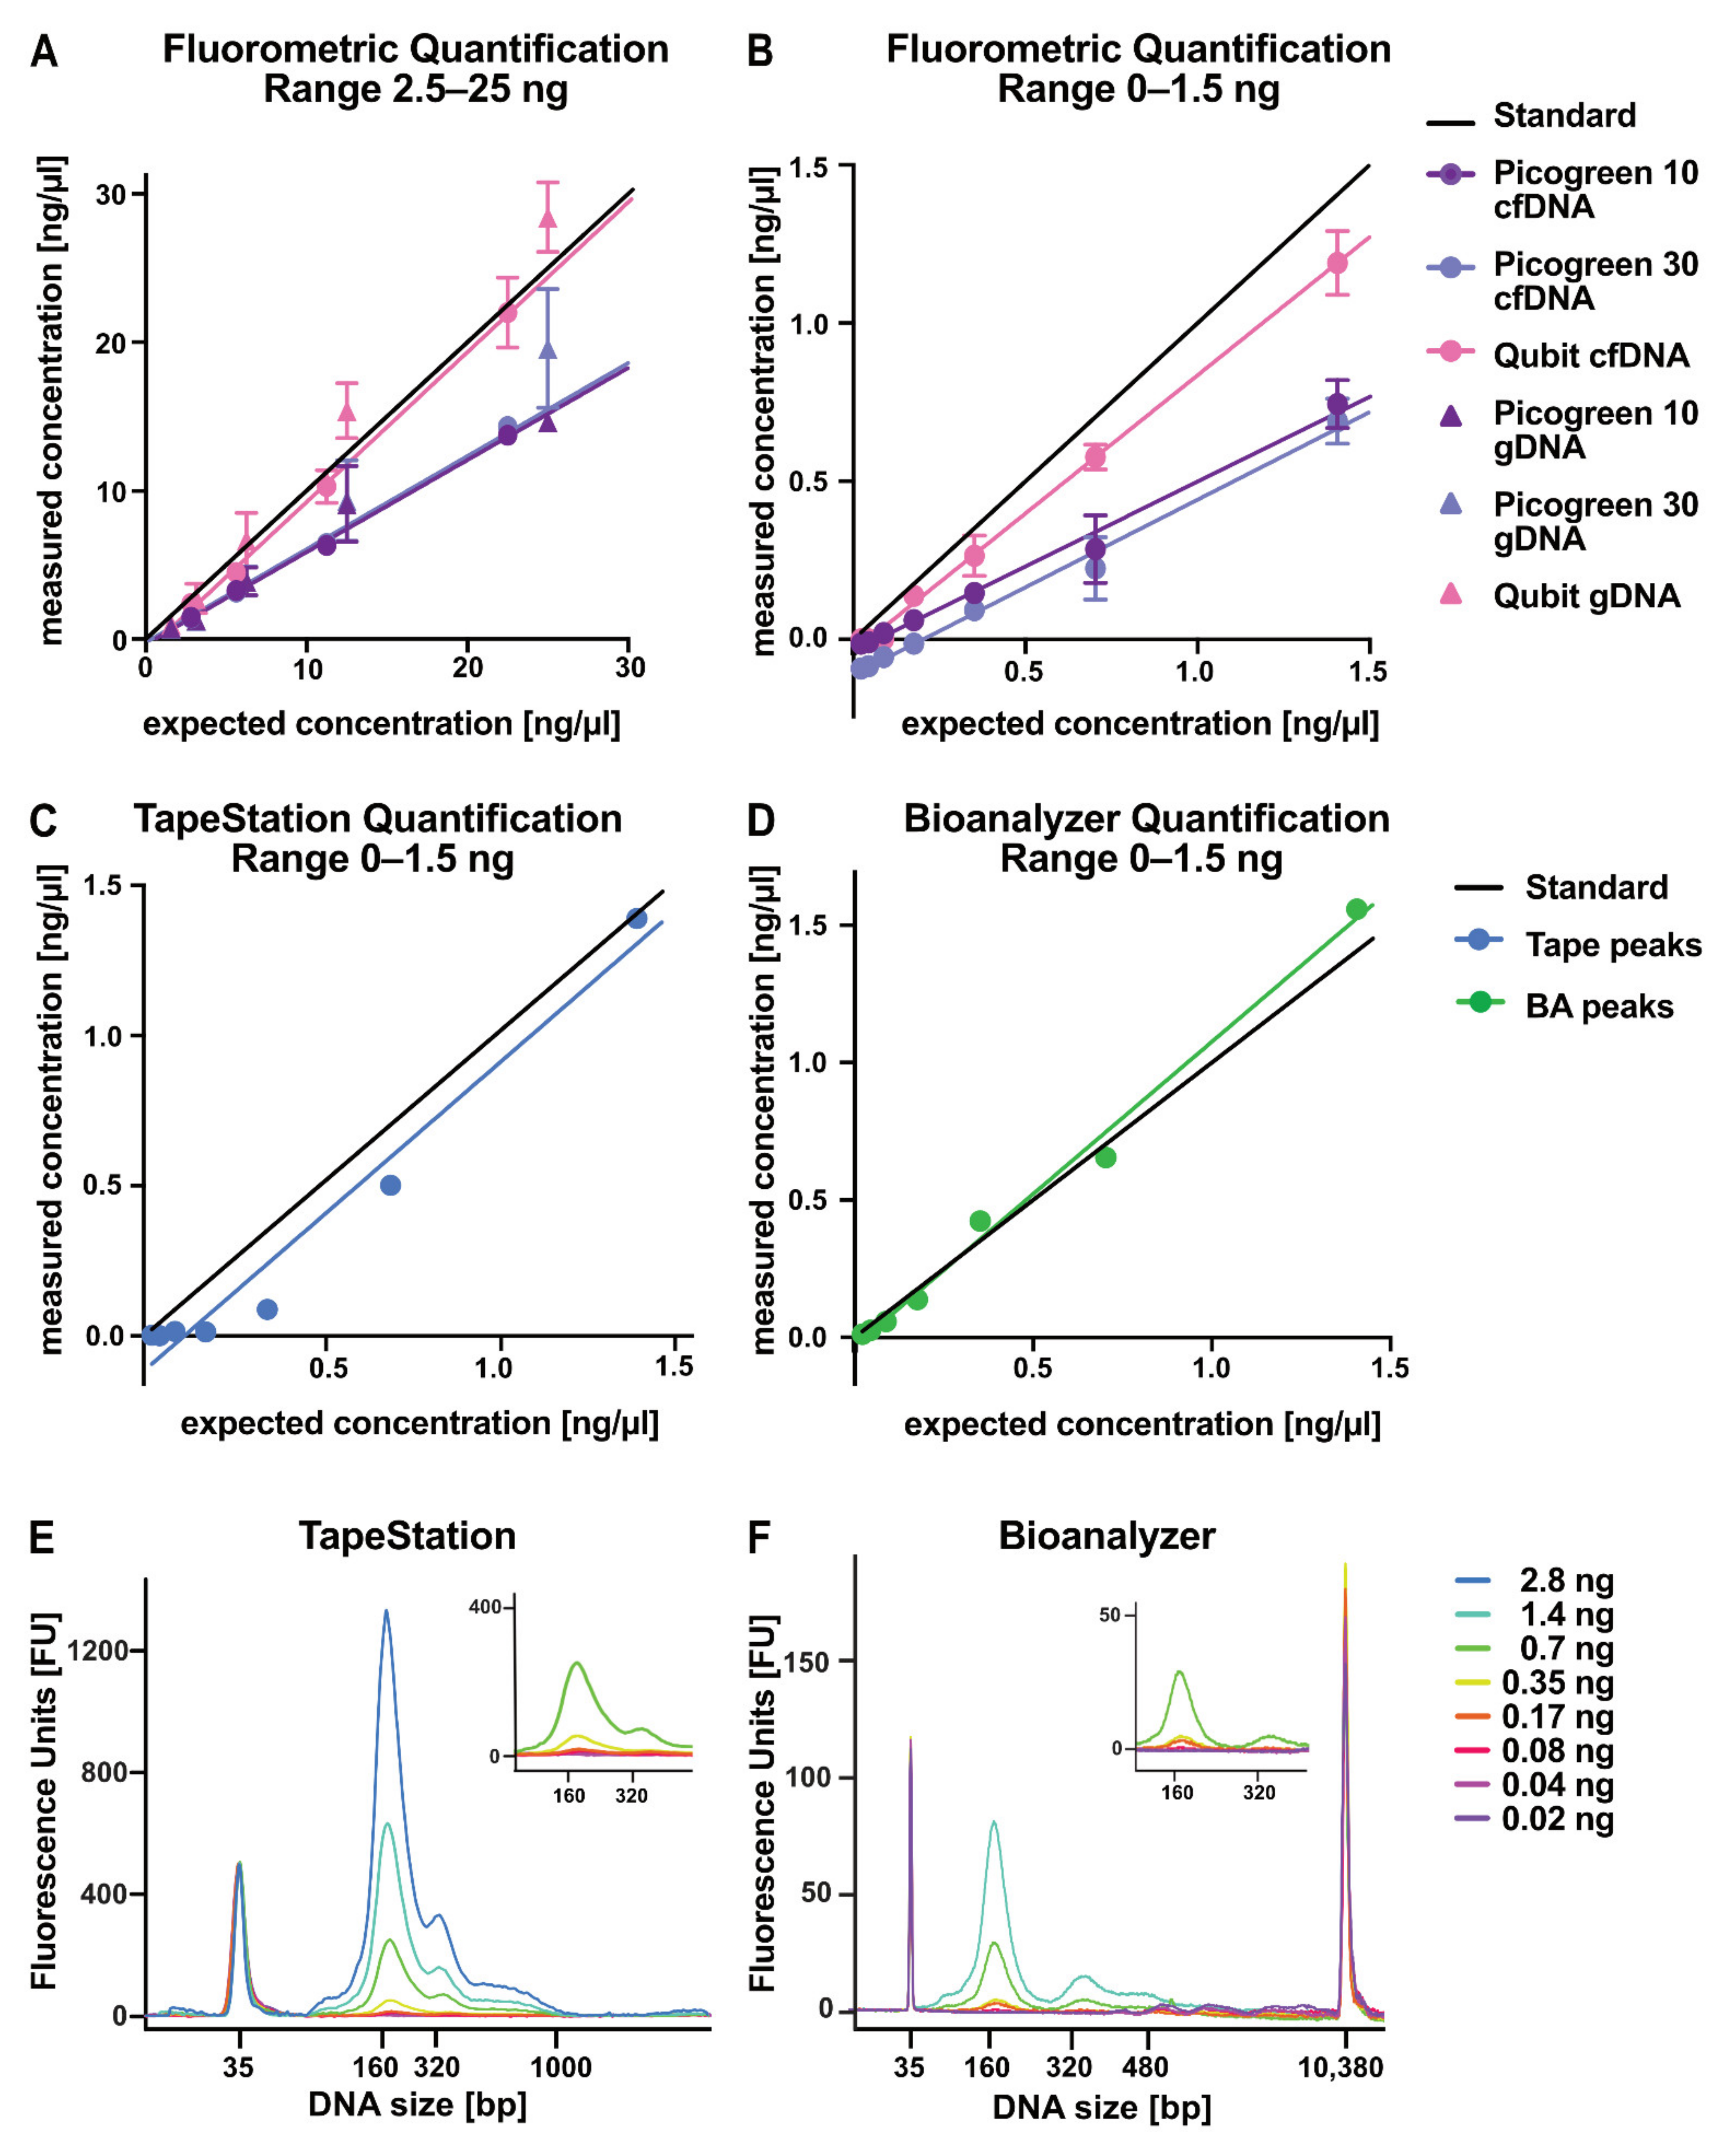
2.4. Evaluation of DNA Quantification Methods for Low-Concentration Samples
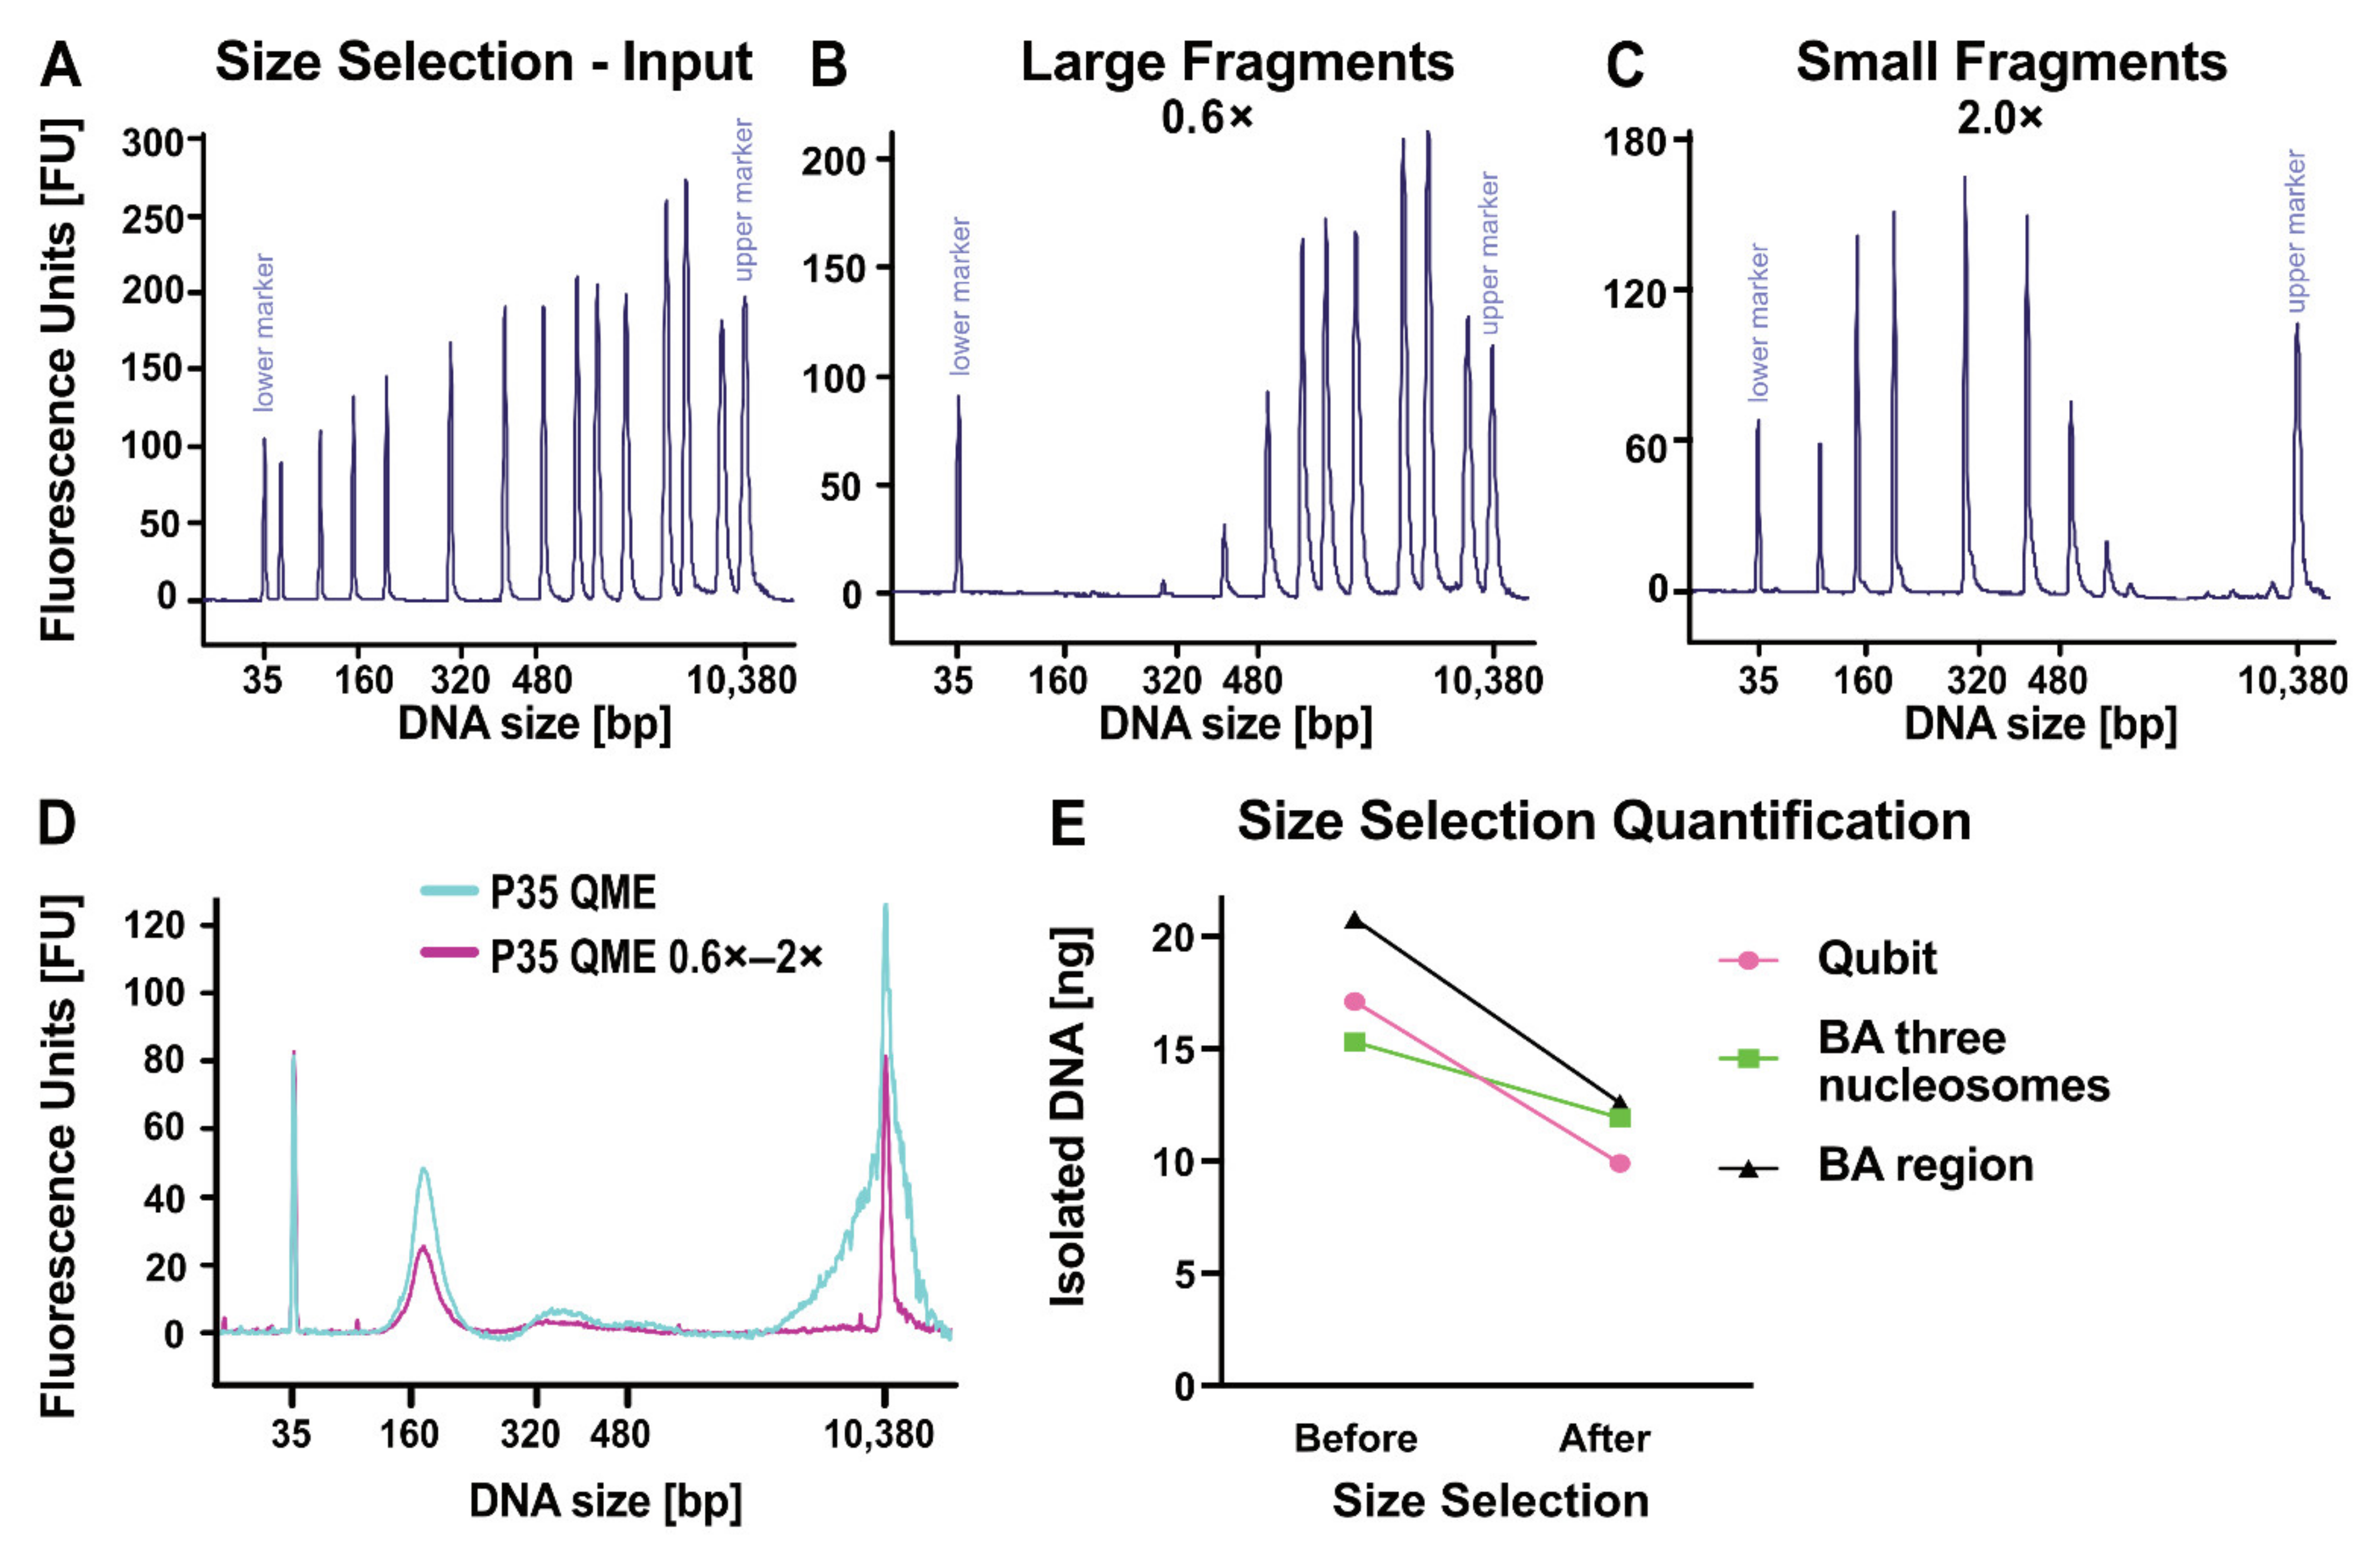
2.5. Enrichment of cfDNA by Size Selection
2.6. Performance of cfNA in Downstream Analyses
3. Discussion
3.1. Liquid Biopsy Preservation Tubes
3.2. cfNA Isolation Kits
3.3. Quality Control for cfNA Analyses
3.4. cfDNA Size Selection
3.5. Functional Readout
3.6. Limitations of the Study
4. Material and Methods
4.1. Blood Preservation Tubes
4.1.1. Plasma Isolation
4.1.2. Cerebrospinal Fluid (CSF)
4.1.3. Cell Culture Supernatant
4.2. Isolation Kits
4.2.1. cfDNA Isolation Kits
4.2.2. Combined cfNA Isolation Kits
4.3. Quantification
4.4. Size Selection
4.5. ddPCR
4.6. Methylation Analysis by EPIC-Array
4.7. lcWGS
4.8. Copy-Number Profiling
4.9. Statistical Analysis
5. Conclusions
Supplementary Materials
Author Contributions
Funding
Institutional Review Board Statement
Informed Consent Statement
Acknowledgments
Conflicts of Interest
Abbreviations
| BA | Bioanalyzer |
| bp | Base pairs |
| cfDNA | Cell-free DNA |
| cfNA | Cell-free nucleic acids |
| cfRNA | Cell-free RNA |
| CSF | Cerebrospinal fluid |
| CNV | Copy number variation |
| ctDNA | Circulating tumor DNA |
| ctRNA | Circulating tumor RNA |
| ddPCR | Droplet digital PCR |
| EDTA | K3EDTA S-monovettes |
| gDNA | Genomic DNA |
| lcWGS | Low-coverage whole-genome sequencing |
| Norgen | cf-DNA/cf-RNA Preservative Tubes Norgen |
| NucleoSnap | NucleoSnap cfDNA kit |
| NucleoSpin | NucleoSpin miRNA Plasma kit |
| PAX | PAXgene Blood ccfDNA Tube IVD |
| PBS | Phosphate-buffered saline |
| QB | QIAamp DNA Blood Mini Kit |
| QME | QIAamp MinElute ccfDNA Mini Kit |
| QNA | QIAamp Circulating Nucleic Acid Kit |
| RT | Room temperature |
| SOP | Standard operating procedure |
| Streck | Cell-Free DNA BCT Streck |
| tSNE | T-distributed stochastic neighbor embedding |
References
- Heitzer, E.; Haque, I.S.; Roberts, C.E.S.; Speicher, M.R. Current and future perspectives of liquid biopsies in genomics-driven oncology. Nat. Rev. Genet. 2019, 20, 71–88. [Google Scholar] [CrossRef]
- Kwapisz, D. The first liquid biopsy test approved. Is it a new era of mutation testing for non-small cell lung cancer? Ann. Transl. Med. 2017, 5, 46. [Google Scholar] [CrossRef] [PubMed]
- Sorenson, G.D.; Pribish, D.M.; Valone, F.H.; Memoli, V.A.; Bzik, D.J.; Yao, S.L. Soluble normal and mutated DNA sequences from single-copy genes in human blood. Cancer Epidemiol. Biomark. Prev. 1994, 3, 67–71. [Google Scholar]
- Olsson, E.; Winter, C.; George, A.; Chen, Y.; Howlin, J.; Tang, M.H.; Dahlgren, M.; Schulz, R.; Grabau, D.; van Westen, D.; et al. Serial monitoring of circulating tumor DNA in patients with primary breast cancer for detection of occult metastatic disease. EMBO Mol. Med. 2015, 7, 1034–1047. [Google Scholar] [CrossRef]
- Parkinson, C.A.; Gale, D.; Piskorz, A.M.; Biggs, H.; Hodgkin, C.; Addley, H.; Freeman, S.; Moyle, P.; Sala, E.; Sayal, K.; et al. Exploratory analysis of tp53 mutations in circulating tumour DNA as biomarkers of treatment response for patients with relapsed high-grade serous ovarian carcinoma: A retrospective study. PLoS Med. 2016, 13, e1002198. [Google Scholar] [CrossRef]
- Tie, J.; Wang, Y.; Tomasetti, C.; Li, L.; Springer, S.; Kinde, I.; Silliman, N.; Tacey, M.; Wong, H.L.; Christie, M.; et al. Circulating tumor DNA analysis detects minimal residual disease and predicts recurrence in patients with stage ii colon cancer. Sci. Transl. Med. 2016, 8, 346ra392. [Google Scholar] [CrossRef]
- Allott, E.H.; Geradts, J.; Sun, X.; Cohen, S.M.; Zirpoli, G.R.; Khoury, T.; Bshara, W.; Chen, M.; Sherman, M.E.; Palmer, J.R.; et al. Intratumoral heterogeneity as a source of discordance in breast cancer biomarker classification. Breast Cancer Res. BCR 2016, 18, 68. [Google Scholar] [CrossRef]
- Barranha, R.; Costa, J.L.; Carneiro, F.; Machado, J.C. Genetic heterogeneity in colorectal cancer and its clinical implications. Acta Med. Port. 2015, 28, 370–375. [Google Scholar] [CrossRef] [PubMed]
- Babayan, A.; Pantel, K. Advances in liquid biopsy approaches for early detection and monitoring of cancer. Genome Med. 2018, 10, 21. [Google Scholar] [CrossRef]
- Cohen, J.D.; Javed, A.A.; Thoburn, C.; Wong, F.; Tie, J.; Gibbs, P.; Schmidt, C.M.; Yip-Schneider, M.T.; Allen, P.J.; Schattner, M.; et al. Combined circulating tumor DNA and protein biomarker-based liquid biopsy for the earlier detection of pancreatic cancers. Proc. Natl. Acad. Sci. USA 2017, 114, 10202–10207. [Google Scholar] [CrossRef]
- Cohen, J.D.; Li, L.; Wang, Y.; Thoburn, C.; Afsari, B.; Danilova, L.; Douville, C.; Javed, A.A.; Wong, F.; Mattox, A.; et al. Detection and localization of surgically resectable cancers with a multi-analyte blood test. Science 2018, 359, 926–930. [Google Scholar] [CrossRef]
- Abbosh, C.; Birkbak, N.J.; Wilson, G.A.; Jamal-Hanjani, M.; Constantin, T.; Salari, R.; Le Quesne, J.; Moore, D.A.; Veeriah, S.; Rosenthal, R.; et al. Phylogenetic ctdna analysis depicts early-stage lung cancer evolution. Nature 2017, 545, 446–451. [Google Scholar] [CrossRef] [PubMed]
- Pantel, K.; Alix-Panabières, C. Liquid biopsy and minimal residual disease—Latest advances and implications for cure. Nat. Rev. Clin. Oncol. 2019, 16, 409–424. [Google Scholar] [CrossRef]
- Dawson, S.J.; Tsui, D.W.; Murtaza, M.; Biggs, H.; Rueda, O.M.; Chin, S.F.; Dunning, M.J.; Gale, D.; Forshew, T.; Mahler-Araujo, B.; et al. Analysis of circulating tumor DNA to monitor metastatic breast cancer. N. Engl. J. Med. 2013, 368, 1199–1209. [Google Scholar] [CrossRef] [PubMed]
- Schiavon, G.; Hrebien, S.; Garcia-Murillas, I.; Cutts, R.J.; Pearson, A.; Tarazona, N.; Fenwick, K.; Kozarewa, I.; Lopez-Knowles, E.; Ribas, R.; et al. Analysis of esr1 mutation in circulating tumor DNA demonstrates evolution during therapy for metastatic breast cancer. Sci. Transl. Med. 2015, 7, 313ra182. [Google Scholar] [CrossRef]
- Goyal, L.; Saha, S.K.; Liu, L.Y.; Siravegna, G.; Leshchiner, I.; Ahronian, L.G.; Lennerz, J.K.; Vu, P.; Deshpande, V.; Kambadakone, A.; et al. Polyclonal secondary fgfr2 mutations drive acquired resistance to fgfr inhibition in patients with fgfr2 fusion-positive cholangiocarcinoma. Cancer Discov. 2017, 7, 252–263. [Google Scholar] [CrossRef] [PubMed]
- Chin, R.I.; Chen, K.; Usmani, A.; Chua, C.; Harris, P.K.; Binkley, M.S.; Azad, T.D.; Dudley, J.C.; Chaudhuri, A.A. Detection of solid tumor molecular residual disease (mrd) using circulating tumor DNA (ctdna). Mol. Diagn. Ther. 2019, 23, 311–331. [Google Scholar] [CrossRef] [PubMed]
- Petit, J.; Carroll, G.; Gould, T.; Pockney, P.; Dun, M.; Scott, R.J. Cell-free DNA as a diagnostic blood-based biomarker for colorectal cancer: A systematic review. J. Surg. Res. 2019, 236, 184–197. [Google Scholar] [CrossRef]
- Jahr, S.; Hentze, H.; Englisch, S.; Hardt, D.; Fackelmayer, F.O.; Hesch, R.D.; Knippers, R. DNA fragments in the blood plasma of cancer patients: Quantitations and evidence for their origin from apoptotic and necrotic cells. Cancer Res. 2001, 61, 1659–1665. [Google Scholar] [PubMed]
- Heitzer, E.; Ulz, P.; Geigl, J.B. Circulating tumor DNA as a liquid biopsy for cancer. Clin. Chem. 2015, 61, 112–123. [Google Scholar] [CrossRef] [PubMed]
- Zhao, Y.; Li, Y.; Chen, P.; Li, S.; Luo, J.; Xia, H. Performance comparison of blood collection tubes as liquid biopsy storage system for minimizing cfdna contamination from genomic DNA. J. Clin. Lab. Anal. 2019, 33, e22670. [Google Scholar] [CrossRef]
- Nikolaev, S.; Lemmens, L.; Koessler, T.; Blouin, J.L.; Nouspikel, T. Circulating tumoral DNA: Preanalytical validation and quality control in a diagnostic laboratory. Anal. Biochem. 2018, 542, 34–39. [Google Scholar] [CrossRef]
- Sun, K.; Jiang, P.; Cheng, S.H.; Cheng, T.H.T.; Wong, J.; Wong, V.W.S.; Ng, S.S.M.; Ma, B.B.Y.; Leung, T.Y.; Chan, S.L.; et al. Orientation-aware plasma cell-free DNA fragmentation analysis in open chromatin regions informs tissue of origin. Genome Res. 2019, 29, 418–427. [Google Scholar] [CrossRef]
- Samejima, K.; Earnshaw, W.C. Trashing the genome: The role of nucleases during apoptosis. Nat. Rev. Mol. Cell Biol. 2005, 6, 677–688. [Google Scholar] [CrossRef] [PubMed]
- Snyder, M.W.; Kircher, M.; Hill, A.J.; Daza, R.M.; Shendure, J. Cell-free DNA comprises an in vivo nucleosome footprint that informs its tissues-of-origin. Cell 2016, 164, 57–68. [Google Scholar] [CrossRef]
- Jiang, P.; Chan, C.W.M.; Chan, K.C.A.; Cheng, S.H.; Wong, J.; Wong, V.W.-S.; Wong, G.L.H.; Chan, S.L.; Mok, T.S.K.; Chan, H.L.Y.; et al. Lengthening and shortening of plasma DNA in hepatocellular carcinoma patients. Proc. Natl. Acad. Sci. USA 2015, 112, E1317–E1325. [Google Scholar] [CrossRef] [PubMed]
- Grölz, D.; Hauch, S.; Schlumpberger, M.; Guenther, K.; Voss, T.; Sprenger-Haussels, M.; Oelmüller, U. Liquid biopsy preservation solutions for standardized pre-analytical workflows—Venous whole blood and plasma. Curr. Pathobiol. Rep. 2018, 6, 275–286. [Google Scholar] [CrossRef]
- Mouliere, F.; Chandrananda, D.; Piskorz, A.M.; Moore, E.K.; Morris, J.; Ahlborn, L.B.; Mair, R.; Goranova, T.; Marass, F.; Heider, K.; et al. Enhanced detection of circulating tumor DNA by fragment size analysis. Sci. Transl. Med. 2018, 10, eaat4921. [Google Scholar] [CrossRef] [PubMed]
- McEwen, A.E.; Leary, S.E.S.; Lockwood, C.M. Beyond the blood: Csf-derived cfdna for diagnosis and characterization of cns tumors. Front. Cell Dev. Biol. 2020, 8, 45. [Google Scholar] [CrossRef]
- Wang, Y.; Springer, S.; Zhang, M.; McMahon, K.W.; Kinde, I.; Dobbyn, L.; Ptak, J.; Brem, H.; Chaichana, K.; Gallia, G.L.; et al. Detection of tumor-derived DNA in cerebrospinal fluid of patients with primary tumors of the brain and spinal cord. Proc. Natl. Acad. Sci. USA 2015, 112, 9704–9709. [Google Scholar] [CrossRef] [PubMed]
- Bettegowda, C.; Sausen, M.; Leary, R.J.; Kinde, I.; Wang, Y.; Agrawal, N.; Bartlett, B.R.; Wang, H.; Luber, B.; Alani, R.M.; et al. Detection of circulating tumor DNA in early- and late-stage human malignancies. Sci. Transl. Med. 2014, 6, 224ra224. [Google Scholar] [CrossRef] [PubMed]
- Chiu, R.W.; Poon, L.L.; Lau, T.K.; Leung, T.N.; Wong, E.M.; Lo, Y.M. Effects of blood-processing protocols on fetal and total DNA quantification in maternal plasma. Clin. Chem. 2001, 47, 1607–1613. [Google Scholar] [CrossRef] [PubMed]
- Sorber, L.; Zwaenepoel, K.; Jacobs, J.; De Winne, K.; Van Casteren, K.; Augustus, E.; Lardon, F.; Prenen, H.; Peeters, M.; Van Meerbeeck, J.; et al. Specialized blood collection tubes for liquid biopsy: Improving the pre-analytical conditions. Mol. Diagn. Ther. 2020, 24, 113–124. [Google Scholar] [CrossRef]
- Hrebien, S.; O’Leary, B.; Beaney, M.; Schiavon, G.; Fribbens, C.; Bhambra, A.; Johnson, R.; Garcia-Murillas, I.; Turner, N. Reproducibility of digital pcr assays for circulating tumor DNA analysis in advanced breast cancer. PLoS ONE 2016, 11, e0165023. [Google Scholar] [CrossRef] [PubMed]
- Sherwood, J.L.; Corcoran, C.; Brown, H.; Sharpe, A.D.; Musilova, M.; Kohlmann, A. Optimised pre-analytical methods improve kras mutation detection in circulating tumour DNA (ctdna) from patients with non-small cell lung cancer (nsclc). PLoS ONE 2016, 11, e0150197. [Google Scholar] [CrossRef] [PubMed]
- Ward Gahlawat, A.; Lenhardt, J.; Witte, T.; Keitel, D.; Kaufhold, A.; Maass, K.K.; Pajtler, K.W.; Sohn, C.; Schott, S. Evaluation of storage tubes for combined analysis of circulating nucleic acids in liquid biopsies. Int. J. Mol. Sci. 2019, 20, 704. [Google Scholar] [CrossRef]
- Sorber, L.; Zwaenepoel, K.; Jacobs, J.; De Winne, K.; Goethals, S.; Reclusa, P.; Van Casteren, K.; Augustus, E.; Lardon, F.; Roeyen, G.; et al. Circulating cell-free DNA and rna analysis as liquid biopsy: Optimal centrifugation protocol. Cancers 2019, 11, 458. [Google Scholar] [CrossRef]
- Penyige, A.; Marton, E.; Soltesz, B.; Szilagyi-Bonizs, M.; Poka, R.; Lukacs, J.; Szeles, L.; Nagy, B. Circulating mirna profiling in plasma samples of ovarian cancer patients. Int. J. Mol. Sci. 2019, 20, 4533. [Google Scholar] [CrossRef] [PubMed]
- Katakura, S.; Kobayashi, N.; Hashimoto, H.; Kamimaki, C.; Tanaka, K.; Kubo, S.; Nakashima, K.; Teranishi, S.; Manabe, S.; Watanabe, K.; et al. Microrna-200b is a potential biomarker of the expression of pd-l1 in patients with lung cancer. Thorac. Cancer 2020, 11, 2975–2982. [Google Scholar] [CrossRef]
- De Miguel Perez, D.; Rodriguez Martinez, A.; Ortigosa Palomo, A.; Delgado Urena, M.; Garcia Puche, J.L.; Robles Remacho, A.; Exposito Hernandez, J.; Lorente Acosta, J.A.; Ortega Sanchez, F.G.; Serrano, M.J. Extracellular vesicle-mirnas as liquid biopsy biomarkers for disease identification and prognosis in metastatic colorectal cancer patients. Sci. Rep. 2020, 10, 3974. [Google Scholar] [CrossRef] [PubMed]
- Uotani, K.; Fujiwara, T.; Yoshida, A.; Iwata, S.; Morita, T.; Kiyono, M.; Yokoo, S.; Kunisada, T.; Takeda, K.; Hasei, J.; et al. Circulating microrna-92b-3p as a novel biomarker for monitoring of synovial sarcoma. Sci. Rep. 2017, 7, 14634. [Google Scholar] [CrossRef] [PubMed]
- Tsui, N.B.; Ng, E.K.; Lo, Y.M. Stability of endogenous and added rna in blood specimens, serum, and plasma. Clin. Chem. 2002, 48, 1647–1653. [Google Scholar] [CrossRef]
- El-Abd, E.; El-Tahan, R.; Fahmy, L.; Zaki, S.; Faid, W.; Sobhi, A.; Kandil, K.; El-Kwisky, F. Serum metastasin mrna is an important survival predictor in breast cancer. Br. J. Biomed. Sci. 2008, 65, 90–94. [Google Scholar] [CrossRef] [PubMed]
- Patel, K.; Whelan, P.J.; Prescott, S.; Brownhill, S.C.; Johnston, C.F.; Selby, P.J.; Burchill, S.A. The use of real-time reverse transcription-pcr for prostate-specific antigen mrna to discriminate between blood samples from healthy volunteers and from patients with metastatic prostate cancer. Clin. Cancer Res. 2004, 10, 7511–7519. [Google Scholar] [CrossRef][Green Version]
- Nilsson, R.J.; Karachaliou, N.; Berenguer, J.; Gimenez-Capitan, A.; Schellen, P.; Teixido, C.; Tannous, J.; Kuiper, J.L.; Drees, E.; Grabowska, M.; et al. Rearranged eml4-alk fusion transcripts sequester in circulating blood platelets and enable blood-based crizotinib response monitoring in non-small-cell lung cancer. Oncotarget 2016, 7, 1066–1075. [Google Scholar] [CrossRef]
- Cocco, E.; Scaltriti, M.; Drilon, A. Ntrk fusion-positive cancers and trk inhibitor therapy. Nat. Rev. Clin. Oncol. 2018, 15, 731–747. [Google Scholar] [CrossRef] [PubMed]
- Kwak, E.L.; Bang, Y.-J.; Camidge, D.R.; Shaw, A.T.; Solomon, B.; Maki, R.G.; Ou, S.-H.I.; Dezube, B.J.; Jänne, P.A.; Costa, D.B.; et al. Anaplastic lymphoma kinase inhibition in non–small-cell lung cancer. N. Engl. J. Med. 2010, 363, 1693–1703. [Google Scholar] [CrossRef]
- Gerber, T.; Taschner-Mandl, S.; Saloberger-Sindhöringer, L.; Popitsch, N.; Heitzer, E.; Witt, V.; Geyeregger, R.; Hutter, C.; Schwentner, R.; Ambros, I.M.; et al. Assessment of pre-analytical sample handling conditions for comprehensive liquid biopsy analysis. J. Mol. Diagn. JMD 2020, 22, 1070–1086. [Google Scholar] [CrossRef]
- Pérez-Barrios, C.; Nieto-Alcolado, I.; Torrente, M.; Jiménez-Sánchez, C.; Calvo, V.; Gutierrez-Sanz, L.; Palka, M.; Donoso-Navarro, E.; Provencio, M.; Romero, A. Comparison of methods for circulating cell-free DNA isolation using blood from cancer patients: Impact on biomarker testing. Transl. Lung Cancer Res. 2016, 5, 665–672. [Google Scholar] [CrossRef]
- Devonshire, A.S.; Whale, A.S.; Gutteridge, A.; Jones, G.; Cowen, S.; Foy, C.A.; Huggett, J.F. Towards standardisation of cell-free DNA measurement in plasma: Controls for extraction efficiency, fragment size bias and quantification. Anal. Bioanal. Chem. 2014, 406, 6499–6512. [Google Scholar] [CrossRef]
- Page, K.; Guttery, D.S.; Zahra, N.; Primrose, L.; Elshaw, S.R.; Pringle, J.H.; Blighe, K.; Marchese, S.D.; Hills, A.; Woodley, L.; et al. Influence of plasma processing on recovery and analysis of circulating nucleic acids. PLoS ONE 2013, 8, e77963. [Google Scholar] [CrossRef]
- Mauger, F.; Dulary, C.; Daviaud, C.; Deleuze, J.F.; Tost, J. Comprehensive evaluation of methods to isolate, quantify, and characterize circulating cell-free DNA from small volumes of plasma. Anal. Bioanal. Chem. 2015, 407, 6873–6878. [Google Scholar] [CrossRef]
- Sorber, L.; Zwaenepoel, K.; Deschoolmeester, V.; Roeyen, G.; Lardon, F.; Rolfo, C.; Pauwels, P. A comparison of cell-free DNA isolation kits: Isolation and quantification of cell-free DNA in plasma. J. Mol. Diagn. JMD 2017, 19, 162–168. [Google Scholar] [CrossRef]
- Ungerer, V.; Bronkhorst, A.J.; Holdenrieder, S. Preanalytical variables that affect the outcome of cell-free DNA measurements. Crit. Rev. Clin. Lab. Sci. 2020, 57, 484–507. [Google Scholar] [CrossRef] [PubMed]
- Van Paemel, R.; De Koker, A.; Caggiano, C.; Morlion, A.; Mestdagh, P.; De Wilde, B.; Vandesompele, J.; De Preter, K. Genome-wide study of the effect of blood collection tubes on the cell-free DNA methylome. Epigenetics 2020. [Google Scholar] [CrossRef] [PubMed]
- Medina Diaz, I.; Nocon, A.; Mehnert, D.H.; Fredebohm, J.; Diehl, F.; Holtrup, F. Performance of streck cfdna blood collection tubes for liquid biopsy testing. PLoS ONE 2016, 11, e0166354. [Google Scholar] [CrossRef] [PubMed]
- Gojo, J.; Englinger, B.; Jiang, L.; Hübner, J.M.; Shaw, M.L.; Hack, O.A.; Madlener, S.; Kirchhofer, D.; Liu, I.; Pyrdol, J.; et al. Single-cell rna-seq reveals cellular hierarchies and impaired developmental trajectories in pediatric ependymoma. Cancer Cell 2020, 38, 44–59. [Google Scholar] [CrossRef]
- Thermofisher. Available online: https://www.thermofisher.com/document-connect/document-connect.html?url=https%3A%2F%2Fassets.thermofisher.com%2FTFS-Assets%2FLSG%2Fmanuals%2FQubit_dsDNA_HS_Assay_UG.pdf&title=VXNlciBHdWlkZTogUXViaXQgZHNETkEgSFMgQXNzYXkgS2l0cw (accessed on 31 July 2020).
- Thermofisher. Available online: https://www.thermofisher.com/document-connect/document-connect.html?url=https%3A%2F%2Fassets.thermofisher.com%2FTFS-Assets%2FLSG%2Fmanuals%2Fmp07581.pdf&title=UXVhbnQtaVQgUGljb0dyZWVuIGRzRE5BIFJlYWdlbnQgYW5kIEtpdHM (accessed on 15 August 2020).
- Bronner, I.F.; Quail, M.A.; Turner, D.J.; Swerdlow, H. Improved protocols for illumina sequencing. Curr. Protoc. Hum. Genet. 2014, 80, 18.2.1–18.2.42. [Google Scholar] [CrossRef]
- Quail, M.A.; Swerdlow, H.; Turner, D.J. Improved protocols for the illumina genome analyzer sequencing system. Curr. Protoc. Hum. Genet. 2009. [Google Scholar] [CrossRef]
- Rowlands, V.; Rutkowski, A.J.; Meuser, E.; Carr, T.H.; Harrington, E.A.; Barrett, J.C. Optimisation of robust singleplex and multiplex droplet digital pcr assays for high confidence mutation detection in circulating tumour DNA. Sci. Rep. 2019, 9, 12620. [Google Scholar] [CrossRef] [PubMed]
- Capper, D.; Jones, D.T.W.; Sill, M.; Hovestadt, V.; Schrimpf, D.; Sturm, D.; Koelsche, C.; Sahm, F.; Chavez, L.; Reuss, D.E.; et al. DNA methylation-based classification of central nervous system tumours. Nature 2018, 555, 469–474. [Google Scholar] [CrossRef] [PubMed]
- Hovestadt, V.Z.M. Conumee: Enhanced Copy-Number Variation Analysis Using Illumina DNA Methylation Arrays. Available online: https://bioconductor.org/packages/release/bioc/html/conumee.html (accessed on 31 July 2020).


| cfNA Preservation | Volume | Storage Conditions | Additive | Centrifugation Conditions | ||||
|---|---|---|---|---|---|---|---|---|
| Norgen | DNA, RNA | 8.4 mL | 30 d at RT | Osmotic cell stabilization | 20 min | 500× g | RT | |
| PAX | DNA, RNA | 10 mL | 14 d at RT | 28 d at 4 °C | Biological apoptosis prevention | 15 min | 1900× g | RT |
| Streck | DNA | 10 mL | 14 d at RT | Chemical crosslinking | 15 min | 1600× g | RT | |
| EDTA | DNA, RNA | 9 mL | 1 h at 4 °C | 10 min | 1900× g | 4 °C | ||
| DNA Assay | Fusion Assay | RNA Assay | ||||
|---|---|---|---|---|---|---|
| Target | RPP30 | ETV6-NTRK3 | GAPDH | |||
| Amplicon Size | 67 bp | 75 bp | 123 bp | |||
| Forward Primer Sequence | RPP30 Copy Number Determination Assay (Bio-Rad) | 5’CCTGAAGAGCACGCCAT’3 | 5’GGTGTGAACCATGAGAAGTATGA’3 | |||
| Reverse Primer Sequence | 5’GCTTCAGCACGATGTCTCT’3 | 5’GAGTCCTTCCACGATACCAAAG’3 | ||||
| Probe Sequence | 5’56-FAM/TGCTGCACA/ZEN/ TCTGCTATTCTCCCA/3IABκFQ’3 | 5’HEX/AGATCATCA/ZEN/ GCAATGCCTCCTGCA/3IABκFQ’3 | ||||
| Cycling Conditions | 95 °C for 10 min | 50 °C for 60 min | 50 °C for 60 min | |||
| 95 °C for 10 min | 95 °C for 10 min | |||||
| 94 °C for 30 s | 40 cycles | 94 °C for 30 s | 40 cycles | 94 °C for 30 s | 40 cycles | |
| 60 °C for 1 min | 54 °C for 1 min | 54 °C for 1 min | ||||
| 98 °C for 10 min | 98 °C for 10 min | 98 °C for 10 min | ||||
| 4 °C ∞ | 4 °C ∞ | 4 °C ∞ | ||||
Publisher’s Note: MDPI stays neutral with regard to jurisdictional claims in published maps and institutional affiliations. |
© 2021 by the authors. Licensee MDPI, Basel, Switzerland. This article is an open access article distributed under the terms and conditions of the Creative Commons Attribution (CC BY) license (https://creativecommons.org/licenses/by/4.0/).
Share and Cite
Maass, K.K.; Schad, P.S.; Finster, A.M.E.; Puranachot, P.; Rosing, F.; Wedig, T.; Schwarz, N.; Stumpf, N.; Pfister, S.M.; Pajtler, K.W. From Sampling to Sequencing: A Liquid Biopsy Pre-Analytic Workflow to Maximize Multi-Layer Genomic Information from a Single Tube. Cancers 2021, 13, 3002. https://doi.org/10.3390/cancers13123002
Maass KK, Schad PS, Finster AME, Puranachot P, Rosing F, Wedig T, Schwarz N, Stumpf N, Pfister SM, Pajtler KW. From Sampling to Sequencing: A Liquid Biopsy Pre-Analytic Workflow to Maximize Multi-Layer Genomic Information from a Single Tube. Cancers. 2021; 13(12):3002. https://doi.org/10.3390/cancers13123002
Chicago/Turabian StyleMaass, Kendra K., Paulina S. Schad, Agnes M. E. Finster, Pitithat Puranachot, Fabian Rosing, Tatjana Wedig, Nathalie Schwarz, Natalie Stumpf, Stefan M. Pfister, and Kristian W. Pajtler. 2021. "From Sampling to Sequencing: A Liquid Biopsy Pre-Analytic Workflow to Maximize Multi-Layer Genomic Information from a Single Tube" Cancers 13, no. 12: 3002. https://doi.org/10.3390/cancers13123002
APA StyleMaass, K. K., Schad, P. S., Finster, A. M. E., Puranachot, P., Rosing, F., Wedig, T., Schwarz, N., Stumpf, N., Pfister, S. M., & Pajtler, K. W. (2021). From Sampling to Sequencing: A Liquid Biopsy Pre-Analytic Workflow to Maximize Multi-Layer Genomic Information from a Single Tube. Cancers, 13(12), 3002. https://doi.org/10.3390/cancers13123002