
Effect of Osimertinib on CTCs and ctDNA in EGFR Mutant Non-Small Cell Lung Cancer Patients: The Prognostic Relevance of Liquid Biopsy


 ,
,  , ,
, ,  , ,
, , 
Abstract
:Simple Summary
Abstract
1. Introduction
2. Materials and Methods
2.1. Study Design
2.2. Blood Samples
2.3. ISET Isolation Platform and Immunofluorescence Staining
2.4. ctDNA Isolation and PNA-Q-PCR Assay for Mutation Testing
2.5. Statistical Analysis
3. Results
3.1. Study Population
3.2. Efficacy
3.3. CTC and ctDNA Status before Study Treatment (Pre Sample)
3.4. CTC and ctDNA Status after One Month of Study Treatment (Post-1 Sample)
3.5. CTC and ctDNA Status at the End of Study Treatment (EOT Sample)
3.6. Changes in LB Status during Treatment
3.7. Clinical Outcome according to CTC, ctDNA and LB Status
3.8. CTCs and ctDNA Changes during Treatment and Clinical Outcome
3.9. Univariate and Multivariate Analyses
4. Discussion
5. Conclusions
Supplementary Materials
Author Contributions
Funding
Institutional Review Board Statement
Informed Consent Statement
Data Availability Statement
Acknowledgments
Conflicts of Interest
References
- Lynch, T.J.; Bell, D.W.; Sordella, R.; Gurubhagavatula, S.; Okimoto, R.A.; Brannigan, B.W.; Harris, P.L.; Haserlat, S.M.; Supko, J.G.; Haluska, F.G.; et al. Activating mutations in the epidermal growth factor receptor underlying responsiveness of non-small-cell lung cancer to gefitinib. N. Engl. J. Med. 2004, 350, 2129–2139. [Google Scholar] [CrossRef]
- Paez, J.G.; Janne, P.A.; Lee, J.C.; Tracy, S.; Greulich, H.; Gabriel, S.; Herman, P.; Kaye, F.J.; Lindeman, N.; Boggon, T.J.; et al. EGFR mutations in lung cancer: Correlation with clinical response to gefitinib therapy. Science 2004, 304, 1497–1500. [Google Scholar] [CrossRef] [Green Version]
- Rosell, R.; Moran, T.; Queralt, C.; Porta, R.; Cardenal, F.; Camps, C.; Majem, M.; Lopez-Vivanco, G.; Isla, D.; Provencio, M.; et al. Screening for epidermal growth factor receptor mutations in lung cancer. N. Engl. J. Med. 2009, 361, 958–967. [Google Scholar] [CrossRef] [Green Version]
- Mok, T.S.; Wu, Y.L.; Thongprasert, S.; Yang, C.H.; Chu, D.T.; Saijo, N.; Sunpaweravong, P.; Han, B.; Margono, B.; Ichinose, Y.; et al. Gefitinib or carboplatin-paclitaxel in pulmonary adenocarcinoma. N. Engl. J. Med. 2009, 361, 947–957. [Google Scholar] [CrossRef]
- Mitsudomi, T.; Morita, S.; Yatabe, Y.; Negoro, S.; Okamoto, I.; Tsurutani, J.; Seto, T.; Satouchi, M.; Tada, H.; Hirashima, T.; et al. Gefitinib versus cisplatin plus docetaxel in patients with non-small-cell lung cancer harbouring mutations of the epidermal growth factor receptor (WJTOG3405): An open label, randomised phase 3 trial. Lancet Oncol. 2010, 11, 121–128. [Google Scholar] [CrossRef]
- Rosell, R.; Carcereny, E.; Gervais, R.; Vergnenegre, A.; Massuti, B.; Felip, E.; Palmero, R.; Garcia-Gomez, R.; Pallares, C.; Sanchez, J.M.; et al. Erlotinib versus standard chemotherapy as first-line treatment for European patients with advanced EGFR mutation-positive non-small-cell lung cancer (EURTAC): A multicentre, open-label, randomised phase 3 trial. Lancet Oncol. 2012, 13, 239–246. [Google Scholar] [CrossRef]
- Wu, Y.L.; Zhou, C.; Hu, C.P.; Feng, J.; Lu, S.; Huang, Y.; Li, W.; Hou, M.; Shi, J.H.; Lee, K.Y.; et al. Afatinib versus cisplatin plus gemcitabine for first-line treatment of Asian patients with advanced non-small-cell lung cancer harbouring EGFR mutations (LUX-Lung 6): An open-label, randomised phase 3 trial. Lancet Oncol. 2014, 15, 213–222. [Google Scholar] [CrossRef]
- Soria, J.C.; Ohe, Y.; Vansteenkiste, J.; Reungwetwattana, T.; Chewaskulyong, B.; Lee, K.H.; Dechaphunkul, A.; Imamura, F.; Nogami, N.; Kurata, T.; et al. Osimertinib in untreated EGFR-mutated advanced non-small-cell lung cancer. N. Engl. J. Med. 2018, 378, 113–125. [Google Scholar] [CrossRef]
- Kobayashi, S.; Boggon, T.J.; Dayaram, T.; Janne, P.A.; Kocher, O.; Meyerson, M.; Johnson, B.E.; Eck, M.J.; Tenen, D.G.; Halmos, B. EGFR mutation and resistance of non-small-cell lung cancer to gefitinib. N. Engl. J. Med. 2005, 352, 786–792. [Google Scholar] [CrossRef]
- Balak, M.N.; Gong, Y.; Riely, G.J.; Somwar, R.; Li, A.R.; Zakowski, M.F.; Chiang, A.; Yang, G.; Ouerfelli, O.; Kris, M.G.; et al. Novel D761Y and common secondary T790M mutations in epidermal growth factor receptor-mutant lung adenocarcinomas with acquired resistance to kinase inhibitors. Clin. Cancer Res. Off. J. Am. Assoc. Cancer Res. 2006, 12, 6494–6501. [Google Scholar] [CrossRef] [Green Version]
- Yun, C.H.; Mengwasser, K.E.; Toms, A.V.; Woo, M.S.; Greulich, H.; Wong, K.K.; Meyerson, M.; Eck, M.J. The T790M mutation in EGFR kinase causes drug resistance by increasing the affinity for ATP. Proc. Natl. Acad. Sci. USA 2008, 105, 2070–2075. [Google Scholar] [CrossRef] [PubMed] [Green Version]
- Cross, D.A.; Ashton, S.E.; Ghiorghiu, S.; Eberlein, C.; Nebhan, C.A.; Spitzler, P.J.; Orme, J.P.; Finlay, M.R.; Ward, R.A.; Mellor, M.J.; et al. AZD9291, an irreversible EGFR TKI, overcomes T790M-mediated resistance to EGFR inhibitors in lung cancer. Cancer Discov. 2014, 4, 1046–1061. [Google Scholar] [CrossRef] [Green Version]
- Janne, P.A.; Yang, J.C.; Kim, D.W.; Planchard, D.; Ohe, Y.; Ramalingam, S.S.; Ahn, M.J.; Kim, S.W.; Su, W.C.; Horn, L.; et al. AZD9291 in EGFR inhibitor-resistant non-small-cell lung cancer. N. Engl. J. Med. 2015, 372, 1689–1699. [Google Scholar] [CrossRef]
- Ramalingam, S.S.; Vansteenkiste, J.; Planchard, D.; Cho, B.C.; Gray, J.E.; Ohe, Y.; Zhou, C.; Reungwetwattana, T.; Cheng, Y.; Chewaskulyong, B.; et al. Overall survival with osimertinib in untreated, EGFR-mutated advanced NSCLC. N. Engl. J. Med. 2020, 382, 41–50. [Google Scholar] [CrossRef]
- Wu, Y.L.; Tsuboi, M.; He, J.; John, T.; Grohe, C.; Majem, M.; Goldman, J.W.; Laktionov, K.; Kim, S.W.; Kato, T.; et al. Osimertinib in resected EGFR-mutated non-small-cell lung cancer. N. Engl. J. Med. 2020, 383, 1711–1723. [Google Scholar] [CrossRef]
- Engelman, J.A.; Zejnullahu, K.; Mitsudomi, T.; Song, Y.; Hyland, C.; Park, J.O.; Lindeman, N.; Gale, C.M.; Zhao, X.; Christensen, J.; et al. MET amplification leads to gefitinib resistance in lung cancer by activating ERBB3 signaling. Science 2007, 316, 1039–1043. [Google Scholar] [CrossRef]
- Takezawa, K.; Pirazzoli, V.; Arcila, M.E.; Nebhan, C.A.; Song, X.; de Stanchina, E.; Ohashi, K.; Janjigian, Y.Y.; Spitzler, P.J.; Melnick, M.A.; et al. HER2 amplification: A potential mechanism of acquired resistance to EGFR inhibition in EGFR-mutant lung cancers that lack the second-site EGFRT790M mutation. Cancer Discov. 2012, 2, 922–933. [Google Scholar] [CrossRef] [Green Version]
- Ohashi, K.; Sequist, L.V.; Arcila, M.E.; Moran, T.; Chmielecki, J.; Lin, Y.L.; Pan, Y.; Wang, L.; de Stanchina, E.; Shien, K.; et al. Lung cancers with acquired resistance to EGFR inhibitors occasionally harbor BRAF gene mutations but lack mutations in KRAS, NRAS, or MEK1. Proc. Natl. Acad. Sci. USA 2012, 109, E2127–E2133. [Google Scholar] [CrossRef] [Green Version]
- Zeinali, M.; Lee, M.; Nadhan, A.; Mathur, A.; Hedman, C.; Lin, E.; Harouaka, R.; Wicha, M.S.; Zhao, L.; Palanisamy, N.; et al. High-throughput label-free isolation of heterogeneous circulating tumor cells and CTC clusters from non-small-cell lung cancer patients. Cancers 2020, 12, 127. [Google Scholar] [CrossRef] [Green Version]
- Hofman, V.; Ilie, M.; Long, E.; Guibert, N.; Selva, E.; Washetine, K.; Mograbi, B.; Mouroux, J.; Venissac, N.; Reverso-Meinietti, J.; et al. Detection of circulating tumor cells from lung cancer patients in the era of targeted therapy: Promises, drawbacks and pitfalls. Curr. Mol. Med. 2014, 14, 440–456. [Google Scholar] [CrossRef] [Green Version]
- Zhang, X.; Wei, L.; Li, J.; Zheng, J.; Zhang, S.; Zhou, J. Epithelialmesenchymal transition phenotype of circulating tumor cells is associated with distant metastasis in patients with NSCLC. Mol. Med. Rep. 2019, 19, 601–608. [Google Scholar] [CrossRef] [Green Version]
- Punnoose, E.A.; Atwal, S.; Liu, W.; Raja, R.; Fine, B.M.; Hughes, B.G.; Hicks, R.J.; Hampton, G.M.; Amler, L.C.; Pirzkall, A.; et al. Evaluation of circulating tumor cells and circulating tumor DNA in non-small cell lung cancer: Association with clinical endpoints in a phase II clinical trial of pertuzumab and erlotinib. Clin. Cancer Res. Off. J. Am. Assoc. Cancer Res. 2012, 18, 2391–2401. [Google Scholar] [CrossRef] [Green Version]
- Krebs, M.G.; Sloane, R.; Priest, L.; Lancashire, L.; Hou, J.M.; Greystoke, A.; Ward, T.H.; Ferraldeschi, R.; Hughes, A.; Clack, G.; et al. Evaluation and prognostic significance of circulating tumor cells in patients with non-small-cell lung cancer. J. Clin. Oncol. Off. J. Am. Soc. Clin. Oncol. 2011, 29, 1556–1563. [Google Scholar] [CrossRef]
- Krebs, M.G.; Hou, J.M.; Sloane, R.; Lancashire, L.; Priest, L.; Nonaka, D.; Ward, T.H.; Backen, A.; Clack, G.; Hughes, A.; et al. Analysis of circulating tumor cells in patients with non-small cell lung cancer using epithelial marker-dependent and -independent approaches. J. Thorac. Oncol. Off. Publ. Int. Assoc. Study Lung Cancer 2012, 7, 306–315. [Google Scholar] [CrossRef] [Green Version]
- Papadaki, M.A.; Messaritakis, I.; Fiste, O.; Souglakos, J.; Politaki, E.; Kotsakis, A.; Georgoulias, V.; Mavroudis, D.; Agelaki, S. Assessment of the efficacy and clinical utility of different circulating tumor cell (CTC) detection assays in patients with chemotherapy-naive advanced or metastatic non-small cell lung cancer (NSCLC). Int. J. Mol. Sci. 2021, 22, 925. [Google Scholar] [CrossRef]
- Gallo, M.; De Luca, A.; Maiello, M.R.; D’Alessio, A.; Esposito, C.; Chicchinelli, N.; Forgione, L.; Piccirillo, M.C.; Rocco, G.; Morabito, A.; et al. Clinical utility of circulating tumor cells in patients with non-small-cell lung cancer. Transl. Lung Cancer Res. 2017, 6, 486–498. [Google Scholar] [CrossRef] [Green Version]
- Tamminga, M.; de Wit, S.; Schuuring, E.; Timens, W.; Terstappen, L.; Hiltermann, T.J.N.; Groen, H.J.M. Circulating tumor cells in lung cancer are prognostic and predictive for worse tumor response in both targeted- and chemotherapy. Transl. Lung Cancer Res. 2019, 8, 854–861. [Google Scholar] [CrossRef]
- Milaki, G.; Messaritakis, I.; Koinis, F.; Kotsakis, A.; Apostolaki, S.; Dermitzaki, E.K.; Perraki, M.; Hatzidaki, D.; Georgoulias, V. Prognostic value of chemotherapy-resistant CK19mRNA-positive circulating tumor cells in patients with advanced/metastatic non-small cell lung cancer. Cancer Chemother. Pharmacol. 2017, 80, 101–108. [Google Scholar] [CrossRef]
- Kallergi, G.; Papadaki, M.A.; Politaki, E.; Mavroudis, D.; Georgoulias, V.; Agelaki, S. Epithelial to mesenchymal transition markers expressed in circulating tumour cells of early and metastatic breast cancer patients. Breast Cancer Res. BCR 2011, 13, R59. [Google Scholar] [CrossRef] [Green Version]
- Papadaki, M.A.; Kallergi, G.; Zafeiriou, Z.; Manouras, L.; Theodoropoulos, P.A.; Mavroudis, D.; Georgoulias, V.; Agelaki, S. Co-expression of putative stemness and epithelial-to-mesenchymal transition markers on single circulating tumour cells from patients with early and metastatic breast cancer. BMC Cancer 2014, 14, 651. [Google Scholar] [CrossRef] [Green Version]
- Maheswaran, S.; Sequist, L.V.; Nagrath, S.; Ulkus, L.; Brannigan, B.; Collura, C.V.; Inserra, E.; Diederichs, S.; Iafrate, A.J.; Bell, D.W.; et al. Detection of mutations in EGFR in circulating lung-cancer cells. N. Engl. J. Med. 2008, 359, 366–377. [Google Scholar] [CrossRef] [PubMed] [Green Version]
- Sundaresan, T.K.; Sequist, L.V.; Heymach, J.V.; Riely, G.J.; Janne, P.A.; Koch, W.H.; Sullivan, J.P.; Fox, D.B.; Maher, R.; Muzikansky, A.; et al. Detection of T790M, the acquired resistance EGFR mutation, by tumor biopsy versus noninvasive blood-based analyses. Clin. Cancer Res. Off. J. Am. Assoc. Cancer Res. 2016, 22, 1103–1110. [Google Scholar] [CrossRef] [PubMed] [Green Version]
- Gray, J.E.; Okamoto, I.; Sriuranpong, V.; Vansteenkiste, J.; Imamura, F.; Lee, J.S.; Pang, Y.K.; Cobo, M.; Kasahara, K.; Cheng, Y.; et al. Tissue and plasma EGFR mutation analysis in the FLAURA trial: Osimertinib versus comparator EGFR tyrosine kinase inhibitor as first-line treatment in patients with egfr-mutated advanced non-small cell lung cancer. Clin. Cancer Res. Off. J. Am. Assoc. Cancer Res. 2019, 25, 6644–6652. [Google Scholar] [CrossRef] [PubMed] [Green Version]
- Papadimitrakopoulou, V.A.; Han, J.Y.; Ahn, M.J.; Ramalingam, S.S.; Delmonte, A.; Hsia, T.C.; Laskin, J.; Kim, S.W.; He, Y.; Tsai, C.M.; et al. Epidermal growth factor receptor mutation analysis in tissue and plasma from the AURA3 trial: Osimertinib versus platinum-pemetrexed for T790M mutation-positive advanced non-small cell lung cancer. Cancer 2020, 126, 373–380. [Google Scholar] [CrossRef]
- Meng, S.; Tripathy, D.; Frenkel, E.P.; Shete, S.; Naftalis, E.Z.; Huth, J.F.; Beitsch, P.D.; Leitch, M.; Hoover, S.; Euhus, D.; et al. Circulating tumor cells in patients with breast cancer dormancy. Clin. Cancer Res. Off. J. Am. Assoc. Cancer Res. 2004, 10, 8152–8162. [Google Scholar] [CrossRef] [Green Version]
- Karachaliou, N.; Mayo-de las Casas, C.; Queralt, C.; de Aguirre, I.; Melloni, B.; Cardenal, F.; Garcia-Gomez, R.; Massuti, B.; Sanchez, J.M.; Porta, R.; et al. Association of EGFR L858R mutation in circulating free DNA with survival in the EURTAC trial. JAMA Oncol. 2015, 1, 149–157. [Google Scholar] [CrossRef] [Green Version]
- Ntzifa, A.; Strati, A.; Kallergi, G.; Kotsakis, A.; Georgoulias, V.; Lianidou, E. Gene expression in circulating tumor cells reveals a dynamic role of EMT and PD-L1 during osimertinib treatment in NSCLC patients. Sci. Rep. 2021, 11, 2313. [Google Scholar] [CrossRef]
- Liao, Z.J.; Guo, Y.H.; Zhao, Z.; Yao, J.T.; Xu, R.; Nan, K.J. Gemcitabine inhibits the micrometastasis of non-small cell lung cancer by targeting the EpCAM-positive circulating tumor cells via the HGF/cMET pathway. Int. J. Oncol. 2014, 45, 651–658. [Google Scholar] [CrossRef] [Green Version]
- Park, C.K.; Cho, H.J.; Choi, Y.D.; Oh, I.J.; Kim, Y.C. A phase II trial of osimertinib as the first-line treatment of non-small cell lung cancer harboring activating EGFR mutations in circulating tumor DNA: LiquidLung-o-cohort 1. Cancer Res. Treat. 2021, 53, 93–103. [Google Scholar] [CrossRef]
- Zhou, C.; Imamura, F.; Cheng, Y.; Okamoto, I.; Cho, B.; Lin, M.-C.; Majem, M.; Gautschi, O.; Gray, J.; Boyer, M.; et al. Early clearance of plasma EGFR mutations as a predictor of response to osimertinib and comparator EGFR-TKIs in the FLAURA trial. J. Clin. Oncol. 2019, 37, 9020. [Google Scholar] [CrossRef]
- Merker, J.D.; Oxnard, G.R.; Compton, C.; Diehn, M.; Hurley, P.; Lazar, A.J.; Lindeman, N.; Lockwood, C.M.; Rai, A.J.; Schilsky, R.L.; et al. Circulating tumor DNA analysis in patients with cancer: American society of clinical oncology and college of american pathologists joint review. J. Clin. Oncol. Off. J. Am. Soc. Clin. Oncol. 2018, 36, 1631–1641. [Google Scholar] [CrossRef] [PubMed]
- Wang, X.S.; Bai, Y.F.; Verma, V.; Yu, R.L.; Tian, W.; Ao, R.; Deng, Y.; Xia, J.L.; Zhu, X.Q.; Liu, H.; et al. Randomized trial of first-line tyrosine kinase inhibitor with or without radiotherapy for synchronous oligometastatic EGFR-mutated NSCLC. J. Natl. Cancer Inst. 2022, 114, djac015. [Google Scholar] [CrossRef] [PubMed]
- Yang, B.; Zheng, D.; Zeng, U.; Qin, A.; Gao, J.; Yu, G. Circulating tumor cells predict prognosis following secondline AZD 9291 treatment in EGFR-T790M mutant non-small cell lung cancer patients. J. BUON Off. J. Balk. Union Oncol. 2018, 23, 1077–1081. [Google Scholar]


| N = 47 | N (%) |
|---|---|
| Age->Median (Min–Max) | 66.0 (43–87) |
| Sex | |
| Male | 13 (27.7) |
| Female | 34 (72.3) |
| PS | |
| 0 | 27 (57.4) |
| 1 | 20 (42.6) |
| T790M (tissue and/or plasma) mutations | |
| Detected | 17 (36.2) |
| Not detected | 30 (63.8) |
| Line osimertinib admin | |
| Second Line | 24 (51.1) |
| >Second Line | 23 (48.9) |
| Previous Treatment | |
| Chemo and TKI | 23 (48.9) |
| TKI only | 24 (51.1) |
| Site of Disease | |
| Lung | 39 (83.0) |
| LNs | 24 (51.1) |
| Pleura | 11 (23.4) |
| Liver | 13 (27.7) |
| Bones | 21 (44.7) |
| CNS | 12 (25.5) |
| Other | 9 (19.1) |
| Median sites involved | 3 (1–5) |
| Response to osimertinib | |
| Complete response (CR) | 2 (4.3) |
| Partial response (PR) | 14 (29.8) |
| Stable disease (SD) | 20 (42.6) |
| Progressive disease (PD) | 11 (23.4) |
| ORR, 95% C.I | 16 (34.0%; 20.5–47.6%) |
| DCR, 95% C.I | 36 (76.6%; 64.5–88.7% |
| Relapses | 41 (87.2) |
| PFS | |
| Median (mo; min–max) | 7.5 (0.8–52.8) |
| 95% C.I | 6.0–9.0 |
| Deaths | 35 (74.5) |
| OS | |
| Median (mo; min–max) | 15.1 (2.1–52.8) |
| 95% C.I | 10.8–19.4 |
| 1-year OS | 69.8% |
| Follow up | |
| Median (mo; min–max) | 41.9 (2.1–52.8) |
| Time Points | CTCs | Phenotype | ||
|---|---|---|---|---|
| CTCs Detected | CK+VIM+CD45- | CK+VIM-CD45- | CK+VIM-CD45-/CK+VIM+/CD45- | |
| Baseline (n = 32) | 22 (68.8%) | 8 | 4 | 10 |
| Post 1st cycle (n = 27) | 13 (48.1%) | 5 | 5 | 3 |
| EOT (n = 21) | 13 (61.9%) | 4 | 5 | 4 |
| Detectable ctDNA | Baseline (n = 47) | Post-1 (n = 47) | EOT (n = 39) |
|---|---|---|---|
| ctDNA (at least one) | 29 (61.7) | 13 (27.7) | 24 (61.5) |
| * T790M | 10 (21.3) | 1 (2.1) | 1 (2.6) |
| Del19 | 18 (38.3) | 8 (17.0) | 11 (28.2) |
| L858R | 8 (17.0) | 4 (8.5) | 9 (23.1) |
| S768I & G719X | 3 (6.4) | 1 (2.1) | 3 (7.7) |
| H773_V774insNPH | - | - | 1 (2.6) |
| C797S | - | - | 1 (2.6) |
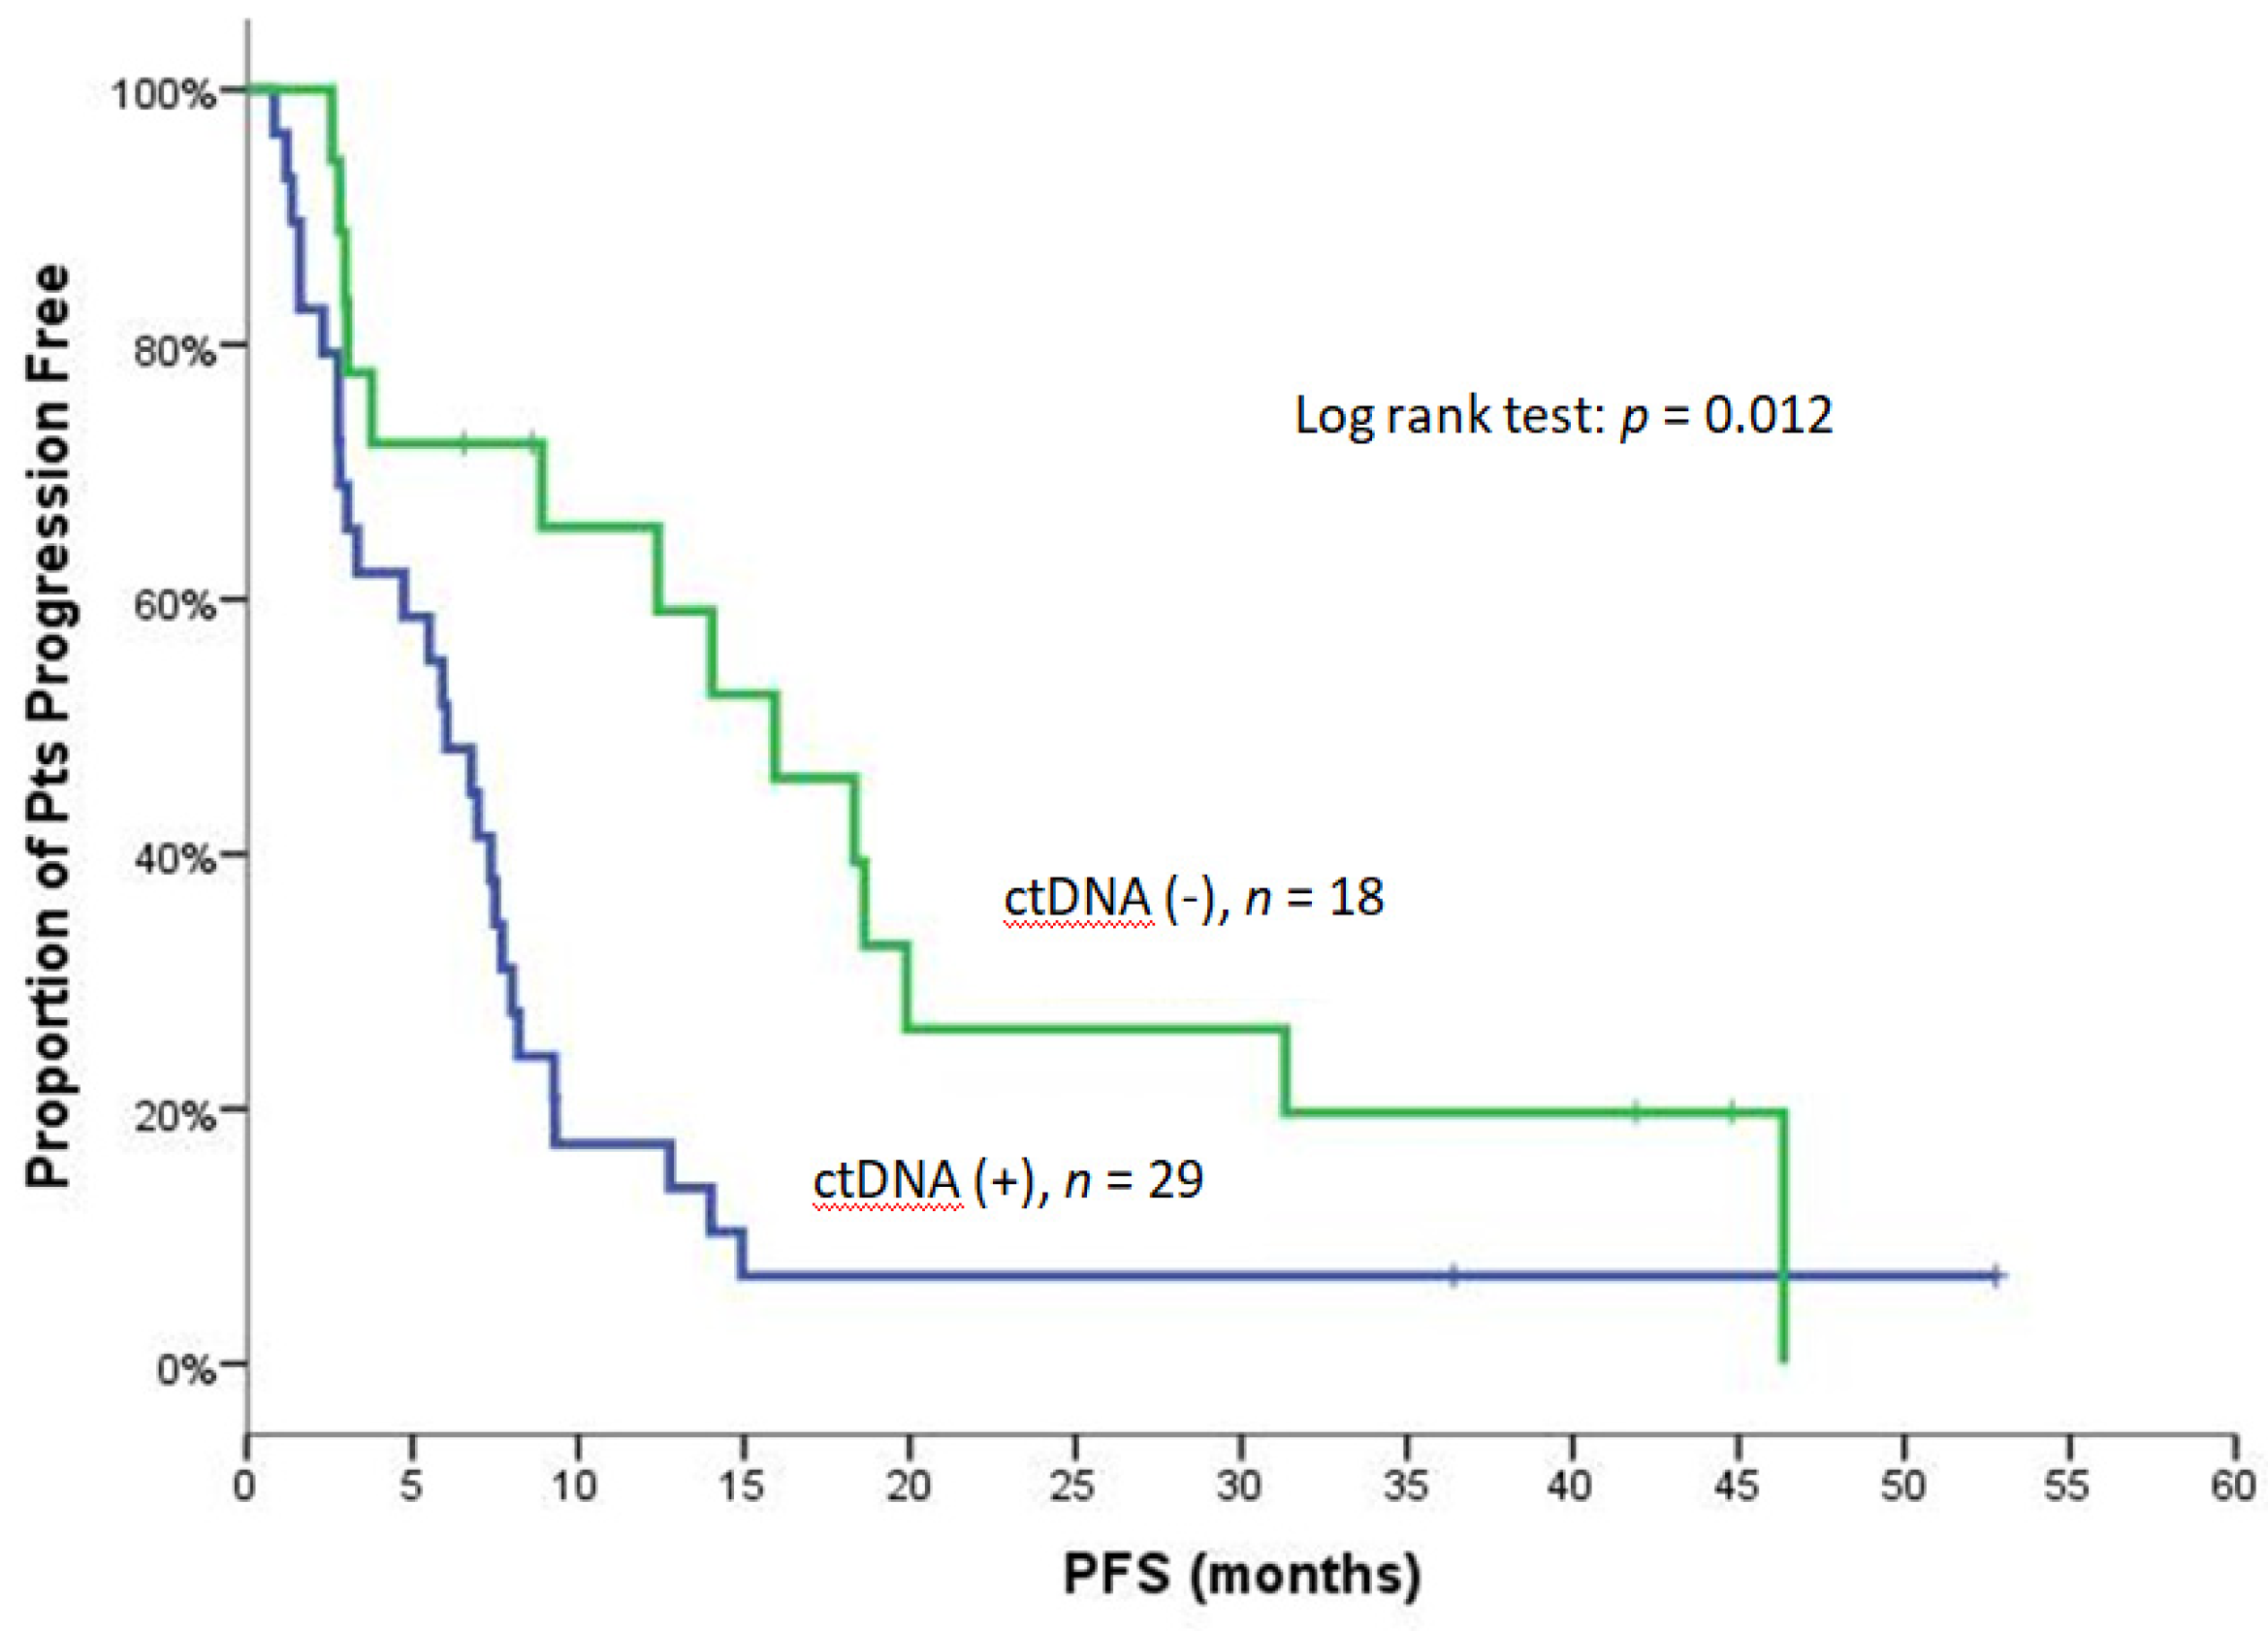
| PFS | Baseline (n = 47) | |||||
| ctDNA (+) | ctDNA (−) | p | Liquid (+) | Liquid (−) | p | |
| N/Events | 29/27 | 18/14 | 38/35 | 9/6 | ||
| Median | 6.0 | 15.9 | 0.012 (Figure 1) | 6.0 | 18.6 | 0.020 (Figure S3) |
| Min–Max | 0.8–52.8 | 2.6–46.4 | 0.8–52.8 | 3.0–44.8 | ||
| 95% C.I. | 3.8–8.3 | 8.6–23.3 | 3.8–8.2 | 15.0–22.2 | ||
| Post-1 (n = 47) | ||||||
| ctDNA (+) | ctDNA (−) | p | Liquid (+) | Liquid (−) | p | |
| N/Events | 13/13 | 34/28 | 23/22 | 24/19 | ||
| Median | 2.8 | 9.3 | <0.001 | 3.3 | 8.2 | 0.056 |
| Min–Max | 0.8–5.9 | 2.6–52.8 | 0.8–52.8 | 2.6–44.8 | ||
| 95% C.I. | 1.4–4.1 | 4.4–14.2 | 0.6–6.1 | 5.8–10.6 | ||
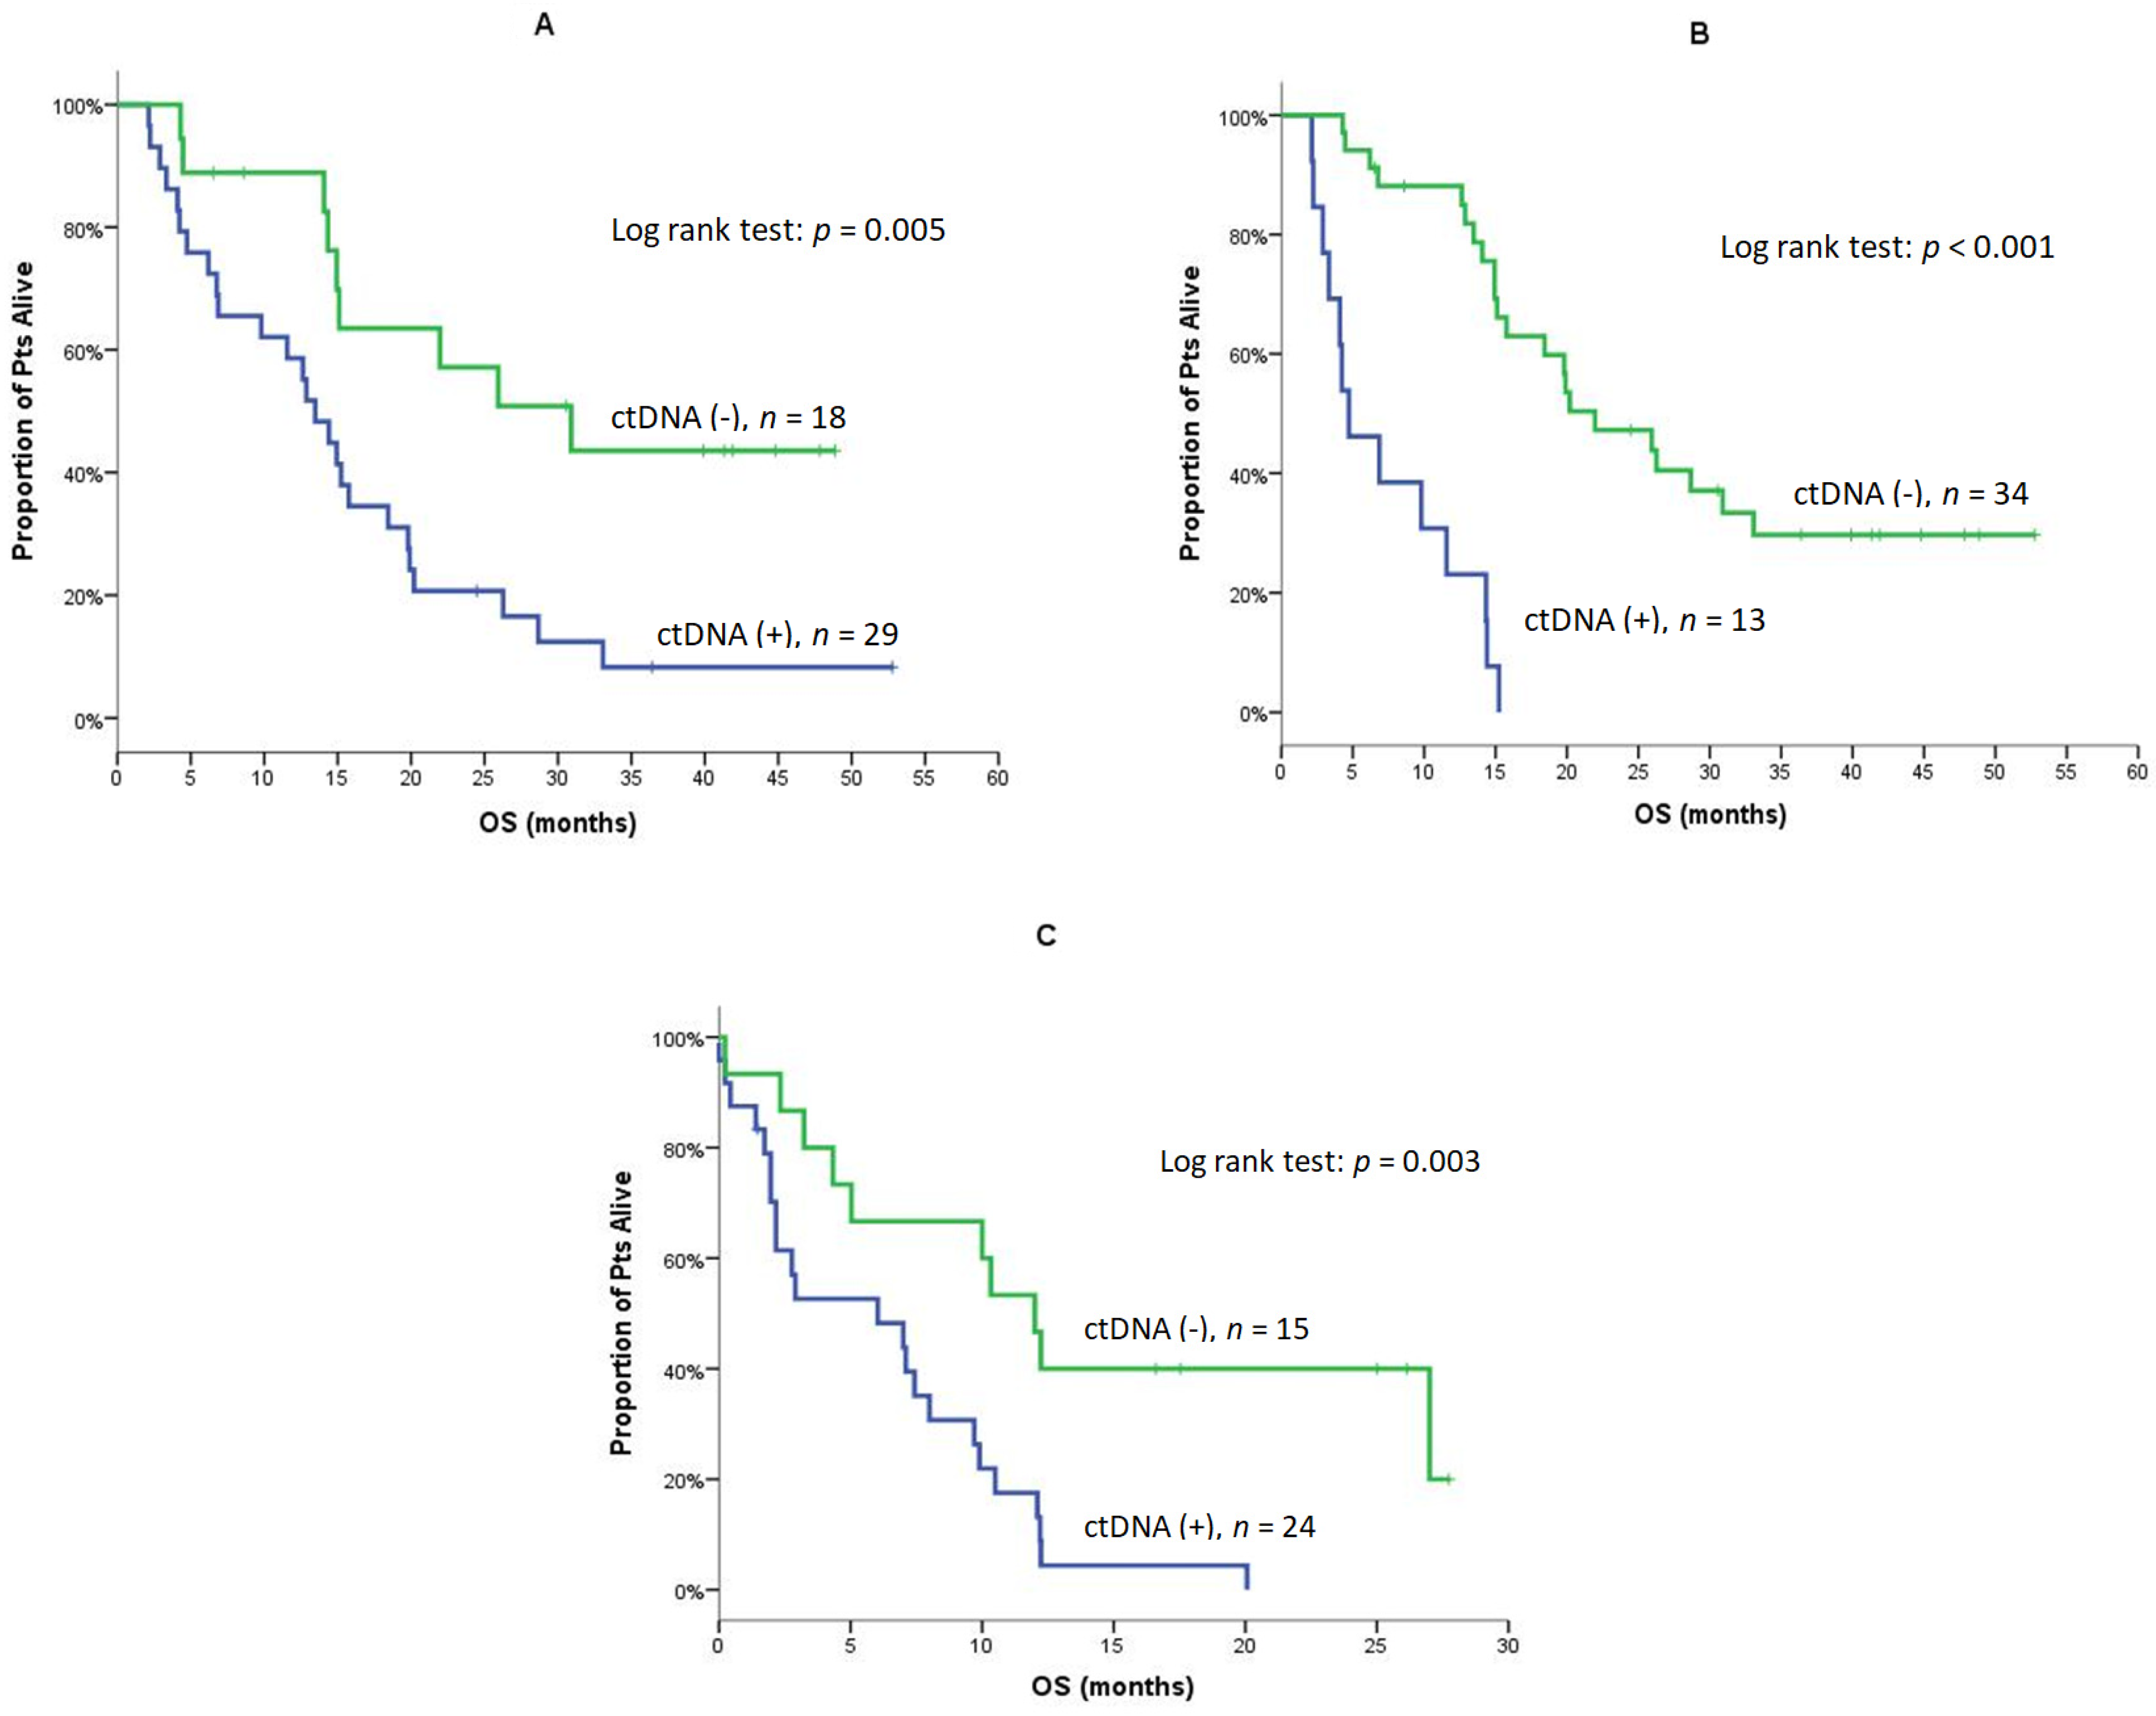
| OS | Baseline (n = 47) | |||||
| ctDNA (+) | ctDNA (−) | p | Liquid (+) | Liquid (−) | p | |
| N/Events | 29/26 | 18/9 | 38/30 | 9/5 | ||
| Median | 13.5 | 30.9 | 0.005 (Figure 2A) | 14.9 | 25.9 | 0.093 |
| Min–Max | 2.1–52.8 | 4.3–48.9 | 2.1–52.8 | 6.5–44.8 | ||
| 95% C.I. | 10.4–16.6 | 14.6–47.2 | 12.3–17.5 | 13.5–38.3 | ||
| 1-year OS | 58.6% | 88.9% | 62.9% | 100% | ||
| Post-1 (n = 47) | ||||||
| ctDNA (+) | ctDNA (−) | p | Liquid (+) | Liquid (−) | p | |
| N/Events | 13/13 | 34/22 | 23/18 | 24/17 | ||
| Median | 4.7 | 22.0 | <0.001 (Figure 2B) | 14.3 | 20.2 | 0.269 |
| Min–Max | 2.1–15.2 | 4.3–52.8 | 2.1–52.8 | 4.3–48.9 | ||
| 95% C.I. | 1.5–8.0 | 13.7–30.2 | 9.9–18.8 | 14.9–25.5 | ||
| 1-year OS | 23.1% | 88.1% | 56.5% | 83.1% | ||
| EOT (n = 39) | ||||||
| ctDNA (+) | ctDNA (−) | p | Liquid (+) | Liquid (−) | p | |
| N/Events | 24/23 | 15/10 | 29/25 | 10/8 | ||
| Median | 6.0 | 12.0 | 0.003 (Figure 2C) | 7.1 | 10.0 | 0.250 |
| Min–Max | 0–20.1 | 0.2–27.7 | 0–27.7 | 0.2–27.0 | ||
| 95% C.I. | 0–12.6 | 9.2–14.8 | 1.3–12.9 | 0–20.8 | ||
| 1-year OS | 17.5% | 46.7% | 25.1% | 40.0% | ||
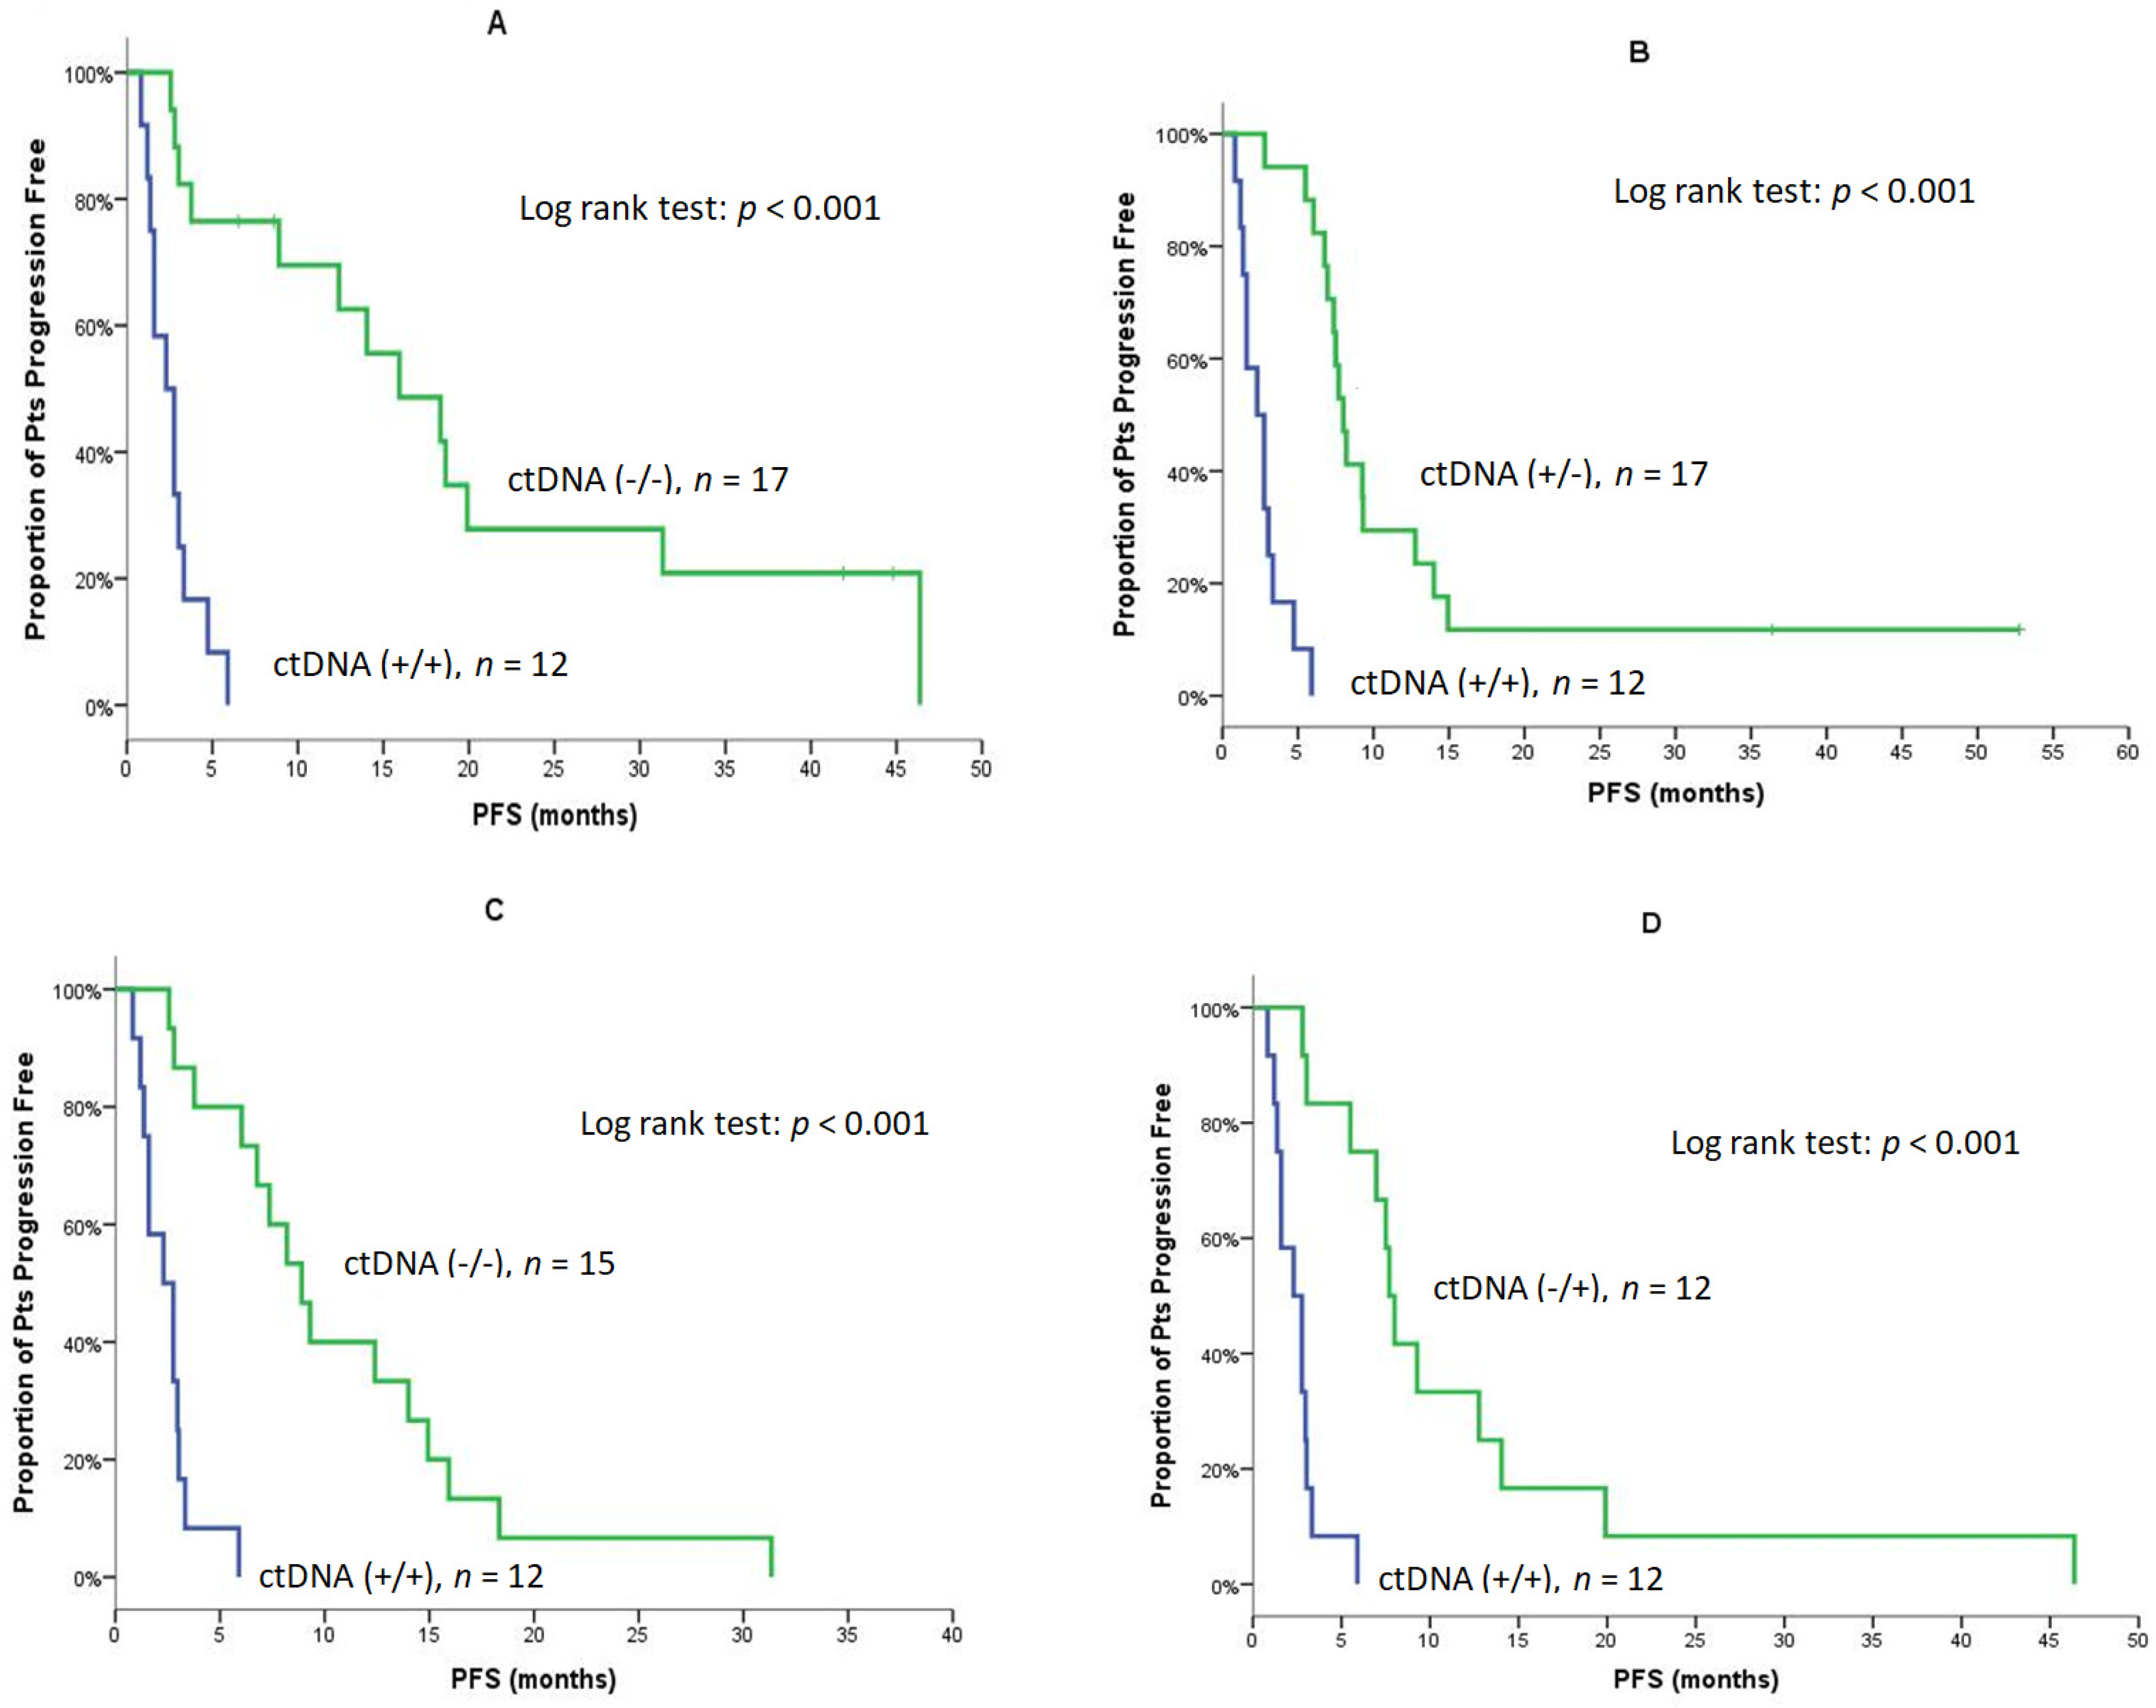
| PFS | Baseline/Post-1 | |||||
| +/+ | −/− | p | +/+ | +/− | p | |
| N/Events | 12/12 | 17/13 | 12/12 | 17/15 | ||
| Median | 2.3 | 15.9 | <0.001 (Figure 3A) | 2.3 | 8.0 | <0.001 (Figure 3B) |
| Min–Max | 0.8–5.9 | 2.6–46.4 | 0.8–5.9 | 2.8–52.8 | ||
| 95% C.I. | 1.0–3.6 | 8.1–23.7 | 1.0–3.6 | 7.0–8.9 | ||
| PFS | Post-1/EOT | |||||
| +/+ | −/− | p | +/+ | −/+ | p | |
| N/Events | 12/12 | 15/15 | 12/12 | 12/12 | ||
| Median | 2.3 | 8.9 | <0.001 (Figure 3C) | 2.3 | 7.7 | <0.001 (Figure 3D) |
| Min–Max | 0.8–5.9 | 2.6–31.3 | 0.8–5.9 | 2.8–46.4 | ||
| 95% C.I. | 1.0–3.6 | 6.5–11.3 | 1.0–3.6 | 6.9–8.5 | ||
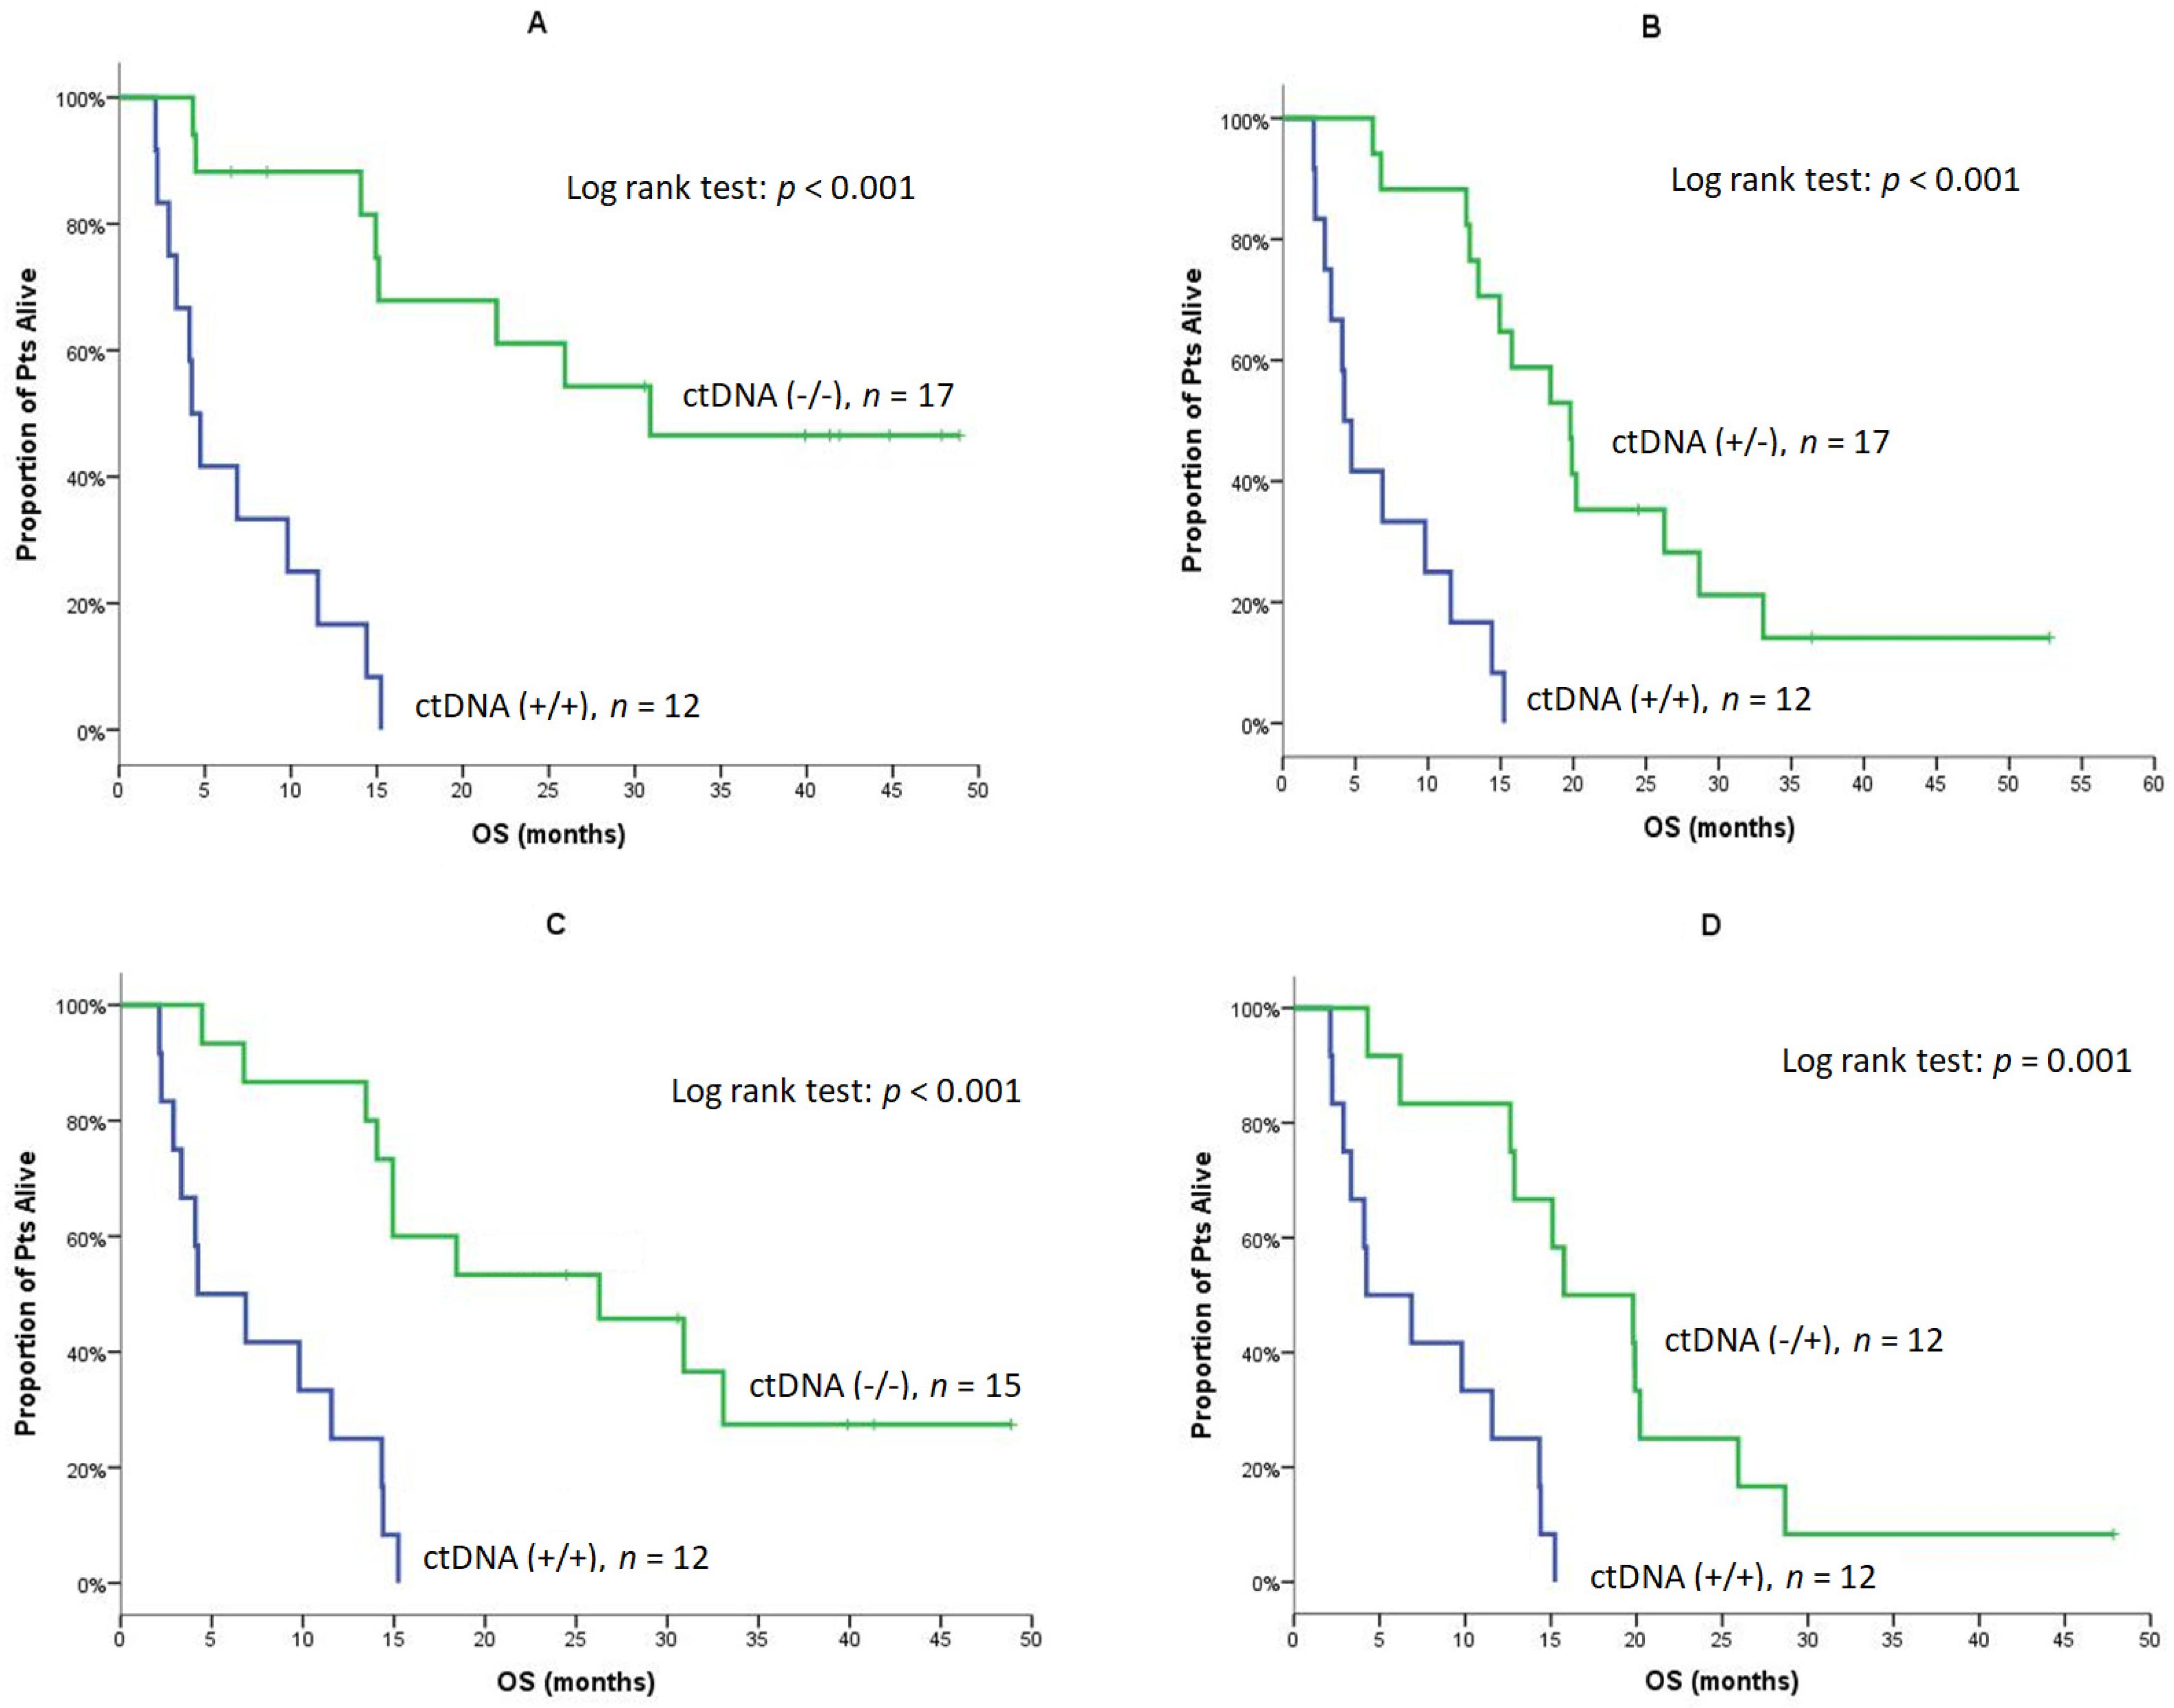
| OS | Baseline/Post-1 | |||||
| +/+ | −/− | p | +/+ | +/− | p | |
| N/Events | 12/12 | 17/8 | 12/12 | 17/14 | ||
| Median | 4.2 | NE | <0.001 (Figure 4A) | 4.2 | 19.8 | <0.001 (Figure 4B) |
| Min–Max | 2.1–15.2 | 4.3–48.9 | 2.1–15.2 | 6.2–52.8 | ||
| 95% C.I. | 3.1–5.3 | - | 3.1–5.3 | 14.2–25.3 | ||
| 1-year OS | 16.7% | 88.2% | 16.7% | 88.2% | ||
| OS | Post-1/EOT | |||||
| +/+ | −/− | p | +/+ | −/+ | p | |
| N/Events | 12/12 | 15/10 | 12/12 | 12/11 | ||
| Median | 4.2 | 26.3 | <0.001 (Figure 4C) | 4.2 | 15.8 | 0.001 (Figure 4D) |
| Min-Max | 2.1–15.2 | 4.5–48.9 | 2.1–15.2 | 4.3–47.8 | ||
| 95% C.I. | 0–8.9 | 8.8–43.8 | 0–8.9 | 7.8–23.7 | ||
| 1-year OS | 25.0% | 86.7% | 25.0% | 83.3% | ||
| Independent Factors | PFS | OS | ||
|---|---|---|---|---|
| Hazard Ratio (95% Confidence Interval) | p | Hazard Ratio (95% Confidence Interval) | p | |
| Performance status | ||||
| PS 0 | 1 (reference) | 1 (reference) | ||
| PS 1 | 1.2 (0.7–2.3) | 0.534 | 1.8 (0.9–3.5) | 0.094 |
| Gender | ||||
| Male | 3.2 (1.5–6.6) | 0.002 | 2.6 (1.3–5.2) | 0.007 |
| Female | 1 (reference) | 1 (reference) | ||
| Line of osimertinib | ||||
| Second line | 1.0 (0.5–1.7) | 0.835 | 1.1 (0.6–2.2) | 0.751 |
| >Second line | 1 (reference) | 1 (reference) | ||
| T790M (plasma and/or tissue) | ||||
| Detected | 1.0 (0.5–2.0) | 0.886 | 1.0 (0.5–2.0) | 0.955 |
| Not detected | 1 (reference) | 1 (reference) | ||
| Baseline ctDNA | ||||
| Detected | 2.3 (1.2–4.5) | 0.015 | 2.9 (1.3–6.2) | 0.007 |
| Not detected | 1 (reference) | 1 (reference) | ||
Publisher’s Note: MDPI stays neutral with regard to jurisdictional claims in published maps and institutional affiliations. |
© 2022 by the authors. Licensee MDPI, Basel, Switzerland. This article is an open access article distributed under the terms and conditions of the Creative Commons Attribution (CC BY) license (https://creativecommons.org/licenses/by/4.0/).
Share and Cite
Kallergi, G.; Kontopodis, E.; Ntzifa, A.; Jordana-Ariza, N.; Karachaliou, N.; Pantazaka, E.; Charalambous, H.A.; Psyrri, A.; Tsaroucha, E.; Boukovinas, I.; et al. Effect of Osimertinib on CTCs and ctDNA in EGFR Mutant Non-Small Cell Lung Cancer Patients: The Prognostic Relevance of Liquid Biopsy. Cancers 2022, 14, 1574. https://doi.org/10.3390/cancers14061574
Kallergi G, Kontopodis E, Ntzifa A, Jordana-Ariza N, Karachaliou N, Pantazaka E, Charalambous HA, Psyrri A, Tsaroucha E, Boukovinas I, et al. Effect of Osimertinib on CTCs and ctDNA in EGFR Mutant Non-Small Cell Lung Cancer Patients: The Prognostic Relevance of Liquid Biopsy. Cancers. 2022; 14(6):1574. https://doi.org/10.3390/cancers14061574
Chicago/Turabian StyleKallergi, Galatea, Emmanouil Kontopodis, Aliki Ntzifa, Núria Jordana-Ariza, Niki Karachaliou, Evangelia Pantazaka, Haris A. Charalambous, Amanda Psyrri, Emily Tsaroucha, Ioannis Boukovinas, and et al. 2022. "Effect of Osimertinib on CTCs and ctDNA in EGFR Mutant Non-Small Cell Lung Cancer Patients: The Prognostic Relevance of Liquid Biopsy" Cancers 14, no. 6: 1574. https://doi.org/10.3390/cancers14061574
APA StyleKallergi, G., Kontopodis, E., Ntzifa, A., Jordana-Ariza, N., Karachaliou, N., Pantazaka, E., Charalambous, H. A., Psyrri, A., Tsaroucha, E., Boukovinas, I., Koumarianou, A., Hatzidaki, D., Lianidou, E., Georgoulias, V., Rosell, R., & Kotsakis, A. (2022). Effect of Osimertinib on CTCs and ctDNA in EGFR Mutant Non-Small Cell Lung Cancer Patients: The Prognostic Relevance of Liquid Biopsy. Cancers, 14(6), 1574. https://doi.org/10.3390/cancers14061574