Image Analysis Reveals Microstructural and Volumetric Differences in Glioblastoma Patients with and without Preoperative Seizures

 ,
,  , , and
Abstract
1. Introduction
2. Methods
2.1. Patient Population
2.2. MR Imaging
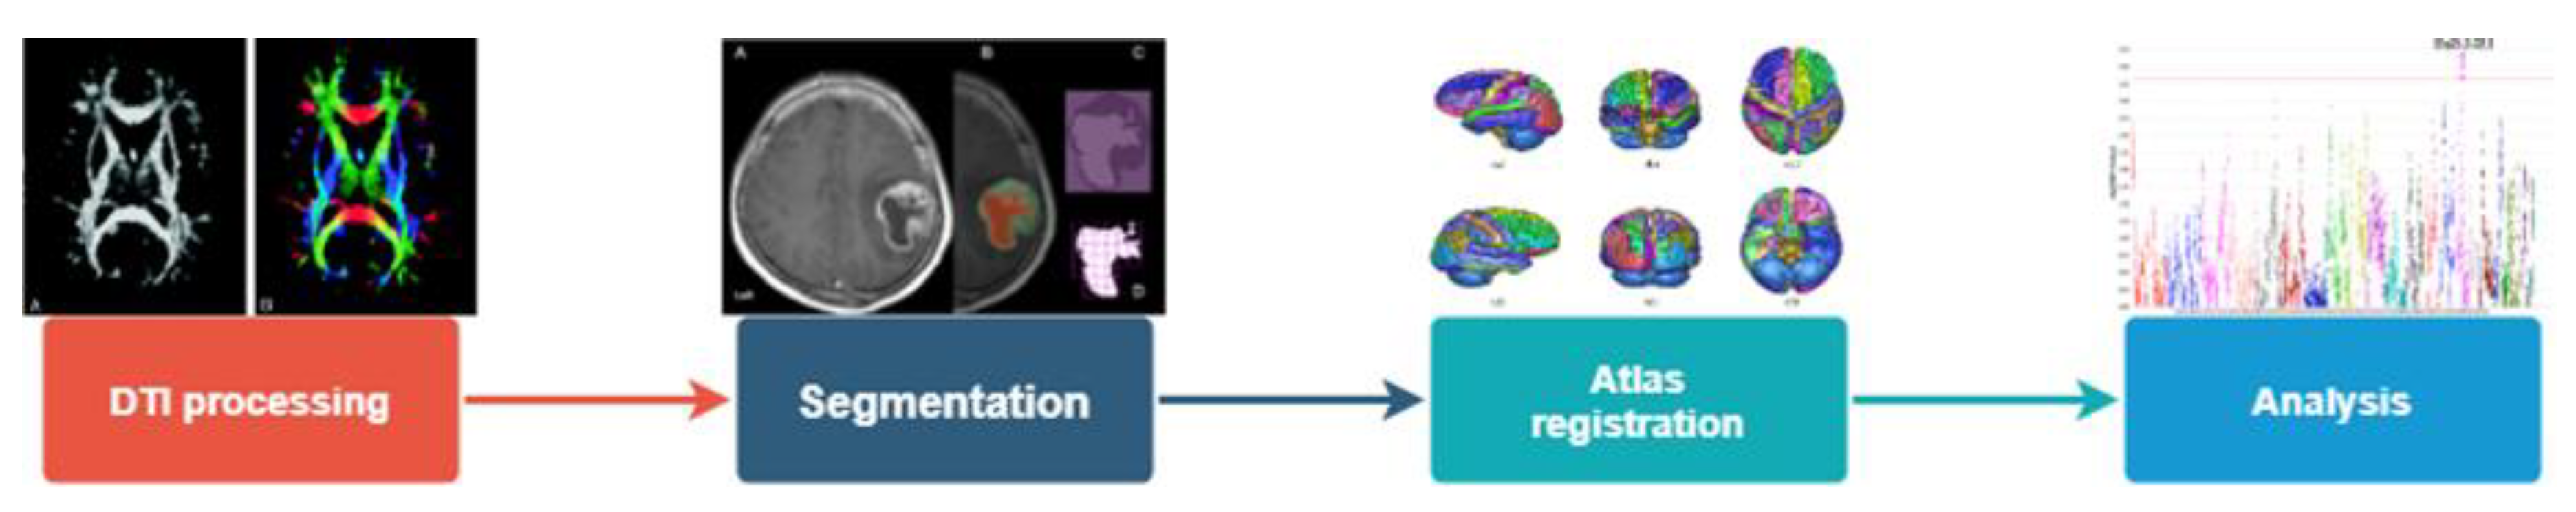
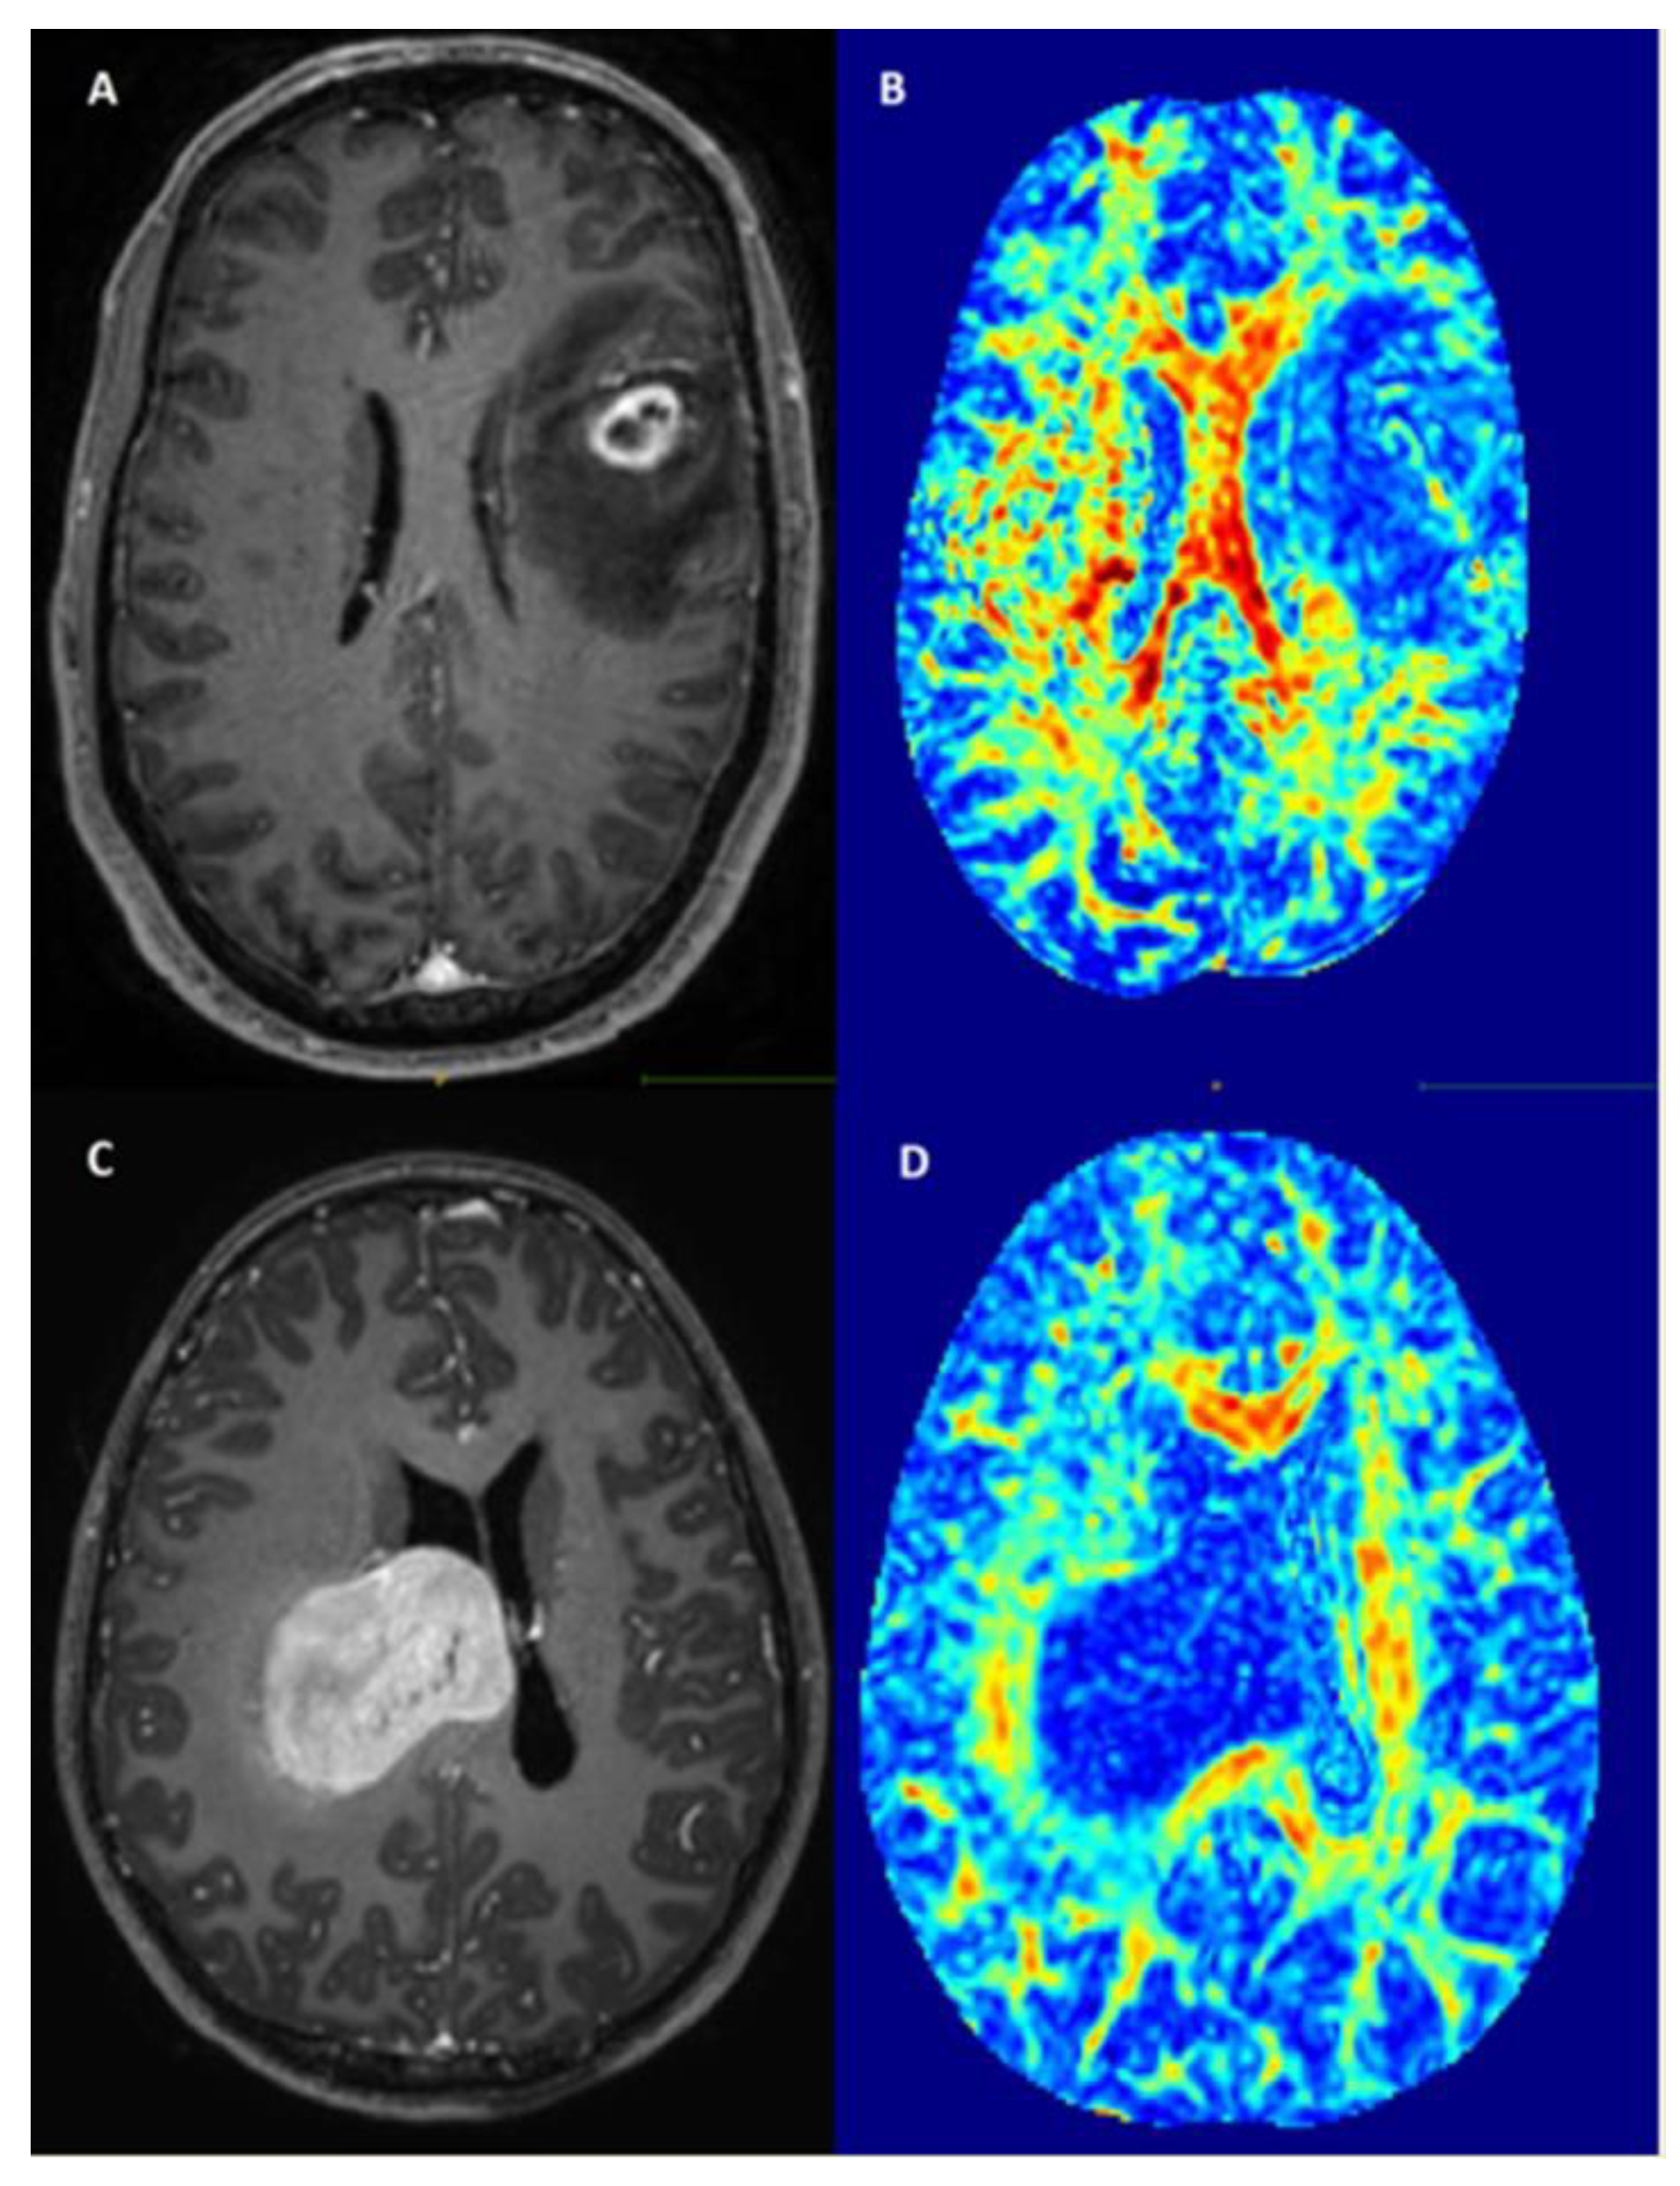
2.3. Image Analysis
2.4. Statistics
3. Results
3.1. Patients’ and Tumor Characteristics
3.2. Tumor Size and Location
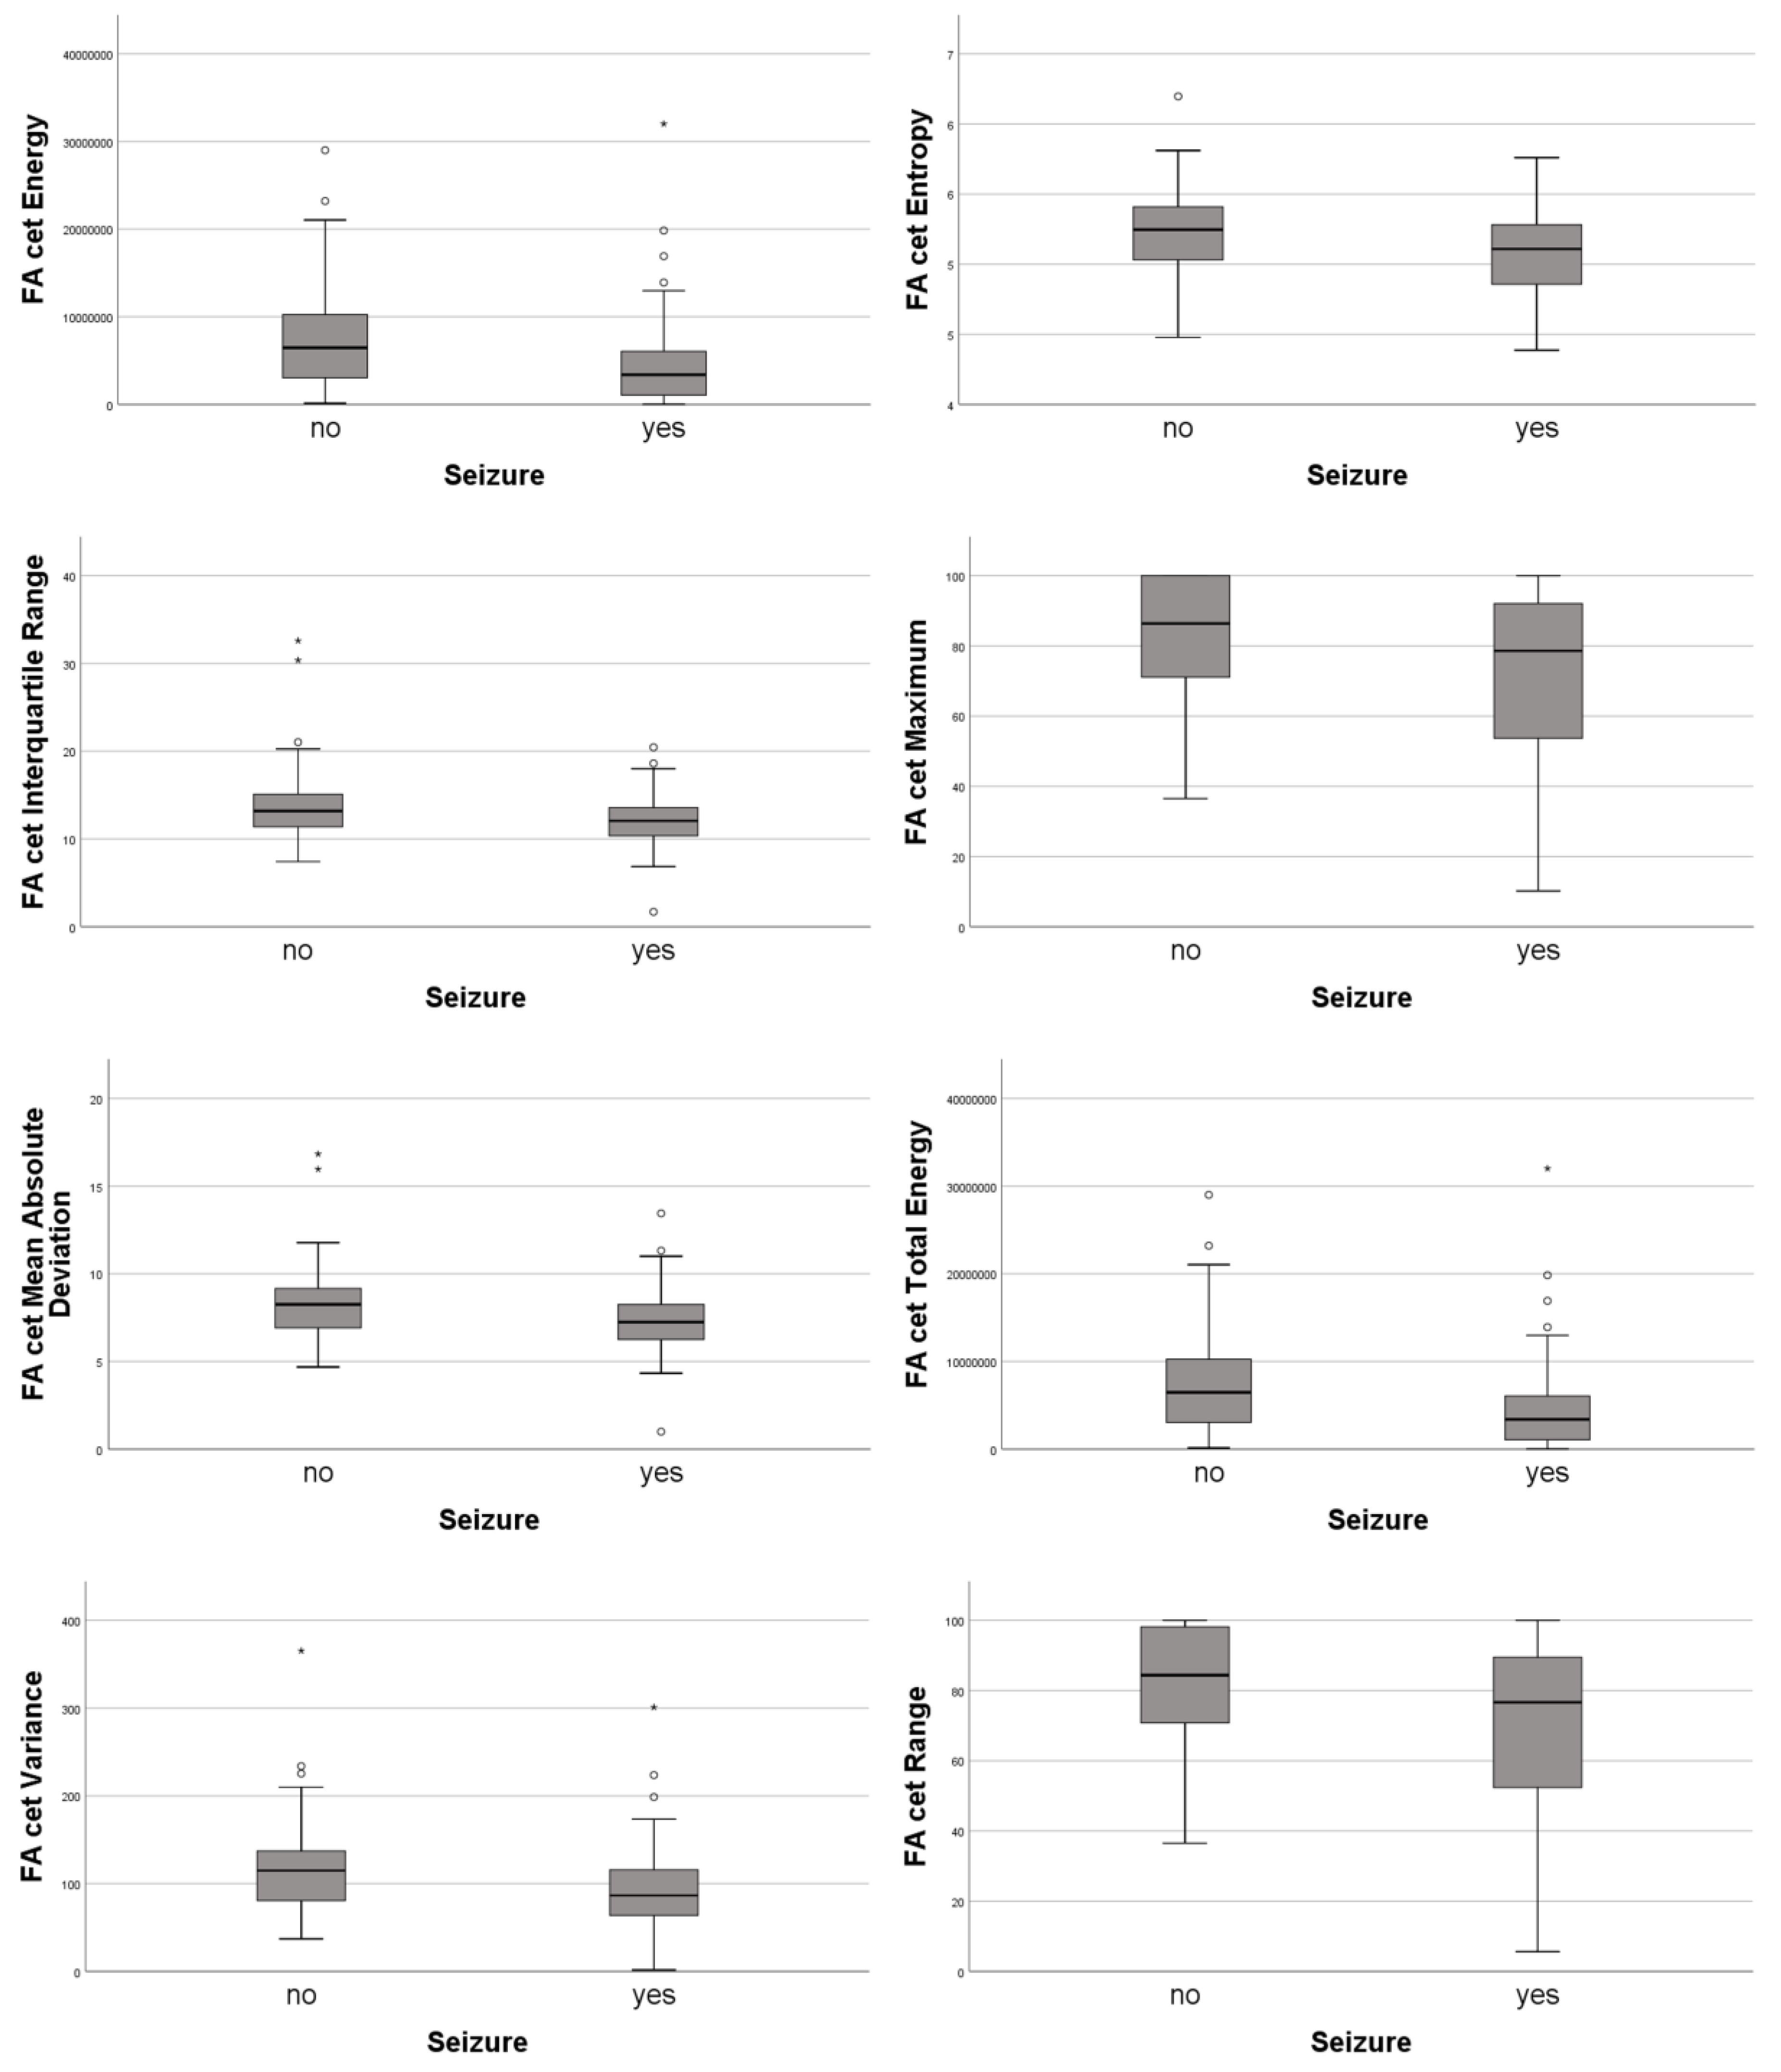
3.3. Histogram Analyses
4. Discussion
5. Conclusions
Supplementary Materials
Author Contributions
Funding
Conflicts of Interest
Abbreviations
| ADC | Apparent diffusion coefficient |
| BTE | Brain tumor-related epilepsy |
| FA | Fractional anisotropy |
| FLAIR | Fluid-attenuated inversion recovery |
| GB | Glioblastoma |
| MPRage | Magnetization prepared rapid gradient echo |
References
- Huberfeld, G.; Vecht, C.J. Seizures and gliomas-towards a single therapeutic approach. Nat. Rev. Neurol. 2016, 12, 204–216. [Google Scholar] [CrossRef] [PubMed]
- Michelucci, R.; Pasini, E.; Meletti, S.; Fallica, E.; Rizzi, R.; Florindo, I.; Chiari, A.; Monetti, C.; Cremonini, A.M.; Forlivesi, S.; et al. Epilepsy in primary cerebral tumors: The characteristics of epilepsy at the onset (results from the PERNO study-Project of Emilia Romagna Region on Neuro-Oncology). Epilepsia 2013, 54 (Suppl. 7), 86–91. [Google Scholar] [CrossRef]
- Pallud, J.; Audureau, E.; Blonski, M.; Sanai, N.; Bauchet, L.; Fontaine, D.; Mandonnet, E.; Dezamis, E.; Psimaras, D.; Guyotat, J.; et al. Epileptic seizures in diffuse low-grade gliomas in adults. Brain 2014, 137 Pt 2, 449–462. [Google Scholar] [CrossRef]
- Van Breemen, M.S.; Wilms, E.B.; Vecht, C.J. Epilepsy in patients with brain tumours: Epidemiology, mechanisms, and management. Lancet Neurol. 2007, 6, 421–430. [Google Scholar] [CrossRef]
- Vecht, C.J.; Kerkhof, M.; Duran-Pena, A. Seizure prognosis in brain tumors: New insights and evidence-based management. Oncologist 2014, 19, 751–759. [Google Scholar] [CrossRef] [PubMed]
- Englot, D.J.; Berger, M.S.; Barbaro, N.M.; Chang, E.F. Factors associated with seizure freedom in the surgical resection of glioneuronal tumors. Epilepsia 2012, 53, 51–57. [Google Scholar] [CrossRef]
- Kerkhof, M.; Vecht, C.J. Seizure characteristics and prognostic factors of gliomas. Epilepsia 2013, 54 (Suppl. 9), 12–17. [Google Scholar] [CrossRef]
- Yan, H.; Parsons, D.W.; Jin, G.; McLendon, R.; Rasheed, B.A.; Yuan, W.; Kos, I.; Batinic-Haberle, I.; Jones, S.; Riggins, G.J.; et al. IDH1 and IDH2 mutations in gliomas. N. Engl. J. Med. 2009, 360, 765–773. [Google Scholar] [CrossRef]
- Buckingham, S.C.; Campbell, S.L.; Haas, B.R.; Montana, V.; Robel, S.; Ogunrinu, T.; Sontheimer, H. Glutamate release by primary brain tumors induces epileptic activity. Nat. Med. 2011, 17, 1269–1274. [Google Scholar] [CrossRef]
- Buckingham, S.C.; Robel, S. Glutamate and tumor-associated epilepsy: Glial cell dysfunction in the peritumoral environment. Neurochem. Int. 2013, 63, 696–701. [Google Scholar] [CrossRef]
- Conti, L.; Palma, E.; Roseti, C.; Lauro, C.; Cipriani, R.; de Groot, M.; Aronica, E.; Limatola, C. Anomalous levels of Cl-transporters cause a decrease of GABAergic inhibition in human peritumoral epileptic cortex. Epilepsia 2011, 52, 1635–1644. [Google Scholar] [CrossRef] [PubMed]
- You, G.; Sha, Z.; Jiang, T. The pathogenesis of tumor-related epilepsy and its implications for clinical treatment. Seizure 2012, 21, 153–159. [Google Scholar] [CrossRef] [PubMed]
- Goel, S.; Wharton, S.B.; Brett, L.P.; Whittle, I.R. Morphological changes and stress responses in neurons in cerebral cortex infiltrated by diffuse astrocytoma. Neuropathology 2003, 23, 262–270. [Google Scholar] [CrossRef] [PubMed]
- McNamara, J.O. Emerging insights into the genesis of epilepsy. Nature 1999, 399 (Suppl. 6738), A15–A22. [Google Scholar] [CrossRef]
- Schaller, B.; Ruegg, S.J. Brain tumor and seizures: Pathophysiology and its implications for treatment revisited. Epilepsia 2003, 44, 1223–1232. [Google Scholar] [CrossRef]
- Shamji, M.F.; Fric-Shamji, E.C.; Benoit, B.G. Brain tumors and epilepsy: Pathophysiology of peritumoral changes. Neurosurg. Rev. 2009, 32, 275–284, discussion 284–276. [Google Scholar] [CrossRef]
- Lee, J.W.; Wen, P.Y.; Hurwitz, S.; Black, P.; Kesari, S.; Drappatz, J.; Golby, A.J.; Wells, W.M., 3rd; Warfield, S.K.; Kikinis, R.; et al. Morphological characteristics of brain tumors causing seizures. Arch. Neurol. 2010, 67, 336–342. [Google Scholar] [CrossRef]
- Skardelly, M.; Brendle, E.; Noell, S.; Behling, F.; Wuttke, T.V.; Schittenhelm, J.; Bisdas, S.; Meisner, C.; Rona, S.; Tatagiba, M.S.; et al. Predictors of preoperative and early postoperative seizures in patients with intra-axial primary and metastatic brain tumors: A retrospective observational single center study. Ann. Neurol. 2015, 78, 917–928. [Google Scholar] [CrossRef]
- Beppu, T.; Inoue, T.; Shibata, Y.; Yamada, N.; Kurose, A.; Ogasawara, K.; Ogawa, A.; Kabasawa, H. Fractional anisotropy value by diffusion tensor magnetic resonance imaging as a predictor of cell density and proliferation activity of glioblastomas. Surg. Neurol. 2005, 63, 56–61, discussion 61. [Google Scholar] [CrossRef]
- Akbari, H.; Macyszyn, L.; Da, X.; Bilello, M.; Wolf, R.L.; Martinez-Lage, M.; Biros, G.; Alonso-Basanta, M.; O’Rourke, D.M.; Davatzikos, C. Imaging Surrogates of Infiltration Obtained Via Multiparametric Imaging Pattern Analysis Predict Subsequent Location of Recurrence of Glioblastoma. Neurosurgery 2016, 78, 572–580. [Google Scholar] [CrossRef]
- Bette, S.; Huber, T.; Gempt, J.; Boeckh-Behrens, T.; Wiestler, B.; Kehl, V.; Ringel, F.; Meyer, B.; Zimmer, C.; Kirschke, J.S. Local Fractional Anisotropy Is Reduced in Areas with Tumor Recurrence in Glioblastoma. Radiology 2017, 283, 499–507. [Google Scholar] [CrossRef] [PubMed]
- Hoefnagels, F.W.; De Witt Hamer, P.; Sanz-Arigita, E.; Idema, S.; Kuijer, J.P.; Pouwels, P.J.; Barkhof, F.; Vandertop, W.P. Differentiation of edema and glioma infiltration: Proposal of a DTI-based probability map. J. Neurooncol. 2014, 120, 187–198. [Google Scholar] [CrossRef] [PubMed]
- World Medical. A. World Medical Association Declaration of Helsinki: Ethical principles for medical research involving human subjects. JAMA 2013, 310, 2191–2194. [Google Scholar] [CrossRef] [PubMed]
- Avants, B.B.; Tustison, N.J.; Song, G.; Cook, P.A.; Klein, A.; Gee, J.C. A reproducible evaluation of ANTs similarity metric performance in brain image registration. Neuroimage 2011, 54, 2033–2044. [Google Scholar] [CrossRef]
- Garyfallidis, E.; Brett, M.; Amirbekian, B.; Rokem, A.; van der Walt, S.; Descoteaux, M.; Nimmo-Smith, I.; Dipy, C. Dipy, a library for the analysis of diffusion MRI data. Front. Neuroinform. 2014, 8, 8. [Google Scholar] [CrossRef]
- Menze, B.H.; Van Leemput, K.; Lashkari, D.; Riklin-Raviv, T.; Geremia, E.; Alberts, E.; Gruber, P.; Wegener, S.; Weber, M.A.; Szekely, G.; et al. A Generative Probabilistic Model and Discriminative Extensions for Brain Lesion Segmentation--With Application to Tumor and Stroke. IEEE Trans. Med. Imaging 2016, 35, 933–946. [Google Scholar] [CrossRef]
- Rohlfing, T.; Zahr, N.M.; Sullivan, E.V.; Pfefferbaum, A. The SRI24 multichannel atlas of normal adult human brain structure. Hum. Brain Mapp. 2010, 31, 798–819. [Google Scholar] [CrossRef]
- Yushkevich, P.A.; Piven, J.; Hazlett, H.C.; Smith, R.G.; Ho, S.; Gee, J.C.; Gerig, G. User-guided 3D active contour segmentation of anatomical structures: Significantly improved efficiency and reliability. Neuroimage 2006, 31, 1116–1128. [Google Scholar] [CrossRef]
- Van Griethuysen, J.J.M.; Fedorov, A.; Parmar, C.; Hosny, A.; Aucoin, N.; Narayan, V.; Beets-Tan, R.G.H.; Fillion-Robin, J.C.; Pieper, S.; Aerts, H. Computational Radiomics System to Decode the Radiographic Phenotype. Cancer Res. 2017, 77, e104–e107. [Google Scholar] [CrossRef]
- Camargo, A.; Azuaje, F.; Wang, H.; Zheng, H. Permutation-based statistical tests for multiple hypotheses. Source Code Biol. Med. 2008, 3, 15. [Google Scholar] [CrossRef]
- Yang, P.; You, G.; Zhang, W.; Wang, Y.; Wang, Y.; Yao, K.; Jiang, T. Correlation of preoperative seizures with clinicopathological factors and prognosis in anaplastic gliomas: A report of 198 patients from China. Seizure 2014, 23, 844–851. [Google Scholar] [CrossRef] [PubMed]
- Chang, E.F.; Potts, M.B.; Keles, G.E.; Lamborn, K.R.; Chang, S.M.; Barbaro, N.M.; Berger, M.S. Seizure characteristics and control following resection in 332 patients with low-grade gliomas. J. Neurosurg. 2008, 108, 227–235. [Google Scholar] [CrossRef] [PubMed]
- Choi, J.; Stradmann-Bellinghausen, B.; Yakubov, E.; Savaskan, N.E.; Regnier-Vigouroux, A. Glioblastoma cells induce differential glutamatergic gene expressions in human tumor-associated microglia/macrophages and monocyte-derived macrophages. Cancer Biol. Ther. 2015, 16, 1205–1213. [Google Scholar] [CrossRef]
- Ye, Z.C.; Rothstein, J.D.; Sontheimer, H. Compromised glutamate transport in human glioma cells: Reduction-mislocalization of sodium-dependent glutamate transporters and enhanced activity of cystine-glutamate exchange. J. Neurosci. 1999, 19, 10767–10777. [Google Scholar] [CrossRef] [PubMed]
- Ye, Z.C.; Sontheimer, H. Glioma cells release excitotoxic concentrations of glutamate. Cancer Res. 1999, 59, 4383–4391. [Google Scholar] [PubMed]
- Bauer, A.H.; Erly, W.; Moser, F.G.; Maya, M.; Nael, K. Differentiation of solitary brain metastasis from glioblastoma multiforme: A predictive multiparametric approach using combined MR diffusion and perfusion. Neuroradiology 2015, 57, 697–703. [Google Scholar] [CrossRef]
- Bette, S.; Huber, T.; Wiestler, B.; Boeckh-Behrens, T.; Gempt, J.; Ringel, F.; Meyer, B.; Zimmer, C.; Kirschke, J.S. Analysis of fractional anisotropy facilitates differentiation of glioblastoma and brain metastases in a clinical setting. Eur. J. Radiol. 2016, 85, 2182–2187. [Google Scholar] [CrossRef]
- Wang, S.; Kim, S.; Chawla, S.; Wolf, R.L.; Zhang, W.G.; O’Rourke, D.M.; Judy, K.D.; Melhem, E.R.; Poptani, H. Differentiation between glioblastomas and solitary brain metastases using diffusion tensor imaging. Neuroimage 2009, 44, 653–660. [Google Scholar] [CrossRef]
- Wang, S.; Kim, S.J.; Poptani, H.; Woo, J.H.; Mohan, S.; Jin, R.; Voluck, M.R.; O’Rourke, D.M.; Wolf, R.L.; Melhem, E.R.; et al. Diagnostic utility of diffusion tensor imaging in differentiating glioblastomas from brain metastases. AJNR Am. J. Neuroradiol. 2014, 35, 928–934. [Google Scholar] [CrossRef]
- Vargova, L.; Homola, A.; Zamecnik, J.; Tichy, M.; Benes, V.; Sykova, E. Diffusion parameters of the extracellular space in human gliomas. Glia 2003, 42, 77–88. [Google Scholar] [CrossRef]
- Zamecnik, J. The extracellular space and matrix of gliomas. Acta Neuropathol. 2005, 110, 435–442. [Google Scholar] [CrossRef] [PubMed]
- Huber, T.; Alber, G.; Bette, S.; Boeckh-Behrens, T.; Gempt, J.; Ringel, F.; Alberts, E.; Zimmer, C.; Bauer, J.S. Reliability of Semi-Automated Segmentations in Glioblastoma. Clin. Neuroradiol. 2017, 27, 153–161. [Google Scholar] [CrossRef] [PubMed]


| Age | 64 Years (+/-13.9) |
|---|---|
| Sex, male | 90/160 |
| Preoperative seizure | 60/160 |
| Tumor infiltration of | |
| - frontal lobe | 87/160 |
| - temporal lobe | 93/160 |
| - parietal lobe | 57/160 |
| - occipital lobe | 37/160 |
| - insula | 90/160 |
| - hippocampus | 51/160 |
| - cerebellum | 4/160 |
| - brainstem | 13/160 |
| Hemisphere | |
| - right | 74/160 |
| - left | 64/160 |
| - both | 22/160 |
| IDH1-wildtype | 108/109 |
| MR Sequence | Seizure | No Seizure | adj. p-Value |
|---|---|---|---|
| FLAIR | 48884.4 mm3 (31830.9–97074.7) | 85391.7 mm3 (54260.2–124244.1) | 0.725 |
| CET* | 8434.9 mm3 (3604.9–17662.9) | 14805.7 mm3 (8196.8–26347.5) | 0.029 |
| Location | Seizure (n = 60) | No Seizure (n = 100) | Odds Ratio | Perm. p-Value |
|---|---|---|---|---|
| Left superior frontal gyrus | 17 | 38 | 0.645 | 0.857 |
| Right superior frontal gyrus | 19 | 43 | 0.614 | 0.140 |
| Left middle frontal gyrus | 16 | 29 | 0.890 | 1 |
| Right middle frontal gyrus | 15 | 41 | 0.480 | 0.172 |
| Left inferior frontal gyrus | 16 | 27 | 0.983 | 1 |
| Right inferior frontal gyrus | 13 | 37 | 0.471 | 0.248 |
| Left precentral gyrus | 19 | 30 | 1.081 | 1 |
| Right precentral gyrus | 18 | 50 | 0.429 | 0.091 |
| Left middle orbitofrontal gyrus | 9 | 20 | 0.706 | 1 |
| Right middle orbitofrontal gyrus | 4 | 25 | 0.214 | 0.064 |
| Left lateral orbitofrontal gyrus | 9 | 19 | 0.752 | 1 |
| Right lateral orbitofrontal gyrus | 6 | 27 | 0.300 | 0.214 |
| Left gyrus rectus | 2 | 12 | 0.253 | 1 |
| Right gyrus rectus | 4 | 11 | 0.578 | 0.783 |
| Left postcentral gyrus | 15 | 21 | 1.254 | 0.999 |
| Right postcentral gyrus | 16 | 46 | 0.427 | 0.200 |
| Left superior parietal gyrus | 9 | 14 | 1.084 | 1 |
| Right superior parietal gyrus | 15 | 29 | 0.816 | 1 |
| Left supramarginal gyrus | 9 | 12 | 1.294 | 1 |
| Right supramarginal gyrus | 10 | 30 | 0.467 | 0.072 |
| Left angular gyrus | 14 | 16 | 1.598 | 0.991 |
| Right angular gyrus | 12 | 26 | 0.712 | 0.935 |
| Left precuneus | 9 | 13 | 1.181 | 1 |
| Right precuneus | 11 | 26 | 0.639 | 1 |
| Left superior occipital gyrus | 6 | 7 | 1.476 | 1 |
| Right superior occipital gyrus | 8 | 21 | 0.579 | 0.873 |
| Left middle occipital gyrus | 9 | 9 | 1.784 | 0.449 |
| Right middle occipital gyrus | 10 | 21 | 0.752 | 1 |
| Left inferior occipital gyrus | 7 | 10 | 1.189 | 1 |
| Right inferior occipital gyrus | 8 | 10 | 1.385 | 1 |
| Left cuneus | 8 | 8 | 1.769 | 0.995 |
| Right cuneus | 7 | 13 | 0.884 | 1 |
| Left superior temporal gyrus | 24 | 31 | 1.484 | 0.943 |
| Right superior temporal gyrus | 18 | 46 | 0.503 | 0.266 |
| Left middle temporal gyrus | 21 | 27 | 1.456 | 0.999 |
| Right middle temporal gyrus | 14 | 39 | 0.476 | 0.125 |
| Left inferior temporal gyrus | 20 | 26 | 1.423 | 0.998 |
| Right inferior temporal gyrus | 15 | 26 | 0.949 | 1 |
| Left parahippocampal gyrus | 19 | 27 | 1.253 | 1 |
| Right parahippocampal gyrus | 14 | 31 | 0.677 | 0968 |
| Left lingual gyrus | 11 | 19 | 0.957 | 1 |
| Right lingual gyrus | 12 | 25 | 0.750 | 0.995 |
| Left fusiform gyrus | 17 | 24 | 1.252 | 1 |
| Right fusiform gyrus | 13 | 30 | 0.645 | 0.999 |
| Left insular cortex | 18 | 32 | 0.911 | 1 |
| Right insular cortex | 18 | 46 | 0.503 | 0.266 |
| Left cingulate gyrus | 18 | 42 | 0.592 | 0.877 |
| Right cingulate gyrus | 19 | 49 | 0.482 | 0.048 |
| Left caudate | 19 | 35 | 0.861 | 1 |
| Right caudate | 14 | 45 | 0.372 | 0.009 |
| Left putamen | 20 | 36 | 0.889 | 1 |
| Right putamen | 19 | 49 | 0.482 | 0.187 |
| Left hippocampus | 18 | 27 | 1.159 | 1 |
| Right hippocampus | 15 | 36 | 0.593 | 0.476 |
| cerebellum | 9 | 15 | 1.000 | 1 |
| brainstem | 12 | 29 | 0.612 | 1 |
© 2020 by the authors. Licensee MDPI, Basel, Switzerland. This article is an open access article distributed under the terms and conditions of the Creative Commons Attribution (CC BY) license (http://creativecommons.org/licenses/by/4.0/).
Share and Cite
Bette, S.; Barz, M.; Nham, H.L.; Huber, T.; Berndt, M.; Sales, A.; Schmidt-Graf, F.; Meyer, H.S.; Ryang, Y.-M.; Meyer, B.; et al. Image Analysis Reveals Microstructural and Volumetric Differences in Glioblastoma Patients with and without Preoperative Seizures. Cancers 2020, 12, 994. https://doi.org/10.3390/cancers12040994
Bette S, Barz M, Nham HL, Huber T, Berndt M, Sales A, Schmidt-Graf F, Meyer HS, Ryang Y-M, Meyer B, et al. Image Analysis Reveals Microstructural and Volumetric Differences in Glioblastoma Patients with and without Preoperative Seizures. Cancers. 2020; 12(4):994. https://doi.org/10.3390/cancers12040994
Chicago/Turabian StyleBette, Stefanie, Melanie Barz, Huong Ly Nham, Thomas Huber, Maria Berndt, Arthur Sales, Friederike Schmidt-Graf, Hanno S. Meyer, Yu-Mi Ryang, Bernhard Meyer, and et al. 2020. "Image Analysis Reveals Microstructural and Volumetric Differences in Glioblastoma Patients with and without Preoperative Seizures" Cancers 12, no. 4: 994. https://doi.org/10.3390/cancers12040994
APA StyleBette, S., Barz, M., Nham, H. L., Huber, T., Berndt, M., Sales, A., Schmidt-Graf, F., Meyer, H. S., Ryang, Y.-M., Meyer, B., Zimmer, C., Kirschke, J. S., Wiestler, B., & Gempt, J. (2020). Image Analysis Reveals Microstructural and Volumetric Differences in Glioblastoma Patients with and without Preoperative Seizures. Cancers, 12(4), 994. https://doi.org/10.3390/cancers12040994