Characterization of HMGB1/2 Interactome in Prostate Cancer by Yeast Two Hybrid Approach: Potential Pathobiological Implications

 ,
, 

 and
and 
Abstract
1. Introduction
2. Results
2.1. HMGB1 and HMGB2 Y2H Interactomes in the PCa PC-3 Cell Line and in Adenocarcinoma Primary Tumor
2.2. Mutations and Copy Number Alterations in HMGB1 and HMGB2 Interactome Targets in PCa
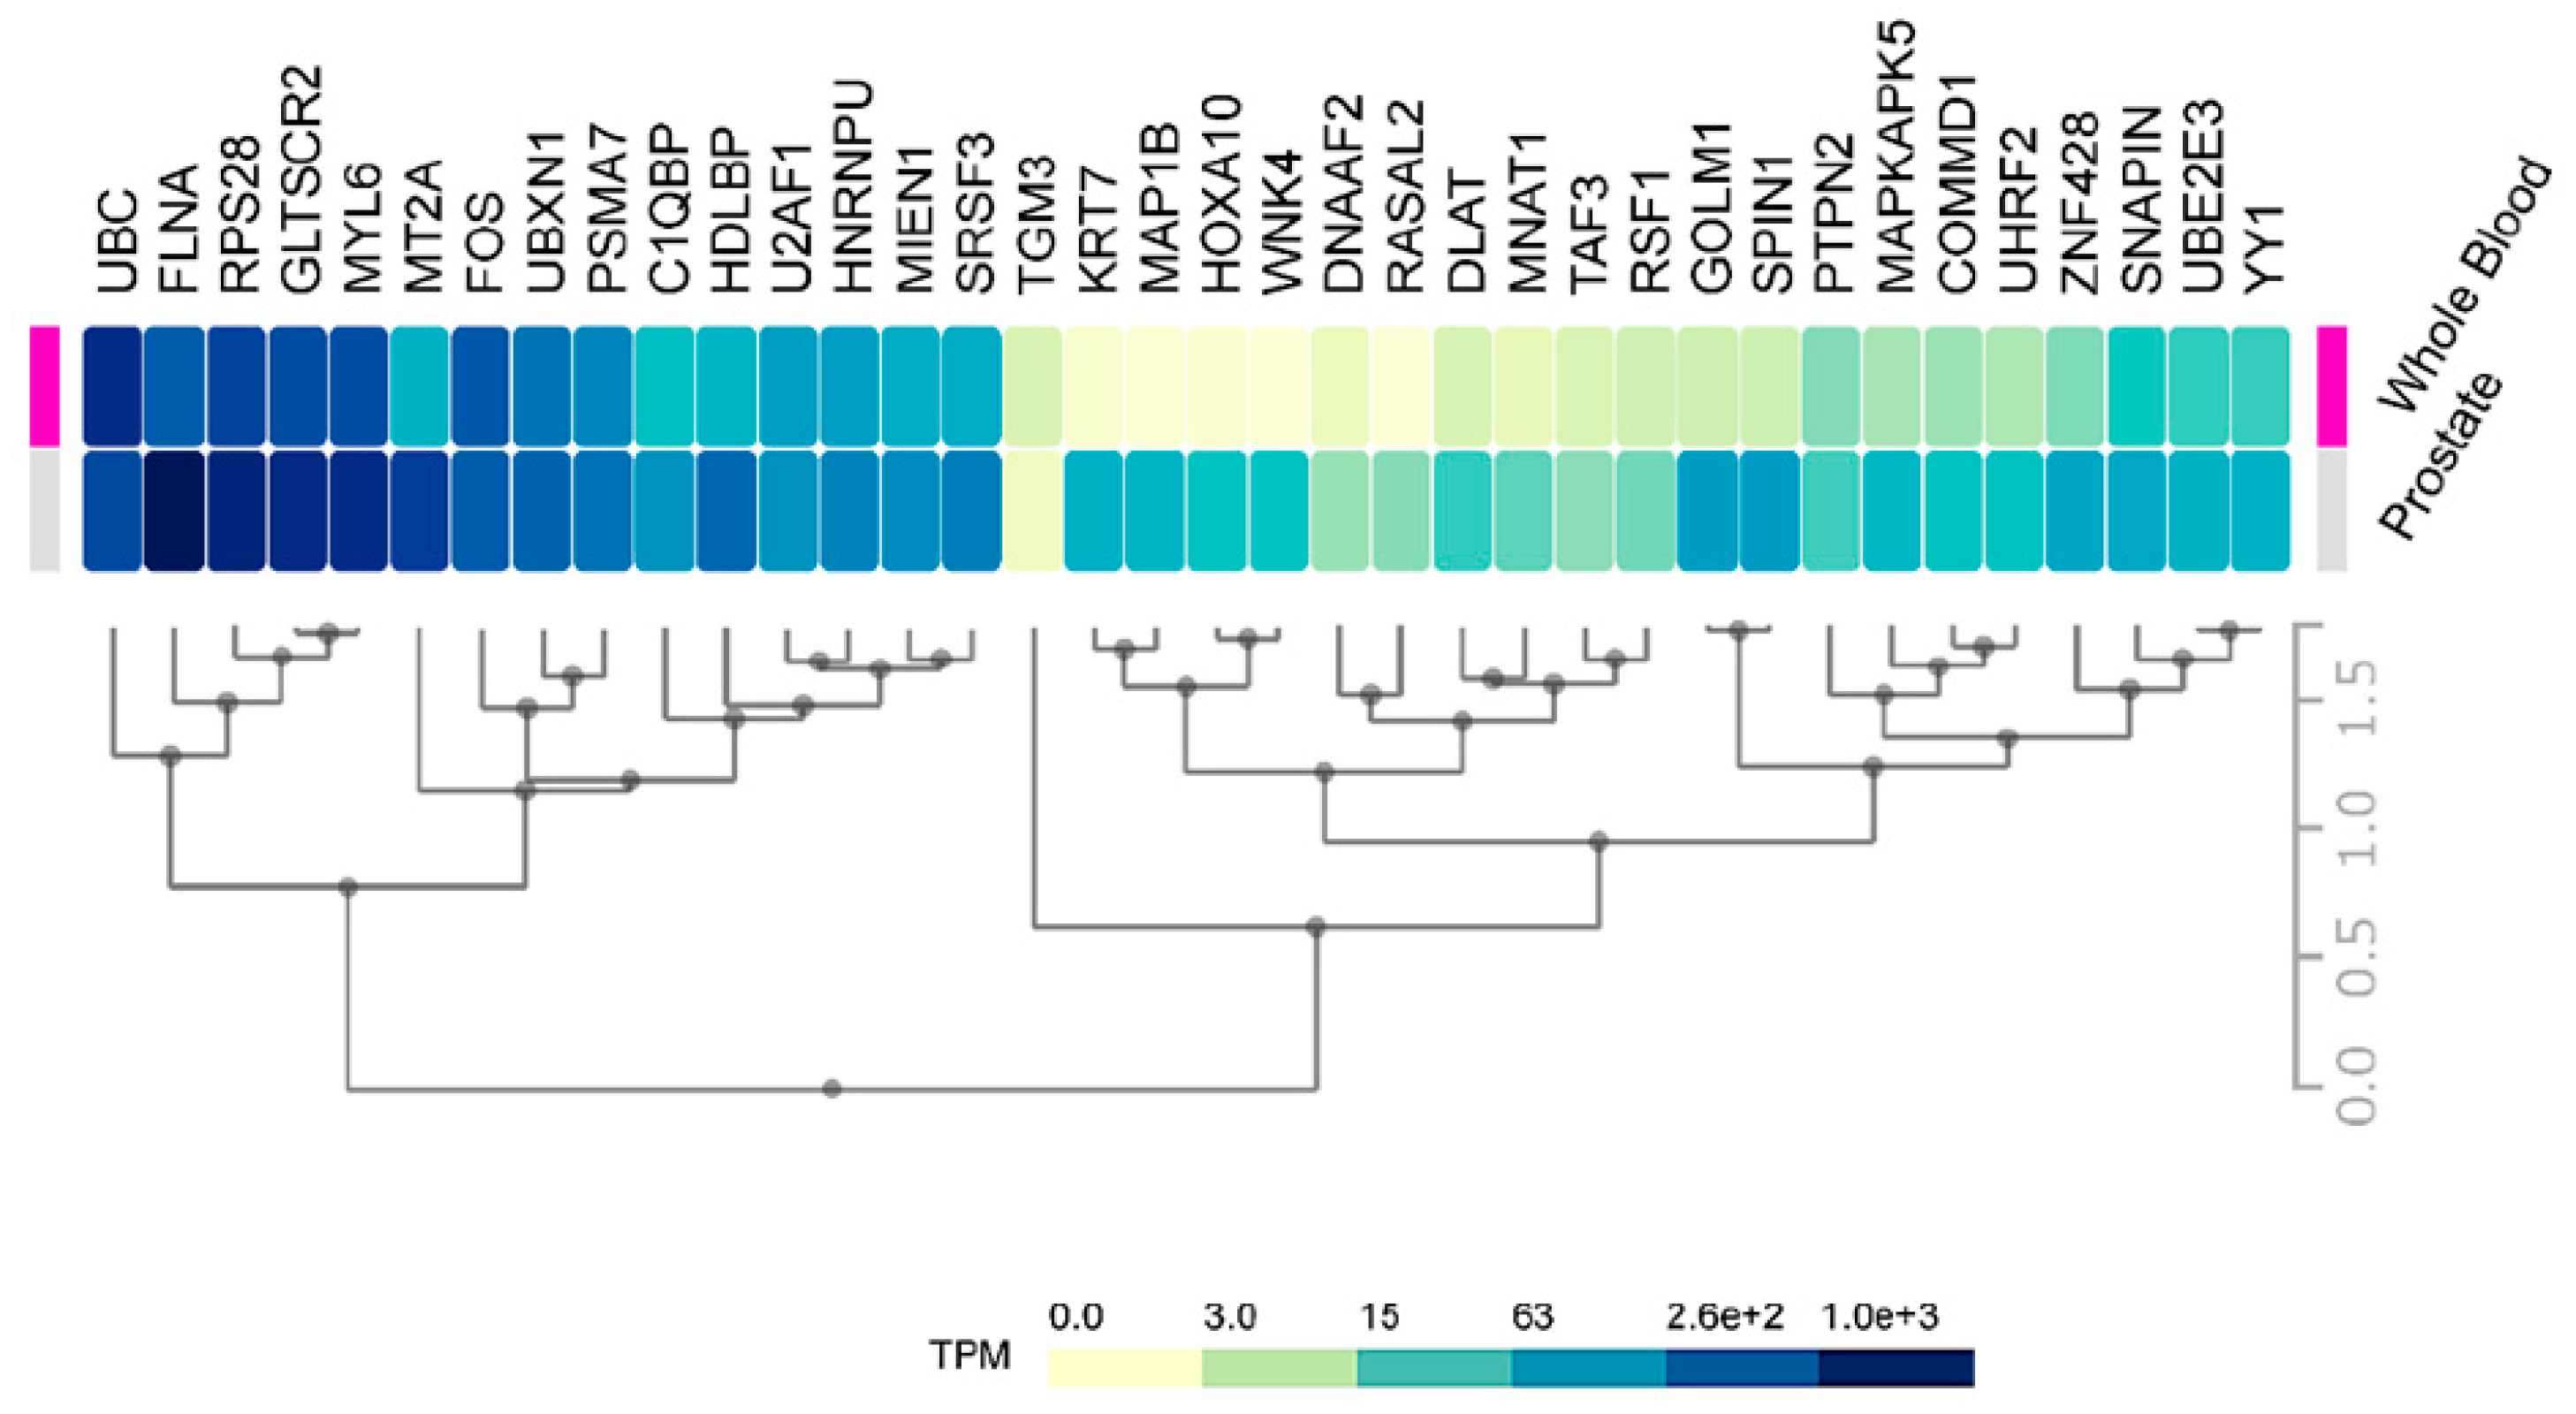
2.3. Expression of HMGB1 and HMGB2 Interactome Targets in PCa
2.4. Silencing of HMGB1 and HMGB2 Reveals Regulation of the Expression of Genes Encoding Their Interactome Targets
3. Discussion
4. Materials and Methods
4.1. Biological Materials
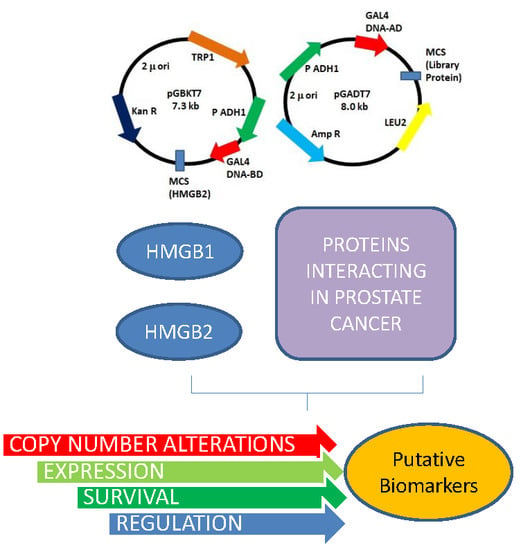
4.2. Yeast Two Hybrid Methodology
4.3. Expression Analysis by Quantitative Polymerase Chain Reaction (RT-qPCR)
4.4. Immunoprecipitation
4.5. Western Blot Analysis
4.6. Immunofluorescence and Confocal Microscopy
4.7. HMGB1 and HMGB2 Silencing by siRNA
4.8. Heat Maps
4.9. Statistical Analysis
5. Conclusions
Supplementary Materials
Author Contributions
Funding
Acknowledgments
Conflicts of Interest
References
- Catena, R.; Escoffier, E.; Caron, C.; Khochbin, S.; Martianov, I.; Davidson, I. HMGB4, a Novel Member of the HMGB Family, is Preferentially Expressed in the Mouse Testis and Localizes to the Basal Pole of Elongating Spermatids. Biol. Reprod. 2009, 80, 358–366. [Google Scholar] [CrossRef] [PubMed]
- Pusterla, T.; de Marchis, F.; Palumbo, R.; Bianchi, M.E. High Mobility Group B2 is Secreted by Myeloid Cells and has Mitogenic and Chemoattractant Activities Similar to High Mobility Group B1. Autoimmunity 2009, 42, 308–310. [Google Scholar] [CrossRef] [PubMed]
- Ugrinova, I.; Pashev, I.G.; Pasheva, E.A. Nucleosome Binding Properties and Co-Remodeling Activities of Native and in Vivo Acetylated HMGB-1 and HMGB-2 Proteins. Biochemistry 2009, 48, 6502–6507. [Google Scholar] [CrossRef] [PubMed]
- Swanson, P.C. Fine Structure and Activity of Discrete RAG-HMG Complexes on V (D)J Recombination Signals. Mol. Cell. Biol. 2002, 22, 1340–1351. [Google Scholar] [CrossRef]
- Bagherpoor, A.J.; Dolezalova, D.; Barta, T.; Kucirek, M.; Sani, S.A.; Esner, M.; Kunova Bosakova, M.; Vinarsky, V.; Peskova, L.; Hampl, A.; et al. Properties of Human Embryonic Stem Cells and their Differentiated Derivatives Depend on Nonhistone DNA-Binding HMGB1 and HMGB2 Proteins. Stem Cells Dev. 2017, 26, 328–340. [Google Scholar] [CrossRef]
- Ke, S.; Zhou, F.; Yang, H.; Wei, Y.; Gong, J.; Mei, Z.; Wu, L.; Yu, H.; Zhou, Y. Downregulation of High Mobility Group Box 1 Modulates Telomere Homeostasis and Increases the Radiosensitivity of Human Breast Cancer Cells. Int. J. Oncol. 2015, 46, 1051–1058. [Google Scholar] [CrossRef]
- Tang, D.; Kang, R.; Zeh, H.J., 3rd; Lotze, M.T. High-Mobility Group Box 1 and Cancer. Biochim. Biophys. Acta 2010, 1799, 131–140. [Google Scholar] [CrossRef]
- Liu, K.; Huang, J.; Xie, M.; Yu, Y.; Zhu, S.; Kang, R.; Cao, L.; Tang, D.; Duan, X. MIR34A Regulates Autophagy and Apoptosis by Targeting HMGB1 in the Retinoblastoma Cell. Autophagy 2014, 10, 442–452. [Google Scholar] [CrossRef]
- Chandrasekaran, K.S.; Sathyanarayanan, A.; Karunagaran, D. Downregulation of HMGB1 by miR-34a is Sufficient to Suppress Proliferation, Migration and Invasion of Human Cervical and Colorectal Cancer Cells. Tumor Biol. 2016, 37, 13155–13166. [Google Scholar] [CrossRef]
- Tang, C.; Yang, Z.; Chen, D.; Xie, Q.; Peng, T.; Wu, J.; Qi, S. Downregulation of miR-130a Promotes Cell Growth and Epithelial to Mesenchymal Transition by Activating HMGB2 in Glioma. Int. J. Biochem. Cell Biol. 2017, 93, 25–31. [Google Scholar] [CrossRef]
- Liu, P.L.; Liu, W.L.; Chang, J.M.; Chen, Y.H.; Liu, Y.P.; Kuo, H.F.; Hsieh, C.C.; Ding, Y.S.; Chen, W.W.; Chong, I.W. MicroRNA-200c Inhibits Epithelial-Mesenchymal Transition, Invasion, and Migration of Lung Cancer by Targeting HMGB1. PLoS ONE 2017, 12, e0180844. [Google Scholar] [CrossRef] [PubMed]
- Zhang, J.; Shao, S.; Han, D.; Xu, Y.; Jiao, D.; Wu, J.; Yang, F.; Ge, Y.; Shi, S.; Li, Y.; et al. High Mobility Group Box 1 Promotes the Epithelial-to-Mesenchymal Transition in Prostate Cancer PC3 Cells Via the RAGE/NF-kappaB Signaling Pathway. Int. J. Oncol. 2018, 53, 659–671. [Google Scholar] [CrossRef] [PubMed]
- van Beijnum, J.R.; Nowak-Sliwinska, P.; van den Boezem, E.; Hautvast, P.; Buurman, W.A.; Griffioen, A.W. Tumor Angiogenesis is Enforced by Autocrine Regulation of High-Mobility Group Box 1. Oncogene 2013, 32, 363–374. [Google Scholar] [CrossRef] [PubMed]
- Wu, Z.B.; Cai, L.; Lin, S.J.; Xiong, Z.K.; Lu, J.L.; Mao, Y.; Yao, Y.; Zhou, L.F. High-Mobility Group Box 2 is Associated with Prognosis of Glioblastoma by Promoting Cell Viability, Invasion, and Chemotherapeutic Resistance. Neuro Oncol. 2013, 15, 1264–1275. [Google Scholar] [CrossRef] [PubMed]
- Wang, W.; Jiang, H.; Zhu, H.; Zhang, H.; Gong, J.; Zhang, L.; Ding, Q. Overexpression of High Mobility Group Box 1 and 2 is Associated with the Progression and Angiogenesis of Human Bladder Carcinoma. Oncol. Lett. 2013, 5, 884–888. [Google Scholar] [CrossRef]
- Tai, S.; Sun, Y.; Squires, J.M.; Zhang, H.; Oh, W.K.; Liang, C.Z.; Huang, J. PC3 is a Cell Line Characteristic of Prostatic Small Cell Carcinoma. Prostate 2011, 71, 1668–1679. [Google Scholar] [CrossRef]
- Elangovan, I.; Thirugnanam, S.; Chen, A.; Zheng, G.; Bosland, M.C.; Kajdacsy-Balla, A.; Gnanasekar, M. Targeting Receptor for Advanced Glycation End Products (RAGE) Expression Induces Apoptosis and Inhibits Prostate Tumor Growth. Biochem. Biophys. Res. Commun. 2012, 417, 1133–1138. [Google Scholar] [CrossRef]
- Li, T.; Gui, Y.; Yuan, T.; Liao, G.; Bian, C.; Jiang, Q.; Huang, S.; Liu, B.; Wu, D. Overexpression of High Mobility Group Box 1 with Poor Prognosis in Patients After Radical Prostatectomy. BJU Int. 2012, 110, E1125–E1130. [Google Scholar] [CrossRef]
- Gnanasekar, M.; Thirugnanam, S.; Ramaswamy, K. Short Hairpin RNA (shRNA) Constructs Targeting High Mobility Group Box-1 (HMGB1) Expression Leads to Inhibition of Prostate Cancer Cell Survival and Apoptosis. Int. J. Oncol. 2009, 34, 425–431. [Google Scholar] [CrossRef]
- Flores-Morales, A.; Iglesias-Gato, D. Quantitative Mass Spectrometry-Based Proteomic Profiling for Precision Medicine in Prostate Cancer. Front. Oncol. 2017, 7, e267. [Google Scholar] [CrossRef]
- Muller, A.K.; Foll, M.; Heckelmann, B.; Kiefer, S.; Werner, M.; Schilling, O.; Biniossek, M.L.; Jilg, C.A.; Drendel, V. Proteomic Characterization of Prostate Cancer to Distinguish Nonmetastasizing and Metastasizing Primary Tumors and Lymph Node Metastases. Neoplasia 2018, 20, 140–151. [Google Scholar] [CrossRef] [PubMed]
- Zhang, Y.; Wang, D.; Li, M.; Wei, X.; Liu, S.; Zhao, M.; Liu, C.; Wang, X.; Jiang, X.; Li, X.; et al. Quantitative Proteomics of TRAMP Mice Combined with Bioinformatics Analysis Reveals that PDGF-B Regulatory Network Plays a Key Role in Prostate Cancer Progression. J. Proteome Res. 2018, 17, 2401–2411. [Google Scholar] [CrossRef] [PubMed]
- Stelloo, S.; Nevedomskaya, E.; Kim, Y.; Hoekman, L.; Bleijerveld, O.B.; Mirza, T.; Wessels, L.F.A.; van Weerden, W.M.; Altelaar, A.F.M.; Bergman, A.M.; et al. Endogenous Androgen Receptor Proteomic Profiling Reveals Genomic Subcomplex Involved in Prostate Tumorigenesis. Oncogene 2018, 37, 313–322. [Google Scholar] [CrossRef] [PubMed]
- Berger, A.; Brady, N.J.; Bareja, R.; Robinson, B.D.; Conteduca, V.; Augello, M.A.; Puca, L.; Ahmed, A.; Dardenne, E.; Lu, X.; et al. N-Myc-Mediated Epigenetic Reprogramming Drives Lineage Plasticity in Advanced Prostate Cancer. J. Clin. Investig. 2019, 130, 3924–3940. [Google Scholar] [CrossRef]
- Zhang, Z.; Chng, K.R.; Lingadahalli, S.; Chen, Z.; Liu, M.H.; Do, H.H.; Cai, S.; Rinaldi, N.; Poh, H.M.; Li, G.; et al. An AR-ERG Transcriptional Signature Defined by Long-Range Chromatin Interactomes in Prostate Cancer Cells. Genome Res. 2019, 29, 223–235. [Google Scholar] [CrossRef]
- Barreiro-Alonso, A.; Lamas-Maceiras, M.; García-Díaz, R.; Rodríguez-Belmonte, E.; Yu, L.; Pardo, M.; Choudhary, J.S.; Cerdán, M.E. Delineating the HMGB1 and HMGB2 interactome in prostate and ovary epithelial cells and its relationship with cancer. Oncotarget 2018, 9, 19050–19064. [Google Scholar] [CrossRef]
- Chen, R.; Xiao, M.; Gao, H.; Chen, Y.; Li, Y.; Liu, Y.; Zhang, N. Identification of a Novel Mitochondrial Interacting Protein of C1QBP using Subcellular Fractionation Coupled with CoIP-MS. Anal. Bioanal. Chem. 2016, 408, 1557–1564. [Google Scholar] [CrossRef]
- Li, C.; He, C.; Xu, Y.; Xu, H.; Tang, Y.; Chavan, H.; Duan, S.; Artigues, A.; Forrest, M.L.; Krishnamurthy, P.; et al. Alternol Eliminates Excessive ATP Production by Disturbing Krebs Cycle in Prostate Cancer. Prostate 2019, 79, 628–639. [Google Scholar] [CrossRef]
- Omran, H.; Kobayashi, D.; Olbrich, H.; Tsukahara, T.; Loges, N.T.; Hagiwara, H.; Zhang, Q.; Leblond, G.; O’Toole, E.; Hara, C.; et al. Ktu/PF13 is Required for Cytoplasmic Pre-Assembly of Axonemal Dyneins. Nature 2008, 456, 611–616. [Google Scholar] [CrossRef]
- Massafra, V.; Milona, A.; Vos, H.R.; Burgering, B.M.; van Mil, S.W. Quantitative Liver Proteomics Identifies FGF19 Targets that Couple Metabolism and Proliferation. PLoS ONE 2017, 12, e0171185. [Google Scholar] [CrossRef]
- Li, B.; Cao, X.; Weng, C.; Wu, Y.; Fang, X.; Zhang, X.; Liu, G. HoxA10 Induces Proliferation in Human Prostate Carcinoma PC-3 Cell Line. Cell Biochem. Biophys. 2014, 70, 1363–1368. [Google Scholar] [CrossRef] [PubMed]
- Hatanaka, Y.; de Velasco, M.A.; Oki, T.; Shimizu, N.; Nozawa, M.; Yoshimura, K.; Yoshikawa, K.; Nishio, K.; Uemura, H. HOXA10 Expression Profiling in Prostate Cancer. Prostate 2019, 79, 554–563. [Google Scholar] [CrossRef] [PubMed]
- Thomas, B.C.; Kay, J.D.; Menon, S.; Vowler, S.L.; Dawson, S.N.; Bucklow, L.J.; Luxton, H.J.; Johnston, T.; Massie, C.E.; Pugh, M.; et al. Whole Blood mRNA in Prostate Cancer Reveals a Four-Gene Androgen Regulated Panel. Endocr. Relat. Cancer 2016, 23, 797–812. [Google Scholar] [CrossRef] [PubMed]
- Zhou, S.; Lu, J.; Li, Y.; Chen, C.; Cai, Y.; Tan, G.; Peng, Z.; Zhang, Z.; Dong, Z.; Kang, T.; et al. MNAT1 is Overexpressed in Colorectal Cancer and Mediates p53 Ubiquitin-Degradation to Promote Colorectal Cancer Malignance. J. Exp. Clin. Cancer Res. 2018, 37, e284. [Google Scholar] [CrossRef]
- Wang, W.; Chen, Z.; Mao, Z.; Zhang, H.; Ding, X.; Chen, S.; Zhang, X.; Xu, R.; Zhu, B. Nucleolar Protein Spindlin1 Recognizes H3K4 Methylation and Stimulates the Expression of rRNA Genes. EMBO Rep. 2011, 12, 1160–1166. [Google Scholar] [CrossRef]
- Plafker, K.S.; Plafker, S.M. The Ubiquitin-Conjugating Enzyme UBE2E3 and its Import Receptor Importin-11 Regulate the Localization and Activity of the Antioxidant Transcription Factor NRF2. Mol. Biol. Cell 2015, 26, 327–338. [Google Scholar] [CrossRef]
- Huang, K.; Yang, C.; Wang, Q.X.; Li, Y.S.; Fang, C.; Tan, Y.L.; Wei, J.W.; Wang, Y.F.; Li, X.; Zhou, J.H.; et al. The CRISPR/Cas9 System Targeting EGFR Exon 17 Abrogates NF-kappaB Activation Via Epigenetic Modulation of UBXN1 in EGFRwt/vIII Glioma Cells. Cancer Lett. 2017, 388, 269–280. [Google Scholar] [CrossRef]
- Lu, H.; Hallstrom, T.C. The Nuclear Protein UHRF2 is a Direct Target of the Transcription Factor E2F1 in the Induction of Apoptosis. J. Biol. Chem. 2013, 288, 23833–23843. [Google Scholar] [CrossRef]
- McGee, A.M.; Douglas, D.L.; Liang, Y.; Hyder, S.M.; Baines, C.P. The Mitochondrial Protein C1qbp Promotes Cell Proliferation, Migration and Resistance to Cell Death. Cell Cycle 2011, 10, 4119–4127. [Google Scholar] [CrossRef]
- Amamoto, R.; Yagi, M.; Song, Y.; Oda, Y.; Tsuneyoshi, M.; Naito, S.; Yokomizo, A.; Kuroiwa, K.; Tokunaga, S.; Kato, S.; et al. Mitochondrial p32/C1QBP is Highly Expressed in Prostate Cancer and is Associated with Shorter Prostate-Specific Antigen Relapse Time After Radical Prostatectomy. Cancer Sci. 2011, 102, 639–647. [Google Scholar] [CrossRef]
- Quintero, I.B.; Herrala, A.M.; Araujo, C.L.; Pulkka, A.E.; Hautaniemi, S.; Ovaska, K.; Pryazhnikov, E.; Kulesskiy, E.; Ruuth, M.K.; Soini, Y.; et al. Transmembrane Prostatic Acid Phosphatase (TMPAP) Interacts with Snapin and Deficient Mice Develop Prostate Adenocarcinoma. PLoS ONE 2013, 8, e73072. [Google Scholar] [CrossRef] [PubMed]
- Fei, D.L.; Motowski, H.; Chatrikhi, R.; Prasad, S.; Yu, J.; Gao, S.; Kielkopf, C.L.; Bradley, R.K.; Varmus, H. Wild-Type U2AF1 Antagonizes the Splicing Program Characteristic of U2AF1-Mutant Tumors and is Required for Cell Survival. PLoS Genet. 2016, 12, e1006384. [Google Scholar] [CrossRef] [PubMed]
- Daures, M.; Idrissou, M.; Judes, G.; Rifai, K.; Penault-Llorca, F.; Bignon, Y.J.; Guy, L.; Bernard-Gallon, D. A New Metabolic Gene Signature in Prostate Cancer Regulated by JMJD3 and EZH2. Oncotarget 2018, 9, 23413–23425. [Google Scholar] [CrossRef] [PubMed]
- Shankar, E.; Song, K.; Corum, S.L.; Bane, K.L.; Wang, H.; Kao, H.Y.; Danielpour, D. A Signaling Network Controlling Androgenic Repression of c-Fos Protein in Prostate Adenocarcinoma Cells. J. Biol. Chem. 2016, 291, 5512–5526. [Google Scholar] [CrossRef]
- Yan, G.; Ru, Y.; Wu, K.; Yan, F.; Wang, Q.; Wang, J.; Pan, T.; Zhang, M.; Han, H.; Li, X.; et al. GOLM1 Promotes Prostate Cancer Progression through Activating PI3K-AKT-mTOR Signaling. Prostate 2018, 78, 166–177. [Google Scholar] [CrossRef]
- Zhang, L.; Song, D.; Zhu, B.; Wang, X. The Role of Nuclear Matrix Protein HNRNPU in Maintaining the Architecture of 3D Genome. Semin. Cell Dev. Biol. 2019, 90, 161–167. [Google Scholar] [CrossRef]
- Lee, S.Y.; Kim, J.W.; Jeong, M.H.; An, J.H.; Jang, S.M.; Song, K.H.; Choi, K.H. Microtubule-Associated Protein 1B Light Chain (MAP1B-LC1) Negatively Regulates the Activity of Tumor Suppressor p53 in Neuroblastoma Cells. FEBS Lett. 2008, 582, 2826–2832. [Google Scholar] [CrossRef]
- Zheng, M.; Wang, Y.H.; Wu, X.N.; Wu, S.Q.; Lu, B.J.; Dong, M.Q.; Zhang, H.; Sun, P.; Lin, S.C.; Guan, K.L.; et al. Inactivation of Rheb by PRAK-Mediated Phosphorylation is Essential for Energy-Depletion-Induced Suppression of mTORC1. Nat. Cell Biol. 2011, 13, 263–272. [Google Scholar] [CrossRef]
- Dwyer, S.F.; Gelman, I.H. Cross-Phosphorylation and Interaction between Src/FAK and MAPKAP5/PRAK in Early Focal Adhesions Controls Cell Motility. J. Cancer Biol. Res. 2014, 2, e1045. [Google Scholar]
- Dasgupta, S.; Wasson, L.M.; Rauniyar, N.; Prokai, L.; Borejdo, J.; Vishwanatha, J.K. Novel Gene C17orf37 in 17q12 Amplicon Promotes Migration and Invasion of Prostate Cancer Cells. Oncogene 2009, 28, 2860–2872. [Google Scholar] [CrossRef]
- Chen, S.H.; Chen, L.; Russell, D.H. Metal-Induced Conformational Changes of Human Metallothionein-2A: A Combined Theoretical and Experimental Study of Metal-Free and Partially Metalated Intermediates. J. Am. Chem. Soc. 2014, 136, 9499–9508. [Google Scholar] [CrossRef] [PubMed]
- Yamasaki, M.; Nomura, T.; Sato, F.; Mimata, H. Metallothionein is Up-Regulated Under Hypoxia and Promotes the Survival of Human Prostate Cancer Cells. Oncol. Rep. 2007, 18, 1145–1153. [Google Scholar] [PubMed]
- Lin, H.K.; Altuwaijri, S.; Lin, W.J.; Kan, P.Y.; Collins, L.L.; Chang, C. Proteasome Activity is Required for Androgen Receptor Transcriptional Activity Via Regulation of Androgen Receptor Nuclear Translocation and Interaction with Coregulators in Prostate Cancer Cells. J. Biol. Chem. 2002, 277, 36570–36576. [Google Scholar] [CrossRef] [PubMed]
- Cho, S.; Choi, Y.J.; Kim, J.M.; Jeong, S.T.; Kim, J.H.; Kim, S.H.; Ryu, S.E. Binding and Regulation of HIF-1alpha by a Subunit of the Proteasome Complex, PSMA7. FEBS Lett. 2001, 498, 62–66. [Google Scholar] [CrossRef]
- Romanuik, T.L.; Ueda, T.; Le, N.; Haile, S.; Yong, T.M.; Thomson, T.; Vessella, R.L.; Sadar, M.D. Novel Biomarkers for Prostate Cancer Including Noncoding Transcripts. Am. J. Pathol. 2009, 175, 2264–2276. [Google Scholar] [CrossRef]
- Kim, M.; Morales, L.D.; Jang, I.S.; Cho, Y.Y.; Kim, D.J. Protein Tyrosine Phosphatases as Potential Regulators of STAT3 Signaling. Int. J. Mol. Sci. 2018, 19, 2708. [Google Scholar] [CrossRef]
- Hui, K.; Gao, Y.; Huang, J.; Xu, S.; Wang, B.; Zeng, J.; Fan, J.; Wang, X.; Yue, Y.; Wu, S.; et al. RASAL2, a RAS GTPase-Activating Protein, Inhibits Stemness and Epithelial-Mesenchymal Transition Via MAPK/SOX2 Pathway in Bladder Cancer. Cell Death Dis. 2017, 8, e2600. [Google Scholar] [CrossRef] [PubMed]
- Min, S.; Kim, K.; Kim, S.G.; Cho, H.; Lee, Y. Chromatin-Remodeling Factor, RSF1, Controls p53-Mediated Transcription in Apoptosis upon DNA Strand Breaks. Cell Death Dis. 2018, 9, e1079. [Google Scholar] [CrossRef]
- Li, H.; Zhang, Y.; Zhang, Y.; Bai, X.; Peng, Y.; He, P. Rsf-1 Overexpression in Human Prostate Cancer, Implication as a Prognostic Marker. Tumor Biol. 2014, 35, 5771–5776. [Google Scholar] [CrossRef] [PubMed]
- Jia, R.; Ajiro, M.; Yu, L.; McCoy, P., Jr.; Zheng, Z.M. Oncogenic Splicing Factor SRSF3 Regulates ILF3 Alternative Splicing to Promote Cancer Cell Proliferation and Transformation. RNA 2019, 25, 630–644. [Google Scholar] [CrossRef] [PubMed]
- Bowler, E.; Porazinski, S.; Uzor, S.; Thibault, P.; Durand, M.; Lapointe, E.; Rouschop, K.M.A.; Hancock, J.; Wilson, I.; Ladomery, M. Hypoxia Leads to Significant Changes in Alternative Splicing and Elevated Expression of CLK Splice Factor Kinases in PC3 Prostate Cancer Cells. BMC Cancer 2018, 18, e355. [Google Scholar] [CrossRef] [PubMed]
- Bereczki, O.; Ujfaludi, Z.; Pardi, N.; Nagy, Z.; Tora, L.; Boros, I.M.; Balint, E. TATA Binding Protein Associated Factor 3 (TAF3) Interacts with p53 and Inhibits its Function. BMC Mol. Biol. 2008, 9, e57. [Google Scholar] [CrossRef] [PubMed]
- Fesus, L.; Thomazy, V.; Falus, A. Induction and Activation of Tissue Transglutaminase during Programmed Cell Death. FEBS Lett. 1987, 224, 104–108. [Google Scholar] [CrossRef]
- Moniz, S.; Jordan, P. Emerging Roles for WNK Kinases in Cancer. Cell. Mol. Life Sci. 2010, 67, 1265–1276. [Google Scholar] [CrossRef] [PubMed]
- Seligson, D.; Horvath, S.; Huerta-Yepez, S.; Hanna, S.; Garban, H.; Roberts, A.; Shi, T.; Liu, X.; Chia, D.; Goodglick, L.; et al. Expression of Transcription Factor Yin Yang 1 in Prostate Cancer. Int. J. Oncol. 2005, 27, 131–141. [Google Scholar] [CrossRef]
- Kashyap, V.; Bonavida, B. Role of YY1 in the Pathogenesis of Prostate Cancer and Correlation with Bioinformatic Data Sets of Gene Expression. Genes Cancer 2014, 5, 71–83. [Google Scholar] [PubMed]
- Park, A.; Lee, J.; Mun, S.; Kim, D.J.; Cha, B.H.; Moon, K.T.; Yoo, T.K.; Kang, H.G. Identification of Transcription Factor YY1 as a Regulator of a Prostate Cancer-Specific Pathway using Proteomic Analysis. J. Cancer 2017, 8, 2303–2311. [Google Scholar] [CrossRef] [PubMed]
- Huang, Y.; Tao, T.; Liu, C.; Guan, H.; Zhang, G.; Ling, Z.; Zhang, L.; Lu, K.; Chen, S.; Xu, B.; et al. Upregulation of miR-146a by YY1 Depletion Correlates with Delayed Progression of Prostate Cancer. Int. J. Oncol. 2017, 50, 421–431. [Google Scholar] [CrossRef]
- Yang, T.; An, Z.; Zhang, C.; Wang, Z.; Wang, X.; Liu, Y.; Du, E.; Liu, R.; Zhang, Z.; Xu, Y. HnRNPM, a Potential Mediator of YY1 in Promoting the Epithelial-Mesenchymal Transition of Prostate Cancer Cells. Prostate 2019, 79, 1199–1210. [Google Scholar] [CrossRef]
- Camacho-Moctezuma, B.; Quevedo-Castillo, M.; Melendez-Zajgla, J.; Aquino-Jarquin, G.; Martinez-Ruiz, G.U. YY1 Negatively Regulates the XAF1 Gene Expression in Prostate Cancer. Biochem. Biophys. Res. Commun. 2019, 508, 973–979. [Google Scholar] [CrossRef]
- Riera-Romo, M. COMMD1: A Multifunctional Regulatory Protein. J. Cell. Biochem. 2018, 119, 34–51. [Google Scholar] [CrossRef] [PubMed]
- Zoubeidi, A.; Ettinger, S.; Beraldi, E.; Hadaschik, B.; Zardan, A.; Klomp, L.W.; Nelson, C.C.; Rennie, P.S.; Gleave, M.E. Clusterin Facilitates COMMD1 and I-kappaB Degradation to Enhance NF-kappaB Activity in Prostate Cancer Cells. Mol. Cancer. Res. 2010, 8, 119–130. [Google Scholar] [CrossRef] [PubMed]
- Loy, C.J.; Sim, K.S.; Yong, E.L. Filamin-A Fragment Localizes to the Nucleus to Regulate Androgen Receptor and Coactivator Functions. Proc. Natl. Acad. Sci. USA 2003, 100, 4562–4567. [Google Scholar] [CrossRef] [PubMed]
- Ravipaty, S.; Wu, W.; Dalvi, A.; Tanna, N.; Andreazi, J.; Friss, T.; Klotz, A.; Liao, C.; Garren, J.; Schofield, S.; et al. Clinical Validation of a Serum Protein Panel (FLNA, FLNB and KRT19) for Diagnosis of Prostate Cancer. J. Mol. Biomark. Diagn. 2017, 8. [Google Scholar] [CrossRef] [PubMed]
- Yeh, D.W.; Chen, Y.S.; Lai, C.Y.; Liu, Y.L.; Lu, C.H.; Lo, J.F.; Chen, L.; Hsu, L.C.; Luo, Y.; Xiang, R.; et al. Downregulation of COMMD1 by miR-205 Promotes a Positive Feedback Loop for Amplifying Inflammatory- and Stemness-Associated Properties of Cancer Cells. Cell Death Differ. 2016, 23, 841–852. [Google Scholar] [CrossRef]
- Park, I.; Han, C.; Jin, S.; Lee, B.; Choi, H.; Kwon, J.T.; Kim, D.; Kim, J.; Lifirsu, E.; Park, W.J.; et al. Myosin Regulatory Light Chains are Required to Maintain the Stability of Myosin II and Cellular Integrity. Biochem. J. 2011, 434, 171–180. [Google Scholar] [CrossRef]
- Lee, S.; Kim, J.Y.; Kim, Y.J.; Seok, K.O.; Kim, J.H.; Chang, Y.J.; Kang, H.Y.; Park, J.H. Nucleolar Protein GLTSCR2 Stabilizes p53 in Response to Ribosomal Stresses. Cell Death Differ. 2012, 19, 1613–1622. [Google Scholar] [CrossRef]
- Kim, H.K.; Fuchs, G.; Wang, S.; Wei, W.; Zhang, Y.; Park, H.; Roy-Chaudhuri, B.; Li, P.; Xu, J.; Chu, K.; et al. A Transfer-RNA-Derived Small RNA Regulates Ribosome Biogenesis. Nature 2017, 552, 57–62. [Google Scholar] [CrossRef]
- Cerami, E.; Gao, J.; Dogrusoz, U.; Gross, B.E.; Sumer, S.O.; Aksoy, B.A.; Jacobsen, A.; Byrne, C.J.; Heuer, M.L.; Larsson, E.; et al. The cBio Cancer Genomics Portal: An Open Platform for Exploring Multidimensional Cancer Genomics Data. Cancer Discov. 2012, 2, 401–404. [Google Scholar] [CrossRef] [PubMed]
- Gao, J.; Aksoy, B.A.; Dogrusoz, U.; Dresdner, G.; Gross, B.; Sumer, S.O.; Sun, Y.; Jacobsen, A.; Sinha, R.; Larsson, E.; et al. Integrative Analysis of Complex Cancer Genomics and Clinical Profiles using the cBioPortal. Sci. Signal. 2013, 6, pl1. [Google Scholar] [CrossRef]
- Baca, S.C.; Prandi, D.; Lawrence, M.S.; Mosquera, J.M.; Romanel, A.; Drier, Y.; Park, K.; Kitabayashi, N.; MacDonald, T.Y.; Ghandi, M.; et al. Punctuated Evolution of Prostate Cancer Genomes. Cell 2013, 153, 666–677. [Google Scholar] [CrossRef]
- Barbieri, C.E.; Baca, S.C.; Lawrence, M.S.; Demichelis, F.; Blattner, M.; Theurillat, J.P.; White, T.A.; Stojanov, P.; Van Allen, E.; Stransky, N.; et al. Exome Sequencing Identifies Recurrent SPOP, FOXA1 and MED12 Mutations in Prostate Cancer. Nat. Genet. 2012, 44, 685–689. [Google Scholar] [CrossRef] [PubMed]
- Fraser, M.; Sabelnykova, V.Y.; Yamaguchi, T.N.; Heisler, L.E.; Livingstone, J.; Huang, V.; Shiah, Y.J.; Yousif, F.; Lin, X.; Masella, A.P.; et al. Genomic Hallmarks of Localized, Non-Indolent Prostate Cancer. Nature 2017, 541, 359–364. [Google Scholar] [CrossRef] [PubMed]
- Leyh-Bannurah, S.R.; Gazdovich, S.; Budaus, L.; Zaffuto, E.; Briganti, A.; Abdollah, F.; Montorsi, F.; Schiffmann, J.; Menon, M.; Shariat, S.F.; et al. Local Therapy Improves Survival in Metastatic Prostate Cancer. Eur. Urol. 2017, 72, 118–124. [Google Scholar] [CrossRef] [PubMed]
- Kumar, A.; Coleman, I.; Morrissey, C.; Zhang, X.; True, L.D.; Gulati, R.; Etzioni, R.; Bolouri, H.; Montgomery, B.; White, T.; et al. Substantial Interindividual and Limited Intraindividual Genomic Diversity among Tumors from Men with Metastatic Prostate Cancer. Nat. Med. 2016, 22, 369–378. [Google Scholar] [CrossRef] [PubMed]
- Taylor, B.S.; Schultz, N.; Hieronymus, H.; Gopalan, A.; Xiao, Y.; Carver, B.S.; Arora, V.K.; Kaushik, P.; Cerami, E.; Reva, B.; et al. Integrative Genomic Profiling of Human Prostate Cancer. Cancer Cell 2010, 18, 11–22. [Google Scholar] [CrossRef] [PubMed]
- Armenia, J.; Wankowicz, S.A.M.; Liu, D.; Gao, J.; Kundra, R.; Reznik, E.; Chatila, W.K.; Chakravarty, D.; Han, G.C.; Coleman, I.; et al. The Long Tail of Oncogenic Drivers in Prostate Cancer. Nat. Genet. 2018, 50, 645–651. [Google Scholar] [CrossRef]
- Rosario, S.R.; Long, M.D.; Affronti, H.C.; Rowsam, A.M.; Eng, K.H.; Smiraglia, D.J. Pan-Cancer Analysis of Transcriptional Metabolic Dysregulation using the Cancer Genome Atlas. Nat. Commun. 2018, 9, e5330. [Google Scholar] [CrossRef]
- Hieronymus, H.; Schultz, N.; Gopalan, A.; Carver, B.S.; Chang, M.T.; Xiao, Y.; Heguy, A.; Huberman, K.; Bernstein, M.; Assel, M.; et al. Copy Number Alteration Burden Predicts Prostate Cancer Relapse. Proc. Natl. Acad. Sci. USA 2014, 111, 11139–11144. [Google Scholar] [CrossRef]
- Gao, D.; Vela, I.; Sboner, A.; Iaquinta, P.J.; Karthaus, W.R.; Gopalan, A.; Dowling, C.; Wanjala, J.N.; Undvall, E.A.; Arora, V.K.; et al. Organoid Cultures Derived from Patients with Advanced Prostate Cancer. Cell 2014, 159, 176–187. [Google Scholar] [CrossRef]
- Abida, W.; Armenia, J.; Gopalan, A.; Brennan, R.; Walsh, M.; Barron, D.; Danila, D.; Rathkopf, D.; Morris, M.; Slovin, S.; et al. Prospective Genomic Profiling of Prostate Cancer Across Disease States Reveals Germline and Somatic Alterations that may Affect Clinical Decision Making. JCO Precis. Oncol. 2017. [Google Scholar] [CrossRef] [PubMed]
- Grasso, C.S.; Wu, Y.M.; Robinson, D.R.; Cao, X.; Dhanasekaran, S.M.; Khan, A.P.; Quist, M.J.; Jing, X.; Lonigro, R.J.; Brenner, J.C.; et al. The Mutational Landscape of Lethal Castration-Resistant Prostate Cancer. Nature 2012, 487, 239–243. [Google Scholar] [CrossRef] [PubMed]
- Abida, W.; Cyrta, J.; Heller, G.; Prandi, D.; Armenia, J.; Coleman, I.; Cieslik, M.; Benelli, M.; Robinson, D.; Van Allen, E.M.; et al. Genomic Correlates of Clinical Outcome in Advanced Prostate Cancer. Proc. Natl. Acad. Sci. USA 2019, 116, 11428–11436. [Google Scholar] [CrossRef] [PubMed]
- Robinson, D.; Van Allen, E.M.; Wu, Y.M.; Schultz, N.; Lonigro, R.J.; Mosquera, J.M.; Montgomery, B.; Taplin, M.E.; Pritchard, C.C.; Attard, G.; et al. Integrative Clinical Genomics of Advanced Prostate Cancer. Cell 2015, 161, 1215–1228. [Google Scholar] [CrossRef] [PubMed]
- Beltran, H.; Prandi, D.; Mosquera, J.M.; Benelli, M.; Puca, L.; Cyrta, J.; Marotz, C.; Giannopoulou, E.; Chakravarthi, B.V.; Varambally, S.; et al. Divergent Clonal Evolution of Castration-Resistant Neuroendocrine Prostate Cancer. Nat. Med. 2016, 22, 298–305. [Google Scholar] [CrossRef] [PubMed]
- Liu, R.; Zhou, Z.; Huang, J.; Chen, C. PMEPA1 Promotes Androgen Receptor-Negative Prostate Cell Proliferation through Suppressing the Smad3/4-c-Myc-p21 Cip1 Signaling Pathway. J. Pathol. 2011, 223, 683–694. [Google Scholar] [CrossRef]
- Zhao, C.B.; Bao, J.M.; Lu, Y.J.; Zhao, T.; Zhou, X.H.; Zheng, D.Y.; Zhao, S.C. Co-Expression of RAGE and HMGB1 is Associated with Cancer Progression and Poor Patient Outcome of Prostate Cancer. Am. J. Cancer Res. 2014, 4, 369–377. [Google Scholar] [CrossRef][Green Version]
- Bull, J.H.; Ellison, G.; Patel, A.; Muir, G.; Walker, M.; Underwood, M.; Khan, F.; Paskins, L. Identification of Potential Diagnostic Markers of Prostate Cancer and Prostatic Intraepithelial Neoplasia using cDNA Microarray. Br. J. Cancer 2001, 84, 1512–1519. [Google Scholar] [CrossRef]
- Iglesias-Gato, D.; Wikstrom, P.; Tyanova, S.; Lavallee, C.; Thysell, E.; Carlsson, J.; Hagglof, C.; Cox, J.; Andren, O.; Stattin, P.; et al. The Proteome of Primary Prostate Cancer. Eur. Urol. 2016, 69, 942–952. [Google Scholar] [CrossRef]
- Rajan, P.; Sudbery, I.M.; Villasevil, M.E.; Mui, E.; Fleming, J.; Davis, M.; Ahmad, I.; Edwards, J.; Sansom, O.J.; Sims, D.; et al. Next-Generation Sequencing of Advanced Prostate Cancer Treated with Androgen-Deprivation Therapy. Eur. Urol. 2014, 66, 32–39. [Google Scholar] [CrossRef]
- Kim, J.Y.; Cho, Y.E.; Kim, G.Y.; Lee, H.L.; Lee, S.; Park, J.H. Down-Regulation and Aberrant Cytoplasmic Expression of GLTSCR2 in Prostatic Adenocarcinomas. Cancer Lett. 2013, 340, 134–140. [Google Scholar] [CrossRef] [PubMed]
- Deng, Z.; Cao, P.; Wan, M.M.; Sui, G. Yin Yang 1: A Multifaceted Protein Beyond a Transcription Factor. Transcription 2010, 1, 81–84. [Google Scholar] [CrossRef] [PubMed]
- Long, Z.; Li, Y.; Gan, Y.; Zhao, D.; Wang, G.; Xie, N.; Lovnicki, J.M.; Fazli, L.; Cao, Q.; Chen, K.; et al. Roles of the HOXA10 Gene during Castrate-Resistant Prostate Cancer Progression. Endocr. Relat. Cancer 2019, 26, 279–292. [Google Scholar] [CrossRef] [PubMed]
- GTEx Consortium. The Genotype-Tissue Expression (GTEx) Project. Nat. Genet. 2013, 45, 580–585. [Google Scholar] [CrossRef] [PubMed]
- Petryszak, R.; Keays, M.; Tang, Y.A.; Fonseca, N.A.; Barrera, E.; Burdett, T.; Fullgrabe, A.; Fuentes, A.M.; Jupp, S.; Koskinen, S.; et al. Expression Atlas Update, an Integrated Database of Gene and Protein Expression in Humans, Animals and Plants. Nucleic Acids Res. 2016, 44, D746–D752. [Google Scholar] [CrossRef] [PubMed]
- Kaighn, M.E.; Narayan, K.S.; Ohnuki, Y.; Lechner, J.F.; Jones, L.W. Establishment and Characterization of a Human Prostatic Carcinoma Cell Line (PC-3). Investig. Urol. 1979, 17, 16–23. [Google Scholar]
- Livak, K.J.; Schmittgen, T.D. Analysis of Relative Gene Expression Data using Real-Time Quantitative PCR and the 2(-Delta Delta C (T)) Method. Methods 2001, 25, 402–408. [Google Scholar] [CrossRef]
- Babicki, S.; Arndt, D.; Marcu, A.; Liang, Y.; Grant, J.R.; Maciejewski, A.; Wishart, D.S. Heatmapper: Web-Enabled Heat Mapping for all. Nucleic Acids Res. 2016, 44, W147–W153. [Google Scholar] [CrossRef]


| Gene (Aliases) | Uniprot Code | N | A | Biological Function | Previous References to Prostate Cancer (PCa) |
|---|---|---|---|---|---|
| DLAT (DLTA) | P10515 | 1 | 221–420 | Dihydrolipoamide-acetyltransferase (DLAT) in pyruvate dehydrogenase complex control of mitochondrial energetic metabolism [27]. | Enzymatic activity at the basal level is significantly higher in prostate cancer cells compared to benign prostate cells [28]. |
| DNAAF2 (KTU) | Q9NVR5 | 1 | 436–621 | Cytoskeletal component [29]. | Not previously reported |
| HDLBP (HBP, VGL) | Q00341 | 1 | 152–374 | HDLBP drives cell proliferation [30]. | Not previously reported |
| HOXA10 (HOX1H) | P31260 | 1 | * | Transcriptional control | HoxA10 is highly expressed in PCa cells and tissues and is involved in cancer cell proliferation [31,32]. |
| KRT7 (SCL) | P08729 | 11 | 109–301 | Cytoskeletal component | KRT7 circulating mRNA was identified in blood samples from a cohort of metastatic PCa patients [33]. |
| MNAT1 | P51948 | 1 | * | MAT1, encoded by MNAT1, binds to p53 and mediates p53 ubiquitin-degradation through MDM2, increases cell growth, and decreases cell apoptosis [34]. | Not previously reported |
| SPIN1 | Q9Y657 | 1 | 130–337 | Chromatin reader; promotes the expression of rRNA [35] | Not previously reported |
| UBE2E3 | Q969T4 | 5 | 25–111 | Control of transcription factor activity [36]. | Not previously reported |
| UBXN1 (SAKS1) | Q04323 | 1 | 57–238 | NF-κB can be negatively regulated by UBXN1 [37]. | Not previously reported |
| UHRF2 (NIRF, RNF107) | Q96PU4 | 4 | 157–284 | UHRF2 encodes a nuclear protein involved in cell-cycle regulation, and it is an important mediator of E2F1-induced cell death [38]. | Not previously reported |
| ZNF428 (C19orf37) | Q96B54 | 1 | 109–188 | Unknown | Not previously reported |
| Gene (Aliases) | Uniprot Code | N | A | Biological Function | Previous References to Prostate Cancer (PCa) |
|---|---|---|---|---|---|
| C1QBP (GC1QBP, HABP1, SF2P32) | Q07021 | 3 | 1–187 | Control of mitochondrial energetic metabolism. Promotes cell proliferation, migration, and resistance to cell death. [39]. | Highly expressed in prostate cancer and is associated with shorter prostate-specific antigen relapse time after radical prostatectomy [40]. |
| SNAPIN (BLOC1S7, SNAP25BP) | O95295 | 1 | 54–136 | A SNARE-associated protein which binds Snap25 facilitating the vesicular membrane fusion process [41]. | Involved in developing prostate adenocarcinoma in mice [41]. |
| U2AF1 (U2AF35,) | Q01081 | 1 | 31–104 | RNA splicing [42]. | Highly expressed in PCa [43]. |
| UHRF2 (NIRF, RNF107) | Q96PU4 | 1 | 20–169 | UHRF2 encodes a nuclear protein involved in cell-cycle regulation and is an important mediator of E2F1-induced cell death [38]. | Not previously reported |
| ZNF428 (C19orf37) | Q96B54 | 3 | 100–188 | Unknown | Not previously reported |
| Gene (Aliases) | Uniprot Code | N | A | Biological Function | Previous References to Prostate Cancer (PCa) |
|---|---|---|---|---|---|
| c-FOS | P01100 | 2 | 27–184 | Transcriptional regulation and control of cell growth and apoptosis. [44]. | Expression is elevated in the prostate upon castration-mediated androgen withdrawal [44]. |
| GOLM1 | Q8NBJ4 | 1 | 236–376 | PI3K-AKT-mTOR signaling [45]. | Upregulated in PCa has oncogenic functions [45]. |
| HNRNPU | Q00839 | 1 | 91–296 | DNA and RNA binding [46]. | Not previously reported |
| MAP1B | P46821 | 2 | 2187–2409 | Vesicle formation; it can interact with p53 [47]. | Not previously reported |
| MAPKAPK5 | Q8IW41 | 1 | 1–95 | Involved in mTOR signaling [48]; MAPKAPK5 has diverse roles in cell growth, programmed cell death, senescence, and motility [49]. | Not previously reported |
| MIEN1 | Q9BRT3 | 3 | 24–204 | Regulator of cell migration and invasion [50]. | MIEN1 increases invasive potential of PCa cells by NF-κβ-mediated downstream target genes [50]. |
| MT2A | P02795 | 1 | 8–61 | Binding to heavy metals [51]. | MT2A is upregulated under hypoxia in PCa cell lines, PCa tissue, and residual cancer cells after androgen ablation therapy [52]. |
| PSMA7 (PTPT) | O14818 | 1 | 173–248 | PSMA7, a proteasome subunit, enhances AR transactivation in a dose-dependent manner [53] and inhibits the transactivation function of HIF-1A [54]. | Proposed biomarker in PCa [55] |
| PTPN2 | P17706 | 3 | 1–221 | Tyrosine-specific phosphatase (TCPTP) negatively regulates STAT3 that is involved in cell growth and proliferation, differentiation, migration, and cell death or apoptosis [56]. | Not previously reported |
| RASAL2 | Q9UJF2 | 1 | 97–334 | Tumor suppressor via RAS [57] | Not previously reported |
| RSF1 | Q96T23 | 1 | 572–795 | Chromatin remodeling factor necessary for p53-dependent gene expression in response to DNA damage [58]. | RSF1 is overexpressed in PCa and contributes to prostate cancer cell growth and invasion [59]. |
| SRSF3 | P84103 | 2 | 1–164 | Oncogenic splicing factor [60]. | SRSF3 expression is induced by hypoxia in prostate cancerous cells [61]. |
| TAF3 | Q5VWG9 | 5 | 2–222 | Transcriptional regulation; interacts with and inhibits p53 [62]. | Not previously reported |
| TGM3 | Q08188 | 1 | 480–693 | Catalyze the irreversible cross-linking of peptide-bound glutamine residues to lysines or primary amines; involved in apoptosis [63]. | Not previously reported |
| UBC | P0CG48 | 1 | 28–181 | Unanchored-polyubiquitin has several roles in activation of protein kinases, and signaling | Not previously reported |
| WNK4 | Q96J92 | 4 | 9–208 | Regulates STE20-related protein kinases that function upstream of the MAPK pathways. [64]. | Not previously reported |
| YY1 | P25490 | 1 | 27–223 | Transcriptional regulation [65]. | Involved in PCa [65,66,67,68,69,70] |
| ZNF428 | Q96B54 | 2 | 89–188 | Unknown | Not previously reported |
| Gene (Aliases) | Uniprot Code | N | A | Biological Function | Previous References to Prostate Cancer |
|---|---|---|---|---|---|
| C1QBP (GC1QBP, HABP1, SF2P32) | Q07021 | 10 | 57–282 | Control of mitochondrial energetic metabolism; promotes cell proliferation, migration, and resistance to cell death. [39]. | Highly expressed in PCa and associated with shorter prostate-specific antigen relapse time after radical prostatectomy [40]. |
| COMMD1 | Q8N668 | 1 | 1–180 | Regulates oxidative stress, NF-κB-mediated transcription, DNA damage response, and oncogenesis [71]. | Degradation of COMMD1 and I-kappaB induced by clusterin enhances NF-κβ activity in prostate cancer cells. [72]. |
| FLNA | P21333 | 5 | 106–366 | A C-terminal fragment of FLNA co-localizes with the androgen receptor AR to the nucleus and downregulates AR function. [73]. | FLNA has been clinically validated for better diagnosis of PCa [74]; regulated by miRNA205 [75]. |
| MIEN1 | Q9BRT3 | 4 | 1–116 | Regulates cell migration and apoptosis [50]. | Overexpressed in PCa cells. MIEN1 overexpression functionally enhances migration and invasion of tumor cells via modulating the activity of AKT [50]. |
| MYL6 | P60660 | 2 | 1–150 | Regulatory light chain of myosin II; myosin II, expressed in non-muscle tissues, plays a central role in cell adhesion, migration, and division [76]. | Not previously reported |
| NOP53 (GLTSCR2) | Q9NZM5 | 35 | 163–428 | Cell cycle control; NOP53 translocates to the nucleoplasm under ribosomal stress, where it interacts with and stabilizes p53 and inhibits cell cycle progression [77]. | Not previously reported |
| RPS28 | P62857 | 1 | 8–52 | Ribosome component; its decrease blocks pre-18S ribosomal RNA processing, resulting in a reduction in the assembly of 40S ribosomal subunits [78]. | Not previously reported |
© 2019 by the authors. Licensee MDPI, Basel, Switzerland. This article is an open access article distributed under the terms and conditions of the Creative Commons Attribution (CC BY) license (http://creativecommons.org/licenses/by/4.0/).
Share and Cite
Barreiro-Alonso, A.; Cámara-Quílez, M.; Salamini-Montemurri, M.; Lamas-Maceiras, M.; Vizoso-Vázquez, Á.; Rodríguez-Belmonte, E.; Quindós-Varela, M.; Martínez-Iglesias, O.; Figueroa, A.; Cerdán, M.-E. Characterization of HMGB1/2 Interactome in Prostate Cancer by Yeast Two Hybrid Approach: Potential Pathobiological Implications. Cancers 2019, 11, 1729. https://doi.org/10.3390/cancers11111729
Barreiro-Alonso A, Cámara-Quílez M, Salamini-Montemurri M, Lamas-Maceiras M, Vizoso-Vázquez Á, Rodríguez-Belmonte E, Quindós-Varela M, Martínez-Iglesias O, Figueroa A, Cerdán M-E. Characterization of HMGB1/2 Interactome in Prostate Cancer by Yeast Two Hybrid Approach: Potential Pathobiological Implications. Cancers. 2019; 11(11):1729. https://doi.org/10.3390/cancers11111729
Chicago/Turabian StyleBarreiro-Alonso, Aida, María Cámara-Quílez, Martín Salamini-Montemurri, Mónica Lamas-Maceiras, Ángel Vizoso-Vázquez, Esther Rodríguez-Belmonte, María Quindós-Varela, Olaia Martínez-Iglesias, Angélica Figueroa, and María-Esperanza Cerdán. 2019. "Characterization of HMGB1/2 Interactome in Prostate Cancer by Yeast Two Hybrid Approach: Potential Pathobiological Implications" Cancers 11, no. 11: 1729. https://doi.org/10.3390/cancers11111729
APA StyleBarreiro-Alonso, A., Cámara-Quílez, M., Salamini-Montemurri, M., Lamas-Maceiras, M., Vizoso-Vázquez, Á., Rodríguez-Belmonte, E., Quindós-Varela, M., Martínez-Iglesias, O., Figueroa, A., & Cerdán, M.-E. (2019). Characterization of HMGB1/2 Interactome in Prostate Cancer by Yeast Two Hybrid Approach: Potential Pathobiological Implications. Cancers, 11(11), 1729. https://doi.org/10.3390/cancers11111729