
Failure Analysis for Gold Wire Bonding of Sensor Packaging Based on Experimental and Numerical Methods
 ,
,
Abstract
:1. Introduction
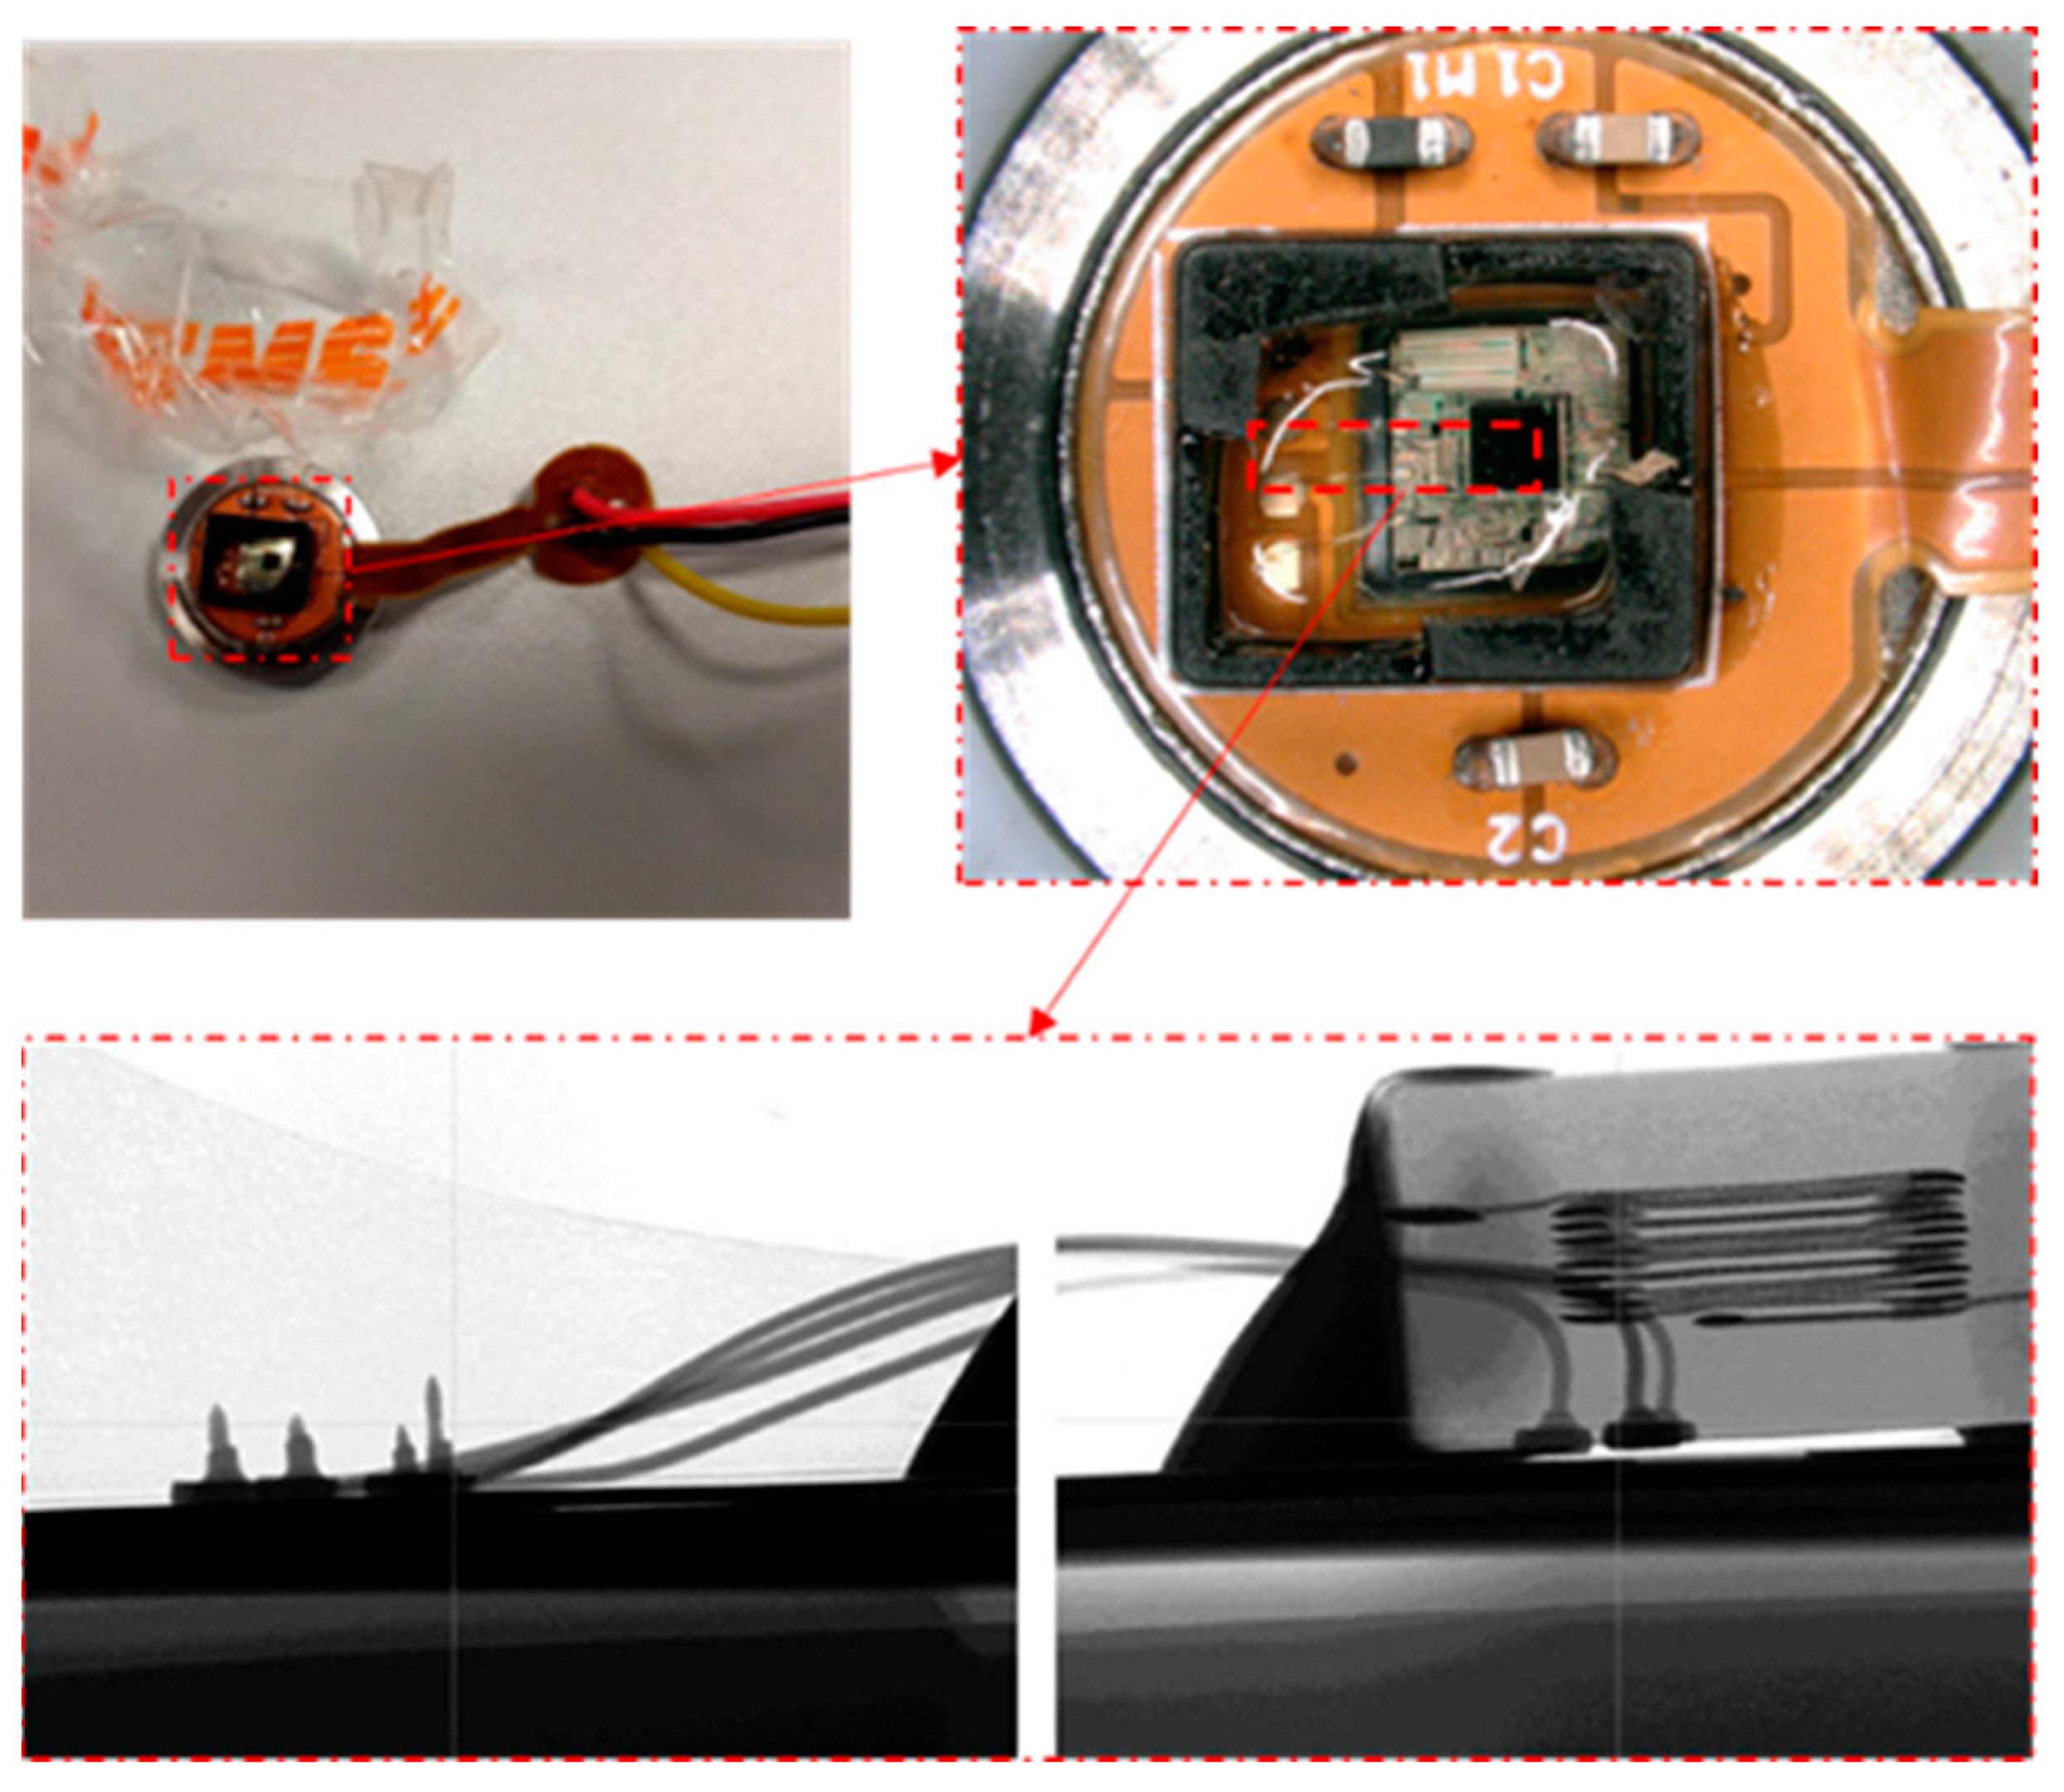
2. Experimental Procedure
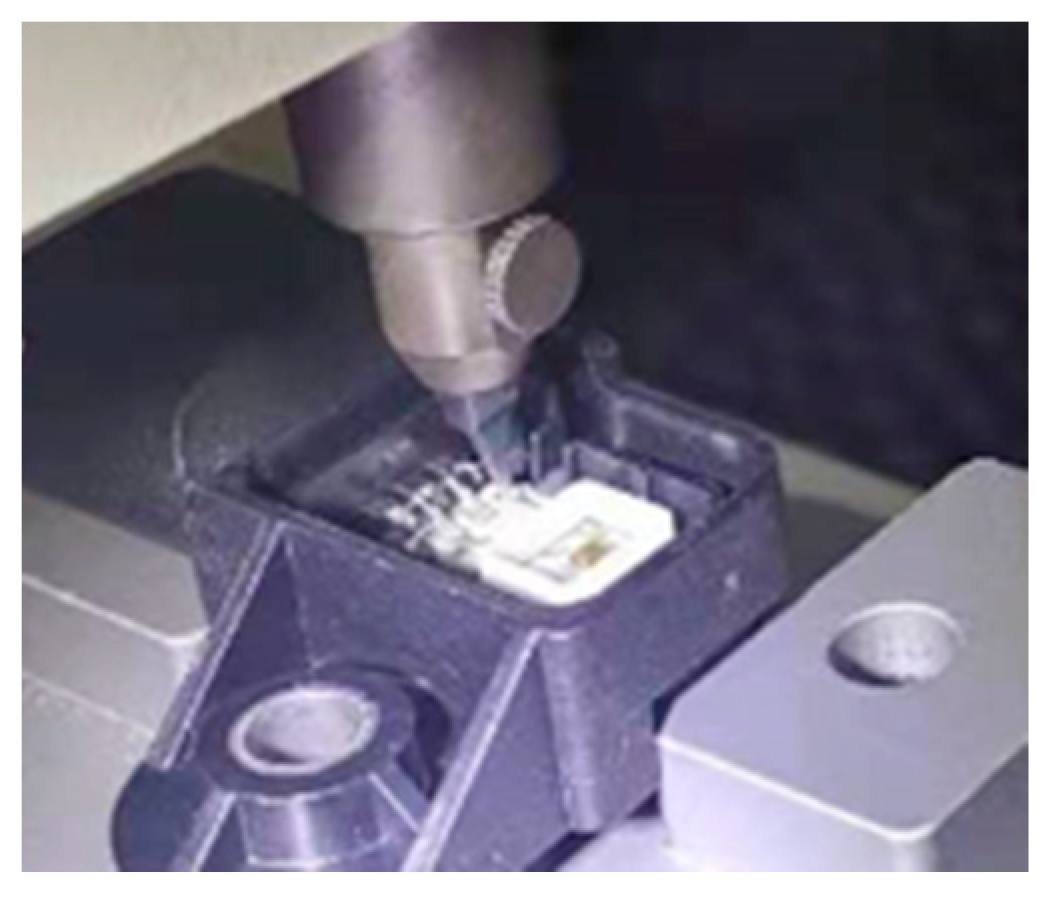
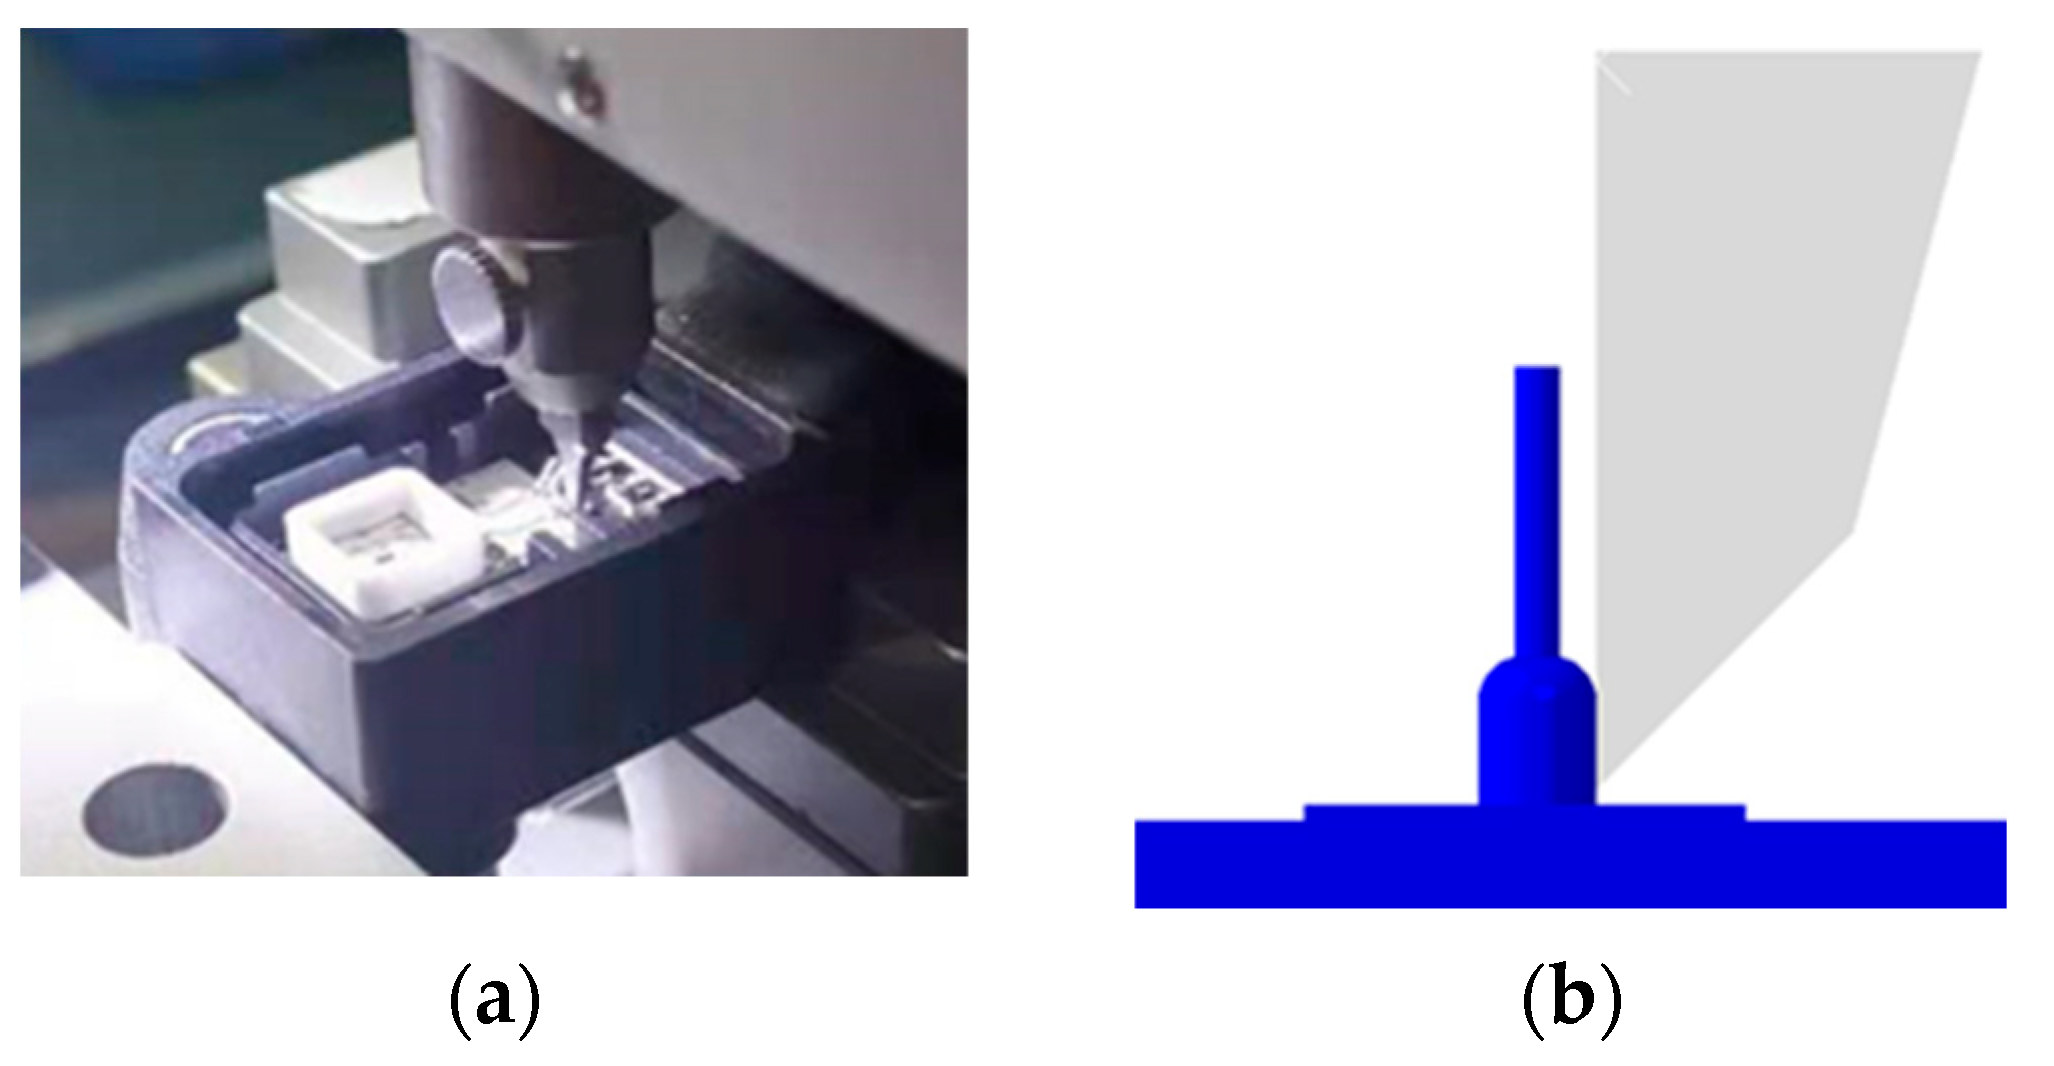
2.1. When Wire Pull Test
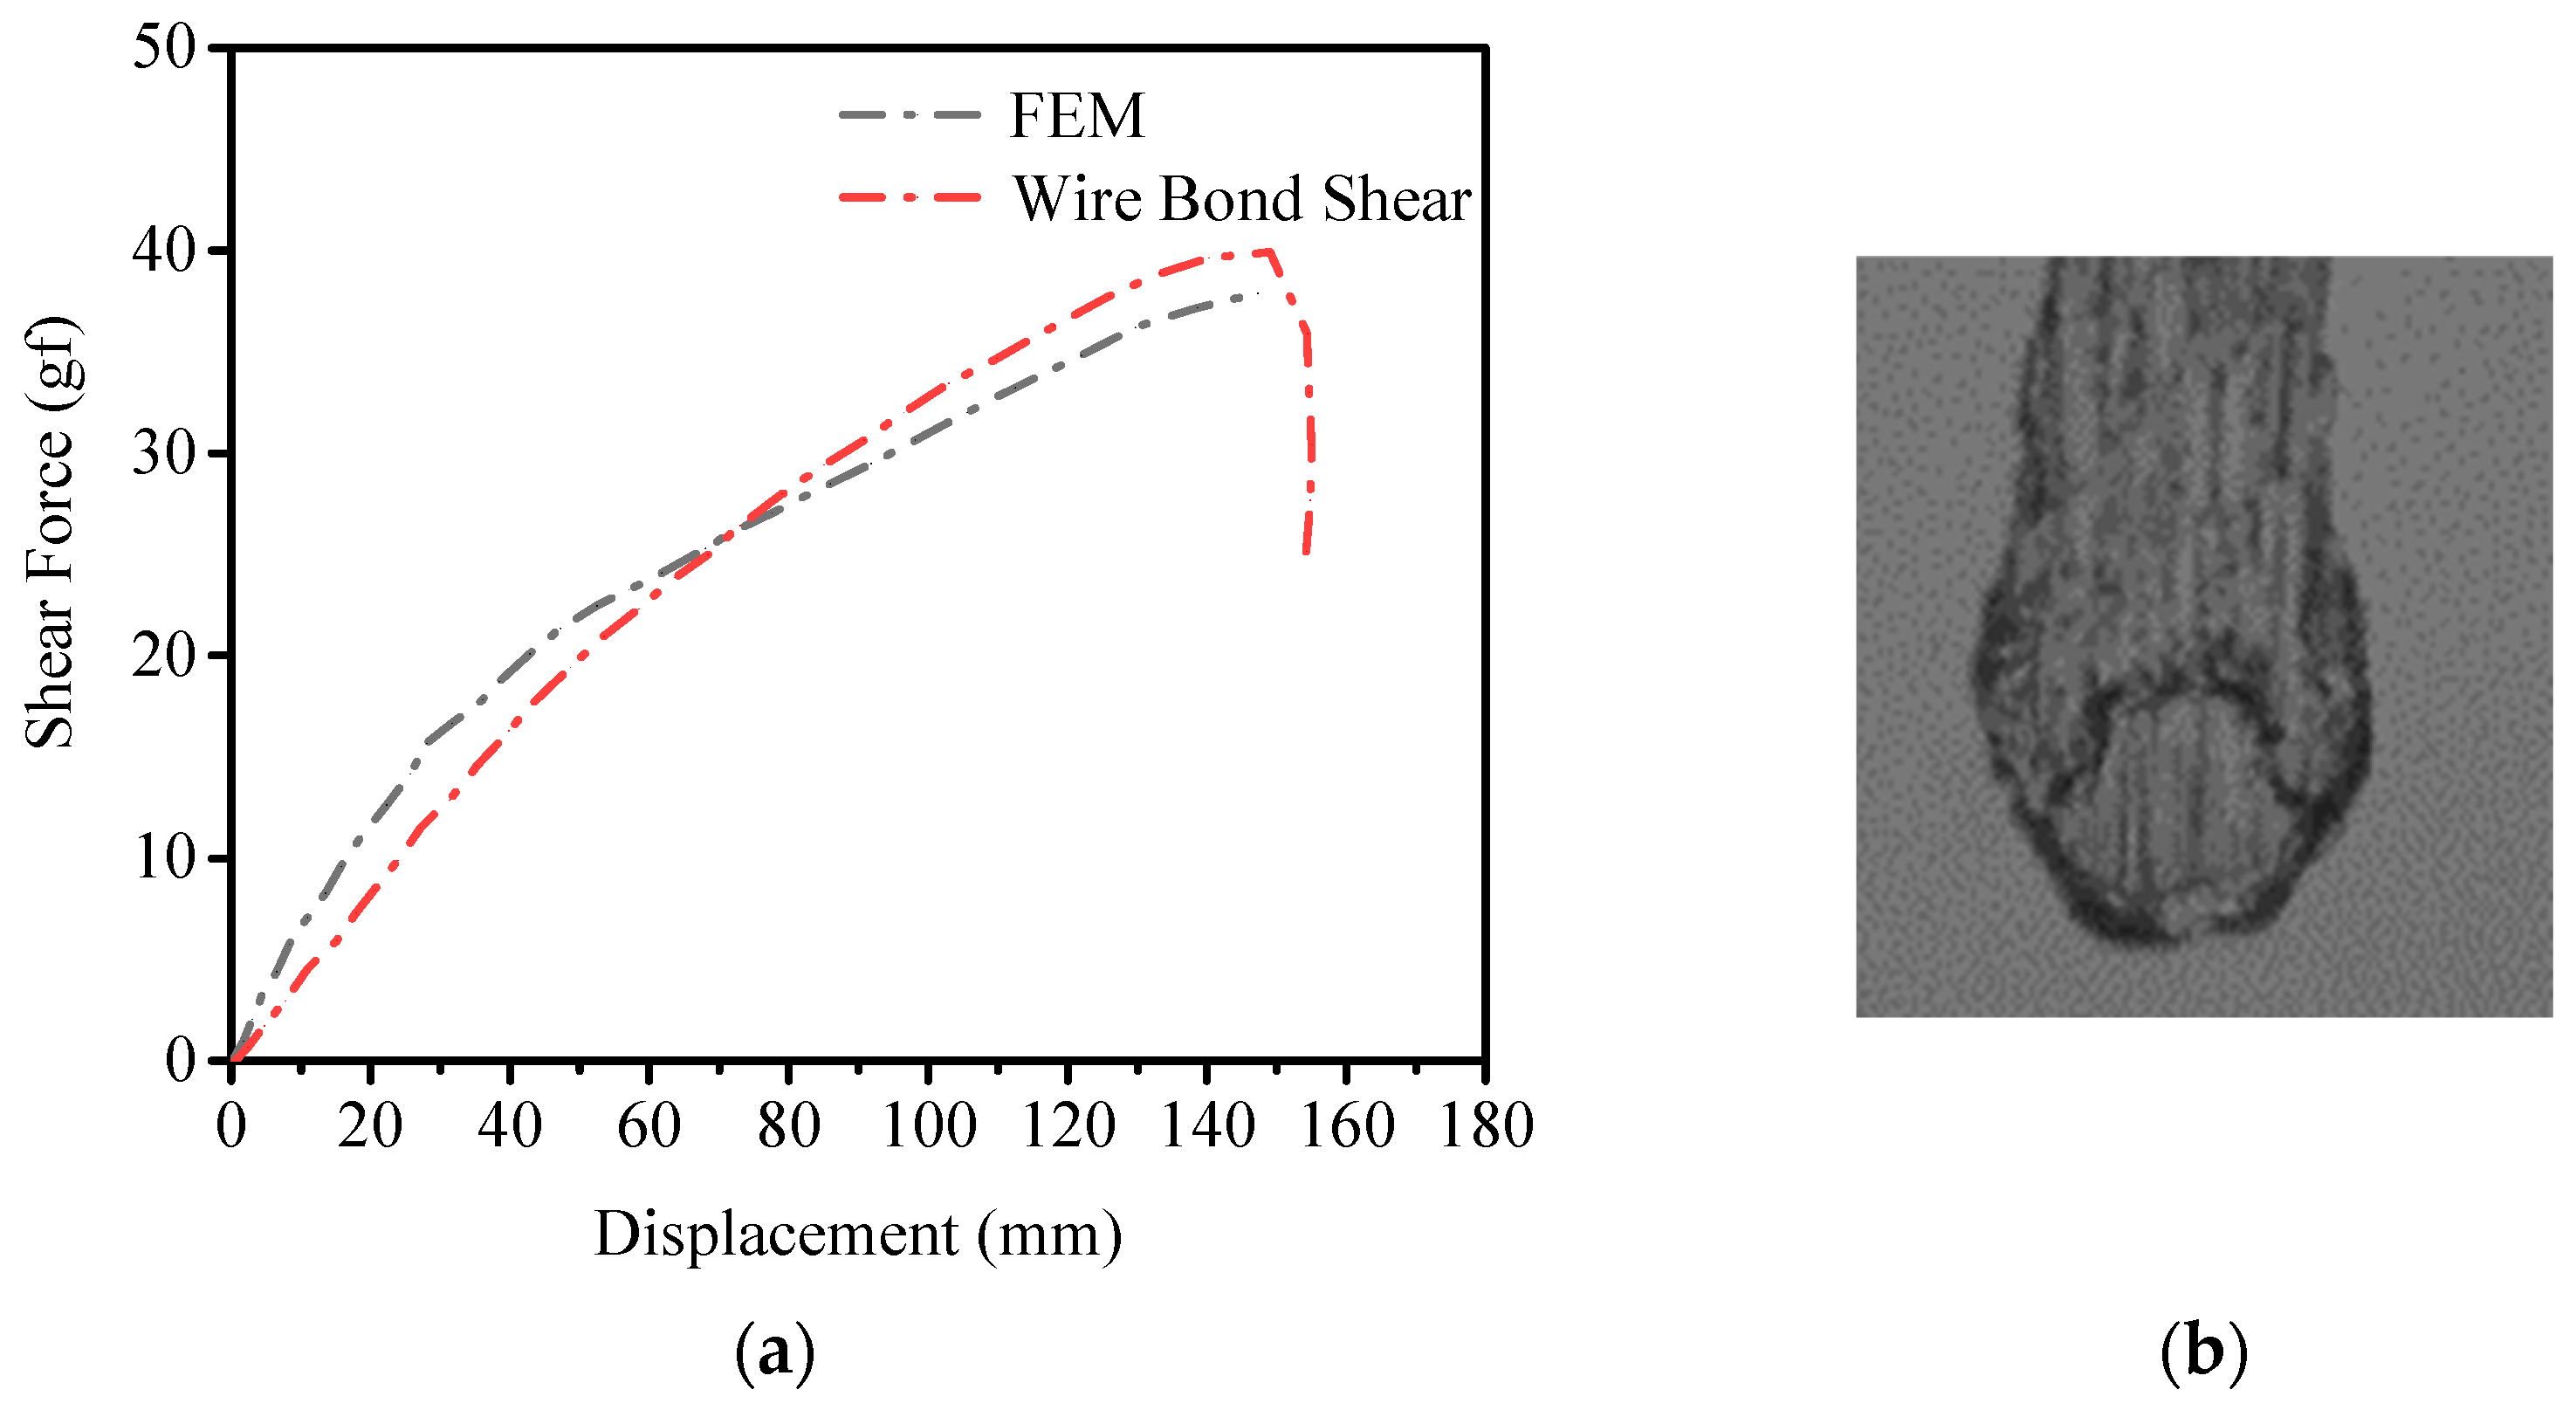
2.2. Wire Bond Shear
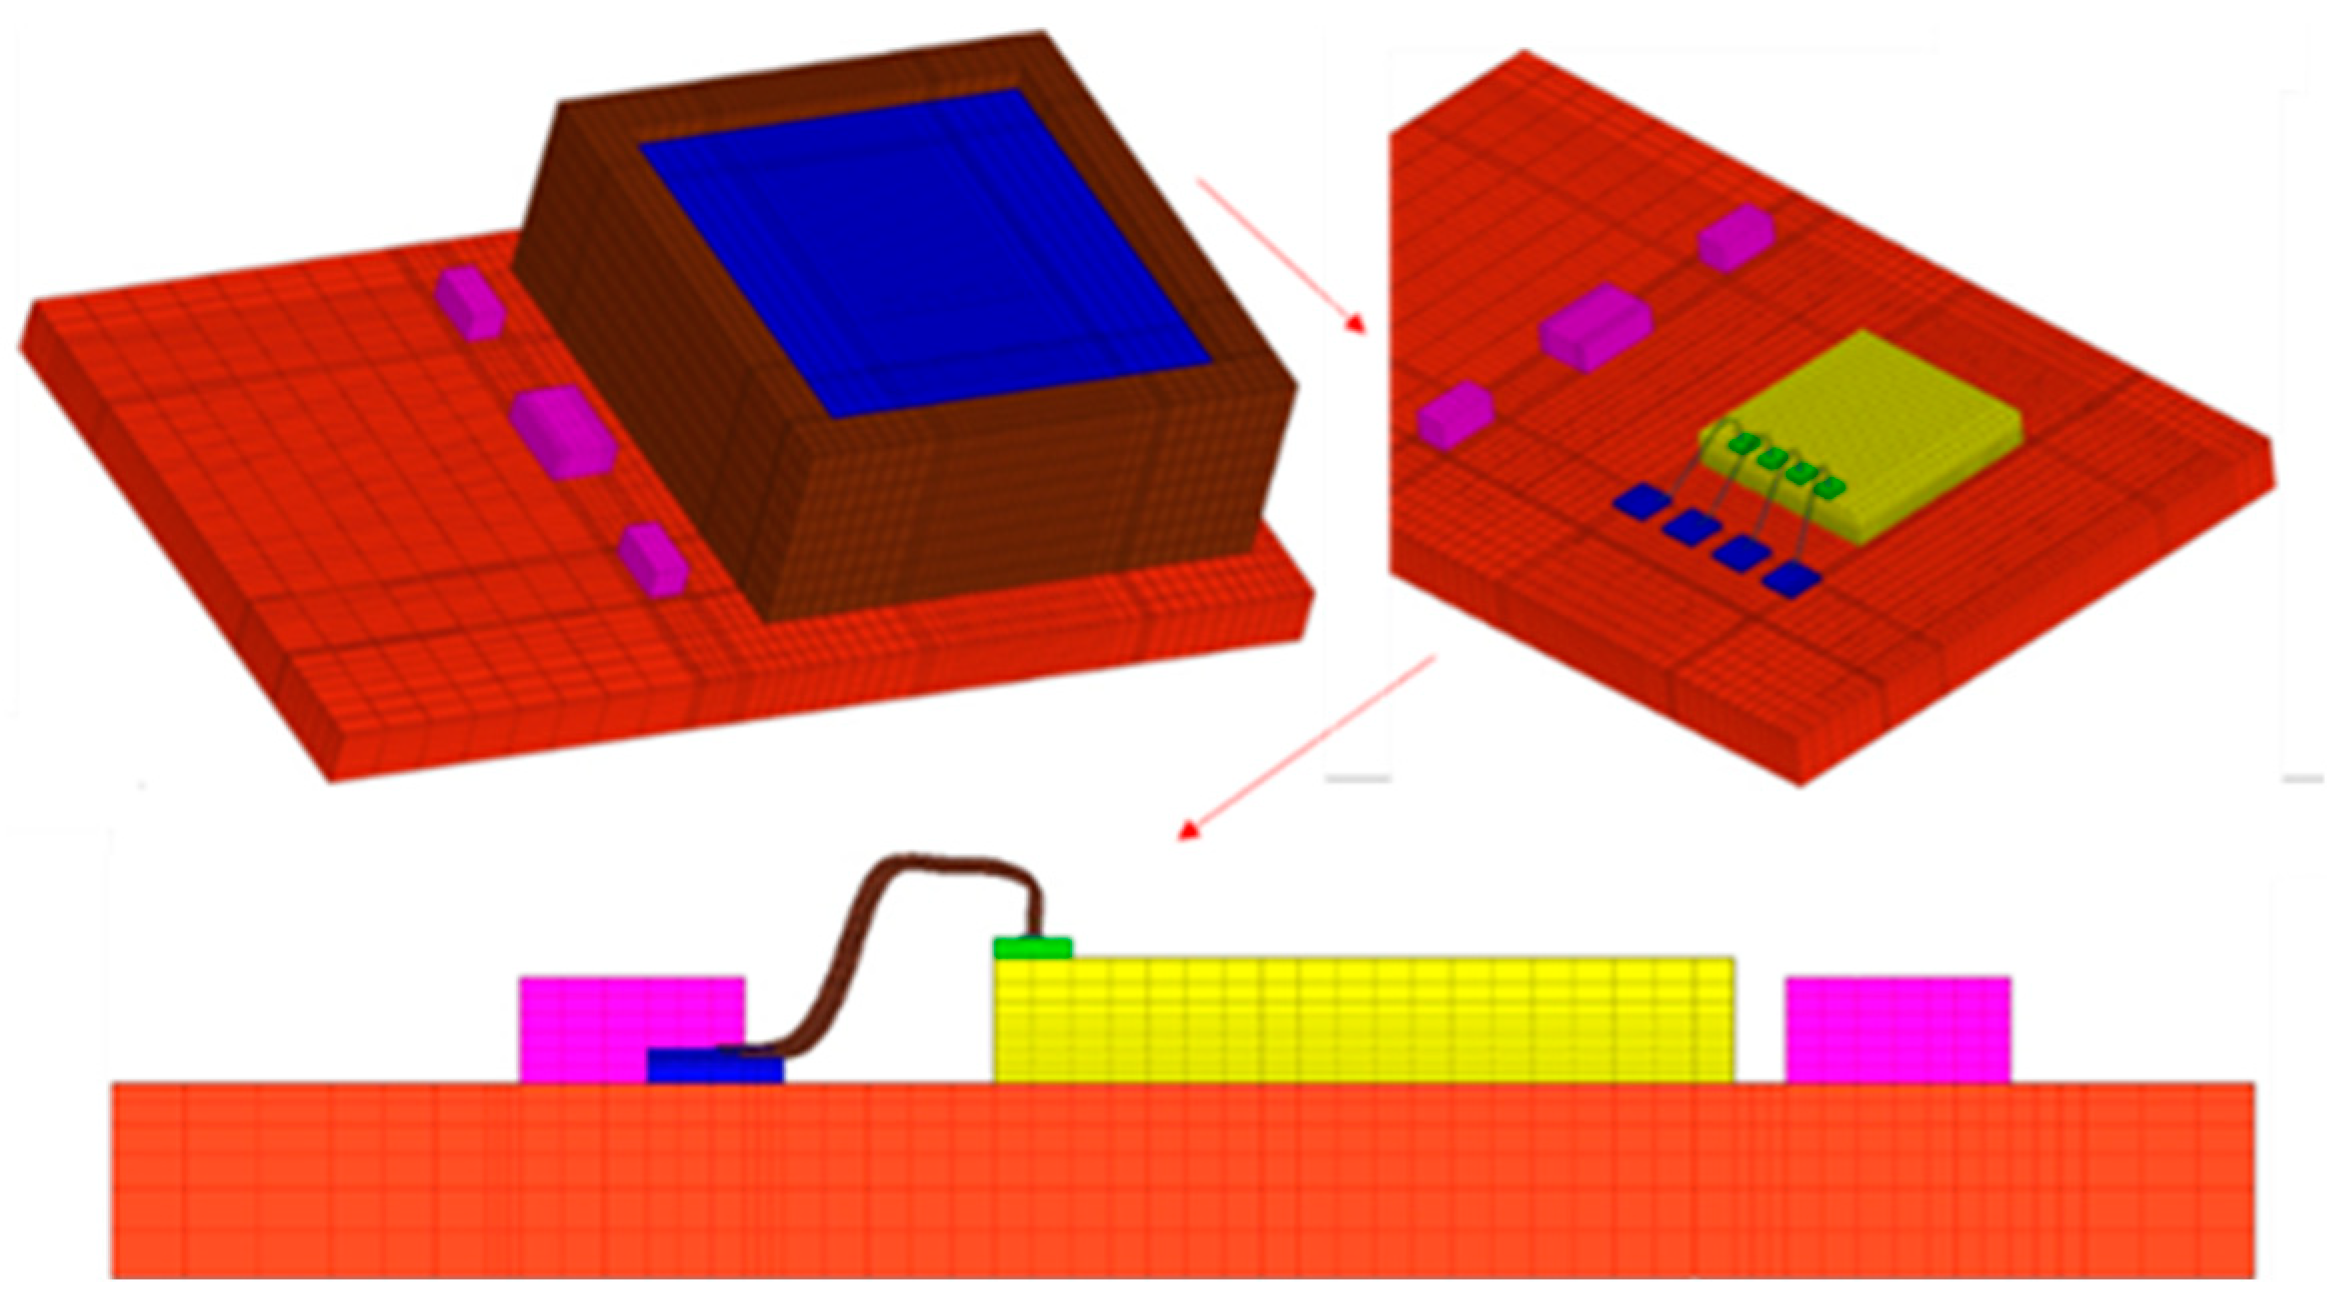
3. Model and Simulation
3.1. Simulation Model and Material Properties
3.2. Boundary Conditions
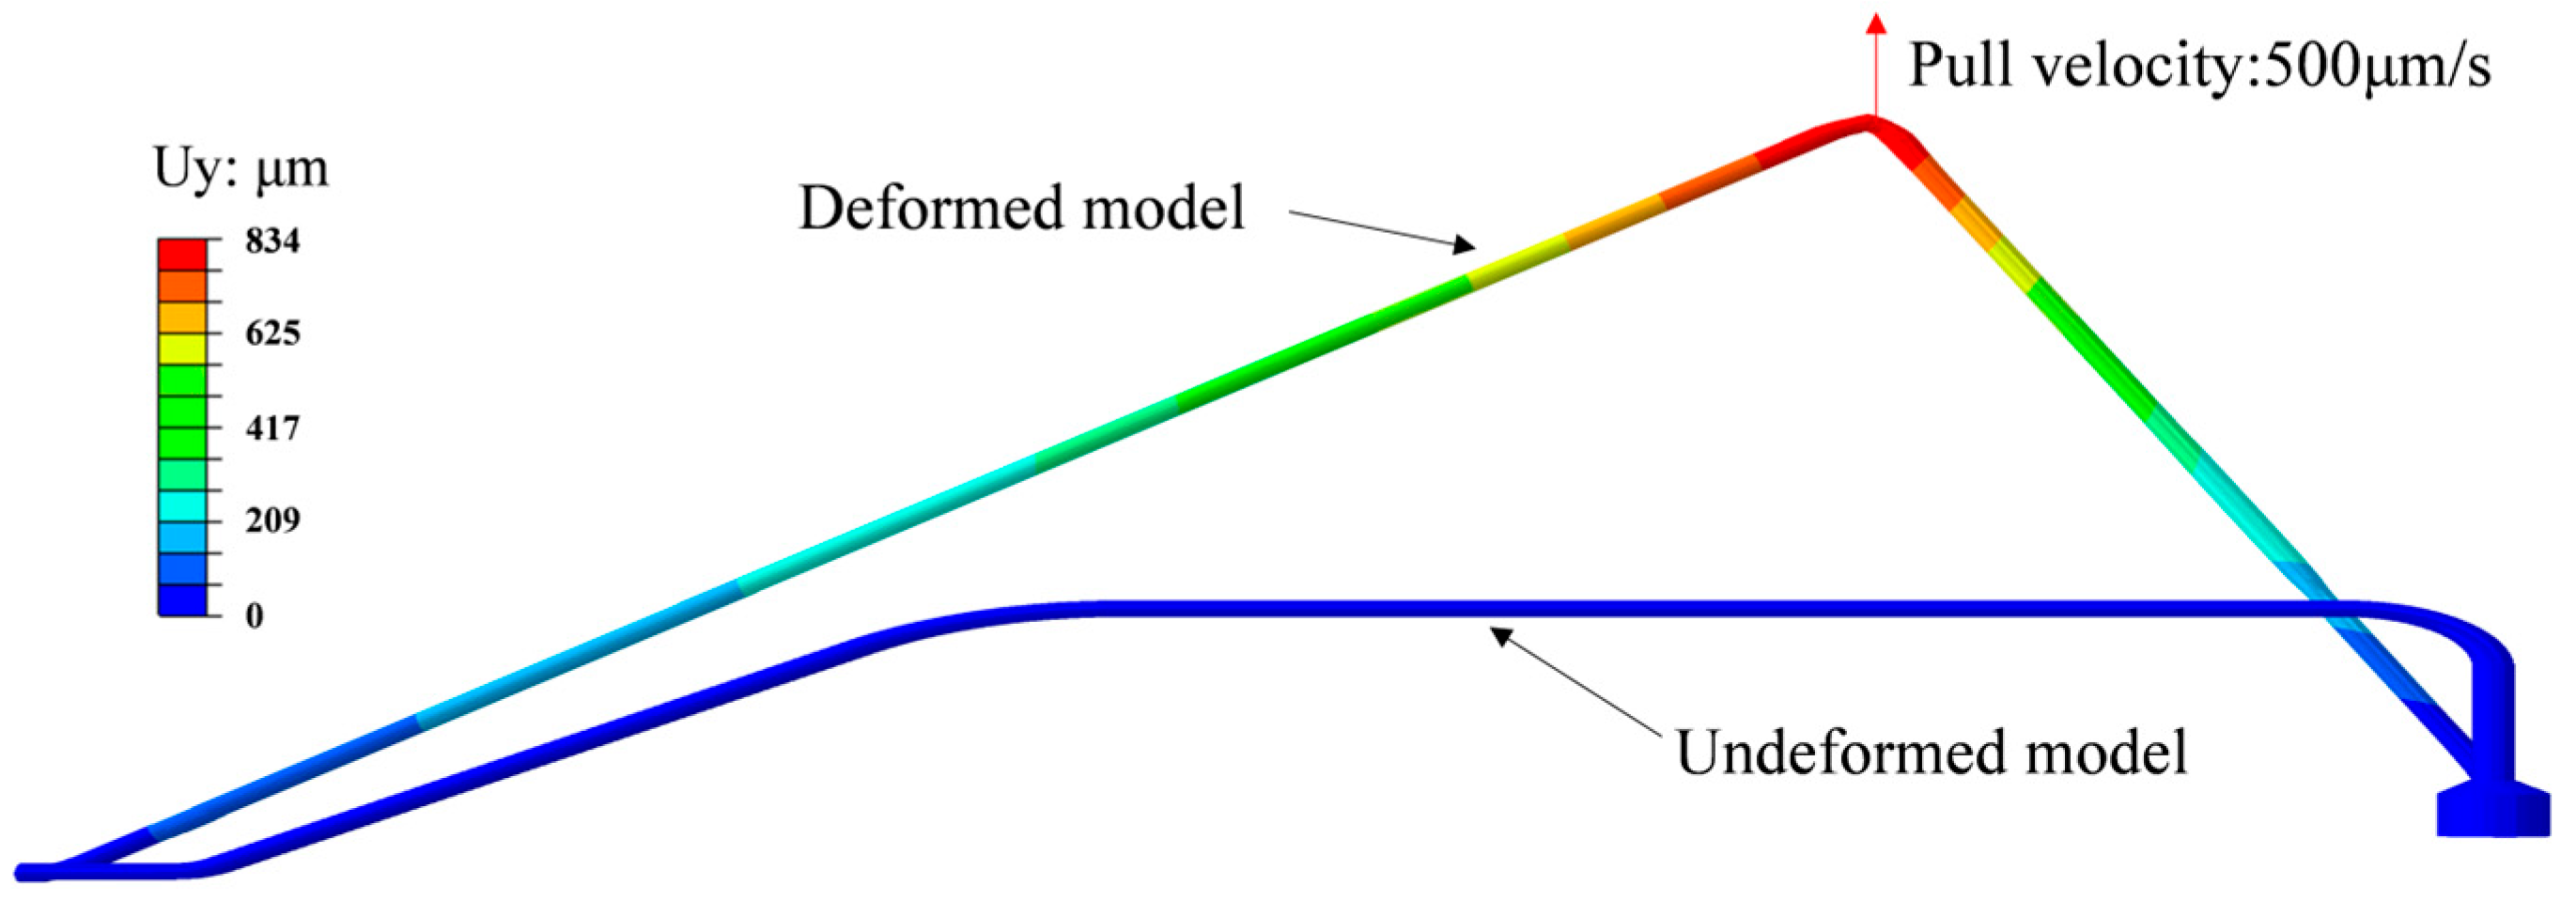
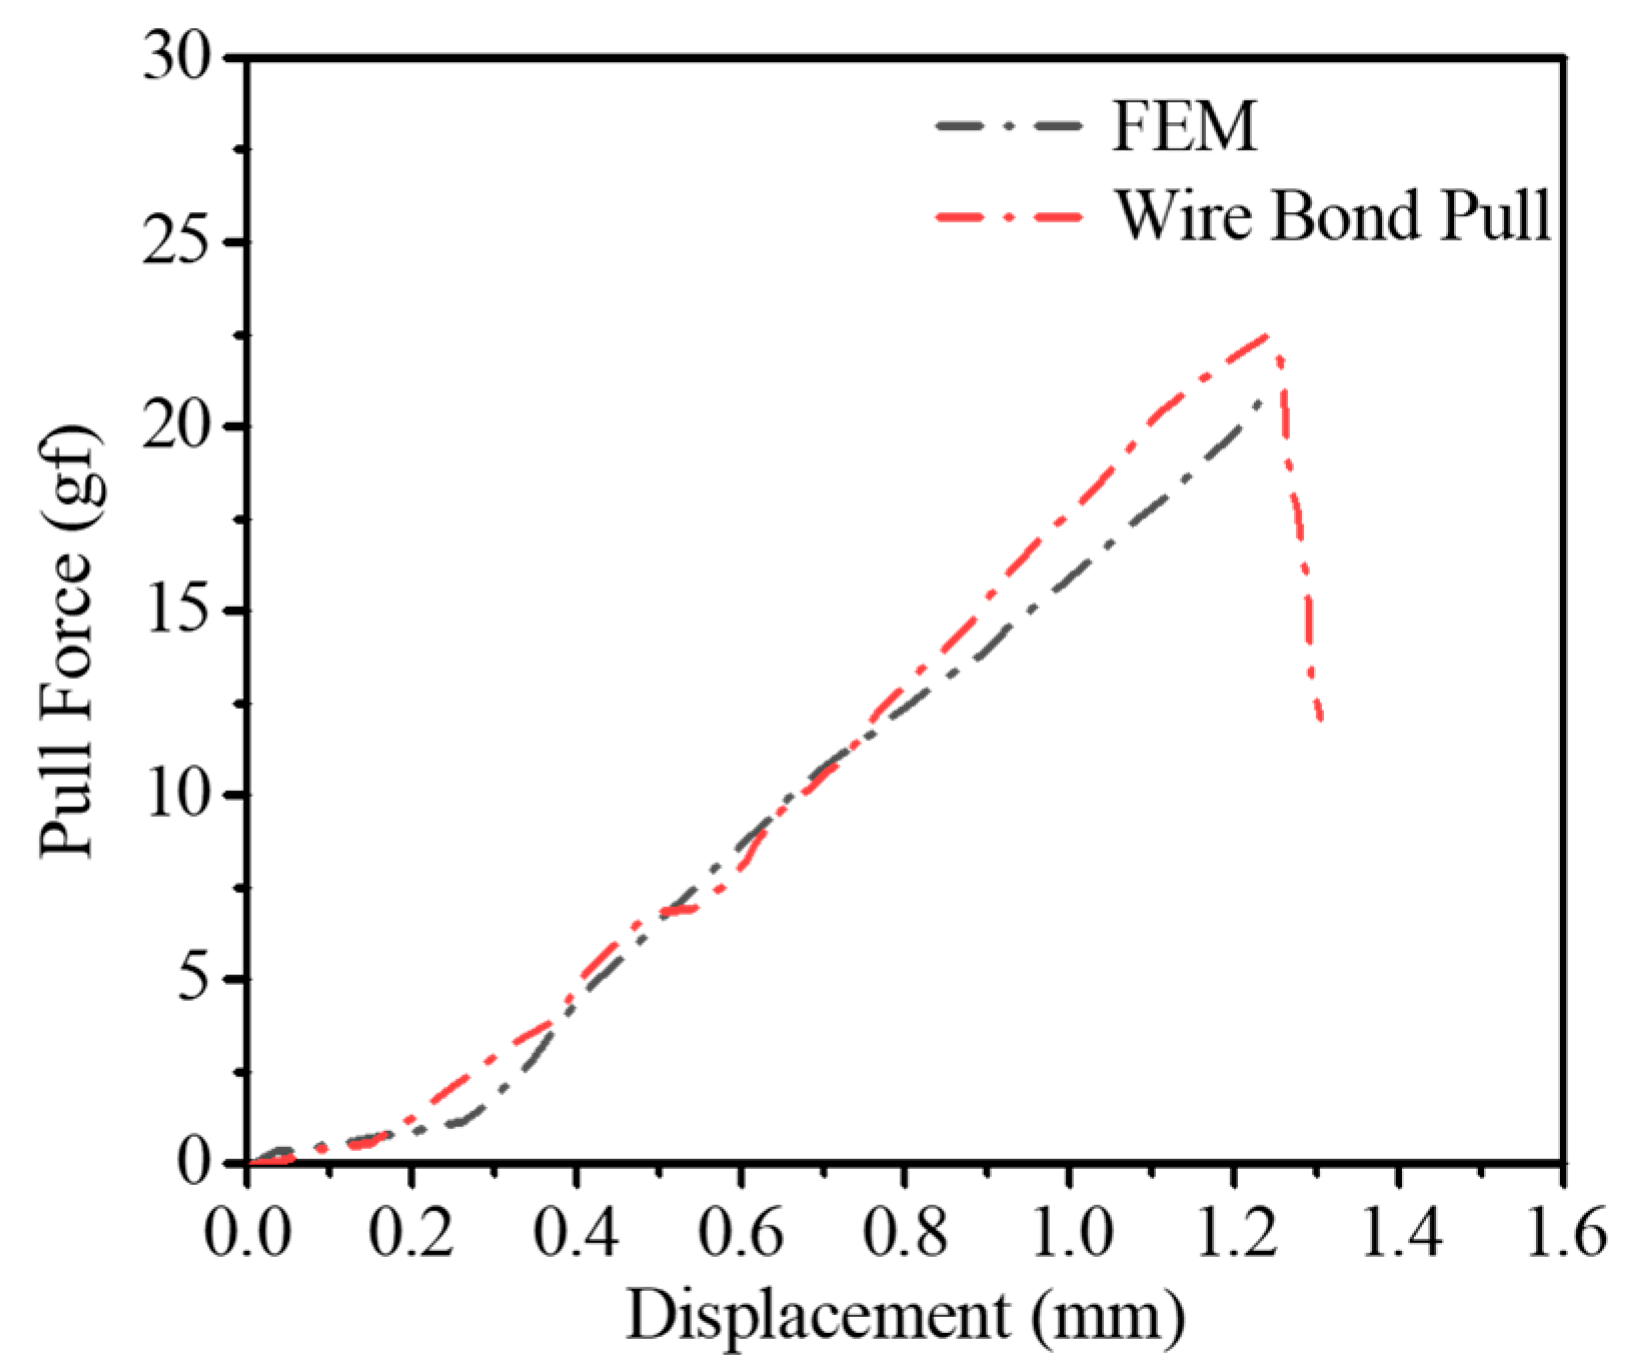
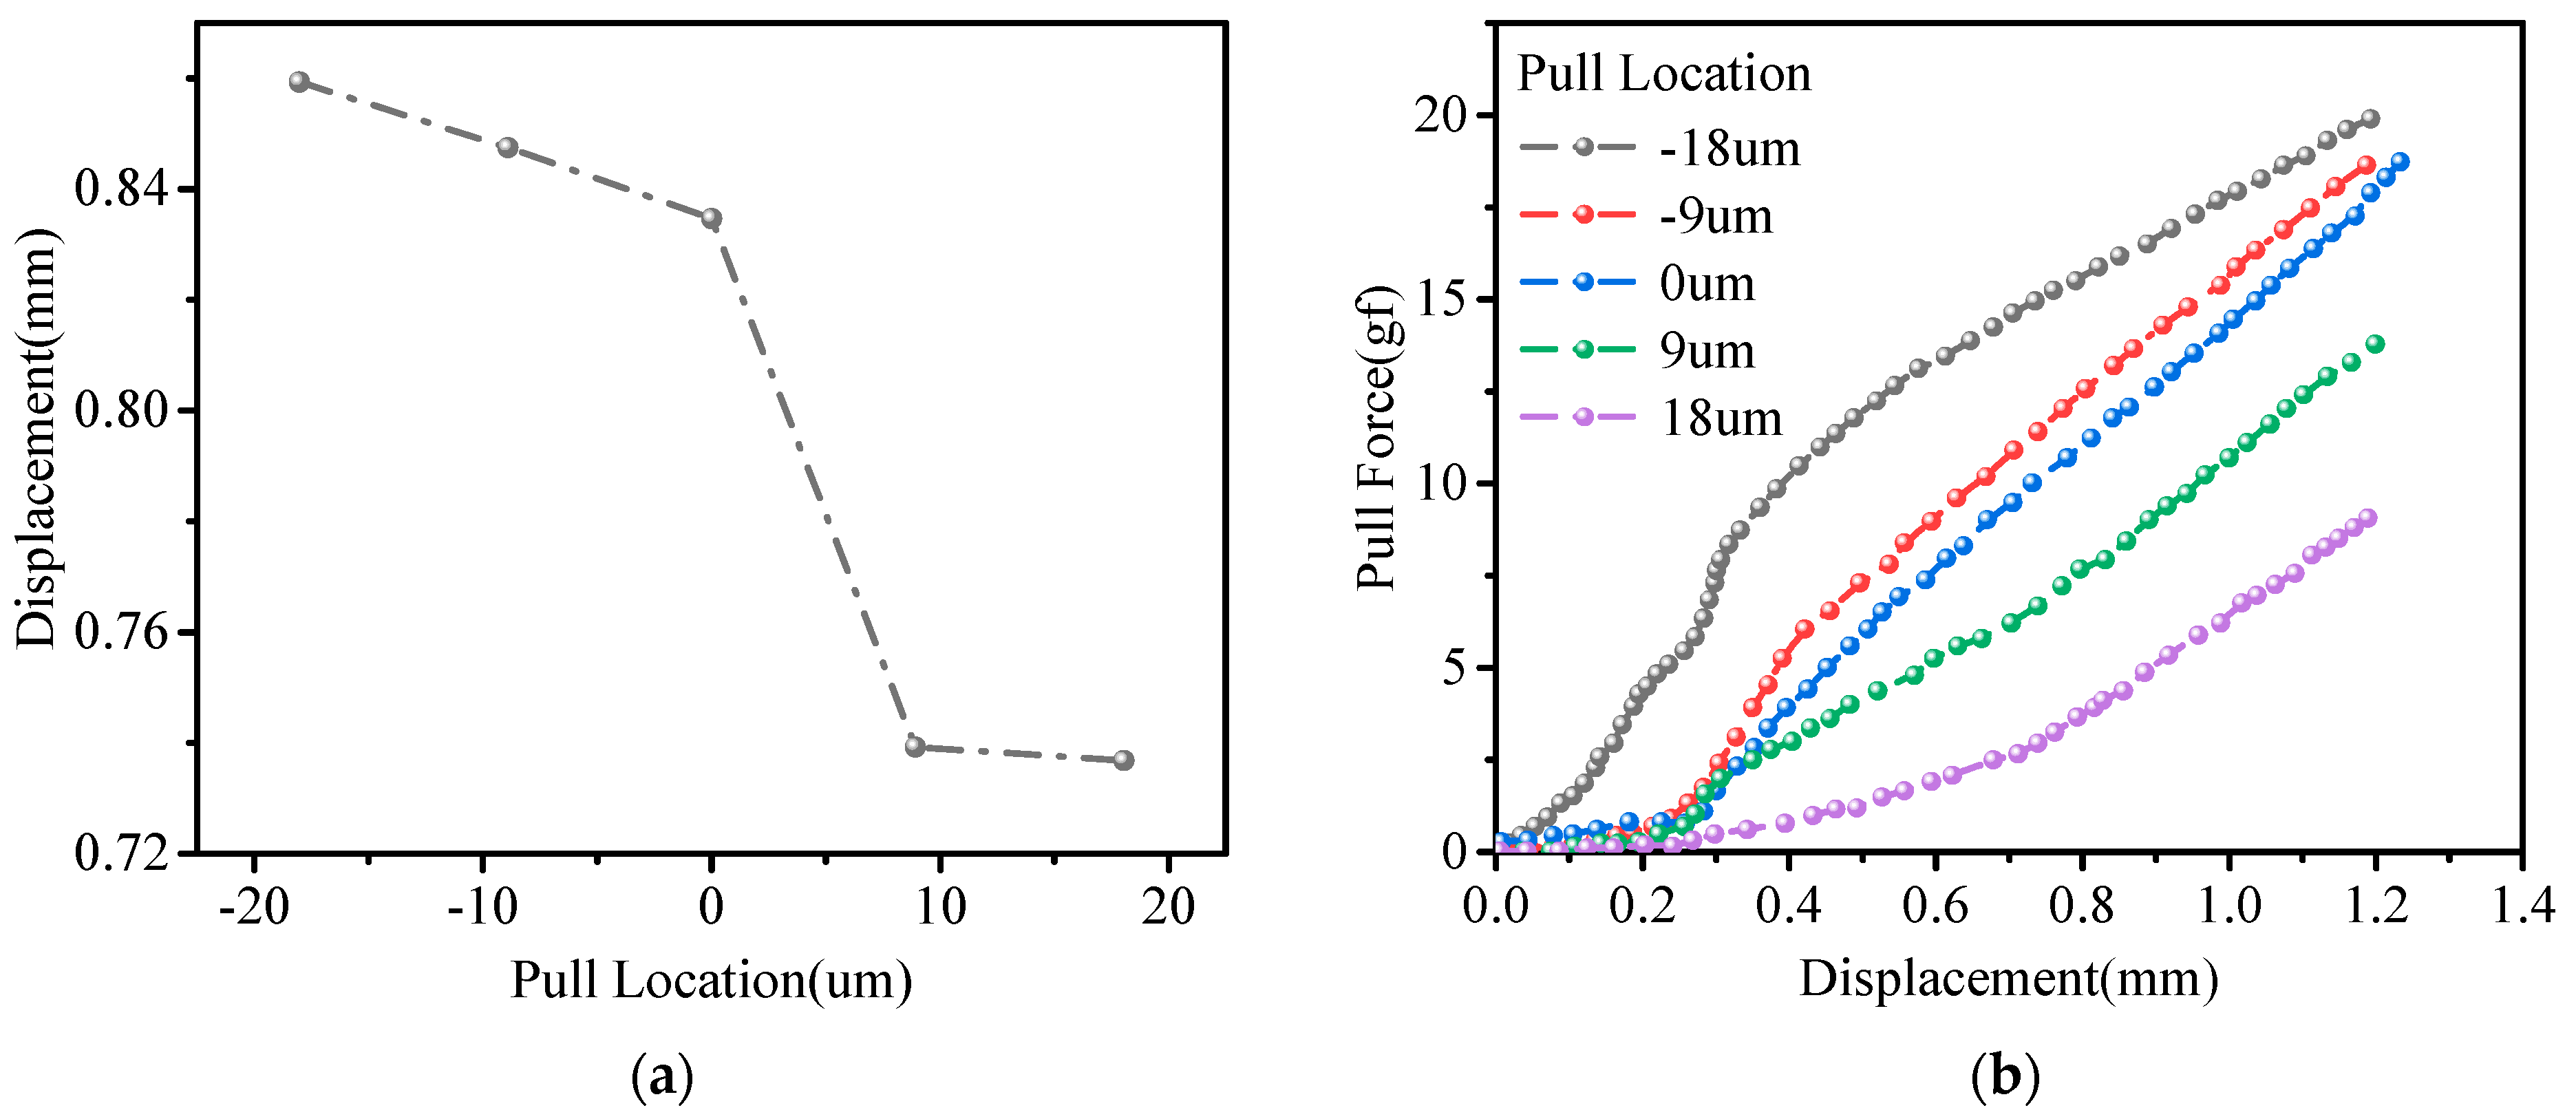
3.2.1. Wire Pull Test
3.2.2. Wire Bond Shear
3.2.3. Mechanical Shock
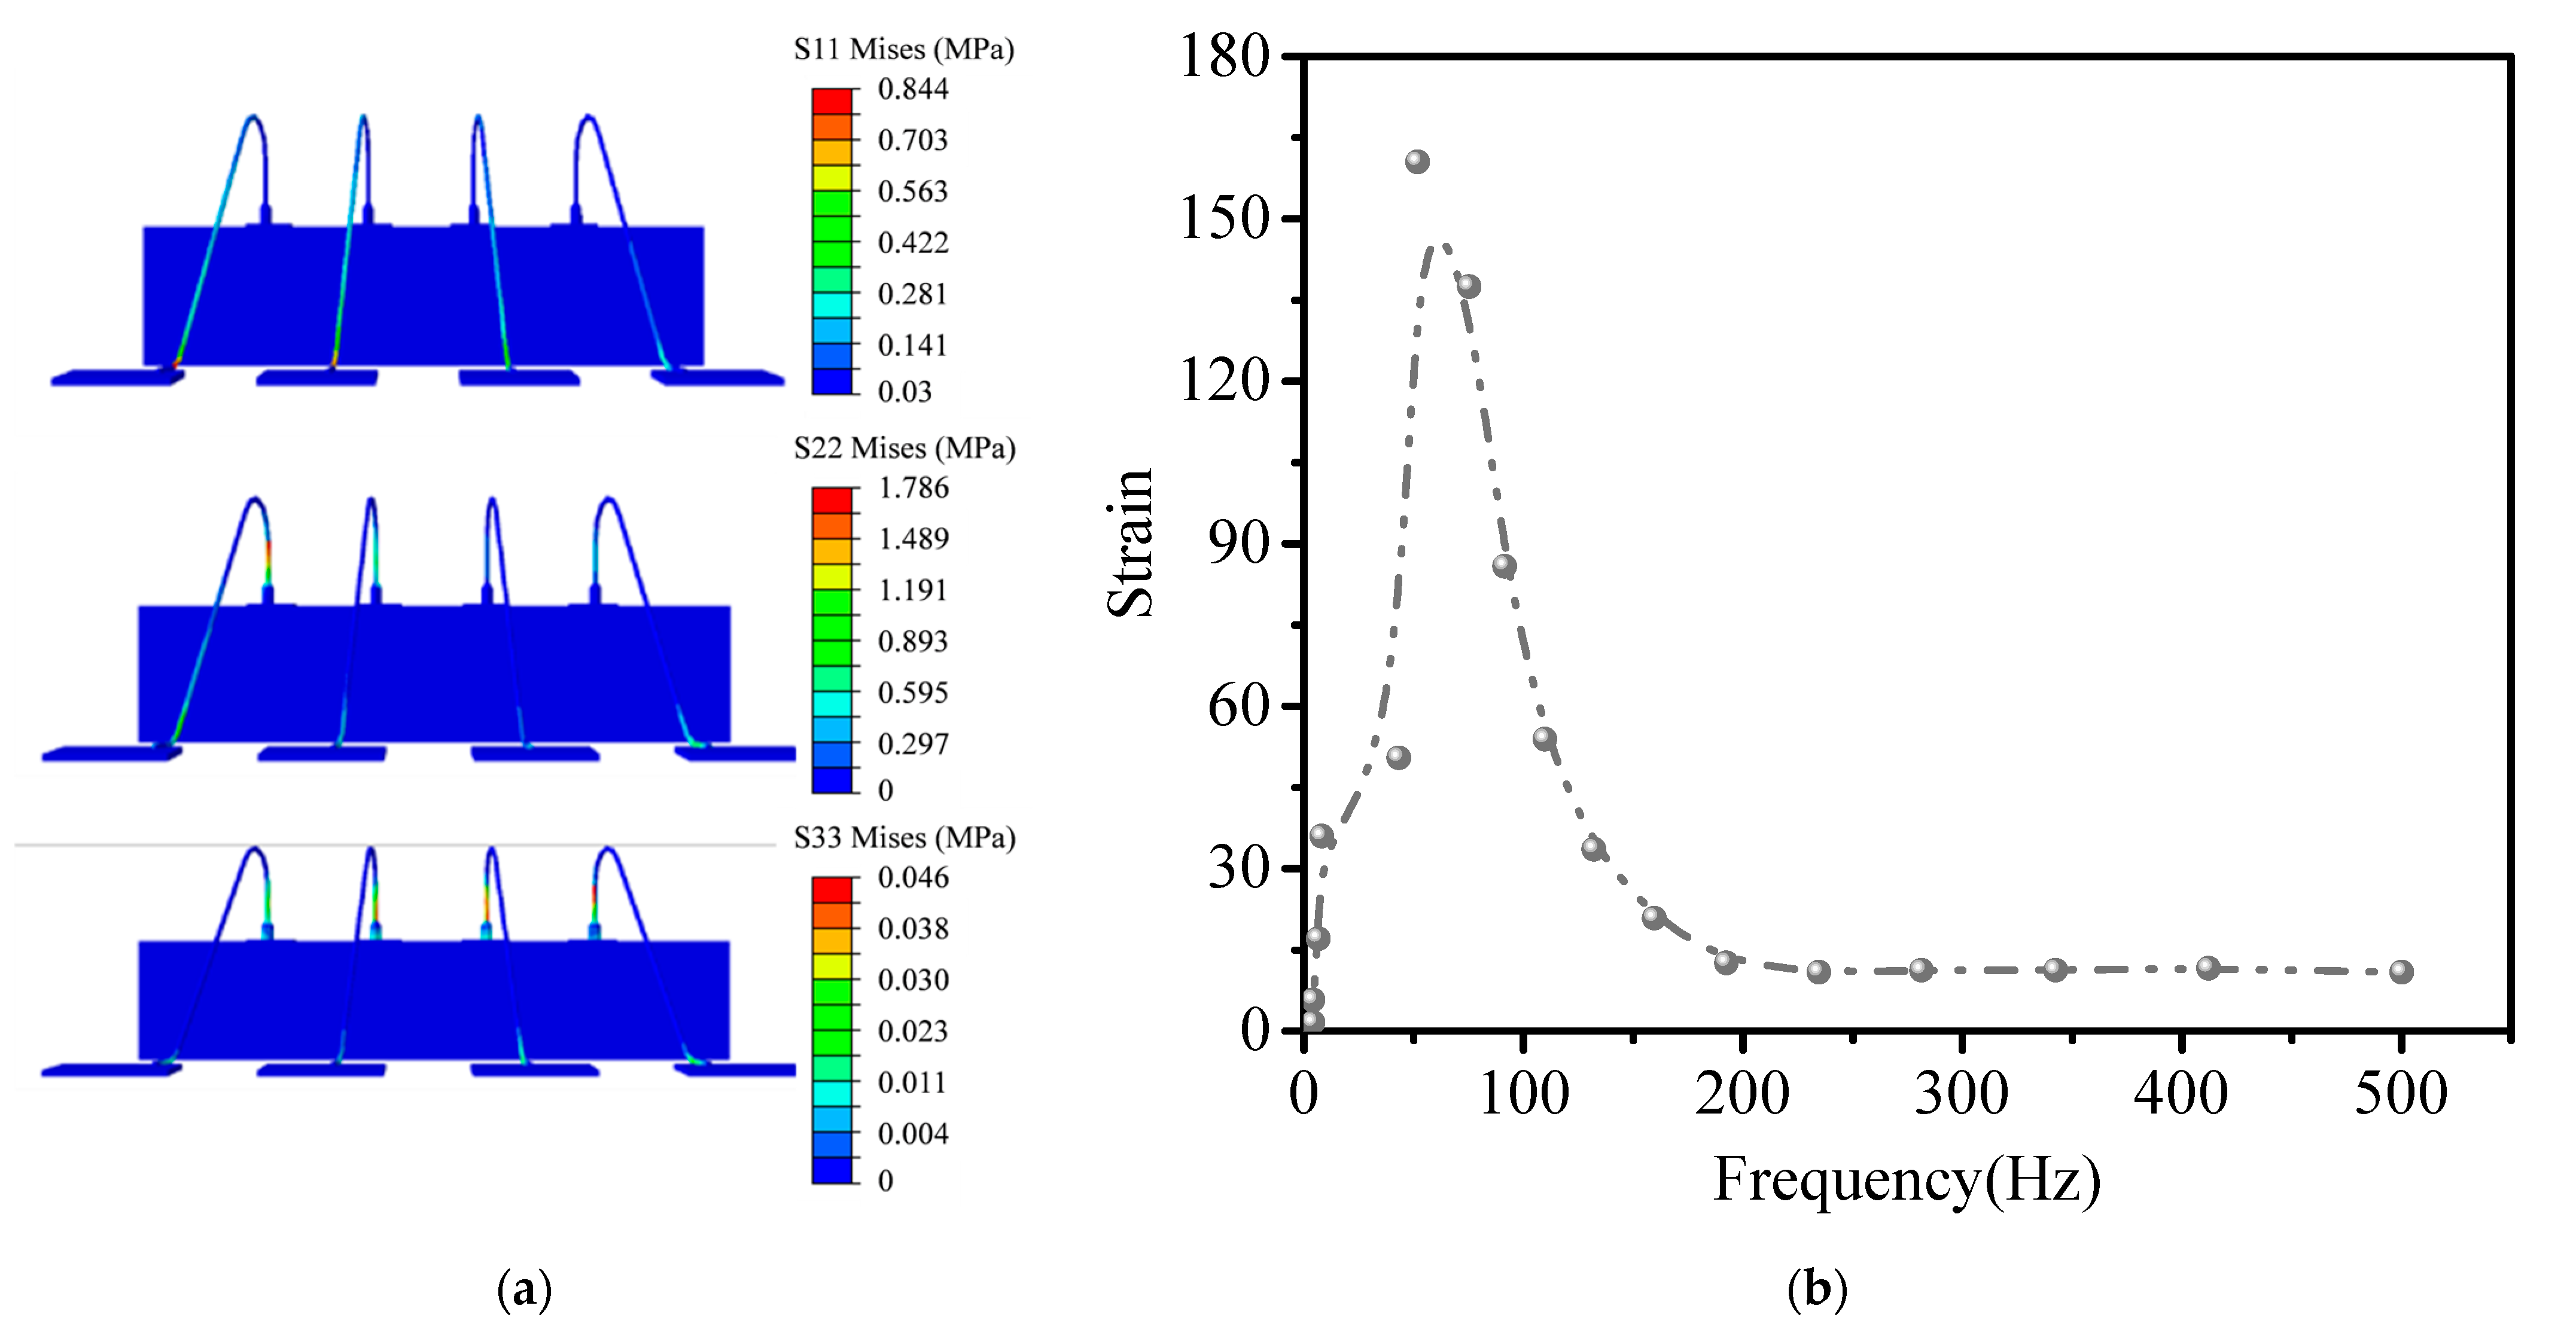
3.2.4. Random Vibration
4. Results and Discussion
4.1. Wire Pull Test
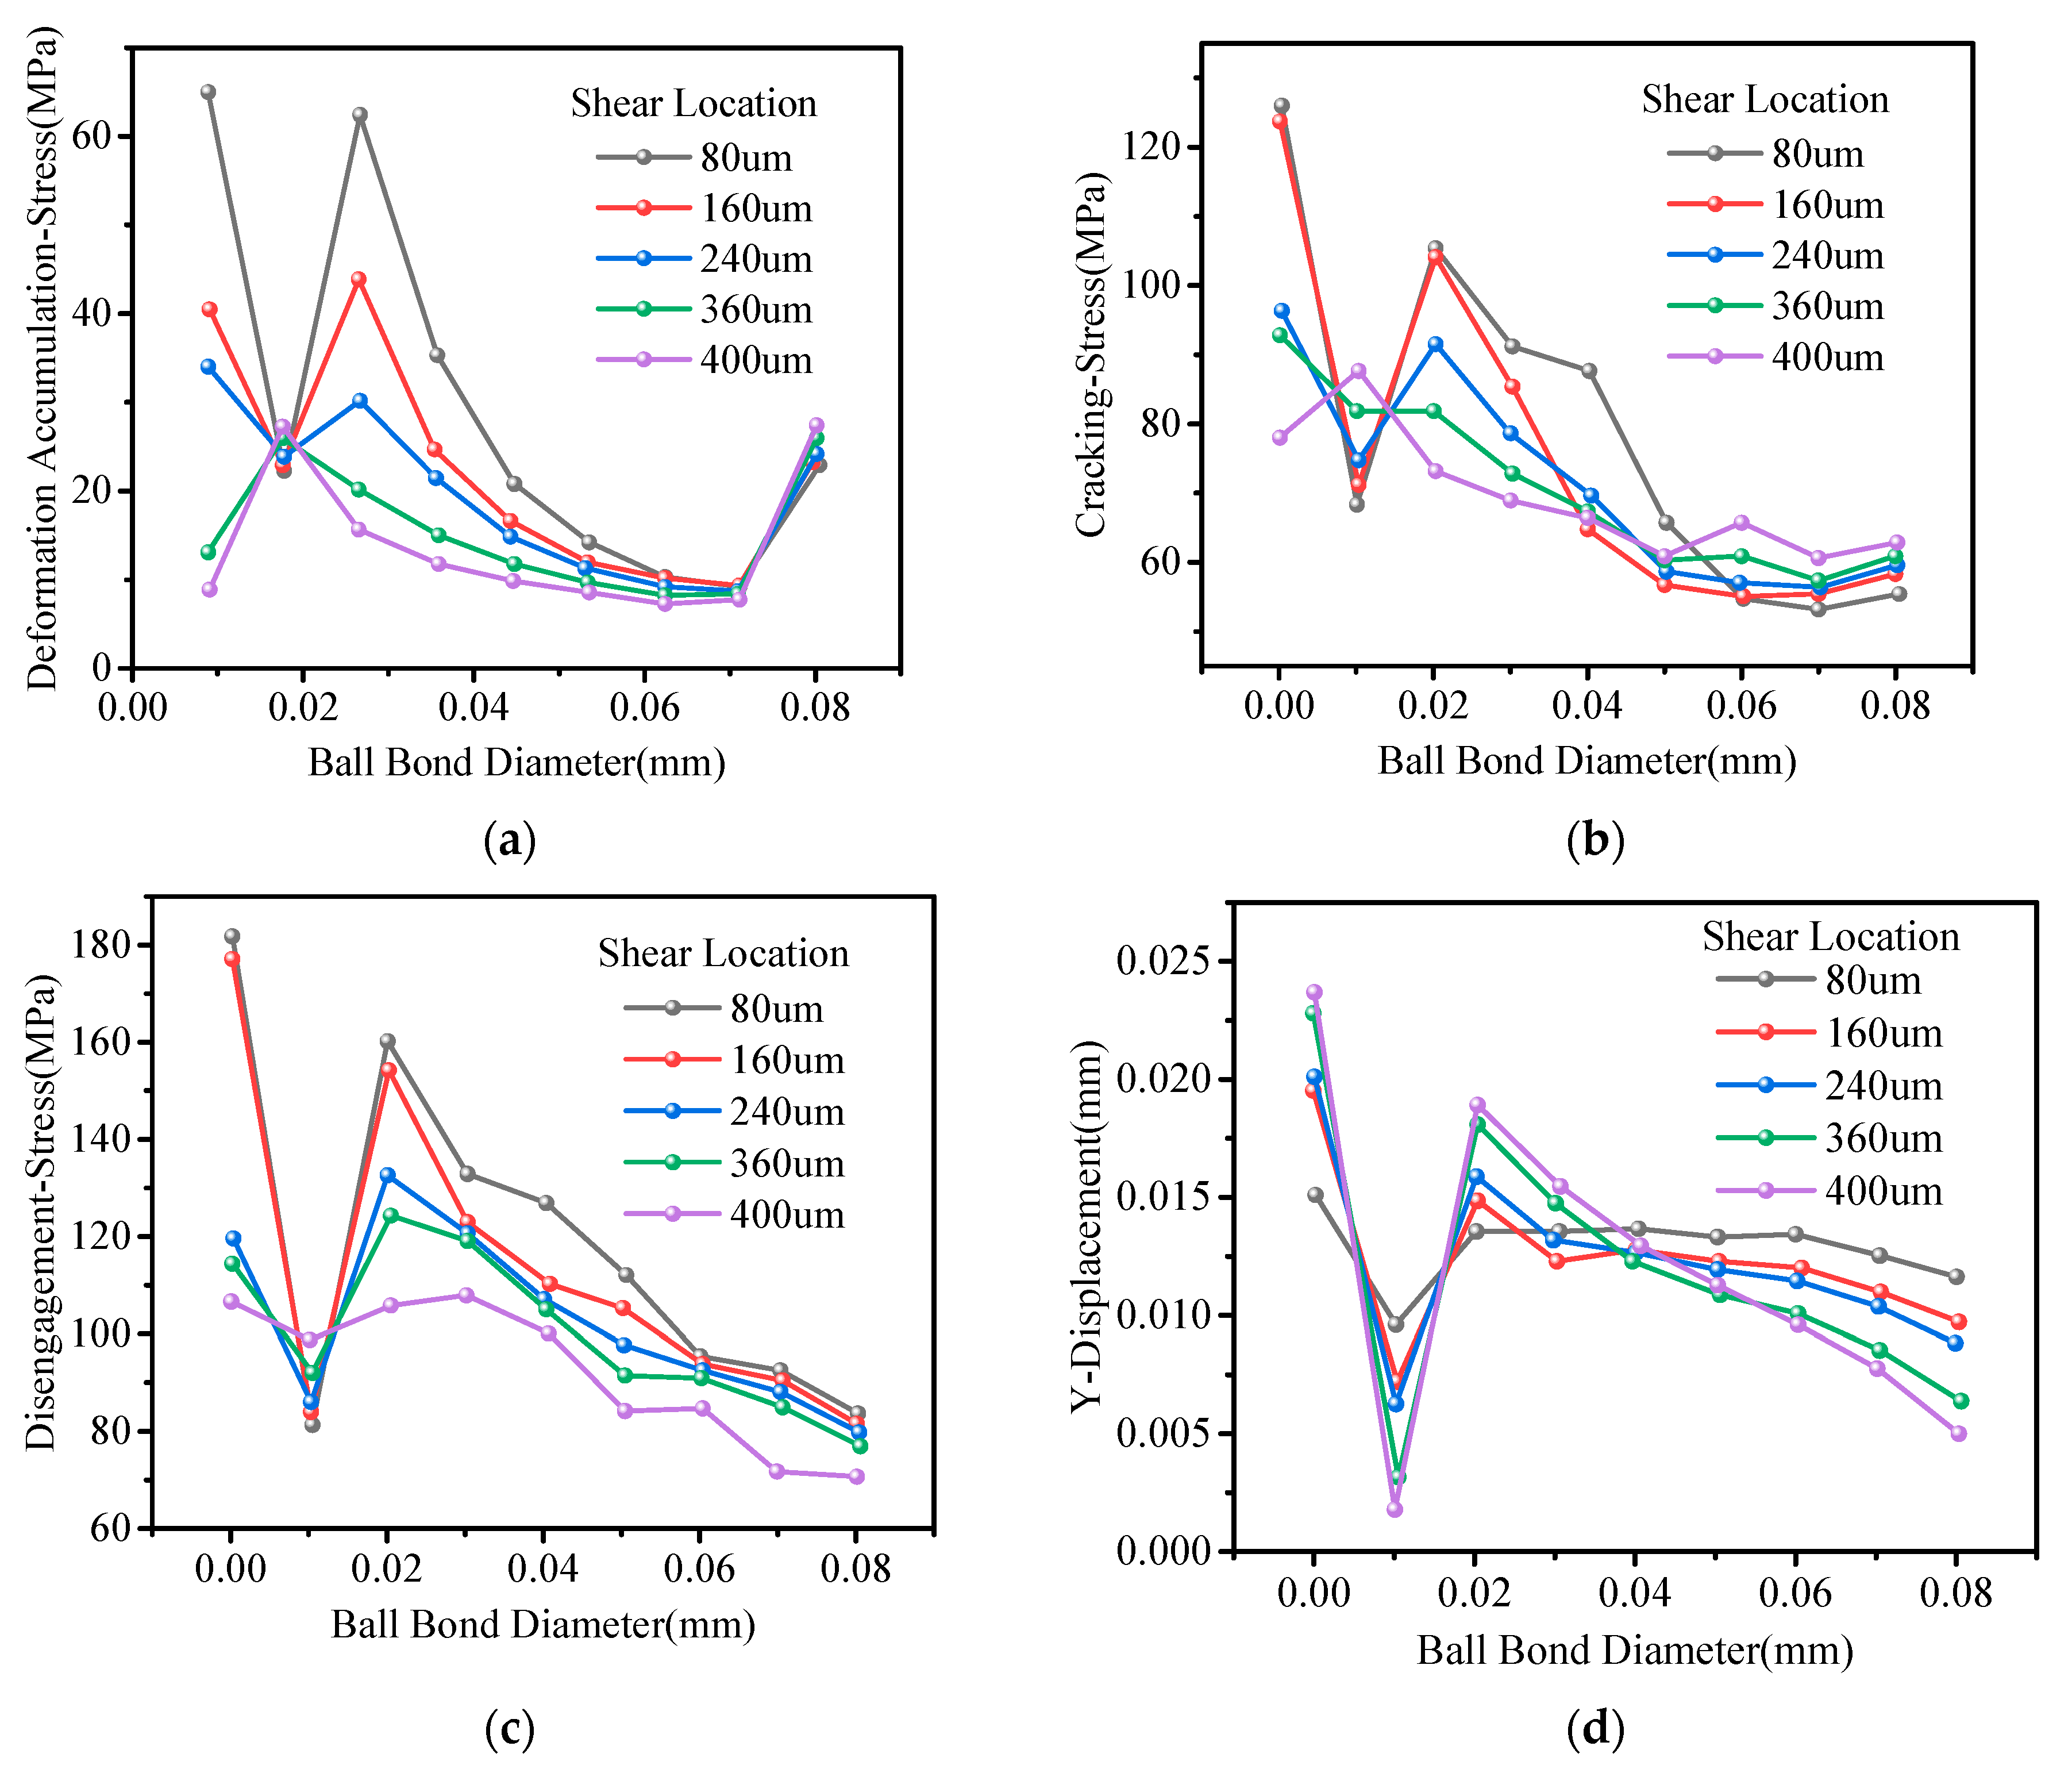
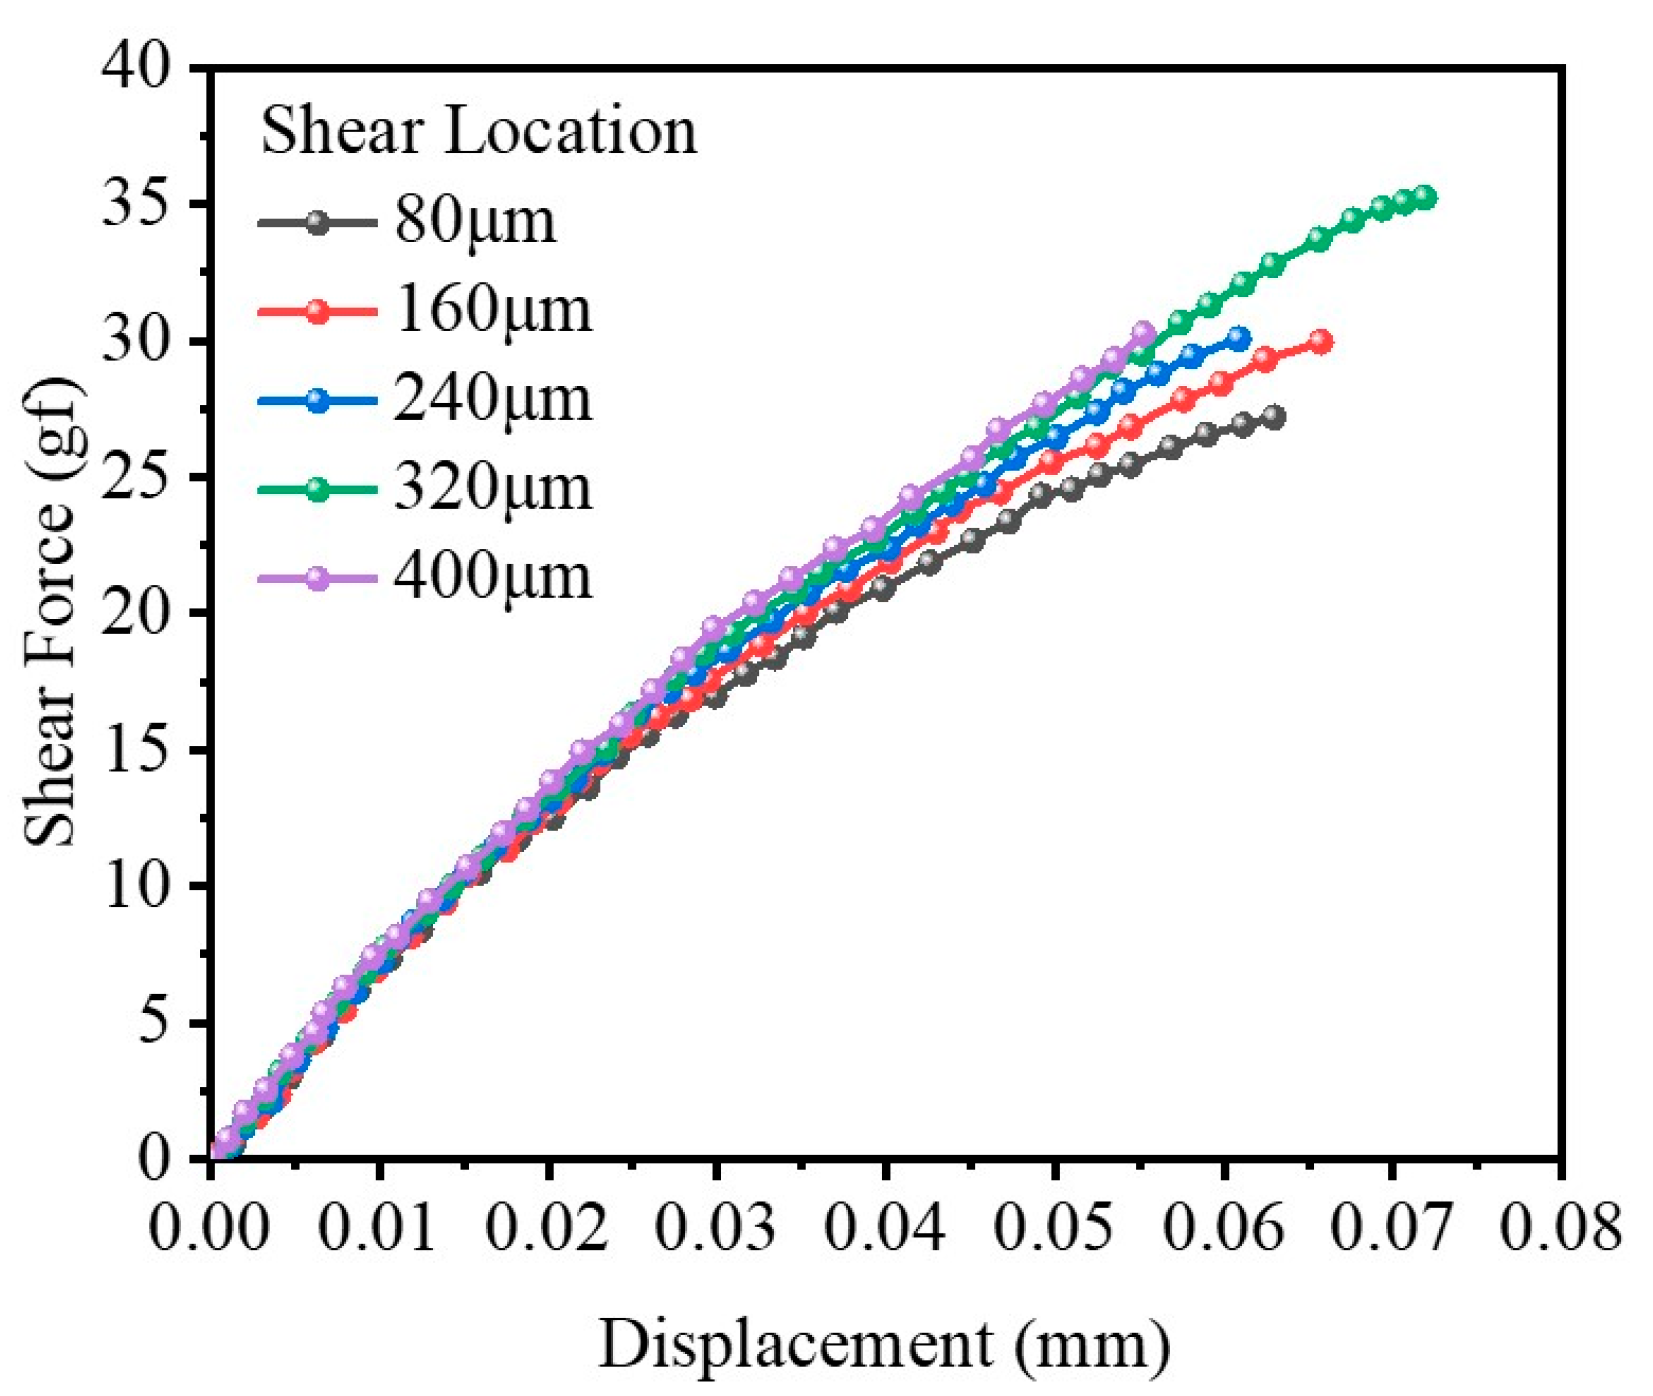
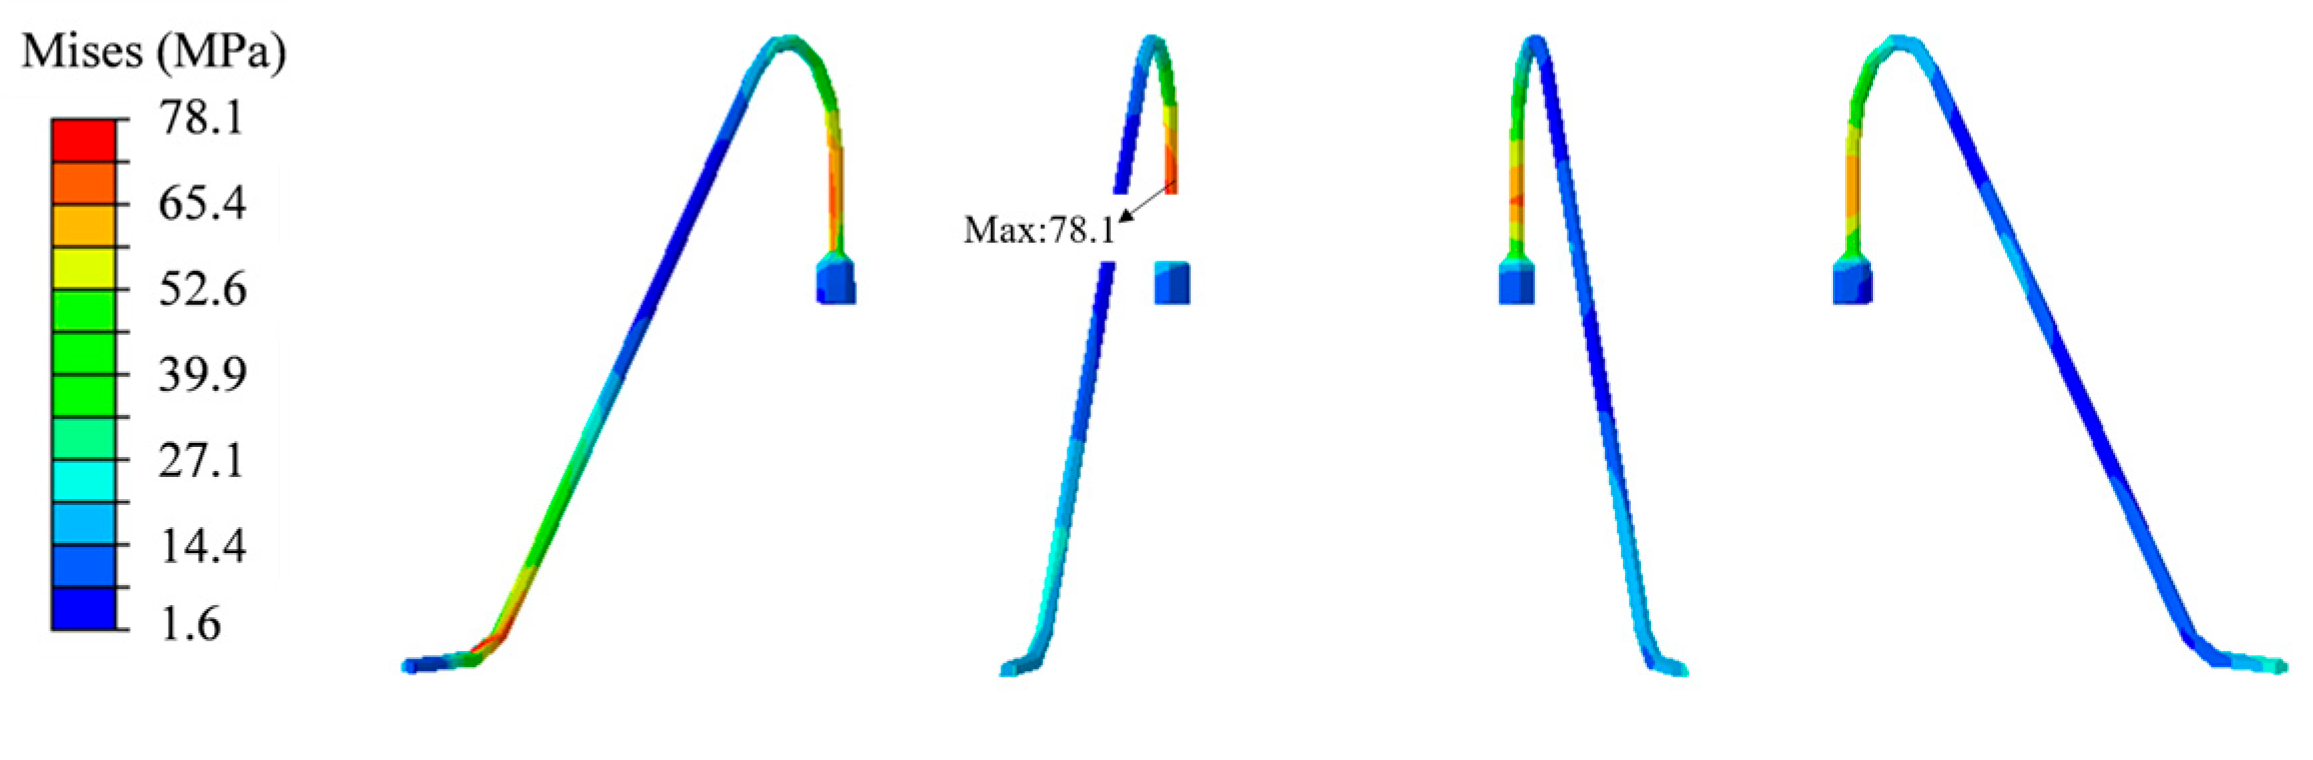
4.2. Wire Bond Shear
4.3. Mechanical Shock
4.4. Random Vibration
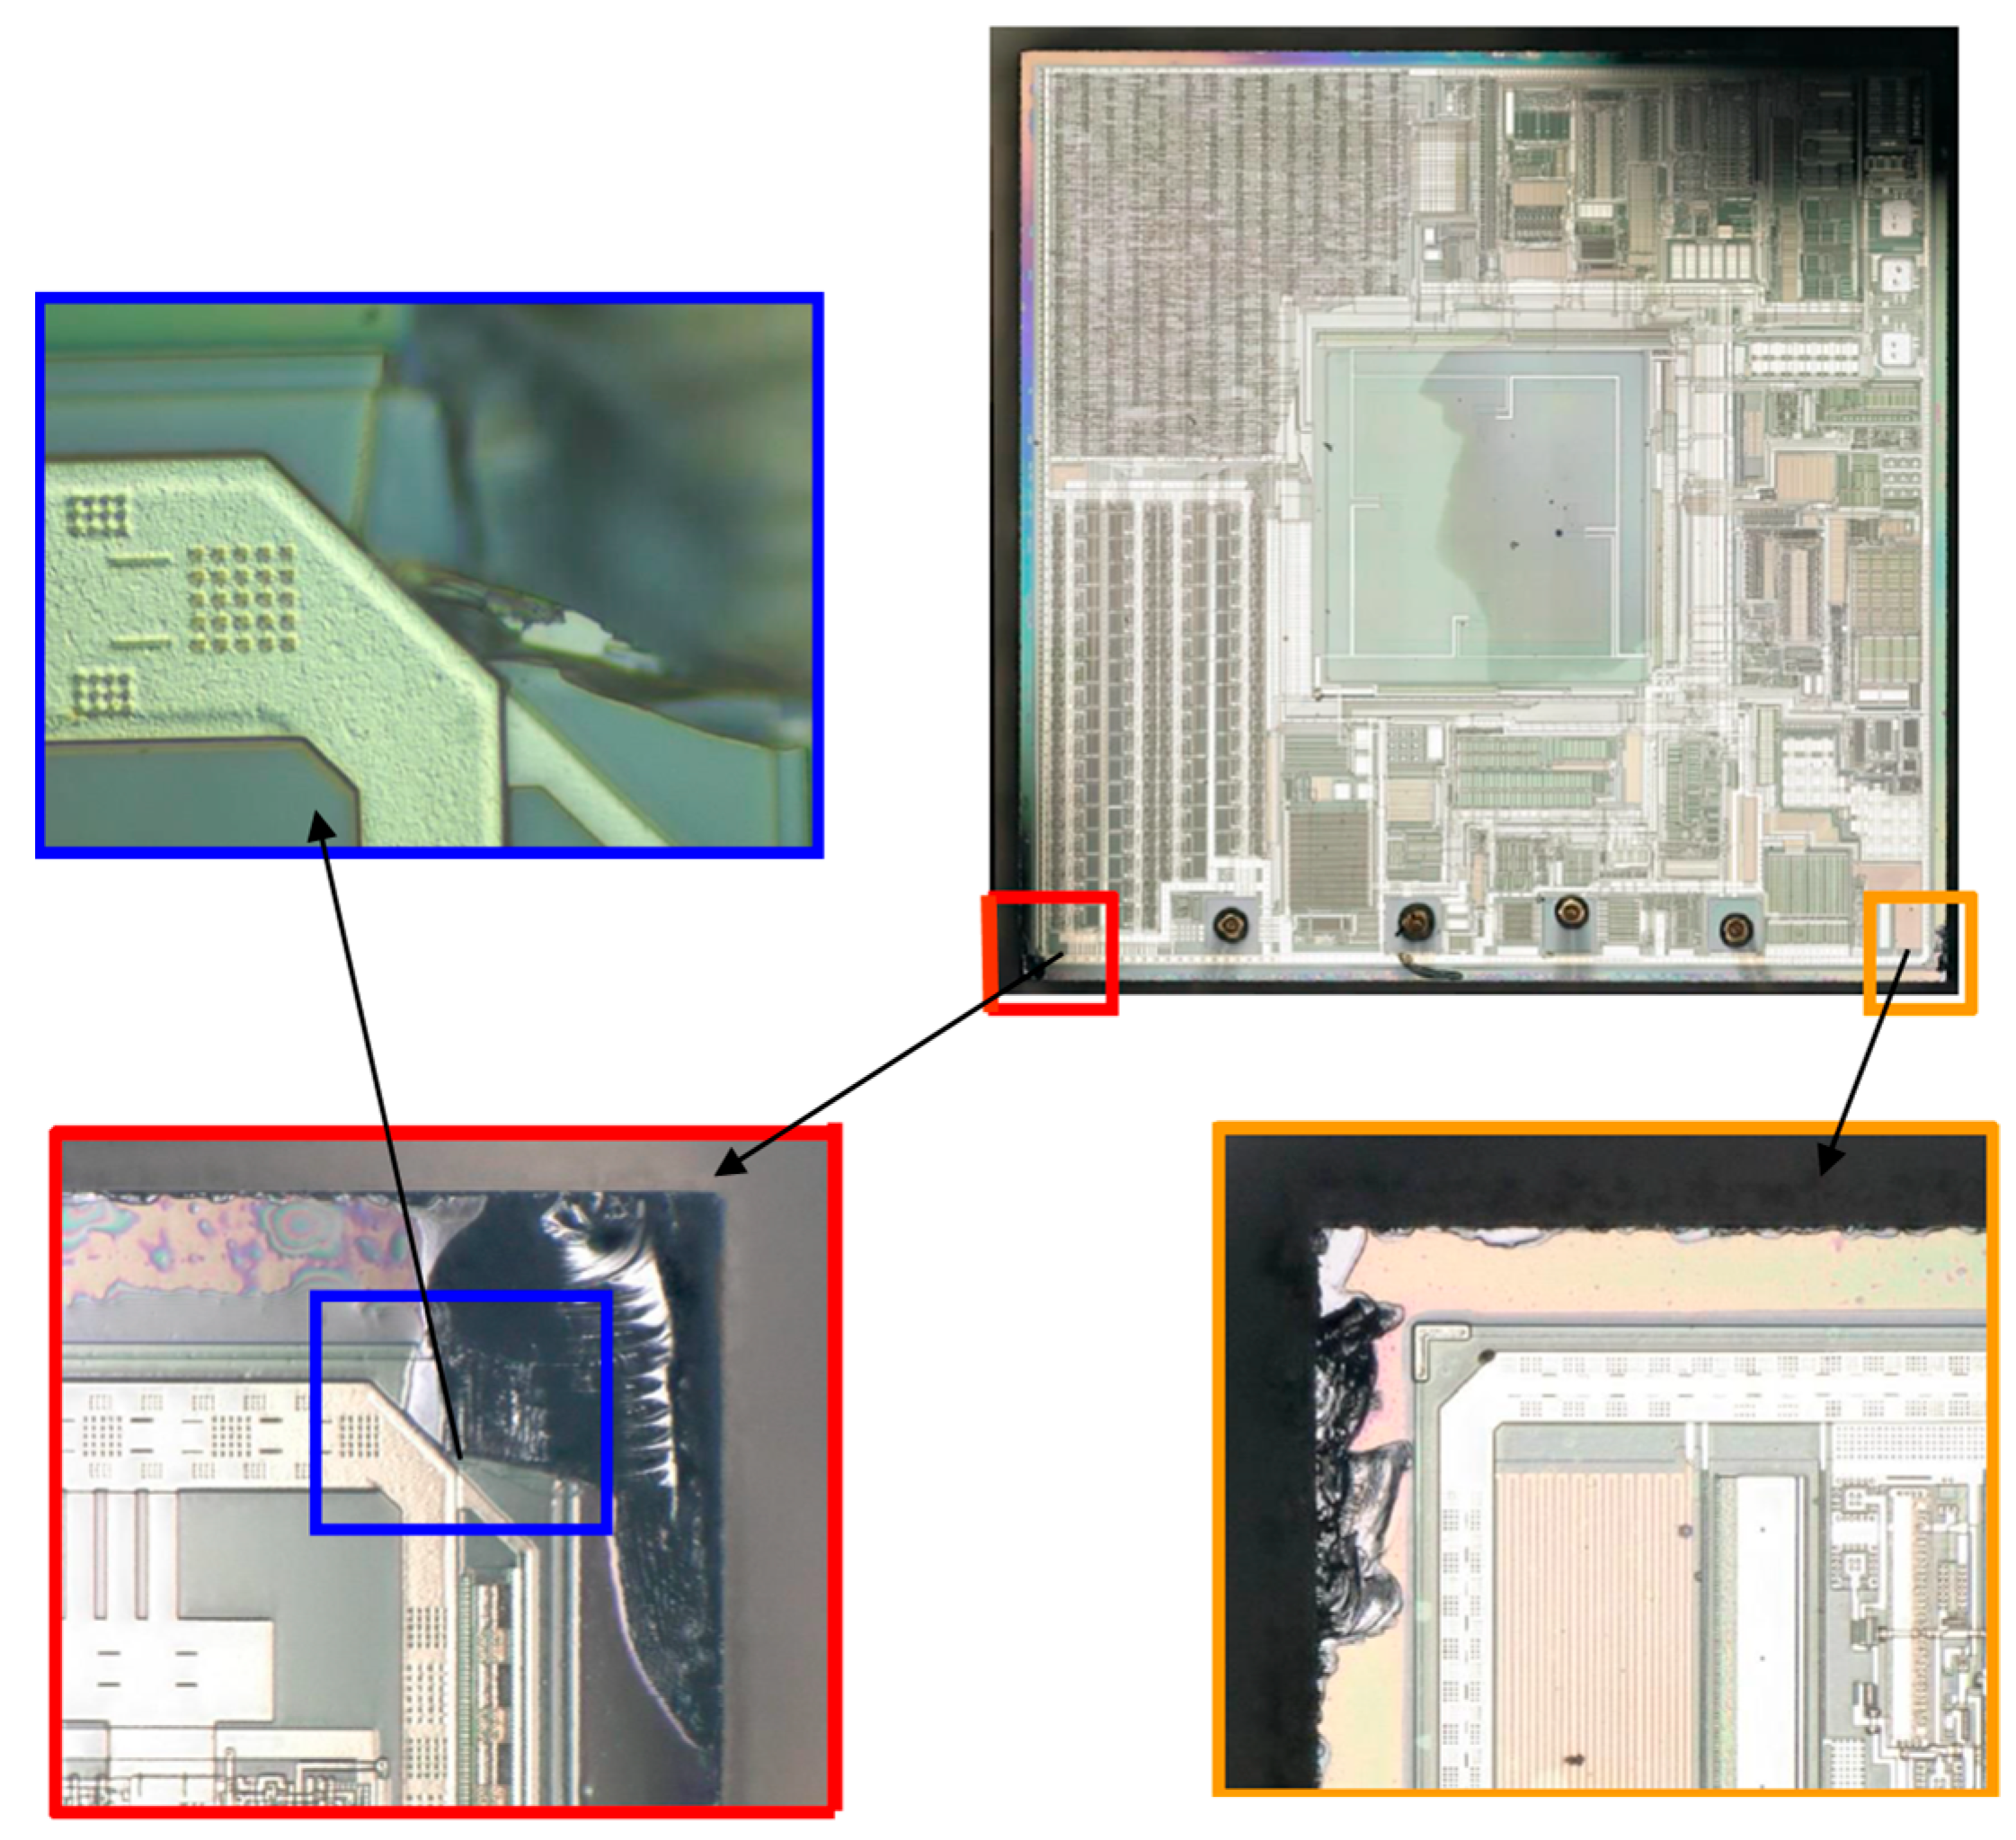
4.5. Degeling Test
5. Conclusions
Author Contributions
Funding
Data Availability Statement
Acknowledgments
Conflicts of Interest
References
- Lemay, J.-F.; Noamani, A.; Unger, J.; Houston, D.J.; Rouhani, H.; Musselmann, K.E. Using wearable sensors to characterize gait after spinal cord injury: Evaluation of test–retest reliability and construct validity. Spinal Cord 2020, 59, 675–683. [Google Scholar] [CrossRef]
- Suman, S.; Punetha, D.; Pandey, S.K. Improvement in sensing characteristics of silicon microstructure based MEMS capacitive sensor for automotive applications. Silicon 2020, 13, 1475–1483. [Google Scholar] [CrossRef]
- Kumari, S.; Rathi, G.; Attri, P.; Kumar, M. Types of sensors and their applications. Int. J. Eng. Res. Dev. 2014, 10, 72–85. [Google Scholar]
- JESD22-A104D; Temperature Cycling. JEDEC Standard: Arlington, VA, USA, 2009.
- Tan, L.C.; Tang, W.Q. Simulation study on thermal-mechanical coupling of antenna array BGA package. In Proceedings of the 17th Asia International Symposium on Mechatronics, Hangzhou, China, 16–19 April 2019. [Google Scholar]
- Kubit, A.; Trzepiecinski, T.; Kłonica, M.; Hebda, M.; Pytel, M. The influence of temperature gradient thermal shock cycles on the interlaminar shear strength of fibre metal laminate composite determined by the short beam test. Compos. B Eng. 2019, 176, 107217. [Google Scholar] [CrossRef]
- Kim, J.S.; Kim, Y.J.; Lee, M.W.; Kim, K.S.; Shibanuma, K. Finite element simulation of drop-weight tear test of API X80 at ductile-brittle transition temperatures. Int. J. Mech. Sci. 2021, 191, 106103. [Google Scholar] [CrossRef]
- Kaneko, S.; Wei, H.Y.; He, Q.Z.; Chen, J.S.; Yoshimura, S. A hyper-reduction computational method for accelerated modeling of thermal cycling-induced plastic deformations. J. Mech. Phys. Solids 2021, 151, 104385. [Google Scholar] [CrossRef]
- Gan, G.S.; Xia, D.Q.; Liu, X.; Liu, C.; Cheng, H.L.; Ming, Z.Z.; Gao, H.Y.; Yang, D.H.; Wu, Y.P. Influence of thermal shock cycles on Sn-37Pb solder bumps. Solder. Surf. Mt. Technol. 2019, 31, 85–92. [Google Scholar] [CrossRef]
- Abbas, A.-A.F.; Greene, C.M.; Srihari, K.; Santos, D.; Pandiarajan, G. Impact of conformal coating material on the long-term reliability of ball grid array solder joints. Procedia Manuf. 2019, 38, 1138–1142. [Google Scholar] [CrossRef]
- Wang, S.Z.; Sun, Y.M.; Sheng, C.; Feng, Z.; Li, R.; Xue, L.H.; Liu, J.; Liu, S. Warpage analysis and prediction of the advanced fan-out technology based on process mechanics. IEEE Trans. Compon. Packag. Manuf. Technol. 2021, 11, 2201–2213. [Google Scholar] [CrossRef]
- Zhang, S.U.; Lee, B.W. Fatigue life evaluation of wire bonds in LED packages using numerical analysis. Microelectron. Reliab. 2014, 54, 2853–2859. [Google Scholar] [CrossRef]
- Krause, T.; Meier, M.; Brunzendorf, J. Influence of thermal shock of piezoelectric pressure sensors on the measurement of explosion pressures. J. Loss Prev. Process Ind. 2021, 71, 104523. [Google Scholar] [CrossRef]
- Ren, J.W.; Zhang, H.H.; Liu, S.; Wang, J.D. Simulations and modeling of planar amperometric oxygen sensors. Sens. Actuators B Chem. 2007, 123, 135–141. [Google Scholar] [CrossRef]
- Zhang, Z.Y.; Jin, M.; Liu, S. Thick film resistors on stainless steel as sensing elements for strain sensor applications. Sens. Actuators A Phys. 2012, 179, 50–55. [Google Scholar] [CrossRef]
- Mirjavadi, S.S.; Forsat, M.; Nikookar, M.; Barati, M.R.; Hamouda, A.M.S. Nonlinear forced vibrations of sandwich smart nanobeams with two-phase piezo-magnetic face sheets. Eur. Phys. J. Plus 2019, 134, 508. [Google Scholar] [CrossRef]
- Mirjavadi, S.S.; Afshari, B.M.; Barati, M.R.; Hamouda, A.M.S. Transient response of porous inhomogeneous nanobeams due to various impulsive loads based on nonlocal strain gradient elasticity. Int. J. Mech. Mater. Des. 2019, 16, 57–68. [Google Scholar] [CrossRef]
- Fiori, V.; Beng, L.T.; Downey, S.; Gallois-Garreignot, S.; Orain, S. 3D multi scale modeling of wire bonding induced peeling in Cu/Low-k interconnects: Application of an energy based criteria and correlations with experiments. In Proceedings of the 57th Electronic Components and Technology Conference, Sparks, NV, USA, 29 May–1 June 2007; pp. 256–263. [Google Scholar]
- Mazzei, S.; Madia, M.; Beretta, S.; Mancaleoni, A.; Aparo, S. Analysis of Cu-wire pull and shear test failure modes under ageing cycles and finite element modelling of Si-crack propagation. Microelectron. Reliab. 2014, 54, 2501–2512. [Google Scholar] [CrossRef]
- Lau, J.; Wu, S.; Lau, J.M. Pull force and displacement of Cu/Au wire interconnects. J. Electron. Packag. 2012, 134, 041002. [Google Scholar] [CrossRef]
- Che, F.X.; Wai, L.C.; Chai, T.C. Failure mode and mechanism analysis for Cu wire bond on Cu/Low-k chip by wire pull test and finite-element analysis. IEEE Trans. Device Mater. Reliab. 2018, 18, 163–172. [Google Scholar] [CrossRef]
- Chen, Z.H.; Liu, Y.; Liu, S. Modeling of copper wire bonding process on high power LEDs. Microelectron. Reliab. 2011, 51, 171–178. [Google Scholar] [CrossRef]
- Kazys, R.; Vaskeliene, V. High temperature ultrasonic transducers: A review. Sensors 2021, 21, 3200. [Google Scholar] [CrossRef]
- Zhao, L.H.; Shang, H.P.; Tian, B.H.; Wang, D.H.; Liu, Y.; Wang, W.B. Manufacturability and reliability optimization for metallization of SiC piezoresistive pressure sensors. J. Mater. Sci. Mater. Electron. 2021, 32, 17637–17644. [Google Scholar] [CrossRef]
- Teufl, W.; Miezal, M.; Taetz, B.; Fröhlich, M.; Bleser, G. Validity, test-retest reliability and long-term stability of magnetometer free inertial sensor based 3D joint kinematics. Sensors 2018, 18, 1980. [Google Scholar] [CrossRef] [PubMed]
- Silva, I.; Guedes, L.A.; Portugal, P.; Vasques, F. Reliability and availability evaluation of wireless sensor networks for industrial applications. Sensors 2012, 12, 806–838. [Google Scholar] [CrossRef] [PubMed]
- Automotive Electronics Council (AEC). Failure Mechanism Based Stress Test Qualification for Integrated Circuits-Rev-H. 2014. Available online: http://www.aecouncil.com/Documents/AEC_Q100_Rev_H_Base_Document.pdf (accessed on 28 August 2023).
- Ikonen, M. Power Cycling Lifetime Estimation of IGBT Power Modules Based on Chip Temperature Modeling. Ph.D. Thesis, Lappeenranta University of Technology, Lappeenranta, Finland, 2012. [Google Scholar]
- Durand, C.; Klingler, M.; Coutellier, D.; Naceur, H. Power cycling reliability of power module: A survey. IEEE Trans. Device Mater. Reliab. 2016, 16, 80–97. [Google Scholar] [CrossRef]
- Bielen, J.; Gommans, J.J.; Theunis, F. Prediction of high cycle fatigue in aluminum bond wires: A physics of failure approach combining experiments and multi-physics simulations. In Proceedings of the 7th IEEE International Conference on Thermal, Mechanical and Multiphysics Simulation and Experiments in Micro-Electronics and Micro-Systems, Como, Italy, 24–26 April 2006; pp. 1–7. [Google Scholar]
- Ramminger, S.; Seliger, N.; Wachutka, G. Reliability model for Al wire bonds subjected to heel crack failures. Microelectron. Reliab. 2000, 40, 1521–1525. [Google Scholar] [CrossRef]


| Automotive Sensor Size Parameters | Structure (Unit: mm3) |
|---|---|
| Basal plate | 180 × 110 × 10 |
| Chip | 38 × 38 × 6.5 |
| Chip solder Solder | 4 × 3 × 1 7 × 7 × 1 |
| Wire diameter | 0.03 |
| Silica gel | 74 × 74 × 31 |
| Materials | Young’s Modulus (MPa) | Poisson’s Ratio | Yield Stress (MPa) | CTE (ppm/°C) |
|---|---|---|---|---|
| Substrate | 300,000 | 0.26 | / | 5.8 |
| Chip | 190,000,000 | 0.28 | / | 2.4 |
| Gold wire | 79,000 | 0.42 | 270 | 14.1 |
| Silica gel | / | 0.495 | / | 30 |
| Solder | 56,000 | 0.38 | 34.2 | 22 |
| Cover | 13,100 | 0.3 | / | 2.6 |
| Times | Modulus (MPa) | |
|---|---|---|
| 1 | 0 | 26.979 |
| 2 | 0.542 | 19.042 |
| 3 | 1.652 | 1.618 |
| 4 | 2.886 | 1.649 |
| 5 | 2.939 | 1.649 |
| 6 | 2.945 | 1.653 |
| 7 | 42.96 | 0.75 |
| 8 | INF | 0.518 |
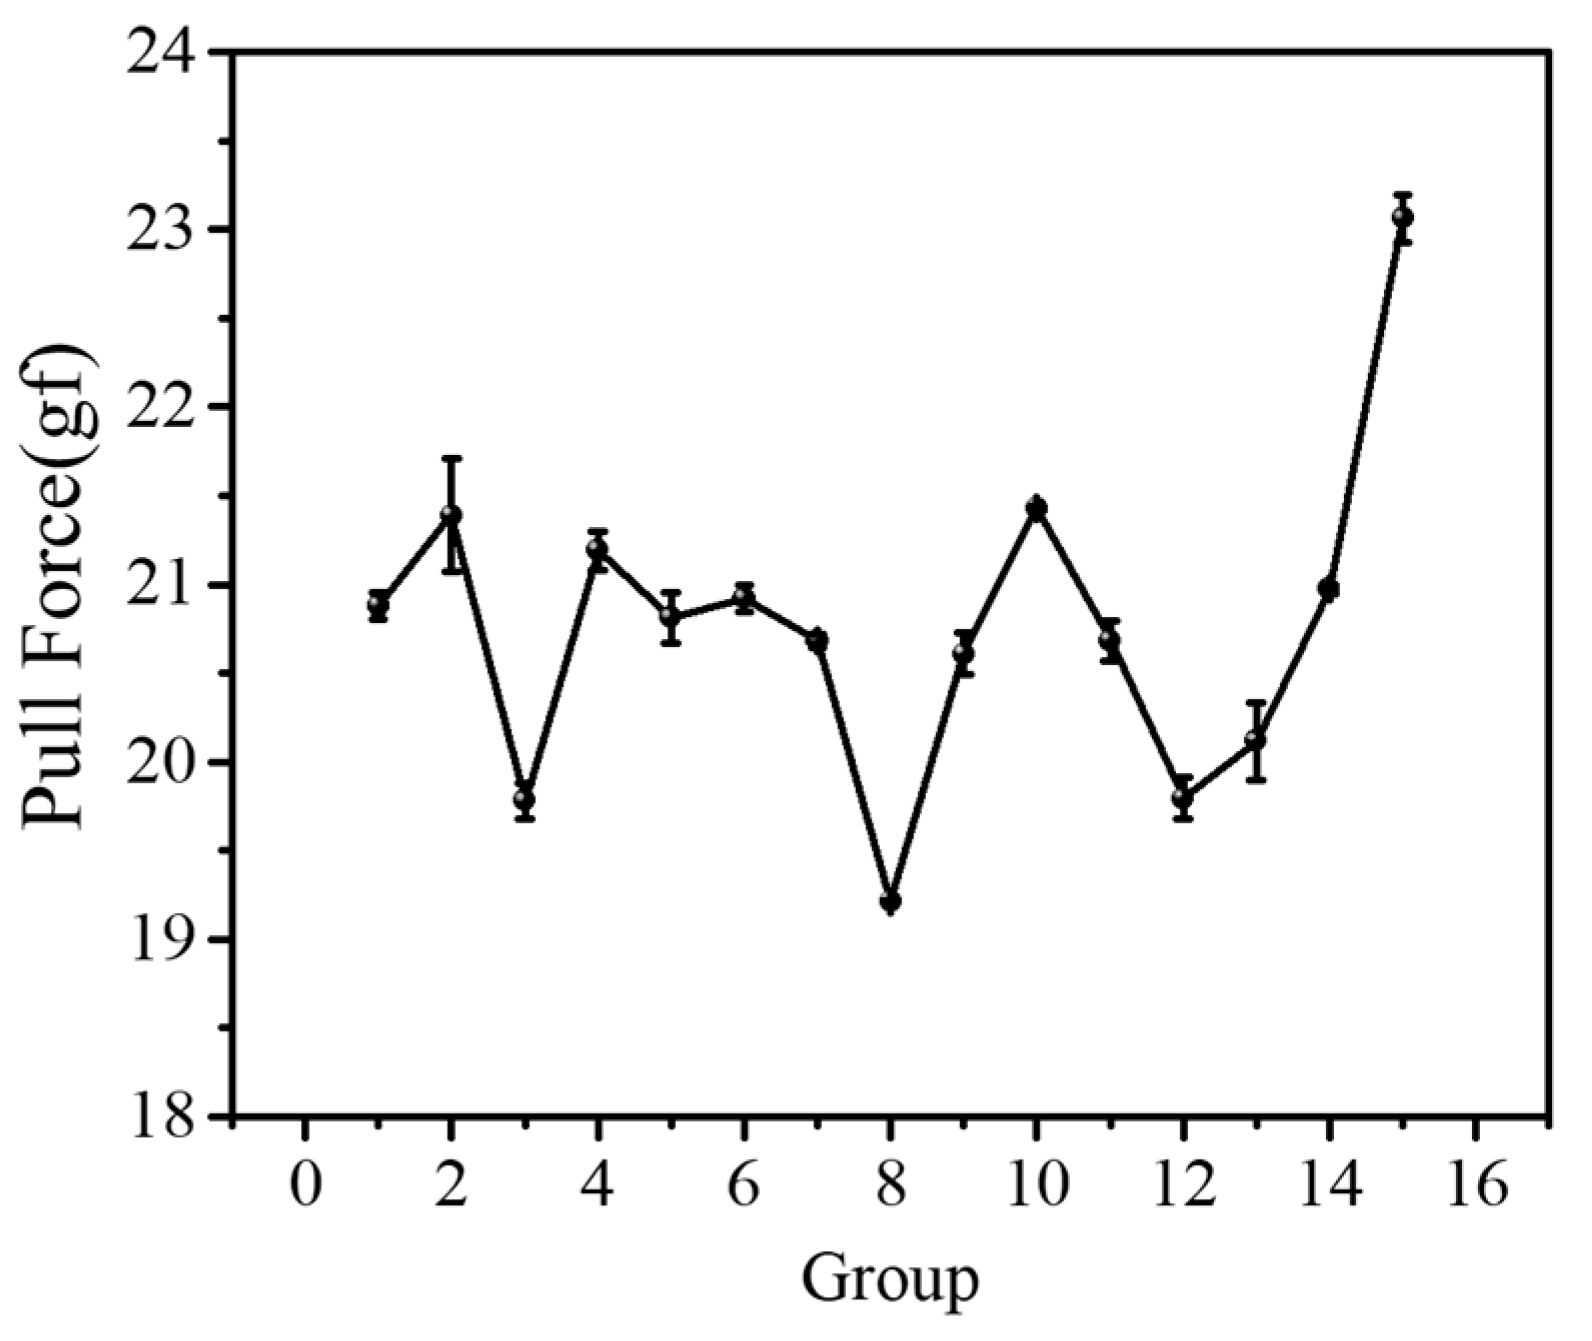
| Group | Average (g) | Variance |
|---|---|---|
| 1 | 20.7563 | 4.032 |
| 2 | 21.163 | 6.33 |
| 3 | 19.9845 | 1.342 |
| 4 | 21.344 | 3.628 |
| 5 | 20.417 | 3.208 |
| 6 | 20.9918 | 3.458 |
| 7 | 20.377 | 3.872 |
| 8 | 19.5038 | 4.184 |
| 9 | 20.4275 | 3.78 |
| 10 | 21.7535 | 2.726 |
| 11 | 20.924 | 2.612 |
| 12 | 20.216 | 5.884 |
| 13 | 20.4825 | 4.248 |
| 14 | 20.763 | 3.846 |
| 15 | 22.0763 | 5.262 |
| Serial Number | 1 | 2 | 3 | 4 | 5 | 6 | 7 | 8 | 9 | 10 |
|---|---|---|---|---|---|---|---|---|---|---|
| Failed shear (grams) | 42.6 | 43.8 | 41.8 | 39.8 | 40.1 | 41.3 | 40.8 | 42.4 | 42.1 | 43.2 |
Disclaimer/Publisher’s Note: The statements, opinions and data contained in all publications are solely those of the individual author(s) and contributor(s) and not of MDPI and/or the editor(s). MDPI and/or the editor(s) disclaim responsibility for any injury to people or property resulting from any ideas, methods, instructions or products referred to in the content. |
© 2023 by the authors. Licensee MDPI, Basel, Switzerland. This article is an open access article distributed under the terms and conditions of the Creative Commons Attribution (CC BY) license (https://creativecommons.org/licenses/by/4.0/).
Share and Cite
Sun, Y.; Ma, K.; Song, Y.; Zi, T.; Liu, X.; Feng, Z.; Zhou, Y.; Liu, S. Failure Analysis for Gold Wire Bonding of Sensor Packaging Based on Experimental and Numerical Methods. Micromachines 2023, 14, 1695. https://doi.org/10.3390/mi14091695
Sun Y, Ma K, Song Y, Zi T, Liu X, Feng Z, Zhou Y, Liu S. Failure Analysis for Gold Wire Bonding of Sensor Packaging Based on Experimental and Numerical Methods. Micromachines. 2023; 14(9):1695. https://doi.org/10.3390/mi14091695
Chicago/Turabian StyleSun, Yameng, Kun Ma, Yifan Song, Tongtong Zi, Xun Liu, Zheng Feng, Yang Zhou, and Sheng Liu. 2023. "Failure Analysis for Gold Wire Bonding of Sensor Packaging Based on Experimental and Numerical Methods" Micromachines 14, no. 9: 1695. https://doi.org/10.3390/mi14091695
APA StyleSun, Y., Ma, K., Song, Y., Zi, T., Liu, X., Feng, Z., Zhou, Y., & Liu, S. (2023). Failure Analysis for Gold Wire Bonding of Sensor Packaging Based on Experimental and Numerical Methods. Micromachines, 14(9), 1695. https://doi.org/10.3390/mi14091695