Silver Nanoprism Enhanced Colorimetry for Precise Detection of Dissolved Oxygen

Abstract
1. Introduction
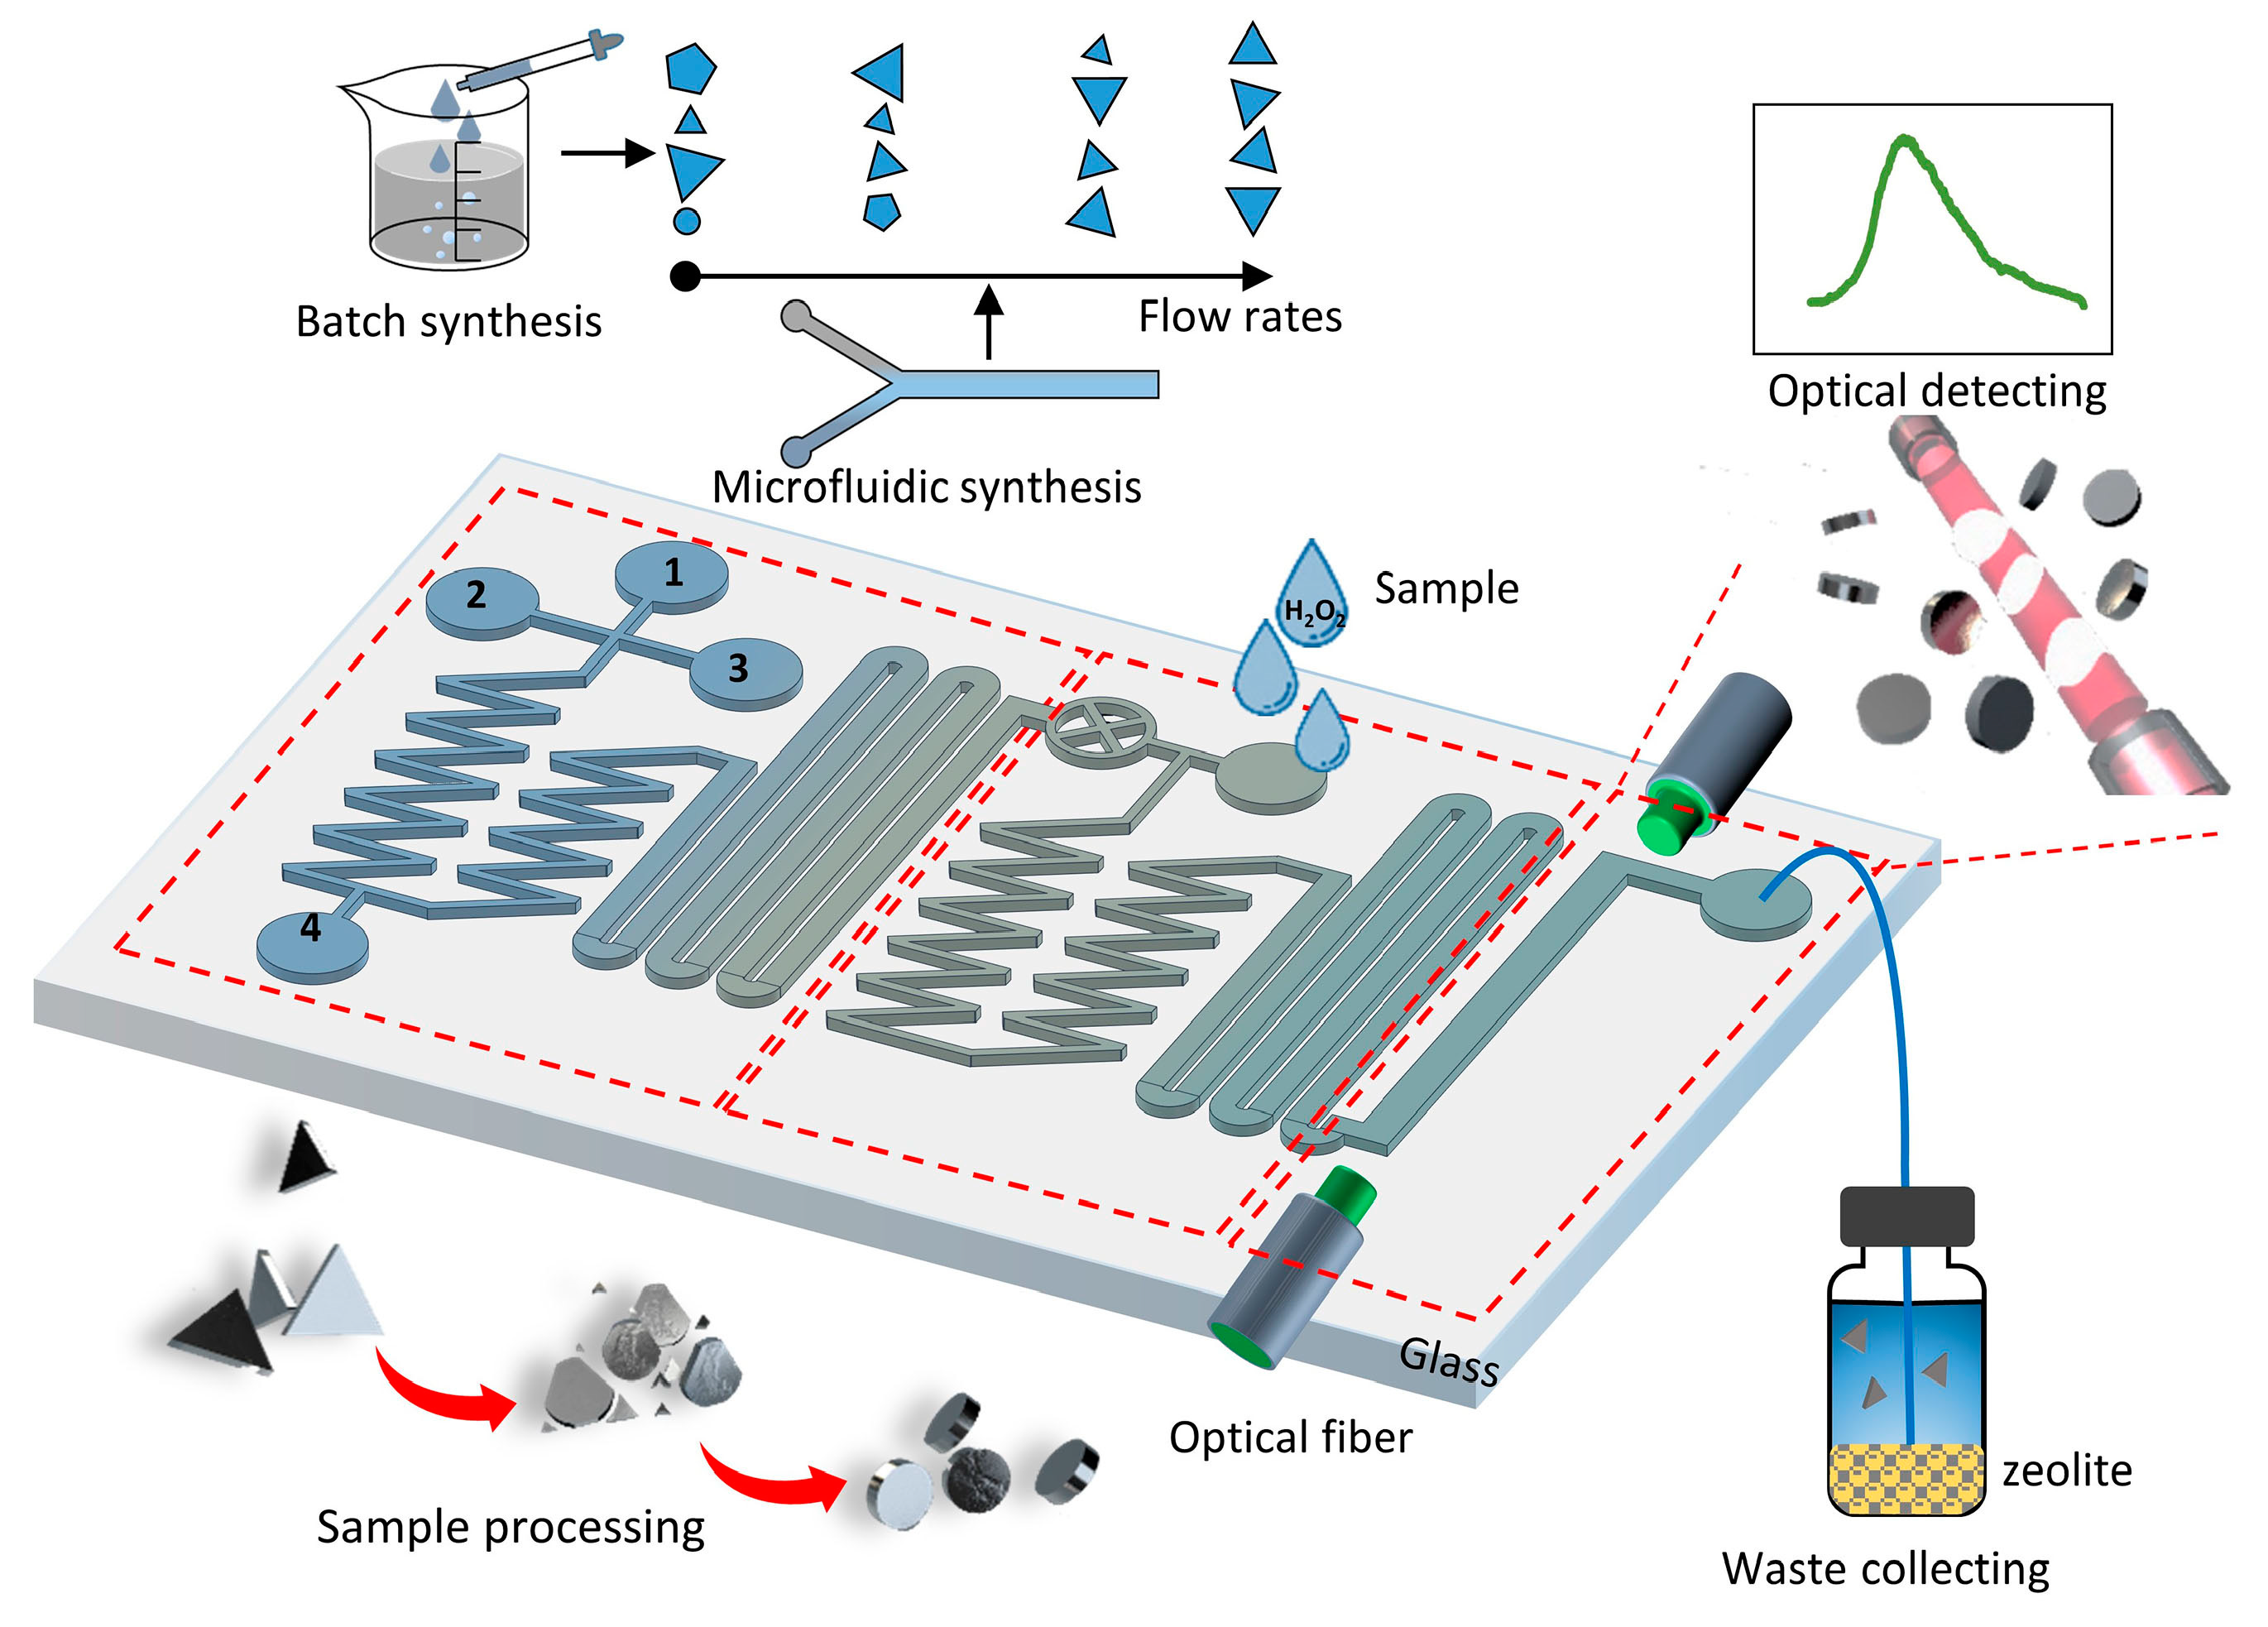
2. Working Principle and Design
3. Experimental Results and Discussions
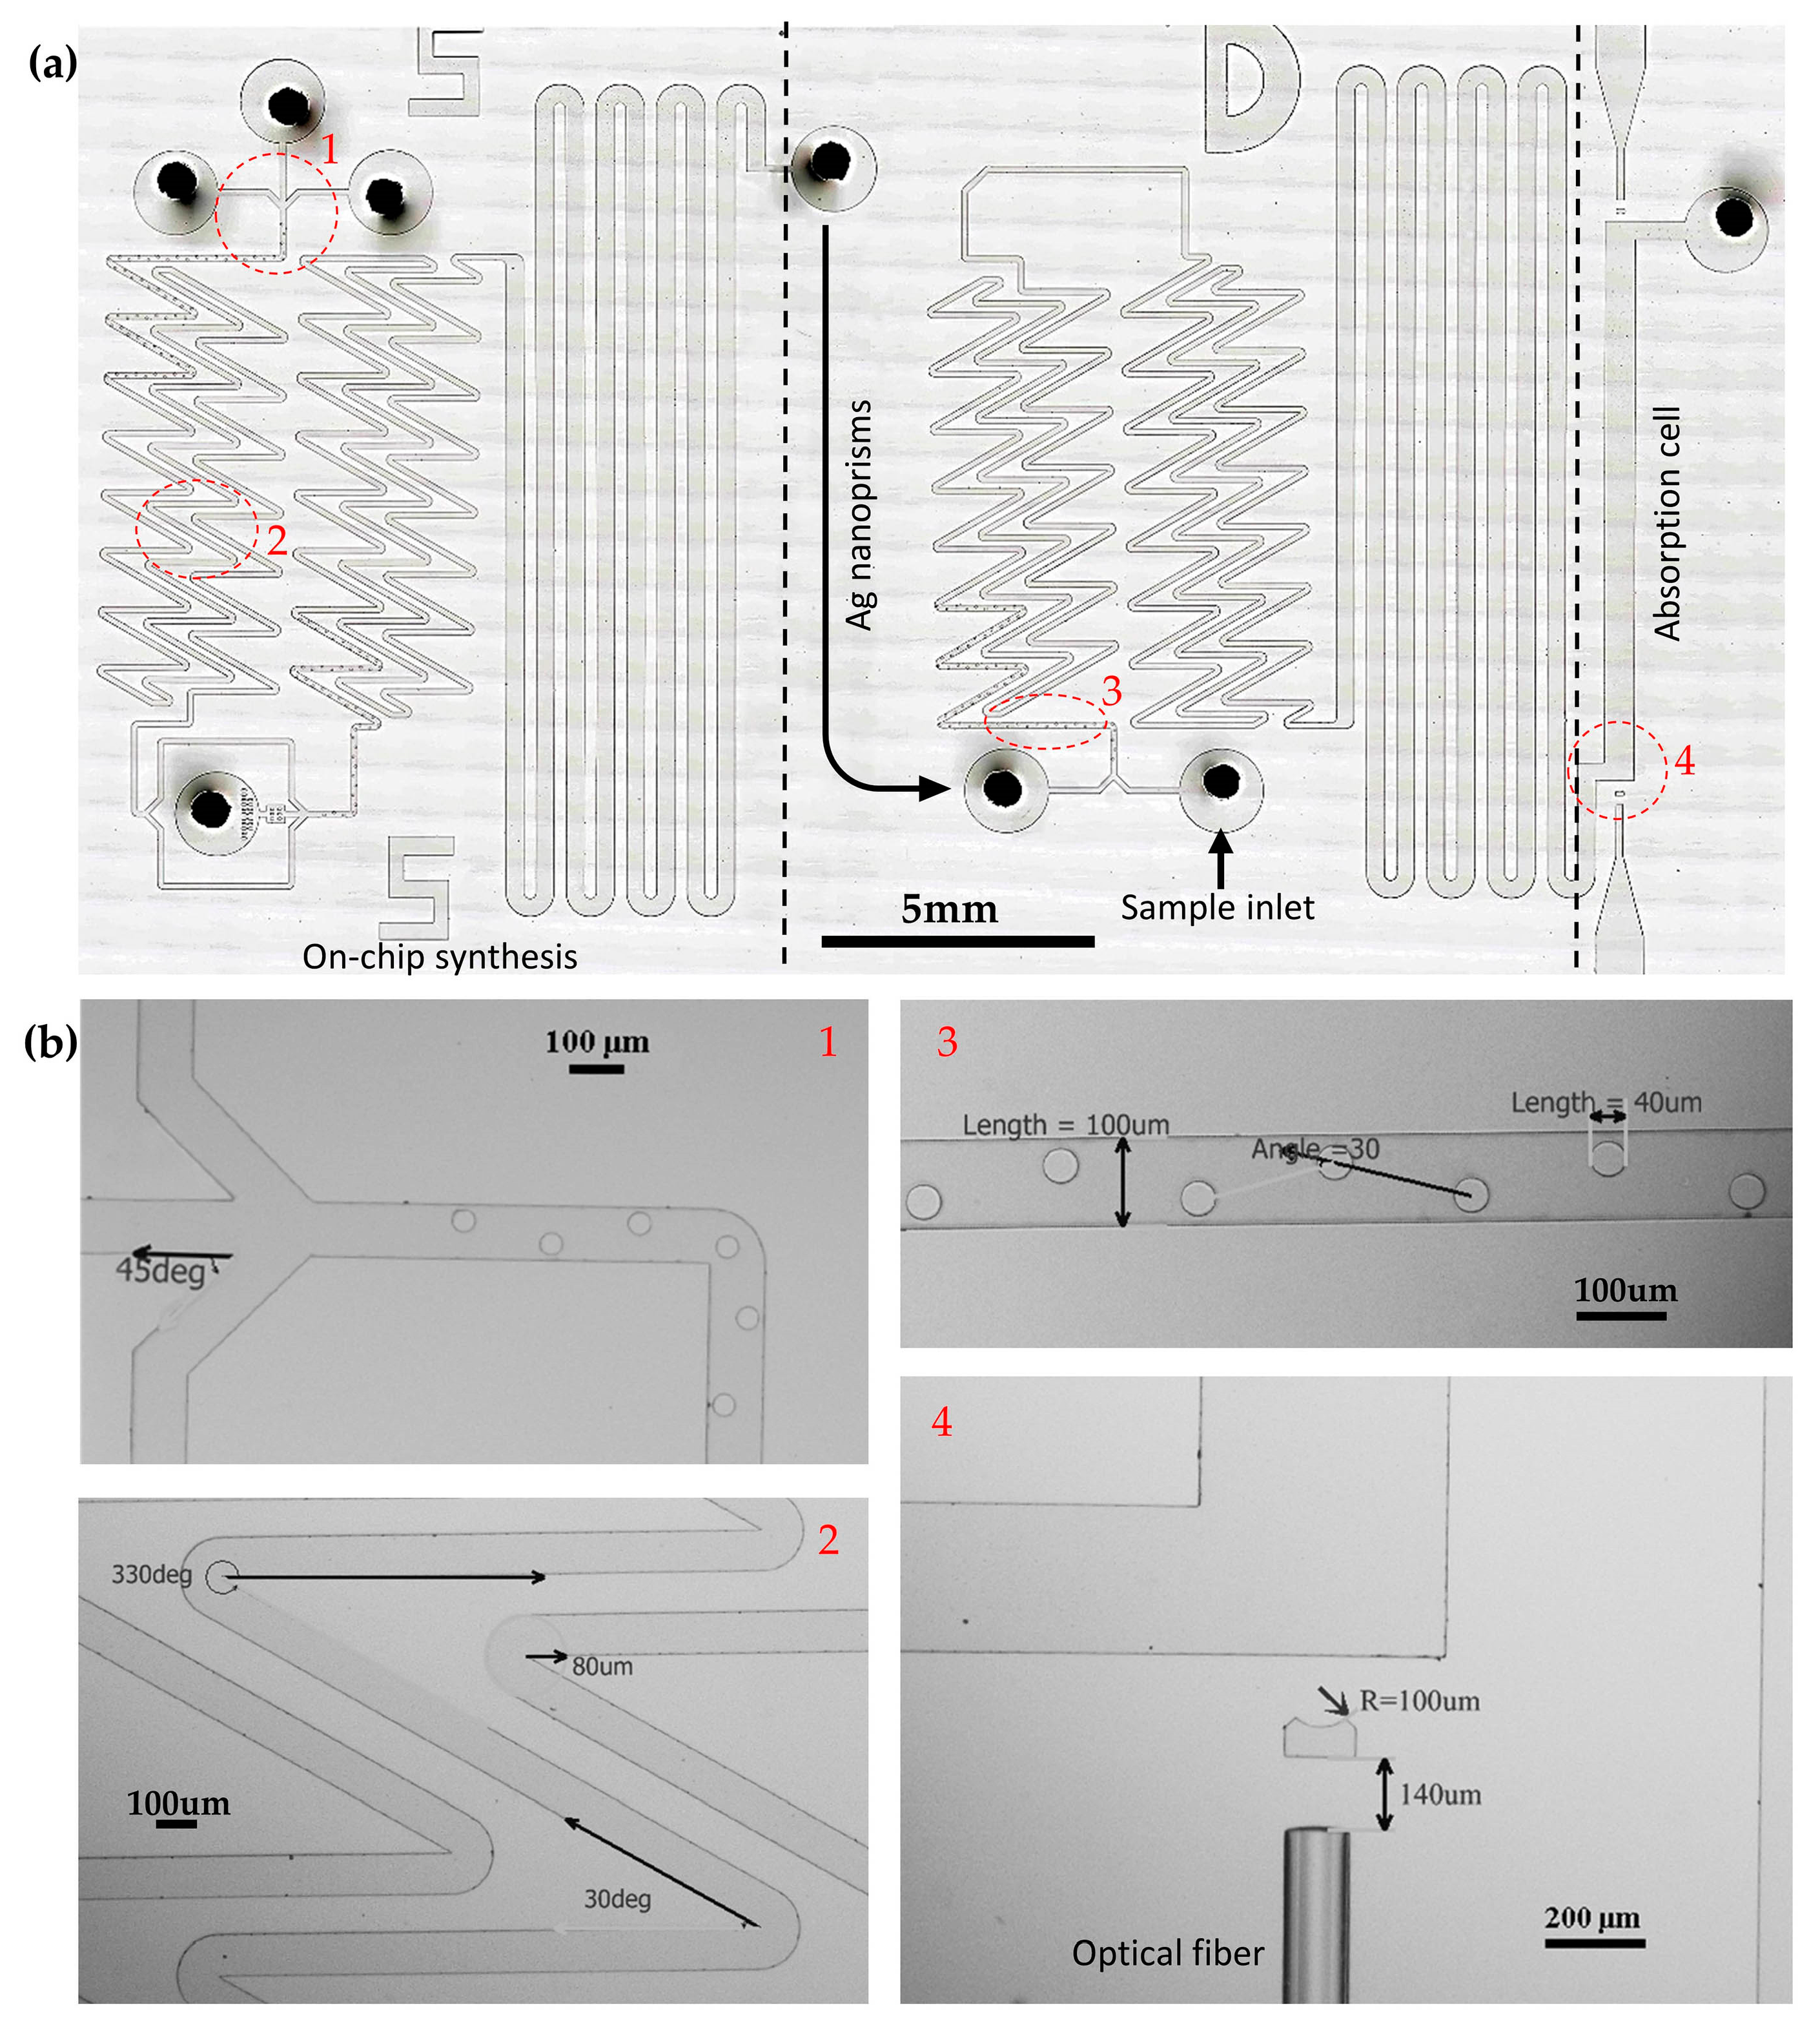
3.1. Fabrication
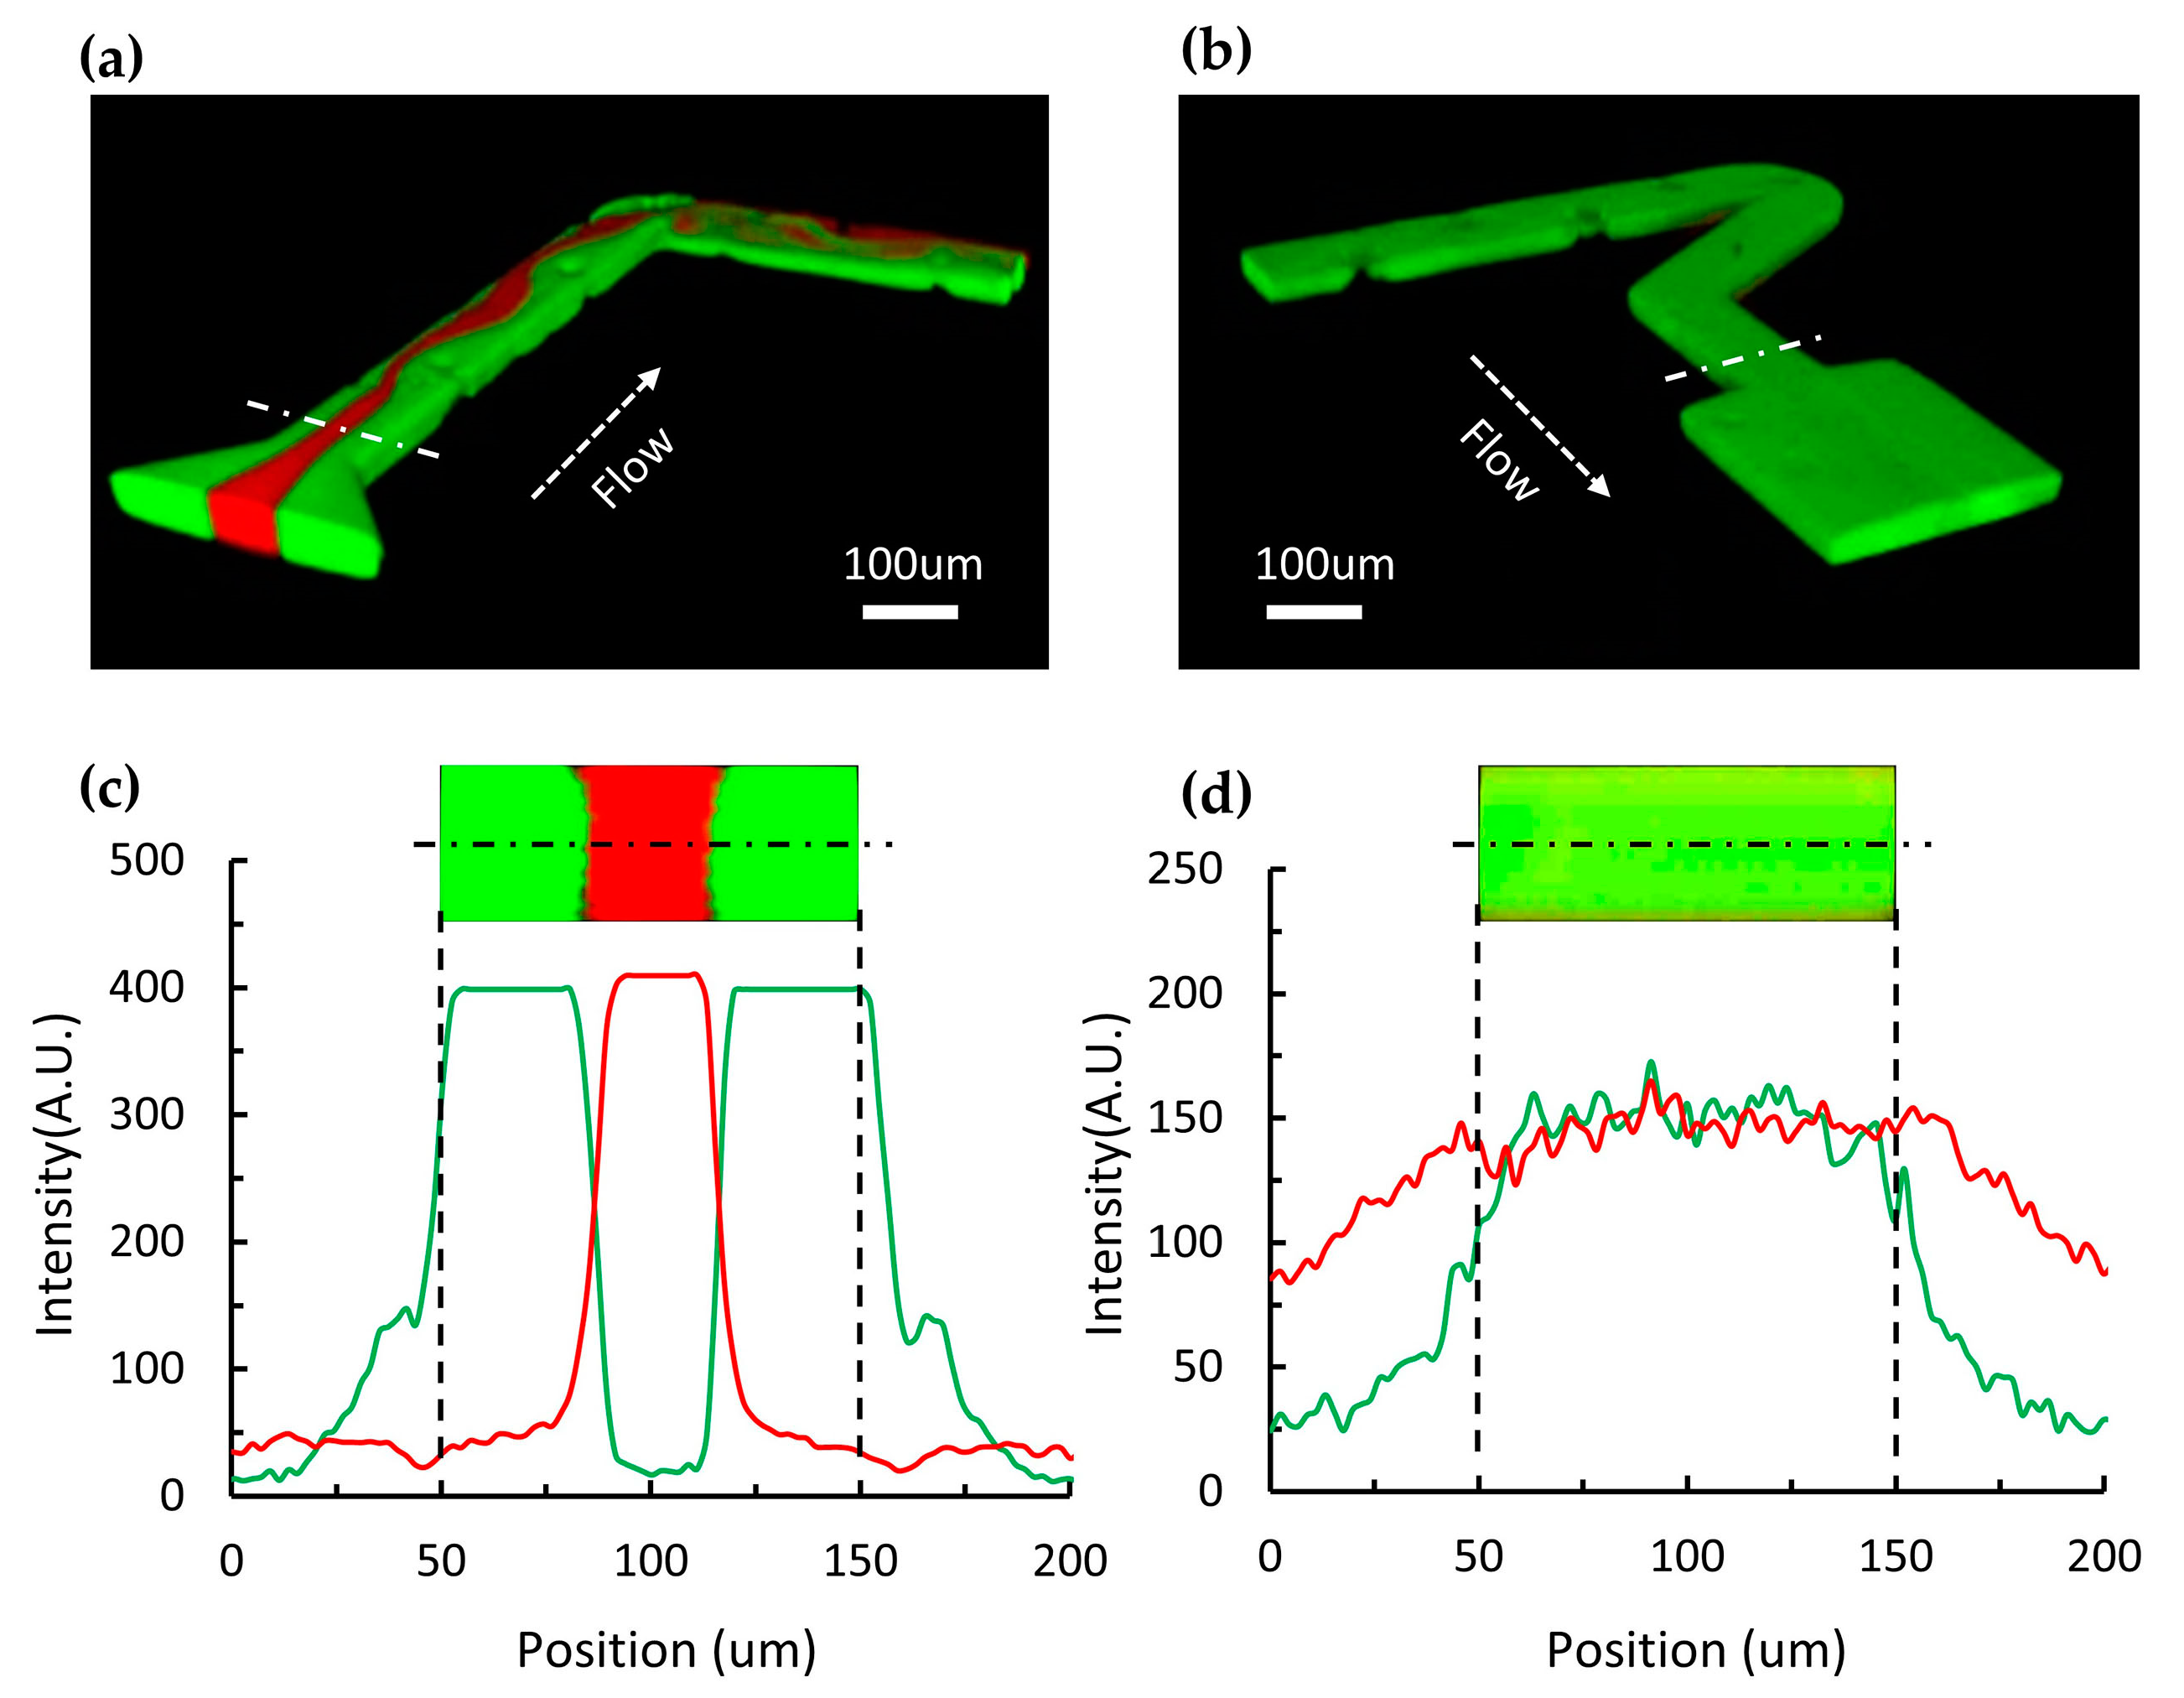
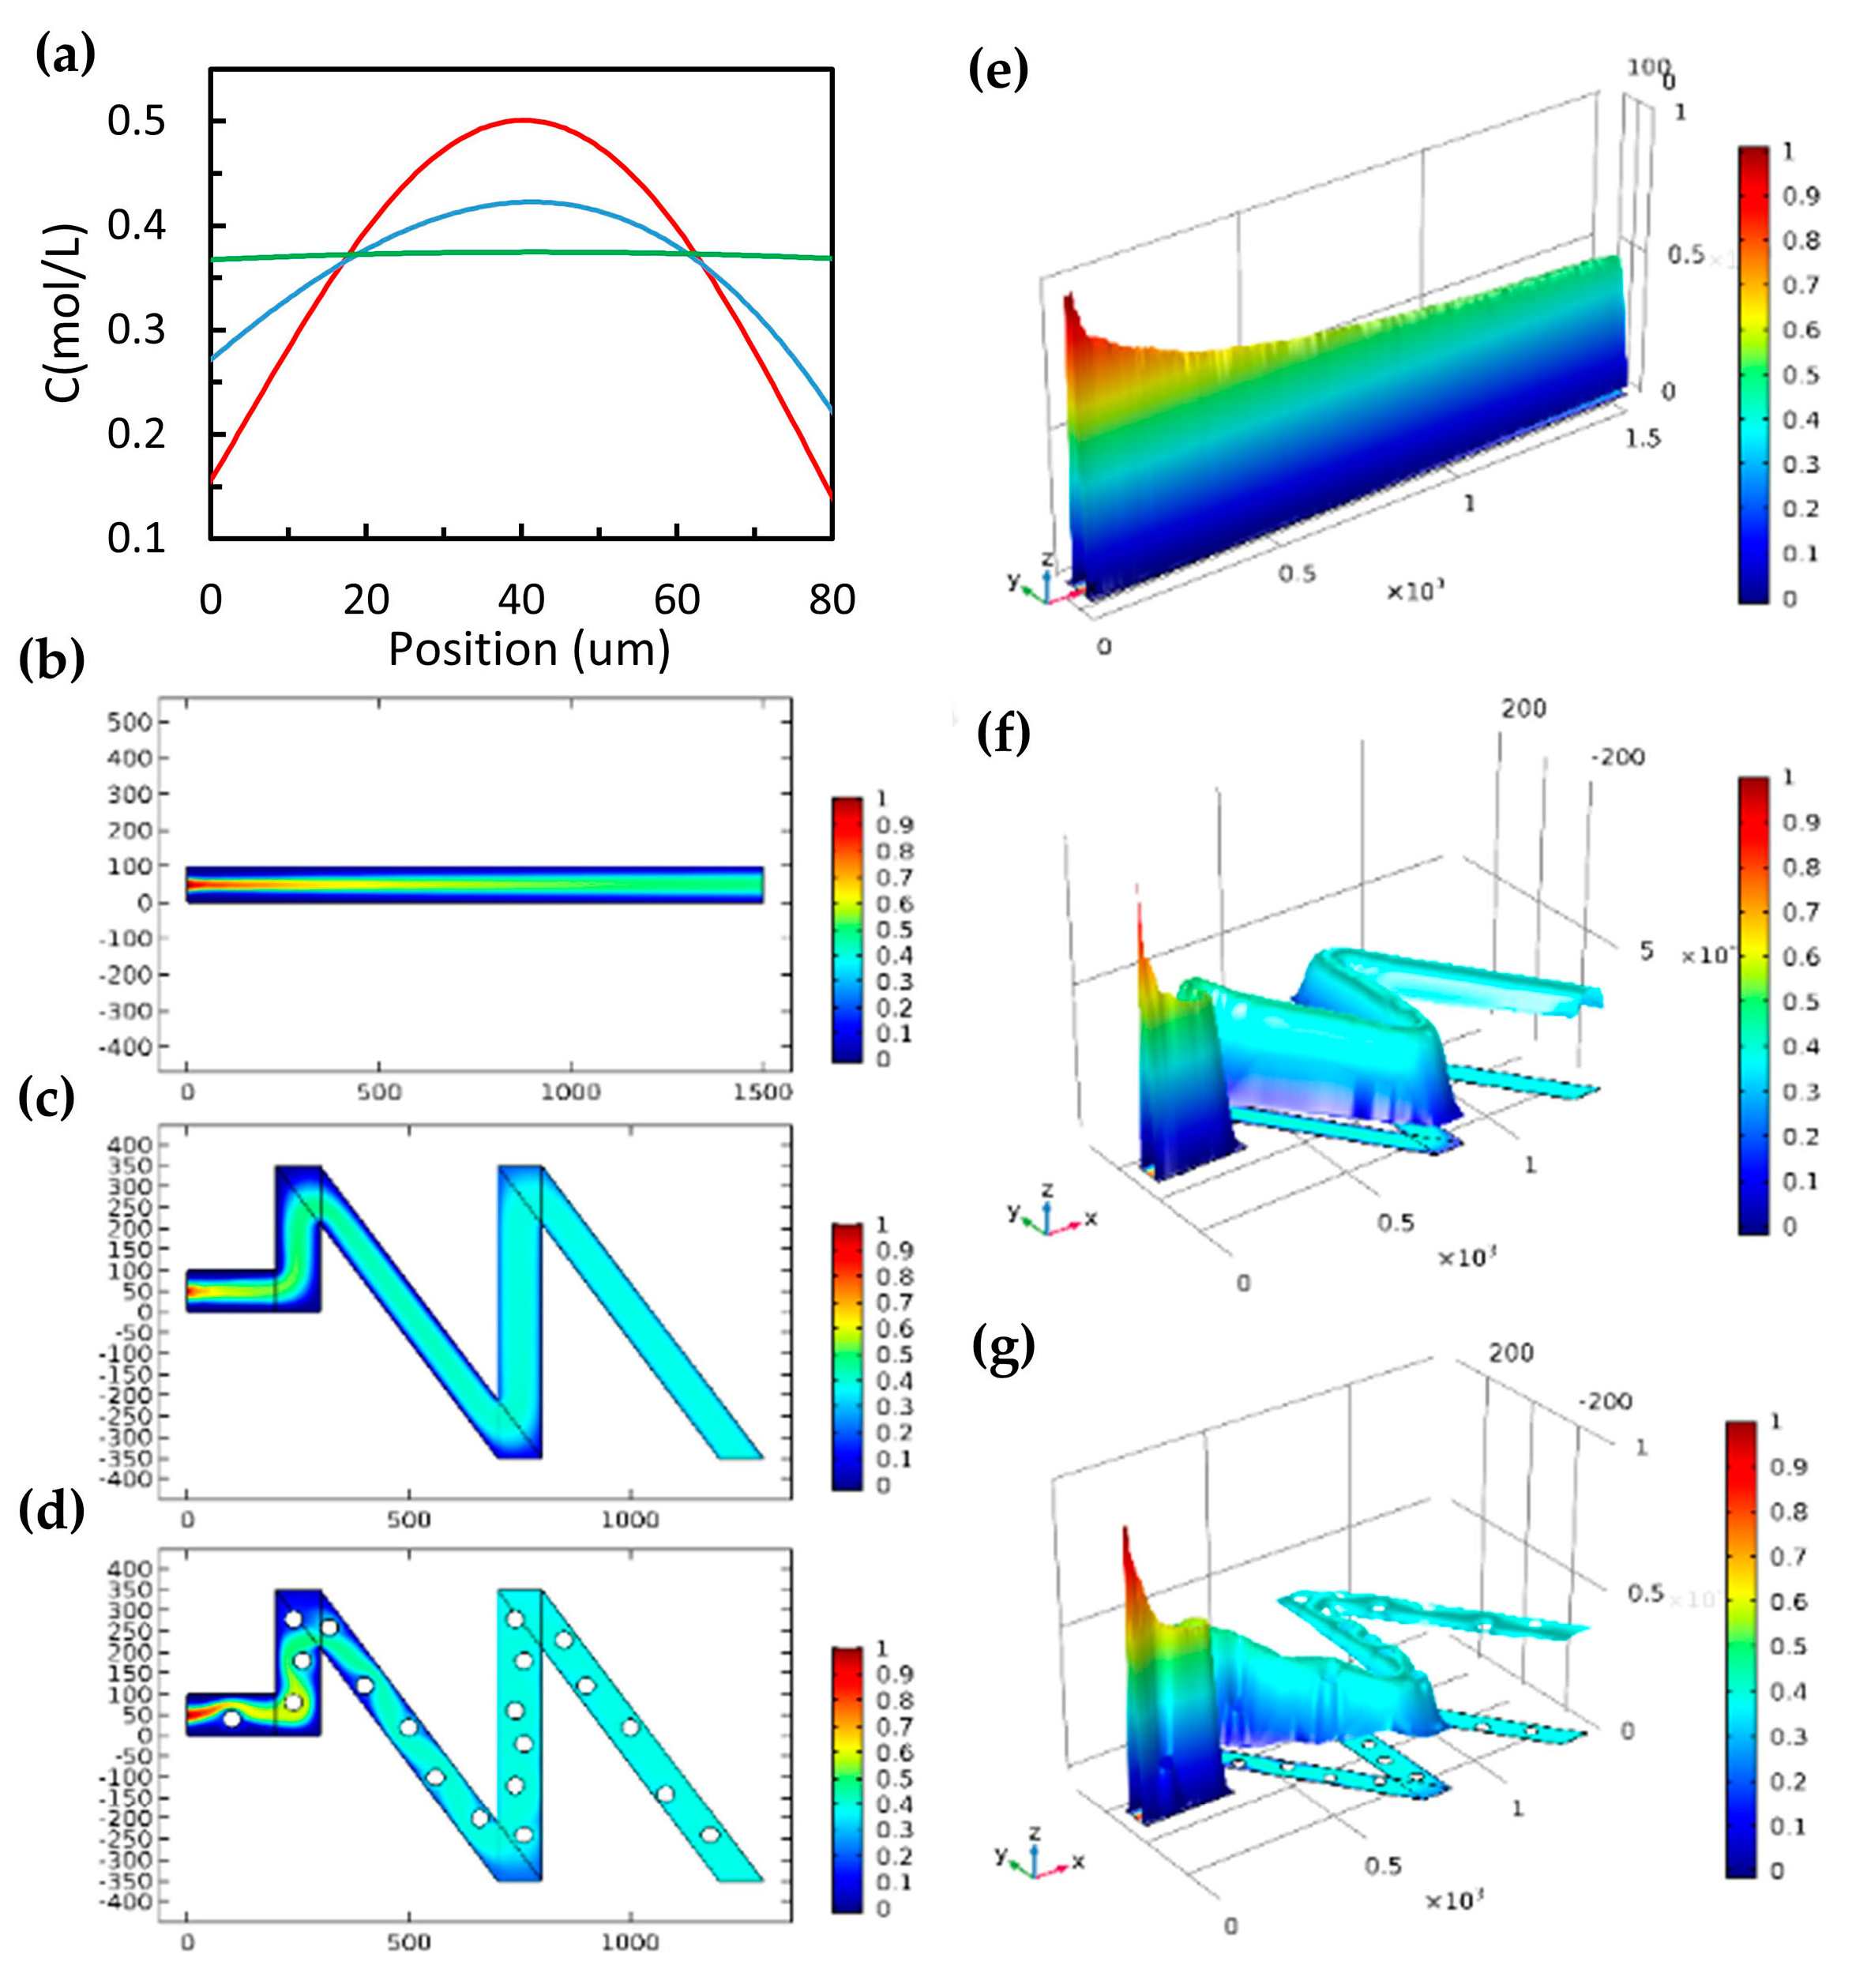
3.2. Fast Mixing
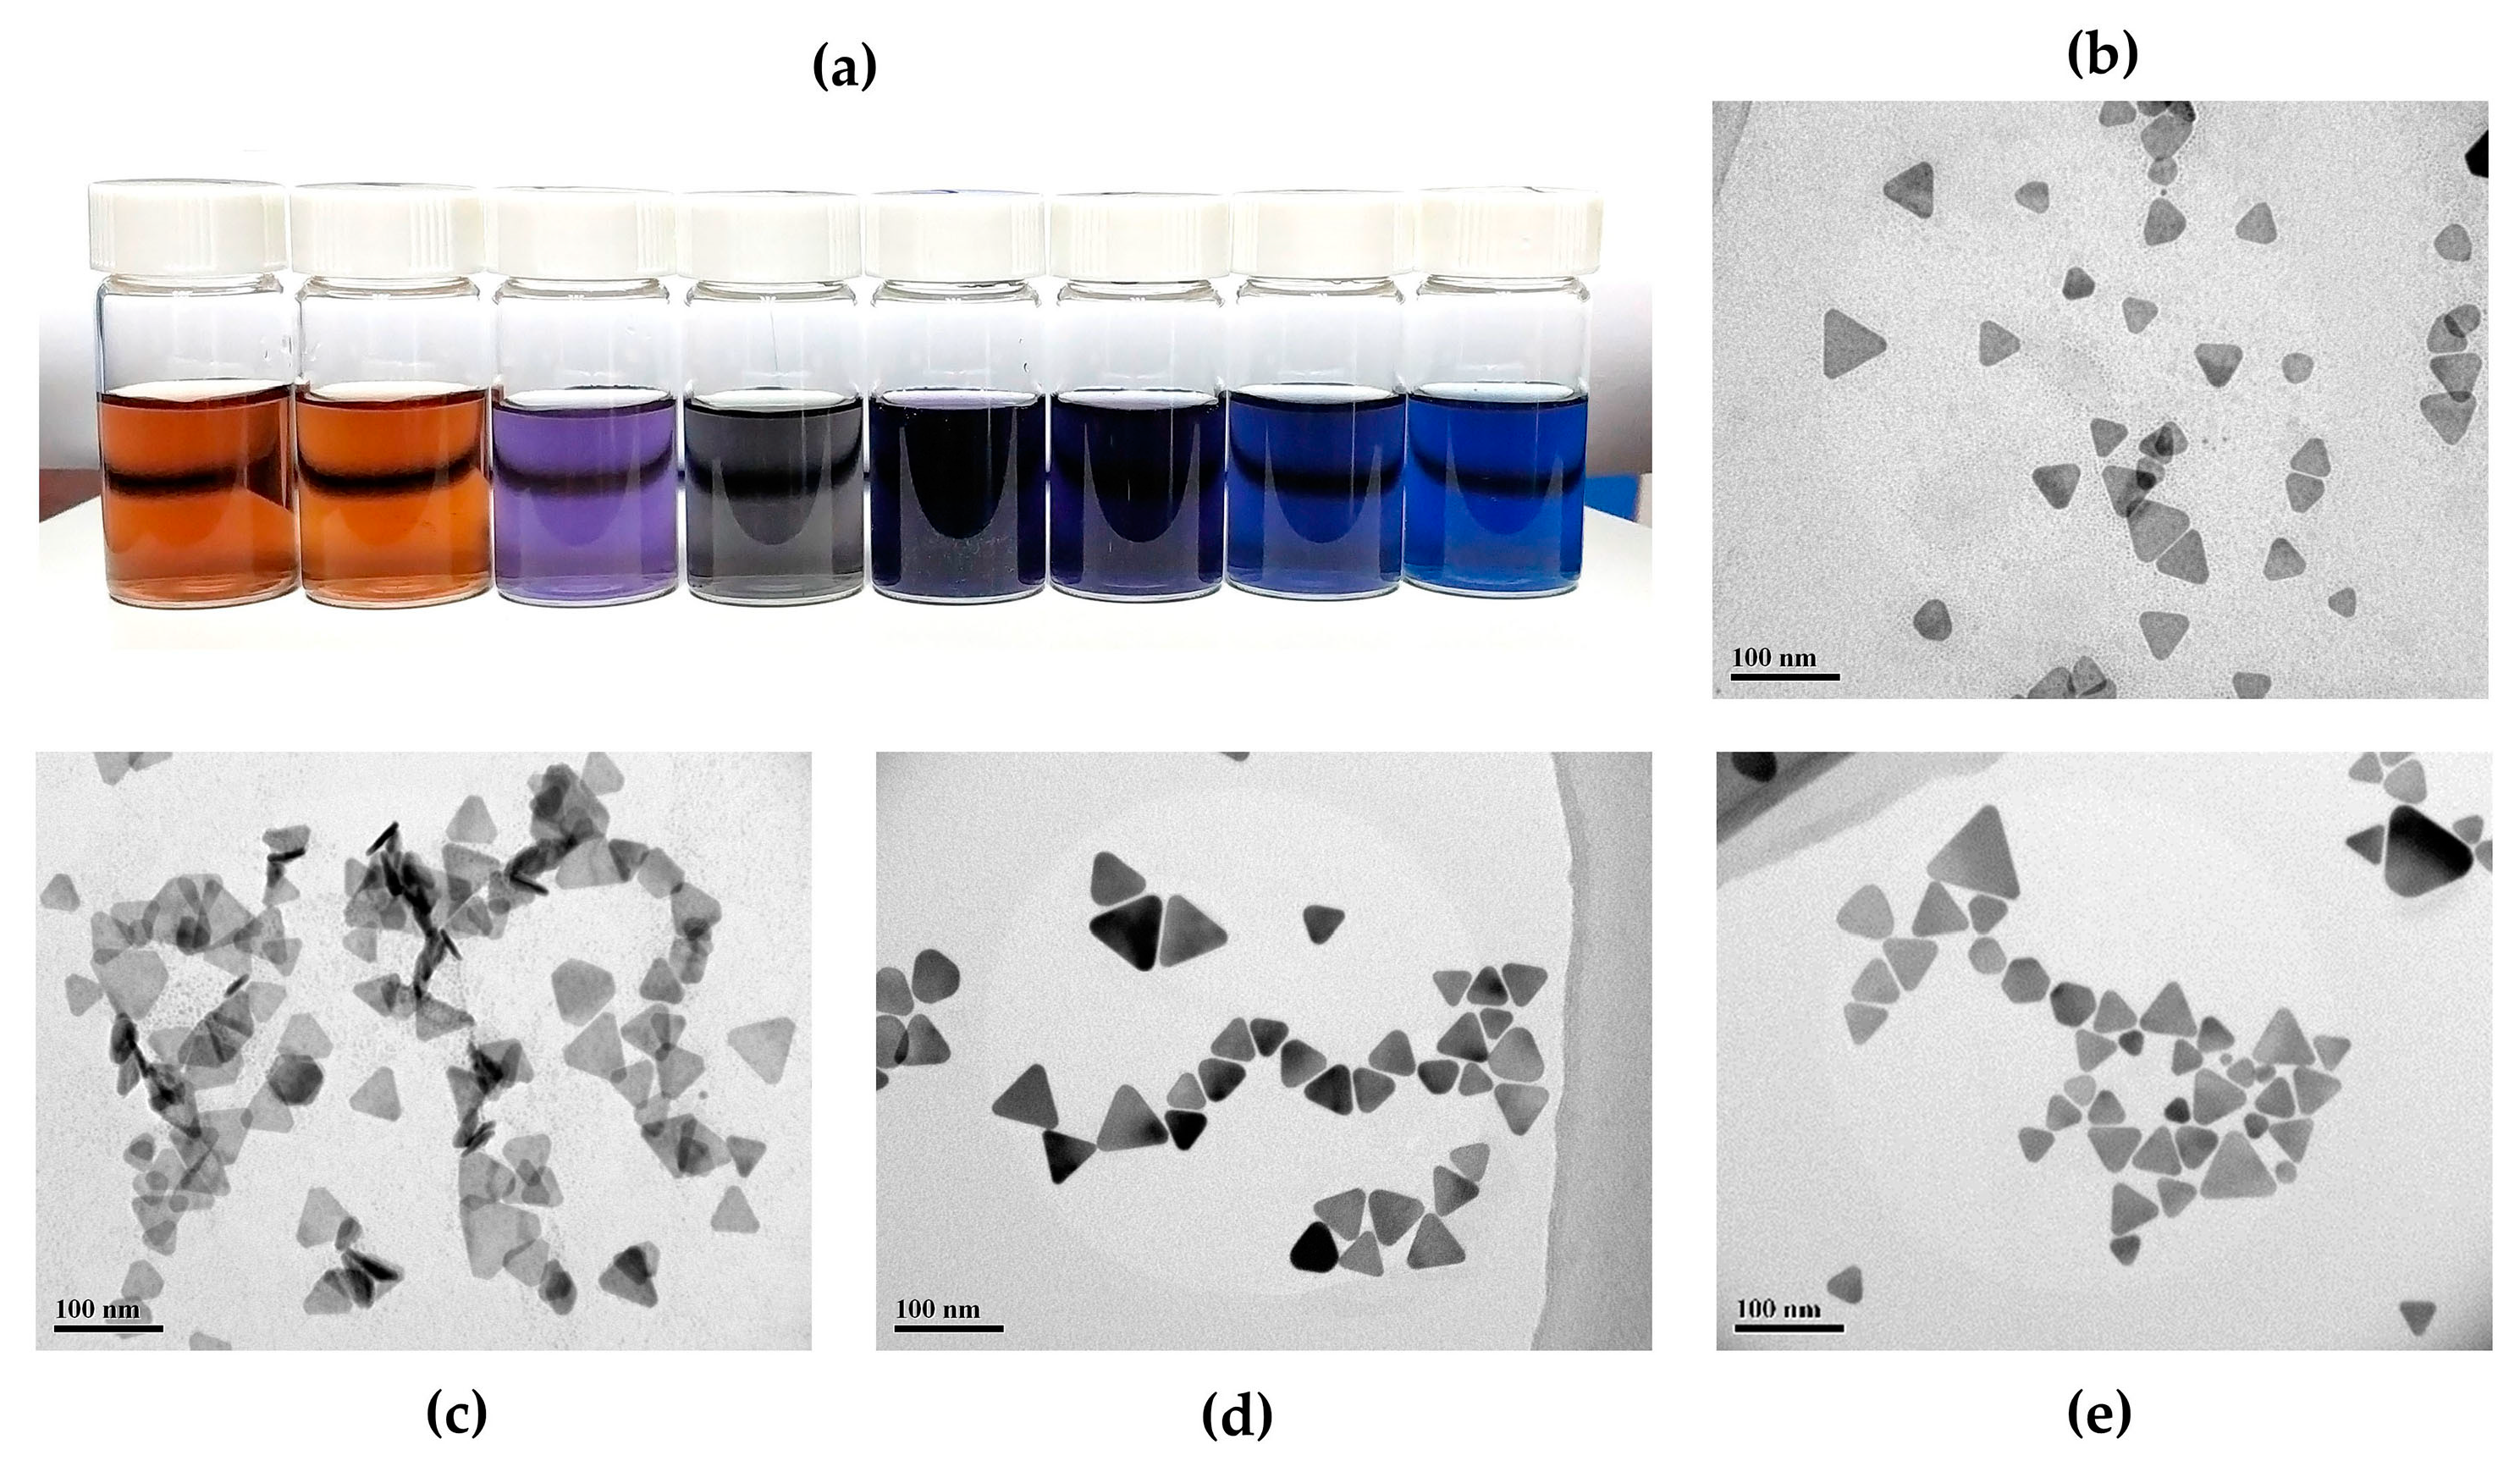
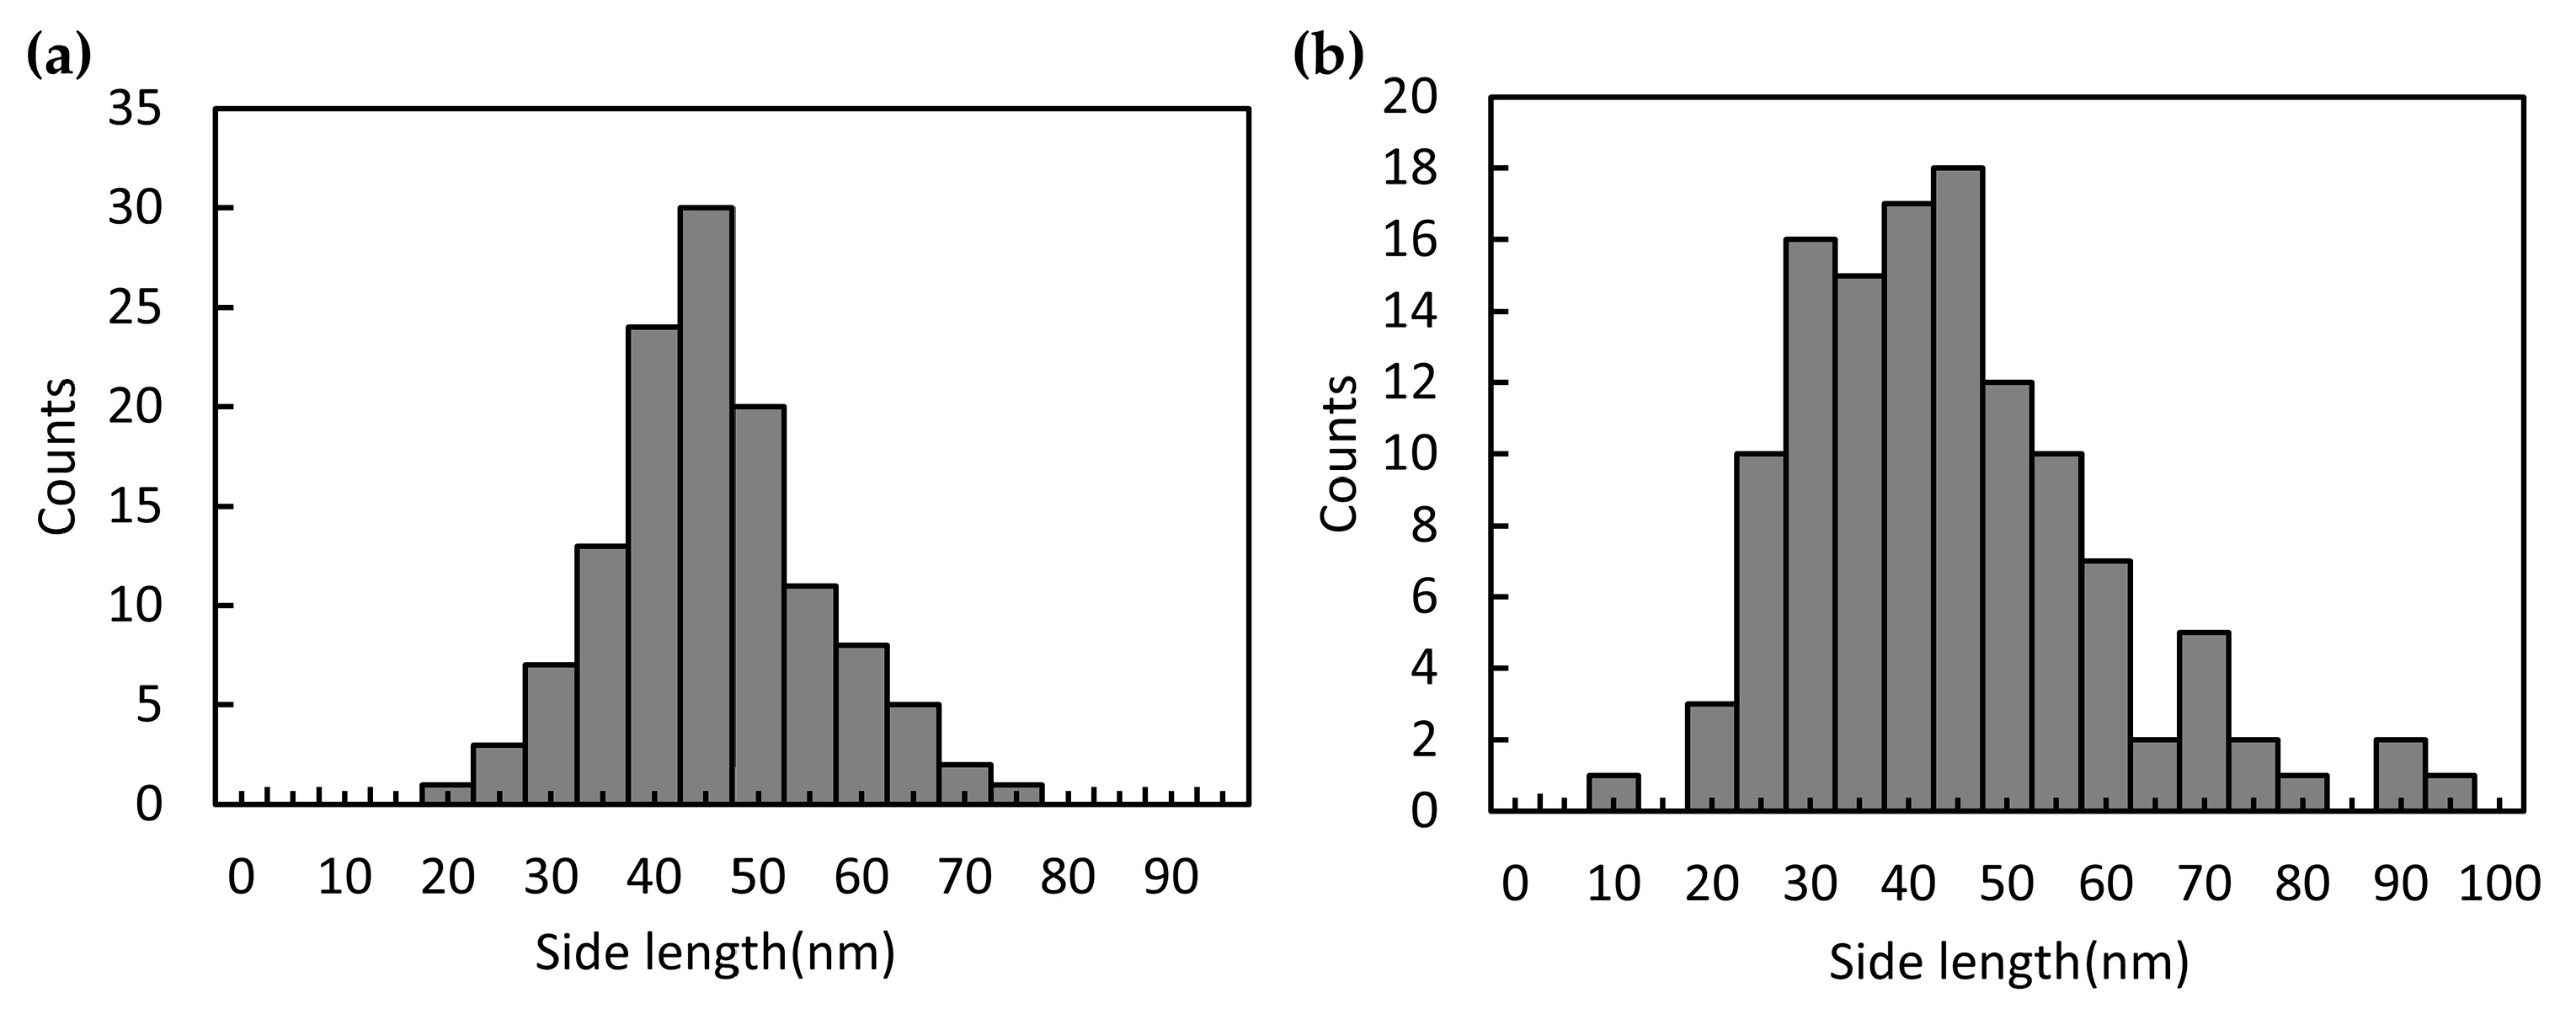
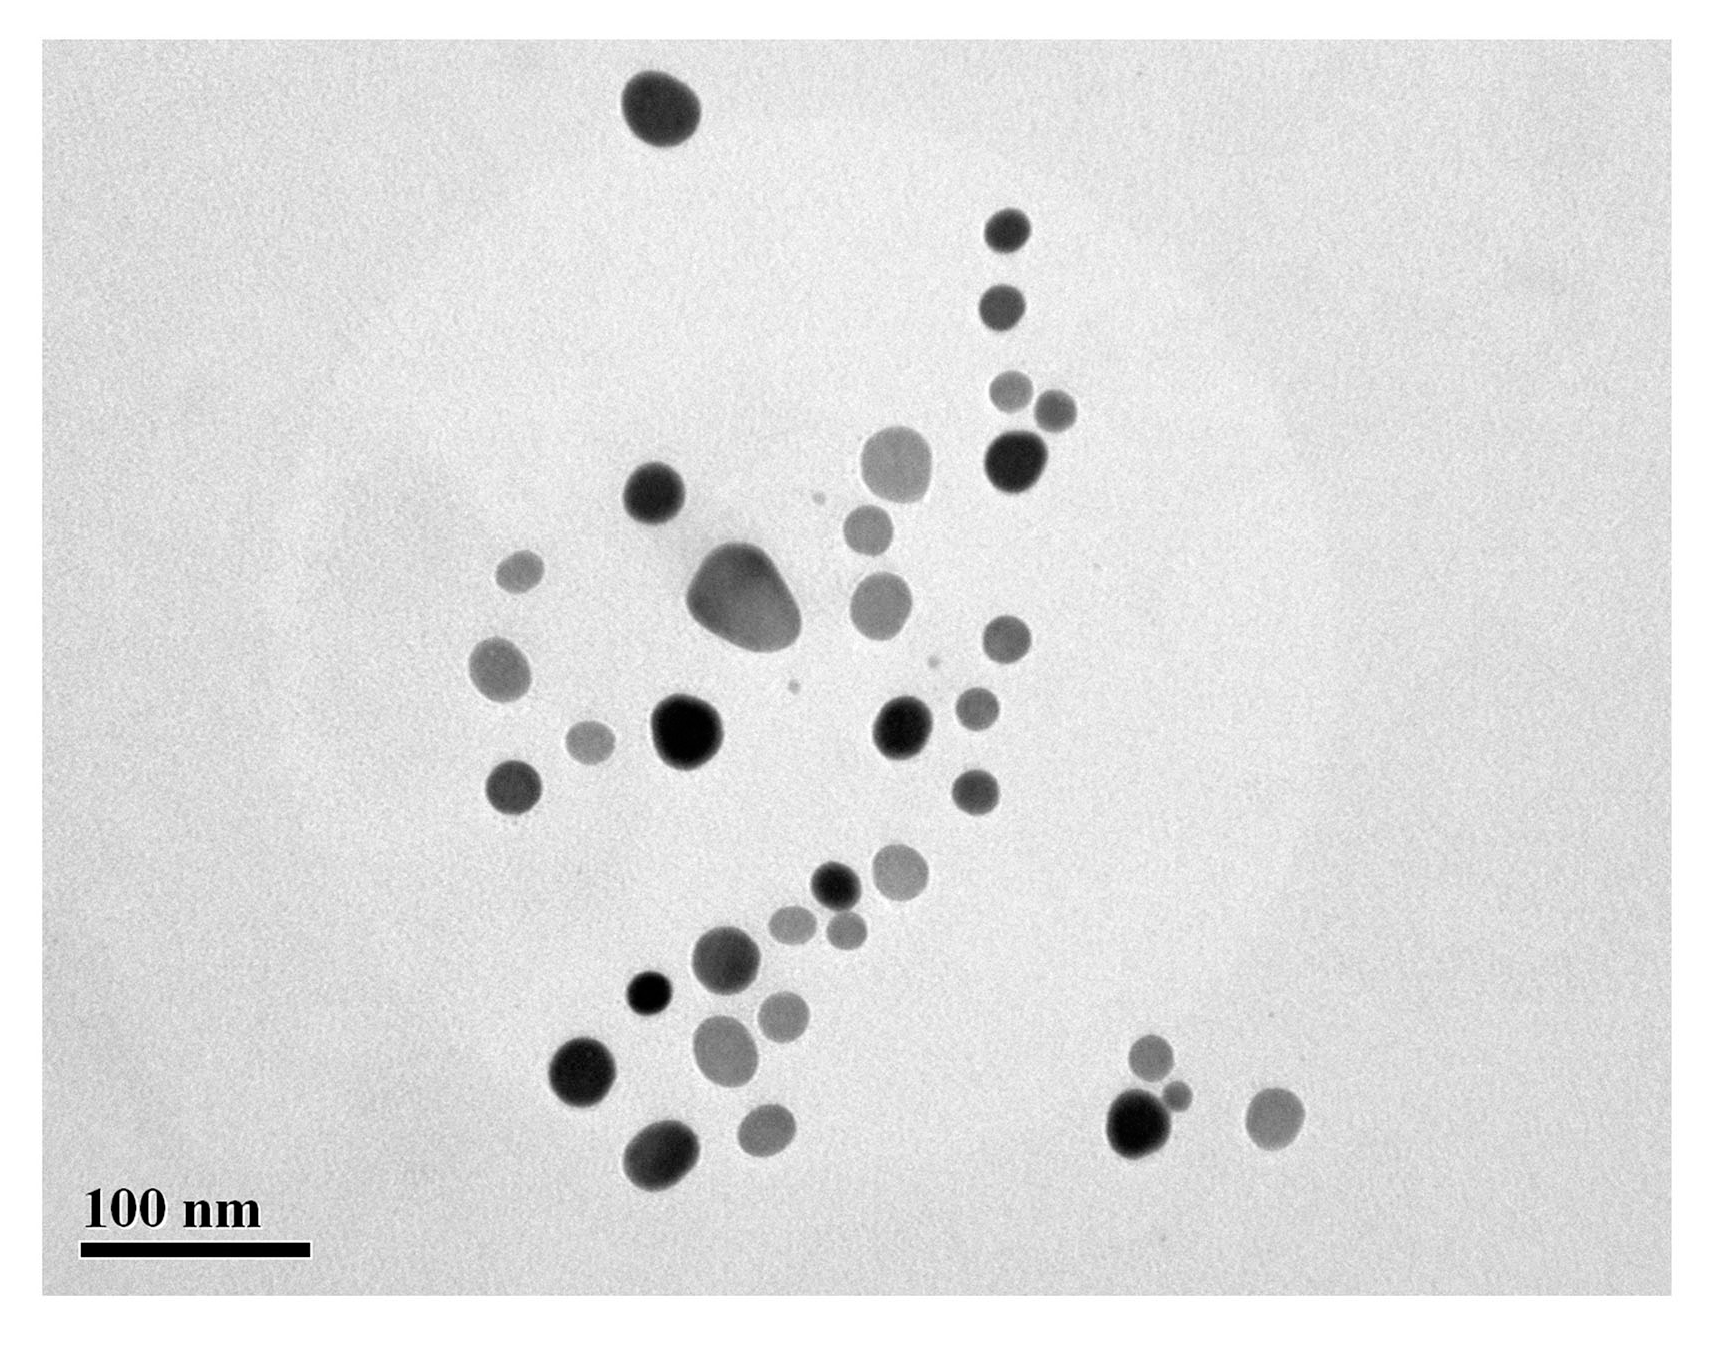
3.3. On-Chip Synthesis of Silver Nanoprisms
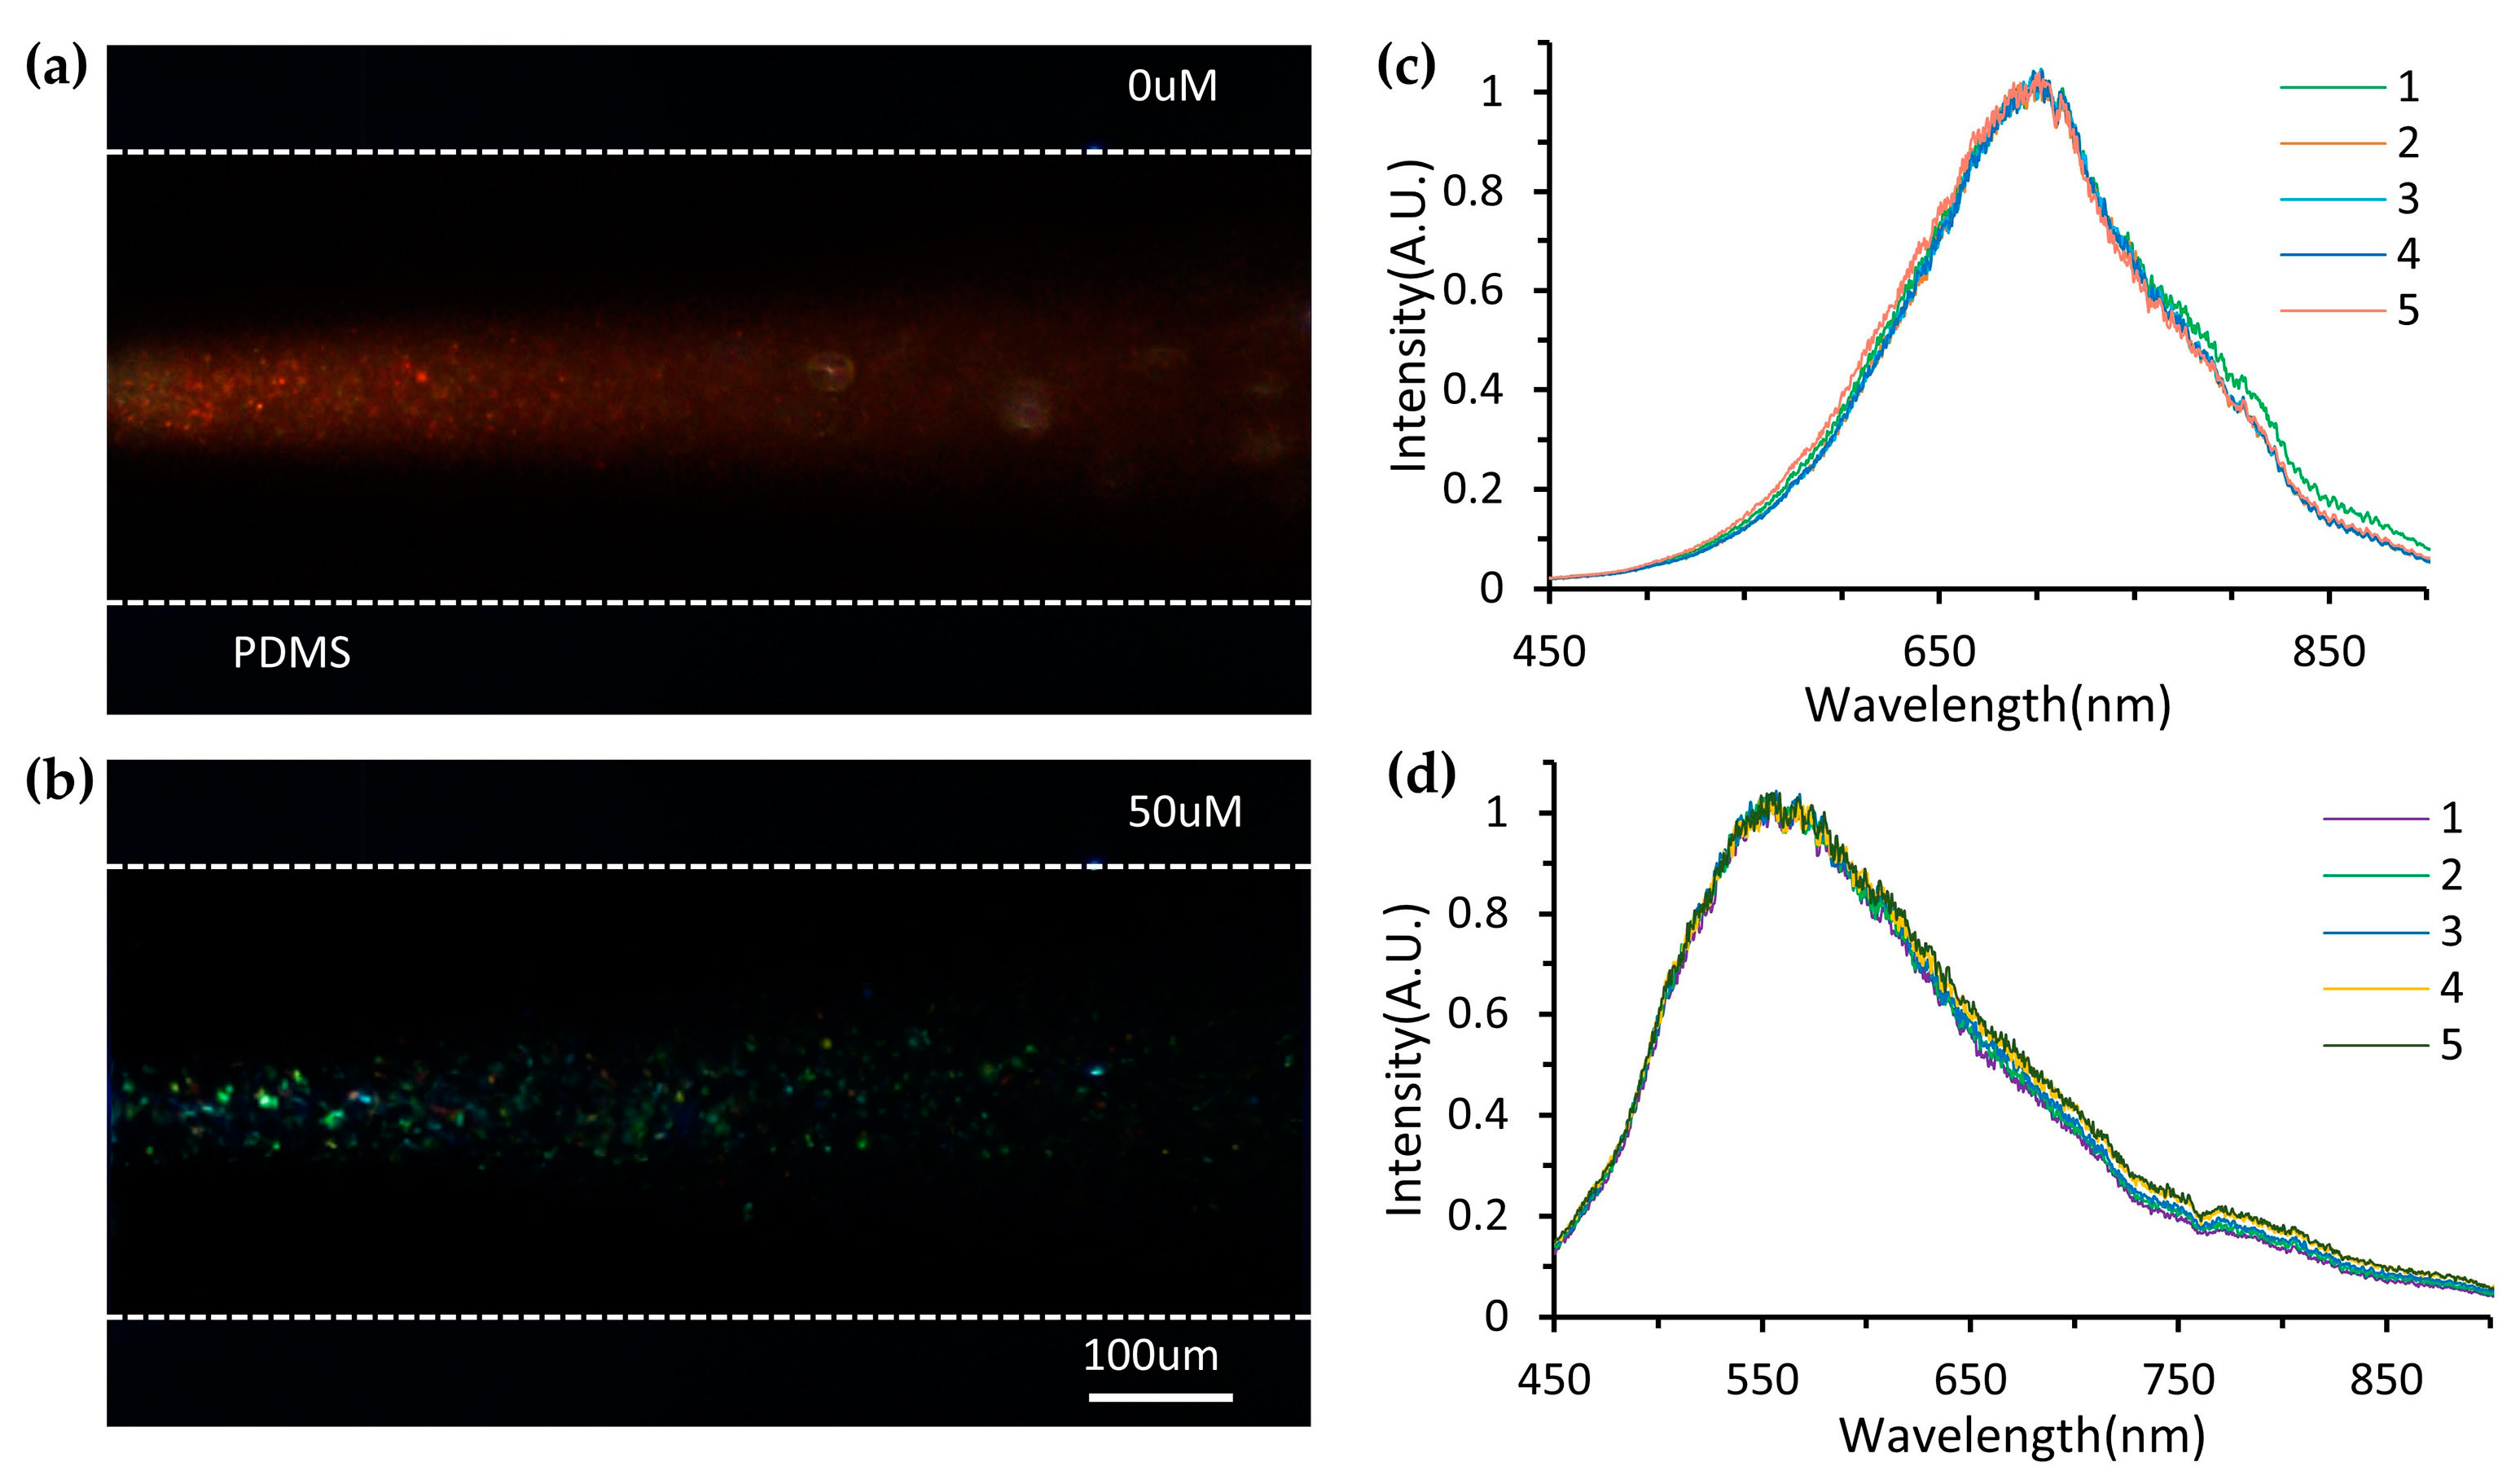
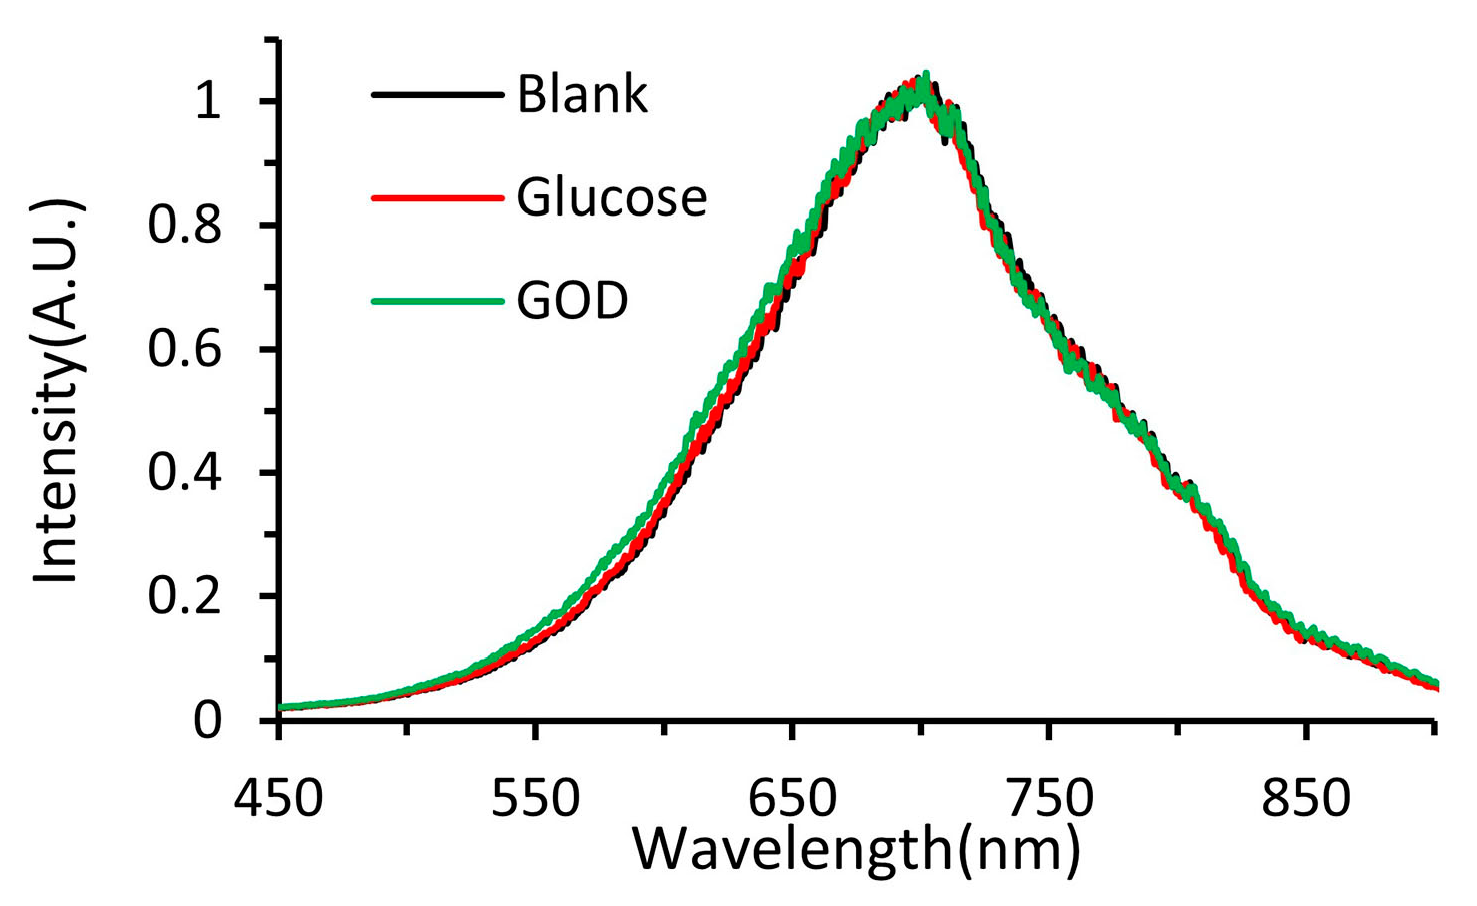
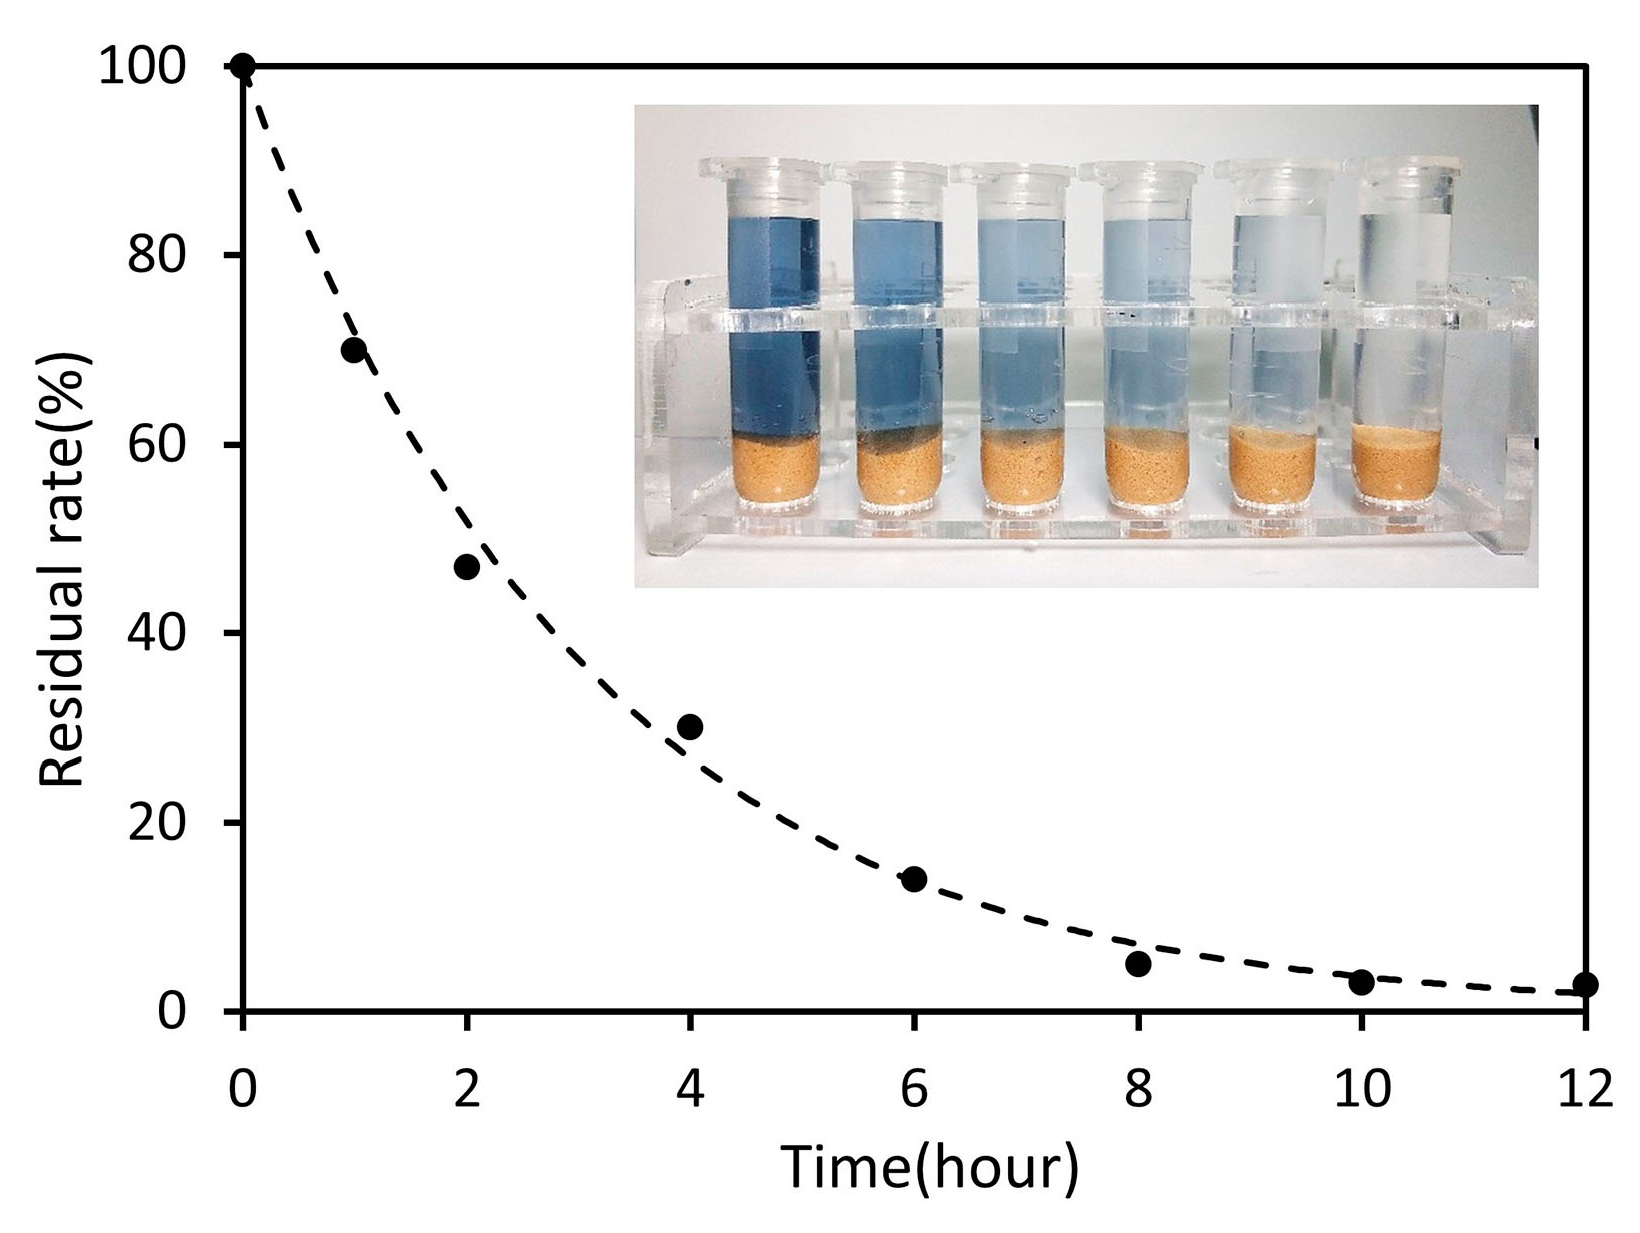
3.4. Procedures for Dissolved Oxygen Sensing
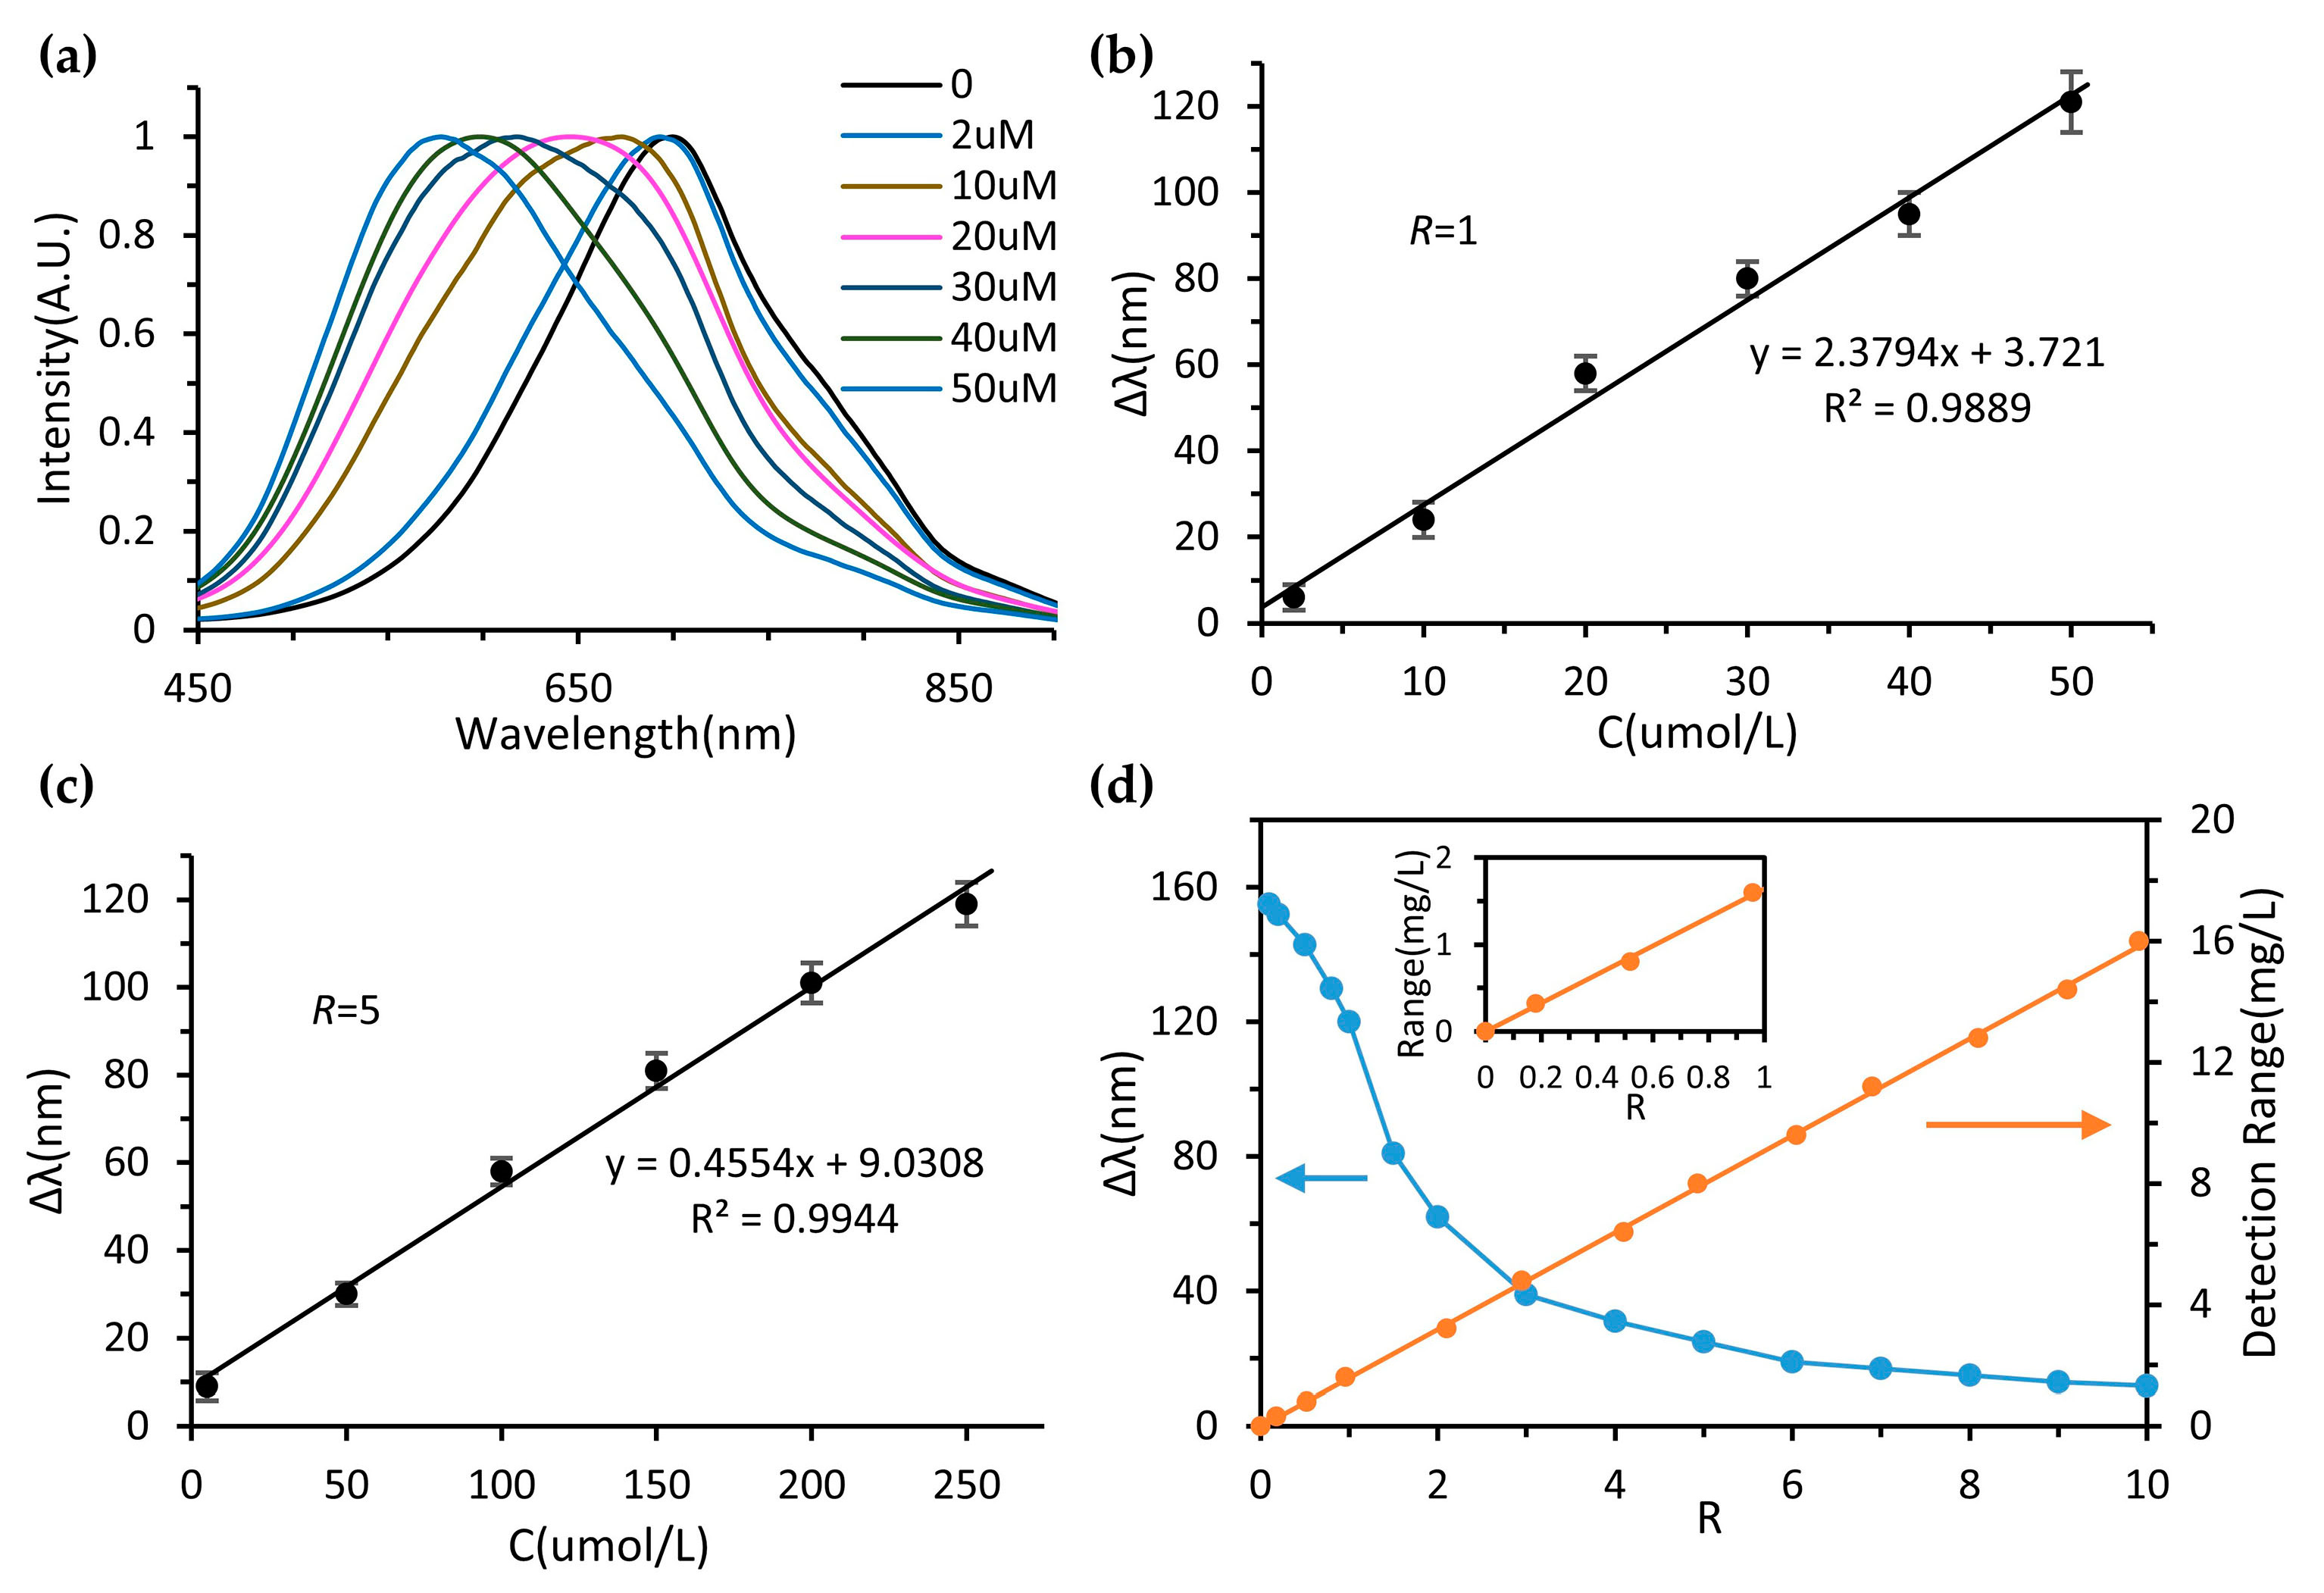
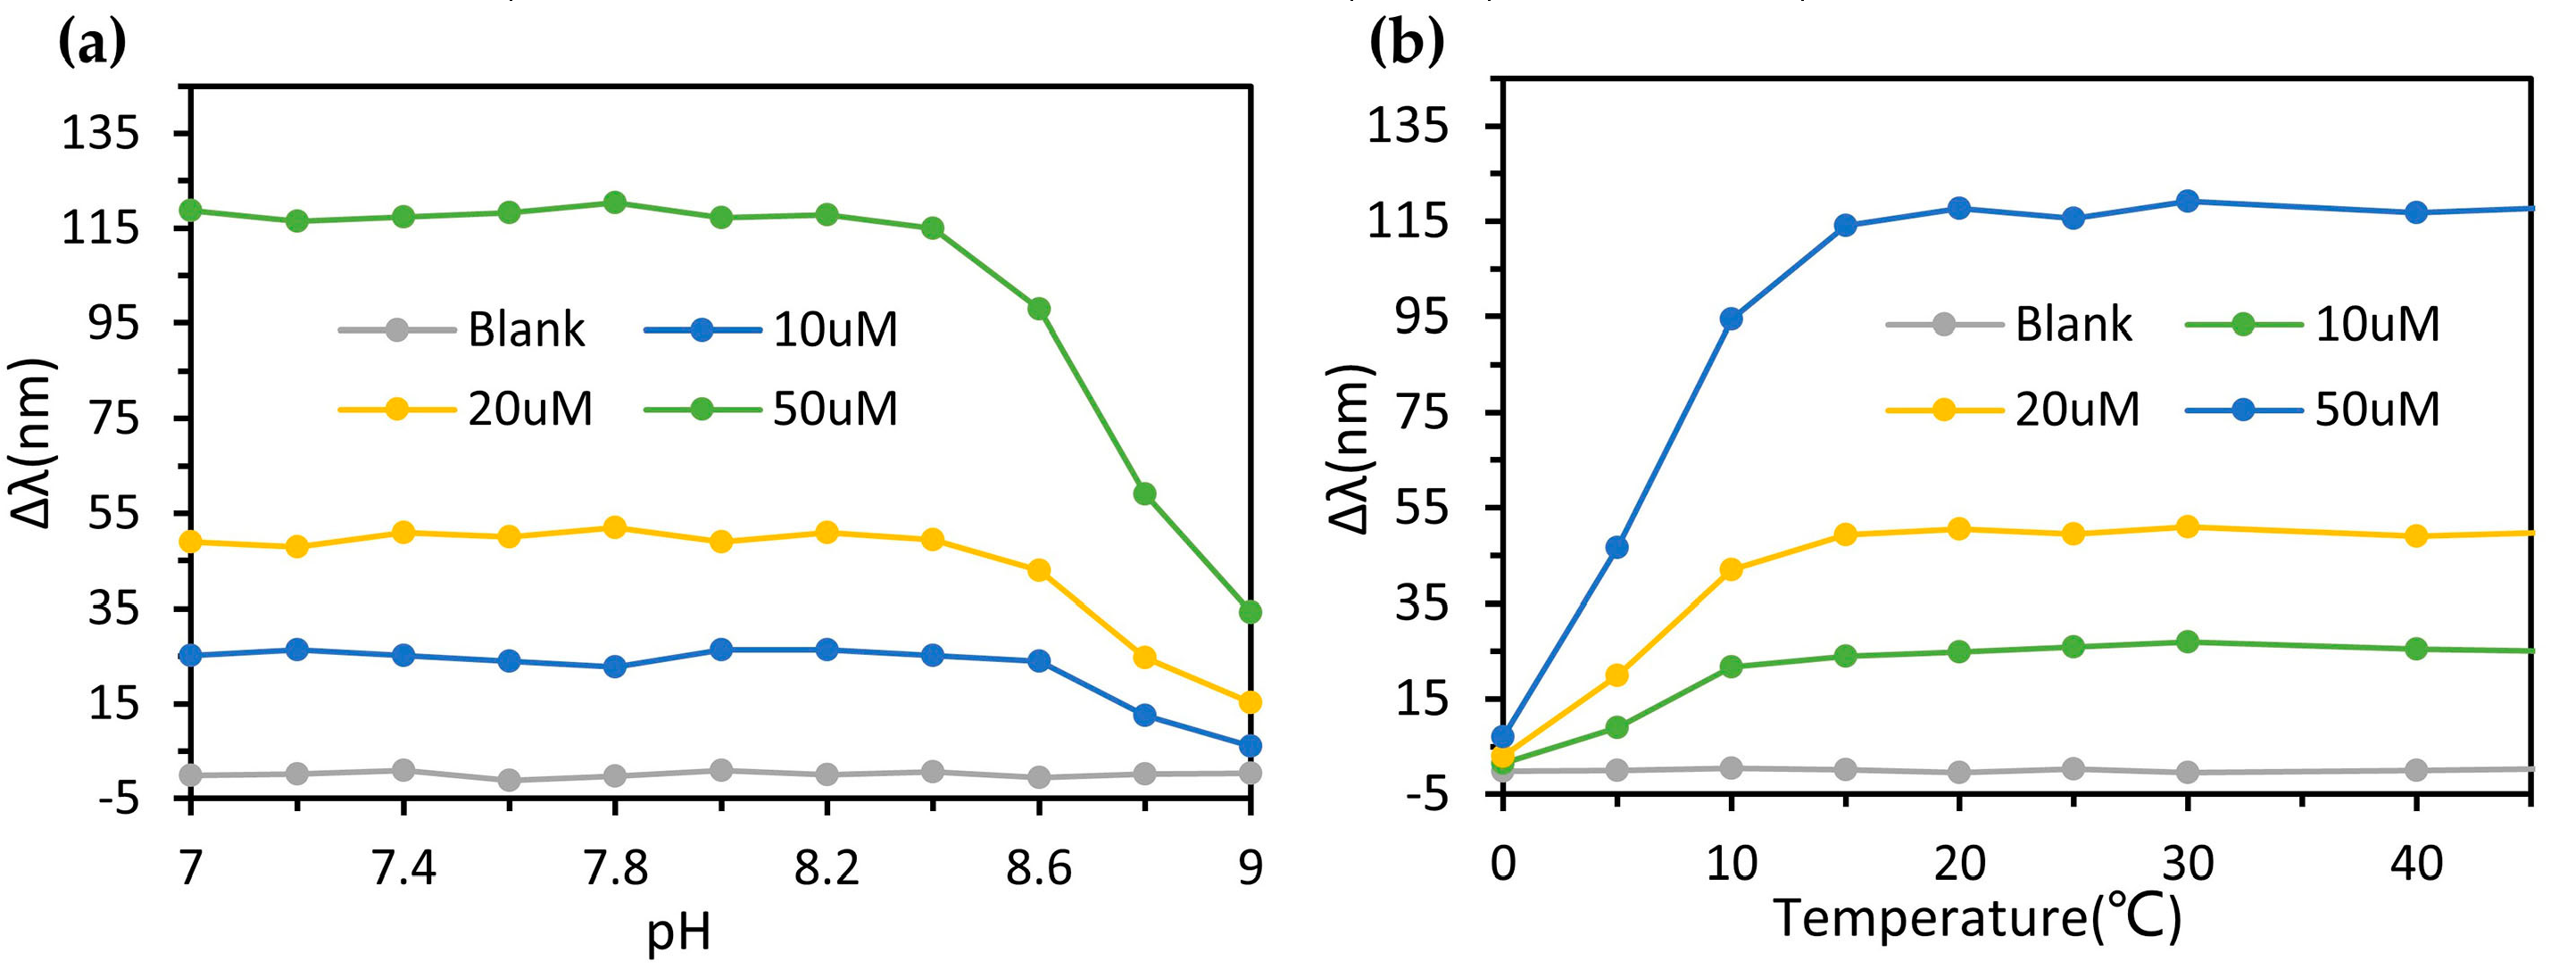
3.5. Device Performance
4. Conclusions
Author Contributions
Funding
Acknowledgments
Conflicts of Interest
Appendix A


References
- Diaz, R.J.; Rosenberg, R. Spreading dead zones and consequences for marine ecosystems. Science 2008, 321, 926–929. [Google Scholar] [CrossRef] [PubMed]
- Papkovsky, D.B.; Dmitriev, R.I. Biological detection by optical oxygen sensing. Chem. Soc. Rev. 2013, 42, 8700–8732. [Google Scholar] [CrossRef] [PubMed]
- Stramma, L.; Schmidtko, S.; Levin, L.A.; Johnson, G.C. Ocean oxygen minima expansions and their biological impacts. Deep Sea Res. Part I Oceanogr. Res. Pap. 2010, 57, 587–595. [Google Scholar] [CrossRef]
- Whitehead, P.G.; Wilby, R.L.; Battarbee, R.W.; Kernan, M.; Wade, A.J. A review of the potential impacts of climate change on surface water quality. Hydrol. Sci. J. 2009, 54, 101–123. [Google Scholar] [CrossRef]
- Oomen, P.E.; Skolimowski, M.D.; Verpoorte, E. Implementing oxygen control in chip-based cell and tissue culture systems. Lab Chip 2016, 16, 3394–3414. [Google Scholar] [CrossRef]
- Shriwastav, A.; Sudarsan, G.; Bose, P.; Tare, V. A modified Winkler’s method for determination of dissolved oxygen concentration in water: Dependence of method accuracy on sample volume. Measurement 2017, 106, 190–195. [Google Scholar] [CrossRef]
- Luo, J.; Dziubla, T.; Eitel, R. A low temperature co-fired ceramic based microfluidic Clark-type oxygen sensor for real-time oxygen sensing. Sens. Actuators B Chem. 2017, 240, 392–397. [Google Scholar] [CrossRef]
- Damos, F.S.; Luz, R.C.; Tanaka, A.A.; Kubota, L.T. Dissolved oxygen amperometric sensor based on layer-by-layer assembly using host–guest supramolecular interactions. Anal. Chim. Acta 2010, 664, 144–150. [Google Scholar] [CrossRef]
- Chu, C.S.; Lo, Y.L. Optical fiber dissolved oxygen sensor based on Pt (II) complex and core-shell silica nanoparticles incorporated with sol–gel matrix. Sens. Actuators B Chem. 2010, 151, 83–89. [Google Scholar] [CrossRef]
- Zhang, Z.; Wang, H.; Chen, Z.; Wang, X.; Choo, J.; Chen, L. Plasmonic colorimetric sensors based on etching and growth of noble metal nanoparticles: Strategies and applications. Biosens. Bioelectron. 2018, 114, 52–65. [Google Scholar] [CrossRef]
- Kumar, A.; Kim, S.; Nam, J.M. Plasmonically engineered nanoprobes for biomedical applications. J. Am. Chem. Soc. 2016, 138, 14509–14525. [Google Scholar] [CrossRef] [PubMed]
- Millstone, J.E.; Hurst, S.J.; Metraux, G.S.; Cutler, J.I.; Mirkin, C.A. Colloidal gold and silver triangular nanoprisms. Small 2009, 5, 646–664. [Google Scholar] [CrossRef] [PubMed]
- Pastoriza-Santos, I.; Liz-Marzán, L.M. Colloidal silver nanoplates. State of the art and future challenges. J. Mater. Chem. 2008, 18, 1724. [Google Scholar] [CrossRef]
- Zhou, Y.; Huang, W.; He, Y. pH-Induced silver nanoprism etching-based multichannel colorimetric sensor array for ultrasensitive discrimination of thiols. Sens. Actuators B Chem. 2018, 270, 187–191. [Google Scholar] [CrossRef]
- Xia, Y.; Ye, J.; Tan, K.; Wang, J.; Yang, G. Colorimetric visualization of glucose at the submicromole level in serum by a homogenous silver nanoprism-glucose oxidase system. Anal. Chem. 2013, 85, 6241–6247. [Google Scholar] [CrossRef] [PubMed]
- Psaltis, D.; Quake, S.R.; Yang, C. Developing optofluidic technology through the fusion of microfluidics and optics. Nature 2006, 442, 381–386. [Google Scholar] [CrossRef]
- Zuo, Y.F.; Zhu, X.Q.; Shi, Y.; Liang, L.; Yang, Y. Light manipulation in inhomogeneous liquid flow and its application in biochemical sensing. Micromachines 2018, 9, 163. [Google Scholar]
- Liang, L.; Zuo, Y.F.; Wu, W.; Zhu, X.Q.; Yang, Y. Optofluidic restricted imaging, spectroscopy and counting of nanoparticles by evanescent wave using immiscible liquids. Lab Chip 2016, 16, 3007–3014. [Google Scholar] [CrossRef]
- Wang, N.; Zhang, X.; Wang, Y.; Yu, W.; Chan, H.L. Microfluidic reactors for photocatalytic water purification. Lab Chip 2014, 14, 1074–1082. [Google Scholar] [CrossRef]
- Zhu, X.Q.; Liang, L.; Zuo, Y.F.; Zhang, X.M.; Yang, Y. Tunable visible cloaking using liquid diffusion. Laser Photonics Rev. 2017, 11, 1700066. [Google Scholar] [CrossRef]
- Chen, Q.M.; Jian, A.Q.; Li, Z.H.; Zhang, X.M. Optofluidic tunable lenses using laser-induced thermal gradient. Lab Chip 2016, 16, 104–111. [Google Scholar] [CrossRef] [PubMed]
- Zhu, J.M.; Shi, Y.; Zhu, X.Q.; Yang, Y.; Jiang, F.H.; Sun, C.J.; Zhao, W.H.; Han, X.T. Optofluidic marine phosphate detection with enhanced absorption using a Fabry-Perot resonator. Lab Chip 2017, 17, 4025–4030. [Google Scholar] [CrossRef] [PubMed]
- Huang, W.; Ling, S.; Li, C.; Omenetto, F.G.; Kaplan, D.L. Silkworm silk-based materials and devices generated using bio-nanotechnology. Chem. Soc. Rev. 2018, 47, 6486–6504. [Google Scholar] [CrossRef] [PubMed]
- Sun, Y.-L.; Dong, W.-F.; Yang, R.-Z.; Meng, X.; Zhang, L.; Chen, Q.-D.; Sun, H.-B. Dynamically tunable protein microlenses. Angew. Chem. Int. Ed. 2012, 51, 1558–1562. [Google Scholar] [CrossRef] [PubMed]
- Sun, Y.-L.; Sun, S.-M.; Wang, P.; Dong, W.-F.; Zhang, L.; Xu, B.-B.; Chen, Q.-D.; Tong, L.-M.; Sun, H.-B. Customization of protein single nanowires for optical biosensing. Small 2015, 11, 2869–2876. [Google Scholar] [CrossRef]
- Li, Y.; Liu, C.; Feng, X.; Xu, Y.; Liu, B.F. Ultrafast microfluidic mixer for tracking the early folding kinetics of human telomere G-Quadruplex. Anal. Chem. 2014, 86, 4333–4339. [Google Scholar] [CrossRef]
- Liu, Y.; Jiang, X.Y. Why microfluidics? Merits and trends in chemical synthesis. Lab Chip 2017, 17, 3960–3978. [Google Scholar] [CrossRef]
- Ma, J.P.; Lee, S.M.Y.; Yi, C.Q.; Li, C.W. Controllable synthesis of functional nanoparticles by microfluidic platforms for biomedical applications—A review. Lab Chip 2017, 17, 209–226. [Google Scholar] [CrossRef]
- Yoshida, J.; Nagaki, A.; Yamada, T. Flash chemistry: Fast chemical synthesis by using microreactors. Chemistry 2008, 14, 7450–7459. [Google Scholar] [CrossRef]
- Carboni, M.; Capretto, L.; Carugo, D.; Stulz, E.; Zhang, X.L. Microfluidics-based continuous flow formation of triangular silver nanoprisms with tuneable surface plasmon resonance. J. Mater. Chem. C 2013, 1, 7540. [Google Scholar] [CrossRef]
- Abou-Hassan, A.; Sandre, O.; Cabuil, V. Microfluidics in inorganic chemistry. Angew. Chem. 2010, 49, 6268–6286. [Google Scholar] [CrossRef] [PubMed]
- DeMello, A.J. Control and detection of chemical reactions in microfluidic systems. Nature 2006, 442, 394–402. [Google Scholar] [CrossRef] [PubMed]
- Ahmed, D.; Mao, X.; Juluri, B.K.; Huang, T.J. A fast microfluidic mixer based on acoustically driven sidewall-trapped microbubbles. Microfluid. Nanofluid. 2009, 7, 727–731. [Google Scholar] [CrossRef]
- Ozcelik, A.; Ahmed, D.; Xie, Y.; Nama, N.; Qu, Z.; Nawaz, A.A.; Huang, T.J. An acoustofluidic micromixer via bubble inception and cavitation from microchannel sidewalls. Anal. Chem. 2014, 86, 5083–5088. [Google Scholar] [CrossRef] [PubMed]
- Liu, C.; Li, Y.; Liu, B.F. Micromixers and their applications in kinetic analysis of biochemical reactions. Talanta 2019, 205, 120136. [Google Scholar] [CrossRef]
- Amini, H.; Sollier, E.; Masaeli, M.; Xie, Y.; Ganapathysubramanian, B.; Stone, H.A.; Di Carlo, D. Engineering fluid flow using sequenced microstructures. Nat. Commun. 2013, 4, 1826. [Google Scholar] [CrossRef]
- Zhang, Q.; Li, N.; Goebl, J.; Lu, Z.; Yin, Y. A systematic study of the synthesis of silver nanoplates: Is citrate a “magic” reagent? J. Am. Chem. Soc. 2011, 133, 18931–18939. [Google Scholar] [CrossRef]
- Akgul, M.; Karabakan, A.; Acar, O.; Yurum, Y. Removal of silver (I) from aqueous solutions with clinoptilolite. Microporous Mesoporous Mater. 2006, 94, 99–104. [Google Scholar] [CrossRef]
- Syed, S. Silver recovery aqueous techniques from diverse sources: Hydrometallurgy in recycling. Waste Manag. 2016, 50, 234–256. [Google Scholar] [CrossRef]


| Assay Methods | Sensitivity | Range | Detection Limit | Reference |
|---|---|---|---|---|
| Optofluidic DO detector | 7.5 nm∙L∙mg−1 | 0–16 mg∙L−1 | 3.52 µg∙L−1 | This work |
| Iodometric method | − | 0-20 mg∙L−1 | 0.1 mg∙L−1 | [6] |
| Electrode polarography | 5.5 μA L∙mg−1 | 0.2-6.5 mg∙L−1 | 0.02 mg∙L−1 | [8] |
| Fluorescence lifetime | I0/I = 117 | 0-40 mg∙L−1 | − | [9] |
© 2020 by the authors. Licensee MDPI, Basel, Switzerland. This article is an open access article distributed under the terms and conditions of the Creative Commons Attribution (CC BY) license (http://creativecommons.org/licenses/by/4.0/).
Share and Cite
Zuo, Y.; Chen, L.; Hu, X.; Wang, F.; Yang, Y. Silver Nanoprism Enhanced Colorimetry for Precise Detection of Dissolved Oxygen. Micromachines 2020, 11, 383. https://doi.org/10.3390/mi11040383
Zuo Y, Chen L, Hu X, Wang F, Yang Y. Silver Nanoprism Enhanced Colorimetry for Precise Detection of Dissolved Oxygen. Micromachines. 2020; 11(4):383. https://doi.org/10.3390/mi11040383
Chicago/Turabian StyleZuo, Yunfeng, Longfei Chen, Xuejia Hu, Fang Wang, and Yi Yang. 2020. "Silver Nanoprism Enhanced Colorimetry for Precise Detection of Dissolved Oxygen" Micromachines 11, no. 4: 383. https://doi.org/10.3390/mi11040383
APA StyleZuo, Y., Chen, L., Hu, X., Wang, F., & Yang, Y. (2020). Silver Nanoprism Enhanced Colorimetry for Precise Detection of Dissolved Oxygen. Micromachines, 11(4), 383. https://doi.org/10.3390/mi11040383