Article

Modeling and Analysis of the Two-Dimensional Axisymmetric Acoustofluidic Fields in the Probe-Type and Substrate-Type Ultrasonic Micro/Nano Manipulation Systems

1
State Key Lab of Mechanics and Control of Mechanical Structures, Nanjing University of Aeronautics and Astronautics, Nanjing 210016, China
2
Department of Mechanical Engineering and Materials Science, Duke University, Durham, NC 27708, USA
3
Faculty of Mechanical and Material Engineering, Huaiyin Institute of Technology, Huaian 223003, China
4
School of Mechanical Engineering, Nanjing Institute of Technology, Nanjing 211167, China
5
School of Engineering, Jiangxi Agricultural University, Nanchang 330045, China
6
School of Civil and Environmental Engineering, University of Technology Sydney, Sydney, NSW 2007, Australia
*
Authors to whom correspondence should be addressed.
Micromachines 2020, 11(1), 22; https://doi.org/10.3390/mi11010022
Submission received: 28 November 2019 / Revised: 13 December 2019 / Accepted: 20 December 2019 / Published: 24 December 2019
(This article belongs to the Special Issue Acoustofluidics)

Abstract

:
The probe-type and substrate-type ultrasonic micro/nano manipulation systems have proven to be two kinds of powerful tools for manipulating micro/nanoscale materials. Numerical simulations of acoustofluidic fields in these two kinds of systems can not only be used to explain and analyze the physical mechanisms of experimental phenomena, but also provide guidelines for optimization of device parameters and working conditions. However, in-depth quantitative study and analysis of acoustofluidic fields in the two ultrasonic micro/nano manipulation systems have scarcely been reported. In this paper, based on the finite element method (FEM), we numerically investigated the two-dimensional (2D) axisymmetric acoustofluidic fields in the probe-type and substrate-type ultrasonic micro/nano manipulation systems by the perturbation method (PM) and Reynolds stress method (RSM), respectively. Through comparing the simulation results computed by the two methods and the experimental verifications, the feasibility and reasonability of the two methods in simulating the acoustofluidic fields in these two ultrasonic micro/nano manipulation systems have been validated. Moreover, the effects of device parameters and working conditions on the acoustofluidic fields are clarified by the simulation results and qualitatively verified by the experiments.

1. Introduction

In the past two decades, acoustic micro/nano manipulation methods [1,2,3] have shown tremendous potential applications in biomedical engineering [4,5], bioanalytical chemistry [6,7], material science [8,9], micro/nano fabrication [10,11], lab-on-a-chip (LOC) technology [12,13] and so forth. Compared to other physical micro/nano manipulation methods, such as optical methods [14,15], magnetic methods [16,17,18], mechanical methods [19,20], and dielectrophoretic (DEP) methods [21,22,23], acoustic micro/nano manipulation methods possess the merits such as simple fabrication, little selectivity to optical/electrical/magnetic properties of manipulated samples, and good compatibility with other LOC components [1,2]. The acoustic micro/nano manipulation devices can be divided into two major categories, i.e., surface acoustic wave (SAW)-based devices [24,25] and bulk acoustic wave (BAW)-based devices [1]. For SAW-based devices, diverse manipulation functions, such as trapping [26,27], patterning [28,29], separation [30,31], concentration [32,33], mixing [34,35], and rotation [36,37] have been implemented by various groups. For BAW-based devices, manipulation functions such as levitation [38,39], assembly [40,41], focusing [42,43] and sorting [44] have also been realized by many researchers.
It is well known that in acoustic micro/nano manipulation systems, acoustic radiation force [45] and acoustic streaming [46,47,48,49,50] are employed to implement micro/nano manipulation functions. Therefore, both experimental measurement and numerical modeling of these two kinds of acoustic physical effects are essential for experimental phenomenon explanations and parameter optimizations [51,52,53,54,55,56]. For acoustic radiation force, numerical simulations based on Gor’kov’s theory [45] have grown to be relatively mature [57,58]. For acoustic streaming, to date, there have been three mainstream simulation methods, that is, the limiting/slip velocity method [59,60,61], the perturbation method (PM) [46,62,63,64,65,66], and the Reynolds stress method (RSM) [47,67]. The limiting/slip velocity method can only be applied to simulate acoustic streaming driven by boundary layers [68], but is inapplicable for simulating Eckart streaming [69]. The PM and RSM are capable of simulating most kinds of acoustic streaming fields, including Eckart streaming [69], Rayleigh streaming [70] and Schlichting streaming [71]. Commonly, numerical simulations of 2D acoustic streaming fields are restricted to 2D rectangular coordinate system-based simulations by assuming that longitudinal lengths of microchannels [72,73] or depths of chambers [74] are infinite. However, numerical simulations of 2D axisymmetric acoustic streaming fields have rarely been reported, which may play important roles in droplet-based acoustofluidics [66,67].
Although both the PM and RSM can be applied to simulate most kinds of acoustic streaming fields, in the reported literatures in the field of Acoustofluidics, the PM is more inclined to be utilized for simulating acoustic streaming fields in SAW acoustofluidic devices and systems [32,61,72], while the RSM is more adopted to simulate acoustic streaming fields in BAW acoustofluidic devices and systems [1,67,74]. However, there has been no literature with respect to comparisons of simulation results computed by the PM and RSM, and some researchers even get confused when facing the issue that how to select the most appropriate method for simulating acoustic streaming fields in specific acoustofluidic systems. Therefore, it is necessary to physically understand the algorithm difference between the PM and RSM for engineering simulations of acoustic streaming.
The authors’ group has proposed many acoustic micro/nano manipulation principles [1] based on the probe-type [75,76] and substrate-type [77,78] ultrasonic devices. For the probe-type ultrasonic devices, the ultrasonic probe-droplet-substrate system, in which an ultrasonically vibrating micro manipulating probe (MMP) is inserted into a droplet of micro/nanoscale object suspension on a stationary substrate, is established to manipulate micro/nanoscale objects at the droplet-substrate interface near the MMP. Based on the ultrasonic probe-droplet-substrate system, manipulation functions such as trapping [75], rotation [79], removal [80] and concentration [81] have been implemented. For the substrate-type ultrasonic devices, the droplet-ultrasonic substrate system, in which a droplet of micro/nanoscale object suspension is placed on an ultrasonically vibrating substrate, is established to manipulate micro/nanoscale objects at the droplet-substrate interface. Concentration of silver nanowires (AgNWs) has been realized by this system [82]. However, quantitative analysis of the acoustofluidic fields (especially the acoustic streaming fields) in the aforementioned systems is very insufficient, which hinders the deeper understanding of dynamics of micro/nanoscale objects in the manipulation processes, as well as the optimization of devices’ parameters.
In this work, based on the finite element method (FEM), we quantitatively investigate the 2D axisymmetric acoustofluidic fields in the probe-type and substrate-type ultrasonic micro/nano manipulation systems by the PM and RSM, respectively. By numerical simulations and experimental verifications, the effects of device parameters and working conditions on the acoustofluidic fields have been elucidated by the computation and verified by the experiments.

2. Basic Theories and Simulation Methods of 2D Axisymmetric Acoustic Streaming Fields

The fundamental governing equations of acoustic streaming theory of the perturbation method (PM) and Reynolds stress method (RSM) are firstly introduced, respectively, and then the two simulation methods are elaborated.

2.1. The Perturbation Method (PM)

Herein, the fluid is assumed to be homogeneous and isotropic, in which the continuity and the compressible Navier-Stokes (N-S) equations are satisfied as
ρ t + ( ρ u ) = 0  
ρ ( u t + u u ) = p + μ 2 u + ( μ b + 1 3 μ ) ( u )
where ρ, μ, and μb are the mass density, shear viscosity, and bulk viscosity of the fluid, respectively; p and u are the pressure and velocity (Eulerian) in the fluid, respectively.
It is assumed by Nyborg’s perturbation theory [46] that the second-order acoustic streaming field is superposed on the first-order acoustic field. Using this theory, the fluid density, pressure, and velocity (absence of background flow) can, respectively, be expressed as
ρ = ρ 0 + ρ 1 + ρ 2 +
p = p 0 + p 1 + p 2 +
u = u 1 + u 2 +
where the subscripts 0, 1 and 2 represent the static (absence of sound), first-order and second-order quantities, respectively. By substituting Equations (3)–(5) into Equations (1) and (2) and only considering the equations of the first-order terms, equations for solving the first-order acoustic field can be obtained as
ρ 1 t + ρ 0 ( u 1 ) = 0
ρ 0 u 1 t = p 1 + μ 2 u 1 + ( μ b + 1 3 μ ) ( u 1 )
Repeating the above process, considering the equations of the second-order terms and taking the time average, the continuity and N-S equations for solving the second-order time-averaged acoustic streaming field can be expressed as
ρ 2 t + ρ 0 u 2 + ρ 1 u 1 = 0
ρ 0 u 2 t + ρ 0 u 1 u 1 + ρ 1 u 1 t = p 2 + μ 2 u 2 + ( μ b + 1 3 μ ) ( u 2 )
where 〈A〉 denotes the time average of the quantity A over a full oscillation time period. For the steady second-order acoustic streaming flow state, ρ 2 t = 0 and u 2 t = 0 , and then Equations (8) and (9) become
ρ 0 u 2 = ρ 1 u 1
p 2 + μ 2 u 2 + ( μ b + 1 3 μ ) ( u 2 ) = ρ 0 u 1 u 1 + ρ 1 u 1 t
It is seen that the physical quantities of the first-order acoustic field act as the source terms (at the right-hand sides of Equations (10) and (11)) for the second-order acoustic streaming field (at the left-hand sides of Equations (10) and (11)). Thus, the driving force of acoustic streaming FP can be written as
F P = ρ 1 u 1 t ρ 0 u 1 u 1

2.2. The Reynolds Stress Method (RSM)

It is claimed by Lighthill that acoustic streaming is forced by the action of the Reynolds stress, which is defined as the mean value of the acoustic momentum flux [83]. In acoustic fields, the second-order tensor form of the Reynolds stress can be expressed as
R = ρ 0 u 1 u 1
The divergence of the Reynolds stress tensor can cause a net force per unit volume, i.e., the driving force of acoustic streaming FR, to act on the fluid, and it can be written as
F R = R = ρ 0 u 1 u 1 = ρ 0 ( u 1 ) u 1 + u 1 ( u 1 )
The steady acoustic streaming field generated by FR satisfies the N-S equation
ρ 0 ( u 2 u 2 ) = p 2 + μ 2 u 2 + ( μ b + 1 3 μ ) ( u 2 ) + F R
The acoustic streaming field also satisfies the continuity equation
u 2 = 0
According to the algorithm of the divergence of the second-order tensor in the 3D cylindrical coordinate system (r, θ, z), the r-, θ- and z-directional components of FR can be expressed as
F r = ρ 0 u 1 r 2 r 1 r ρ 0 u 1 r u 1 θ θ ρ 0 u 1 r u 1 z z ρ 0 u 1 r 2 r
F θ = ρ 0 u 1 θ u 1 r r 2 1 r ρ 0 u 1 θ 2 θ ρ 0 u 1 θ u 1 z z ρ 0 u 1 r u 1 θ r
F z = ρ 0 u 1 z u 1 r r 1 r ρ 0 u 1 z u 1 θ θ ρ 0 u 1 z 2 z ρ 0 u 1 r u 1 z r
where u1r, u and u1z are the r-, θ- and z-directional acoustic velocities in the 3D cylindrical coordinate system, respectively. Taking the 2D axisymmetric form of the driving force, the r- and z-directional components of FR can be simplified as
F r = ρ 0 u 1 r 2 r ρ 0 u 1 r u 1 z z ρ 0 u 1 r 2 r
F z = ρ 0 u 1 z u 1 r r ρ 0 u 1 z 2 z ρ 0 u 1 r u 1 z r
Compared with the expression of components of FR in the 2D rectangular coordinate system [84], nonlinear terms ρ 0 u 1 r 2 / r and ρ 0 u 1 r u 1 z / r are generated in Fr and Fz, respectively. Herein, to investigate the effect of these nonlinear terms on the acoustic streaming fields, we define the driving force of acoustic streaming without the nonlinear terms as FR1, and the components of FR1 are expressed as
F r 1 = ρ 0 u 1 r 2 r ρ 0 u 1 r u 1 z z
F z 1 = ρ 0 u 1 z u 1 r r ρ 0 u 1 z 2 z
In this work, numerical simulations of acoustofluidic fields are carried out by the commercial FEM software COMSOL Multiphysics 5.3a (Burlington, MA, USA). The computational process consists of the following two steps. In the first step, acoustic field, which mainly includes the acoustic velocity field and acoustic pressure field, is computed according to the external actuation conditions and acoustic boundary conditions. In the second step, with the computed result of acoustic field, the acoustic streaming field is computed according to the fluidic boundary conditions. For the PM, the right-hand side of Equation (10) is included as a source term by adding a so-called weak contribution to the governing equations, and Equation (12) acts as a body force term. For the RSM, Equations (20) and (21) act as the body force terms in the r and z directions, respectively. More detailed descriptions of the FEM models will be shown in Section 3.

3. Numerical Models

3.1. The Ultrasonic Probe-Droplet-Substrate System for Micro/Nanoscale Particle Removal

A numerical model for the ultrasonic probe-droplet-substrate system for micro/nanoscale particle removal is illustrated in Figure 1a. In COMSOL Multiphysics, the Thermoacoustics-Solid Mechanics coupled module is firstly used to compute the acoustic field by exciting the MMP in the z direction. The acoustic boundary condition is shown in Figure 1b, in which the normal impedance Z 0 = ρ a i r c a i r is adopted at the droplet-air interface; the droplet-substrate interface is set to be slip; the MMP-droplet interface is set to be the thermoviscous acoustic-structure boundary. All of the interfaces are set to be isothermal. In the Laminar Flow module for simulating the acoustic streaming field, the fluidic boundary condition is shown in Figure 1c, in which all of the interfaces are set to be slip [76,80,81,85,86,87].
The meshed FEM models of the ultrasonic probe-droplet-substrate system for the PM and RSM are shown in Figure 1d,e, respectively, in which the radius and height of the droplet are 5 mm and 2 mm, respectively. The maximum element size of the MMP is set to be 5 μm (1/3 of the radius of the MMP when R = 15 μm) in the models.
For simulating the acoustofluidic field by the PM, as shown in Figure 1d, the computational mesh is generated from a maximum element size 2δ at the fluid domain boundaries and a maximum element size in the bulk of the fluid domain given by 10δ, where δ = 2 μ ω ρ 0 is the viscous boundary layer thickness at 40 kHz (ω is the angular frequency of acoustic field) [1]. This mesh constitution scheme has proven to be effective and mesh converged and independent [61,62,72,88].
For simulating the acoustofluidic field by the RSM, since the driving force components (Equations (20) and (21)) contain nonlinear terms, the variation of the driving force for acoustic streaming may be drastic within the fluid domain near the MMP. Therefore, to precisely compute the driving force for acoustic streaming in the whole fluid domain as much as possible, based on the computation capability of the laptop (Lenovo E51-80-ISE, i7-6500U CPU, 16G RAM), the maximum element size of the fluid domain near the MMP is set to be 10 μm (about 0.34% of the wavelength of acoustic field at 40 kHz) in 0 < r < 0.5 mm region (Region 1), where removal of micro/nanoscale particles occurs. As shown in Figure 1e, the maximum element sizes of the rest fluid domain are set to be 20 μm (about 0.68% of the wavelength of acoustic field at 40 kHz) in 0.5 < r < 1.5 mm region (Region 2), and 40 μm (about 1.36% of the wavelength of acoustic field at 40 kHz) in 1.5 < r < 5 mm region (Region 3), respectively. The mesh independence analysis for this mesh constitution scheme can be found in the Supplementary Materials.

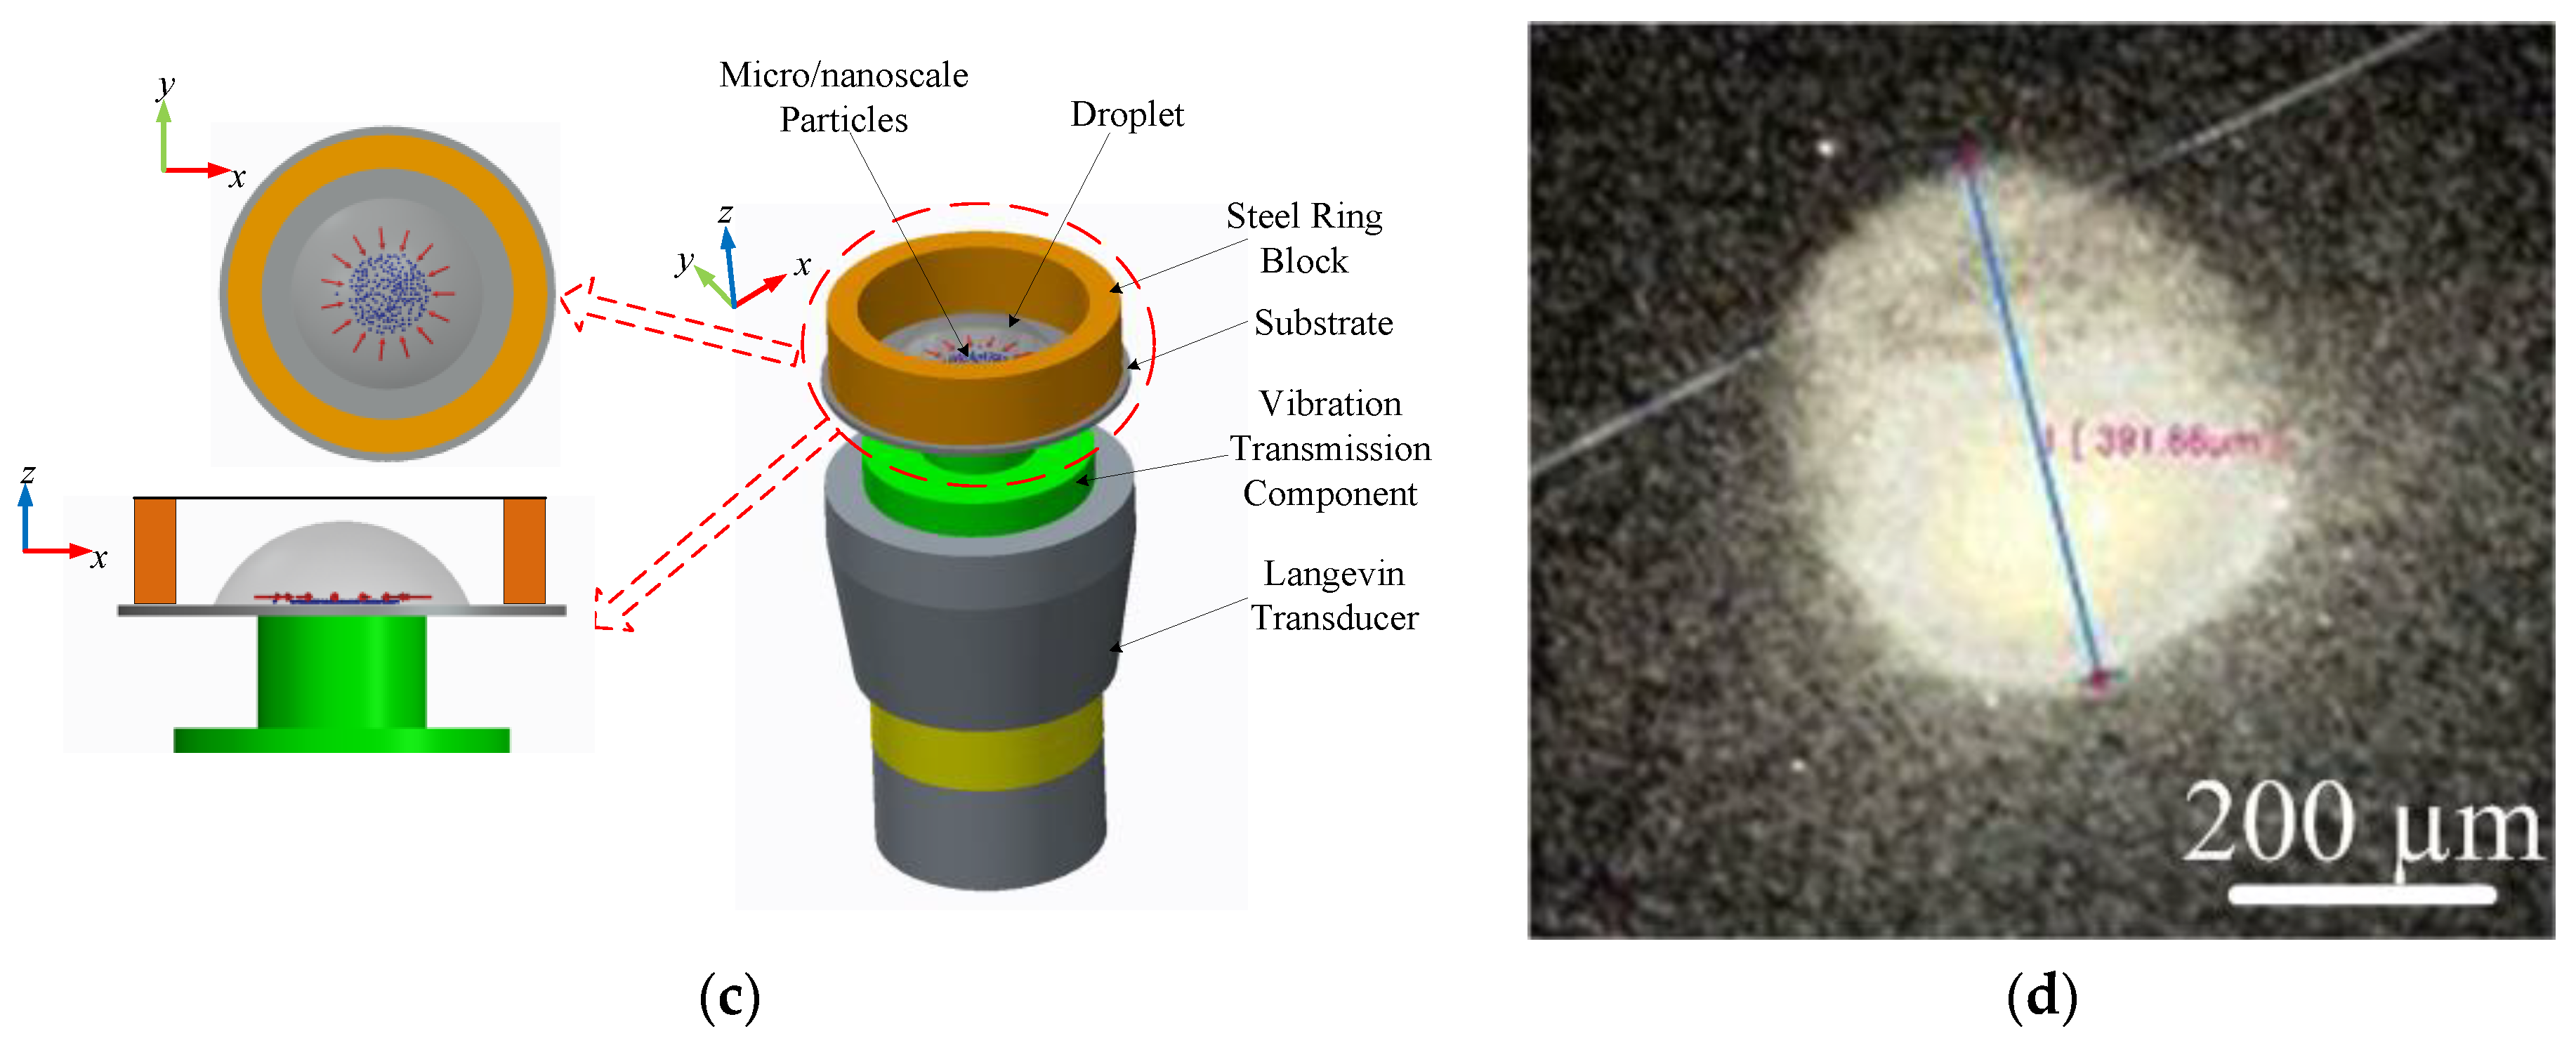
3.2. The Droplet-Ultrasonic Substrate System for Micro/Nanoscale Particle Concentration

A numerical model for the droplet-ultrasonic substrate system for micro/nanoscale particle concentration is illustrated in Figure 2a. The Thermoacoustics module is firstly utilized to compute the acoustic field by harmonically actuating the partial boundary of the fluid in the z direction. The acoustic and fluidic boundary conditions are shown in Figure 2b,c, respectively.
The meshed FEM models of the droplet-ultrasonic substrate system for the PM and RSM are shown in Figure 2d,e, respectively, in which the radius and height of the droplet are 5 mm and 2 mm, respectively.
For simulating the acoustofluidic field by the PM, as shown in Figure 2d, the computational mesh is generated from a maximum element size 2δ at the fluid domain boundaries and a maximum element size in the bulk of the fluid domain given by 10δ.
For simulating the acoustofluidic field by the RSM, as shown in Figure 2e, the maximum element size of the fluid domain is set to be 10 μm in 0 < r < 0.5 mm region (Region 1). In the rest fluid domain, the maximum element sizes are set to be 20 μm in 0.5 < r < 1.5 mm region (Region 2), and 40 μm in 1.5 < r < 5 mm region (Region 3), respectively. The mesh independence analysis for this mesh constitution scheme can also be found in the Supplementary Materials.
To discretize the computational models, linear, quadratic Lagrangian and quadratic Lagrangian shape functions are chosen for the acoustic pressure, acoustic velocity and temperature fields in the Thermoacoustics module, respectively. The quadratic serendipity elements are utilized to discretize the displacement field of solid in the Solid Mechanics module. In the Laminar Flow module, the discretization of Laminar Flow is set to be P3 + P2 elements (third-order elements for the velocity components and second-order elements for the pressure field). For the computation of acoustic field, the relative tolerance is set to be 0.001 in the Frequency Domain solver. For the computation of acoustic streaming field, the relative tolerance is also set to be 0.001 in the Steady State solver.

4. Experimental Verification

4.1. The Ultrasonic Probe-Droplet-Substrate System-Based Micro/Nanoscale Particle Removal

In order to experimentally verify the FEM simulation results, an ultrasonic probe-droplet-substrate system for micro/nanoscale particle removal at the droplet-substrate interface is constructed. The experimental microscale particles (yeast cells, Angel Yeast Co., Ltd., Yichang, China) and nanoscale particles (Si nanoparticles, SiNPs, Beijing DK Nano Technology Co., Ltd., Beijing, China) have the average diameters of 4 μm and 400 nm, respectively. As shown in Figure 3a, the vibration transmission needle (VTN), which is made of nickel-plated steel (Shanghai Dongfeng Co., Ltd., Shanghai, China), is bonded to the radiation surface of a Langevin transducer (Suzhou Hainertec Co., Ltd., Suzhou, China), which vibrates with the piston mode [89]. Thus, the VTN can vibrate flexurally in the z direction. The MMP with the radius R and length L, which is made of glass fiber (Nanjing Fiberglass Research & Design Institute Co., Ltd., Nanjing, China), is bonded to the tip of the VTN, and thereby vibrates in the z direction with the vibration velocity amplitude Vpvib. The MMP is inserted into the droplet of micro/nanoscale particle suspension on a silicon substrate (Zhejiang Lijing Co., Ltd., Hangzhou, China), and the distance between the MMP’s tip and substrate surface H is controlled by the manual X-Y-Z moving stage (LD125-LM-2, Shengling Precise Machinery Co., Ltd., Dongguan, China). The maximum height and radius of the droplet are 2 mm and 5 mm, respectively. The driving voltage for the device is sinusoidal, and the device works at its resonance frequency fp. Figure 3b shows the stable removal effect of yeast cells when R = 15 μm, L = 4 mm, Vpvib = 0.3 m/s, H = 50 μm and fp = 40 kHz (the concentration of the yeast cell suspension is 1.38 mg/mL).

4.2. The Droplet-Ultrasonic Substrate System-Based Micro/Nanoscale Particle Concentration

A droplet-ultrasonic substrate system for micro/nanoscale particle concentration at the droplet-substrate interface is also constructed. The experimental microscale particles (yeast cells) and nanoscale particles (Ag nanoparticles, AgNPs, Beijing DK Nano Technology Co., Ltd., China) have the average diameters of 4 μm and 400 nm, respectively. As shown in Figure 3c, a vibration transmission component (VTC), whose radiation head’s radius is RE, is bonded to the radiation surface of a Langevin transducer, which vibrates with the piston mode in the z direction. The vibration velocity amplitude of the VTC’s radiation head is defined as Vsvib. A silicon substrate equipped with a steel ring block, which is used to restrain the flexural vibration of the substrate, is bonded to the VTC’s radiation head. A droplet of micro/nanoscale particle suspension, of which the maximum height and radius are 2 mm and 5 mm, respectively, is placed at the center of the substrate. The driving voltage for the device is sinusoidal, and the device works at its resonance frequency fs. Figure 3d shows the stable aggregation of AgNPs when RE = 3 mm, Vsvib = 10 mm/s and fs = 40 kHz (the concentration of the AgNP suspension is 2.78 mg/mL).

5. Results and Discussion

Unless otherwise specified, structural sizes, material parameters and working conditions of the manipulation systems listed in Table 1 are used in the simulations.

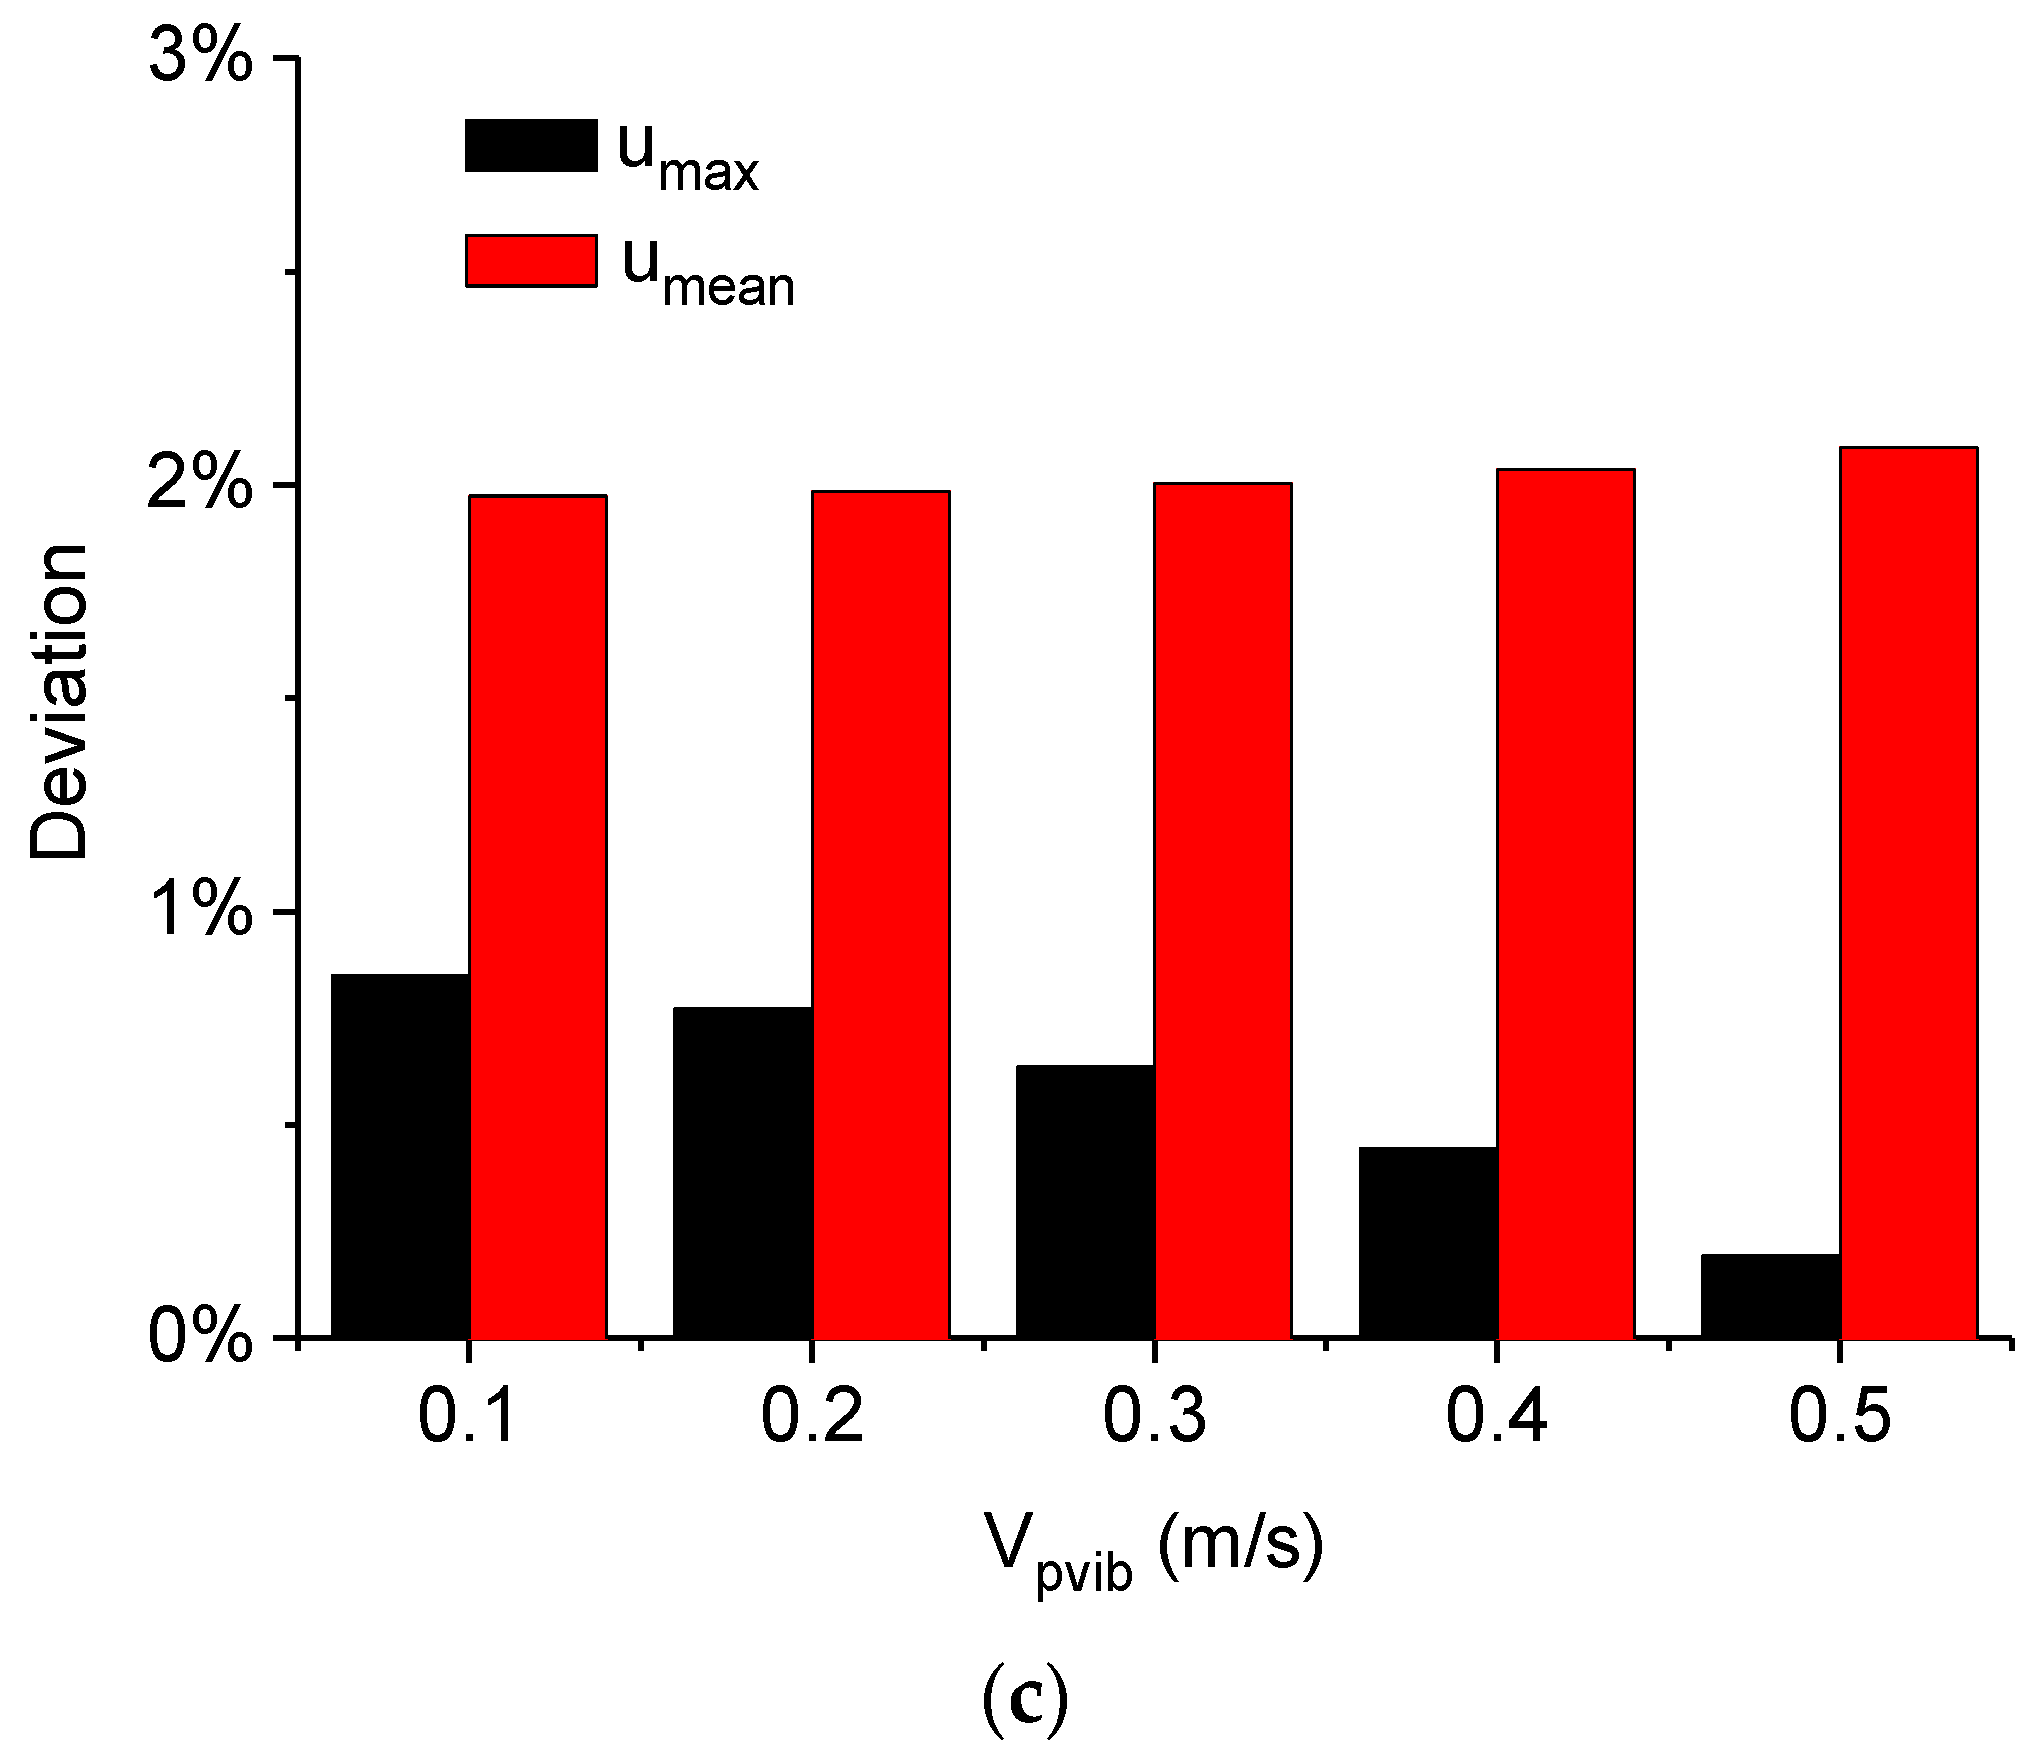
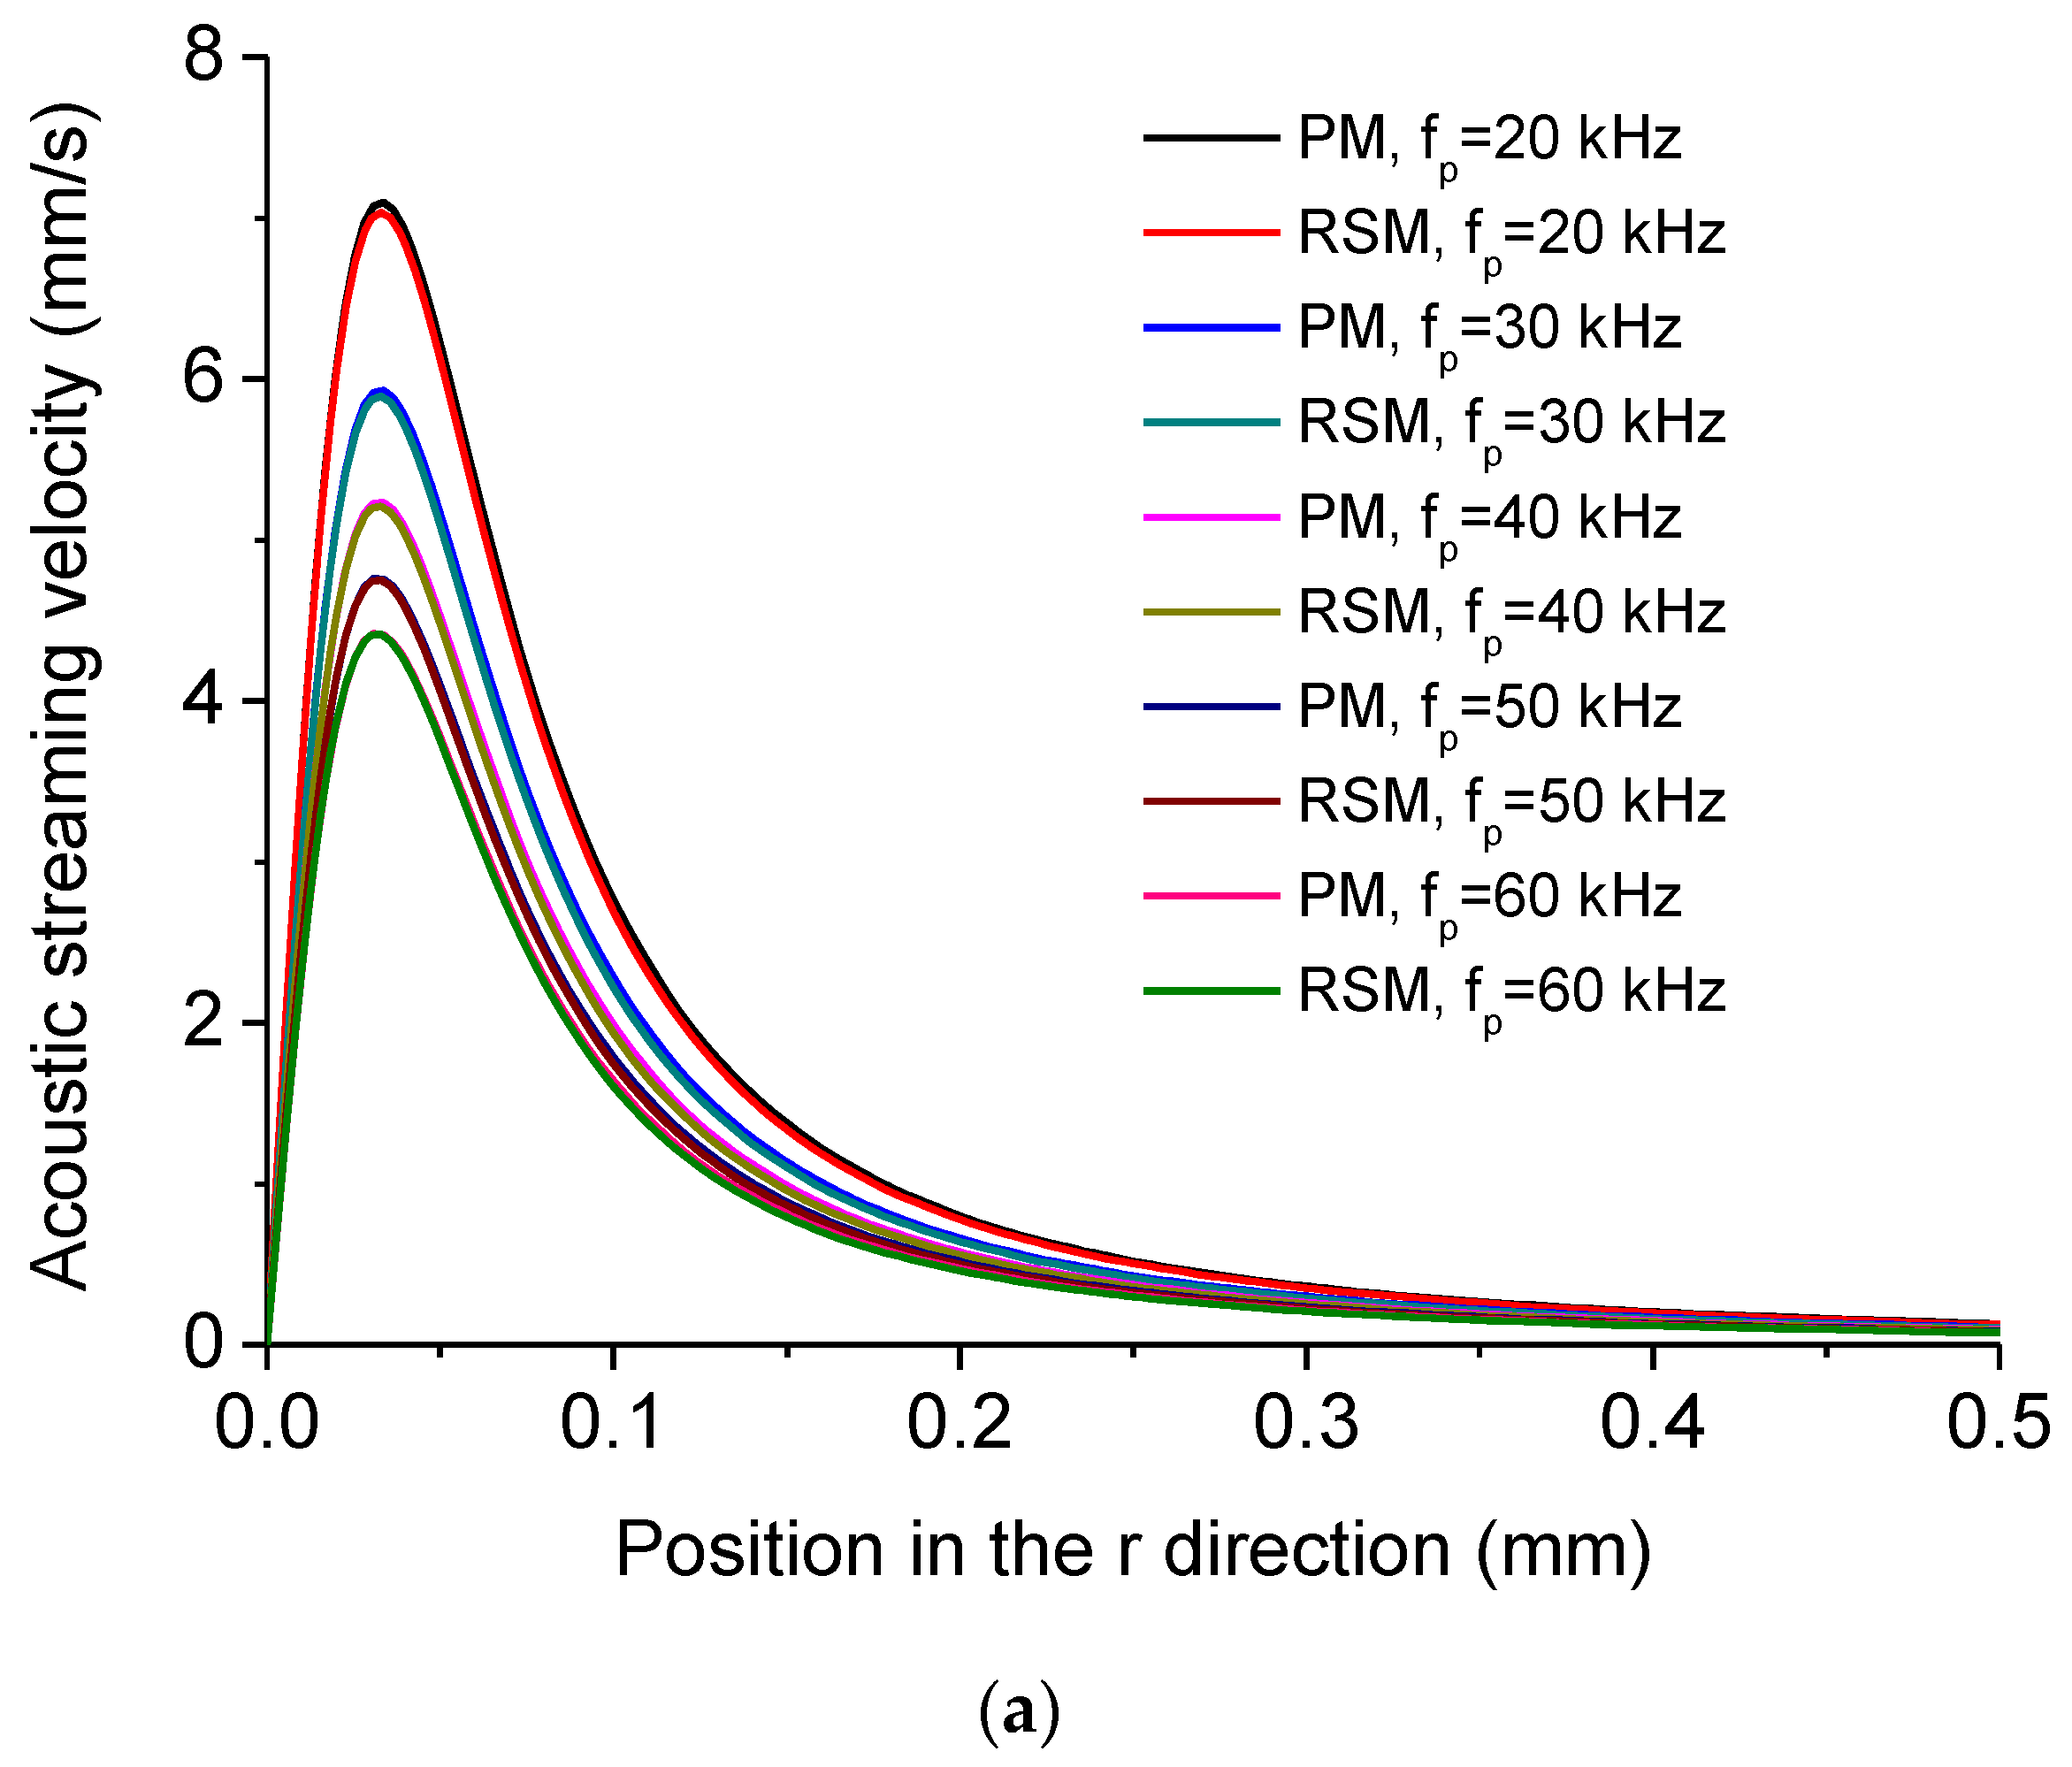
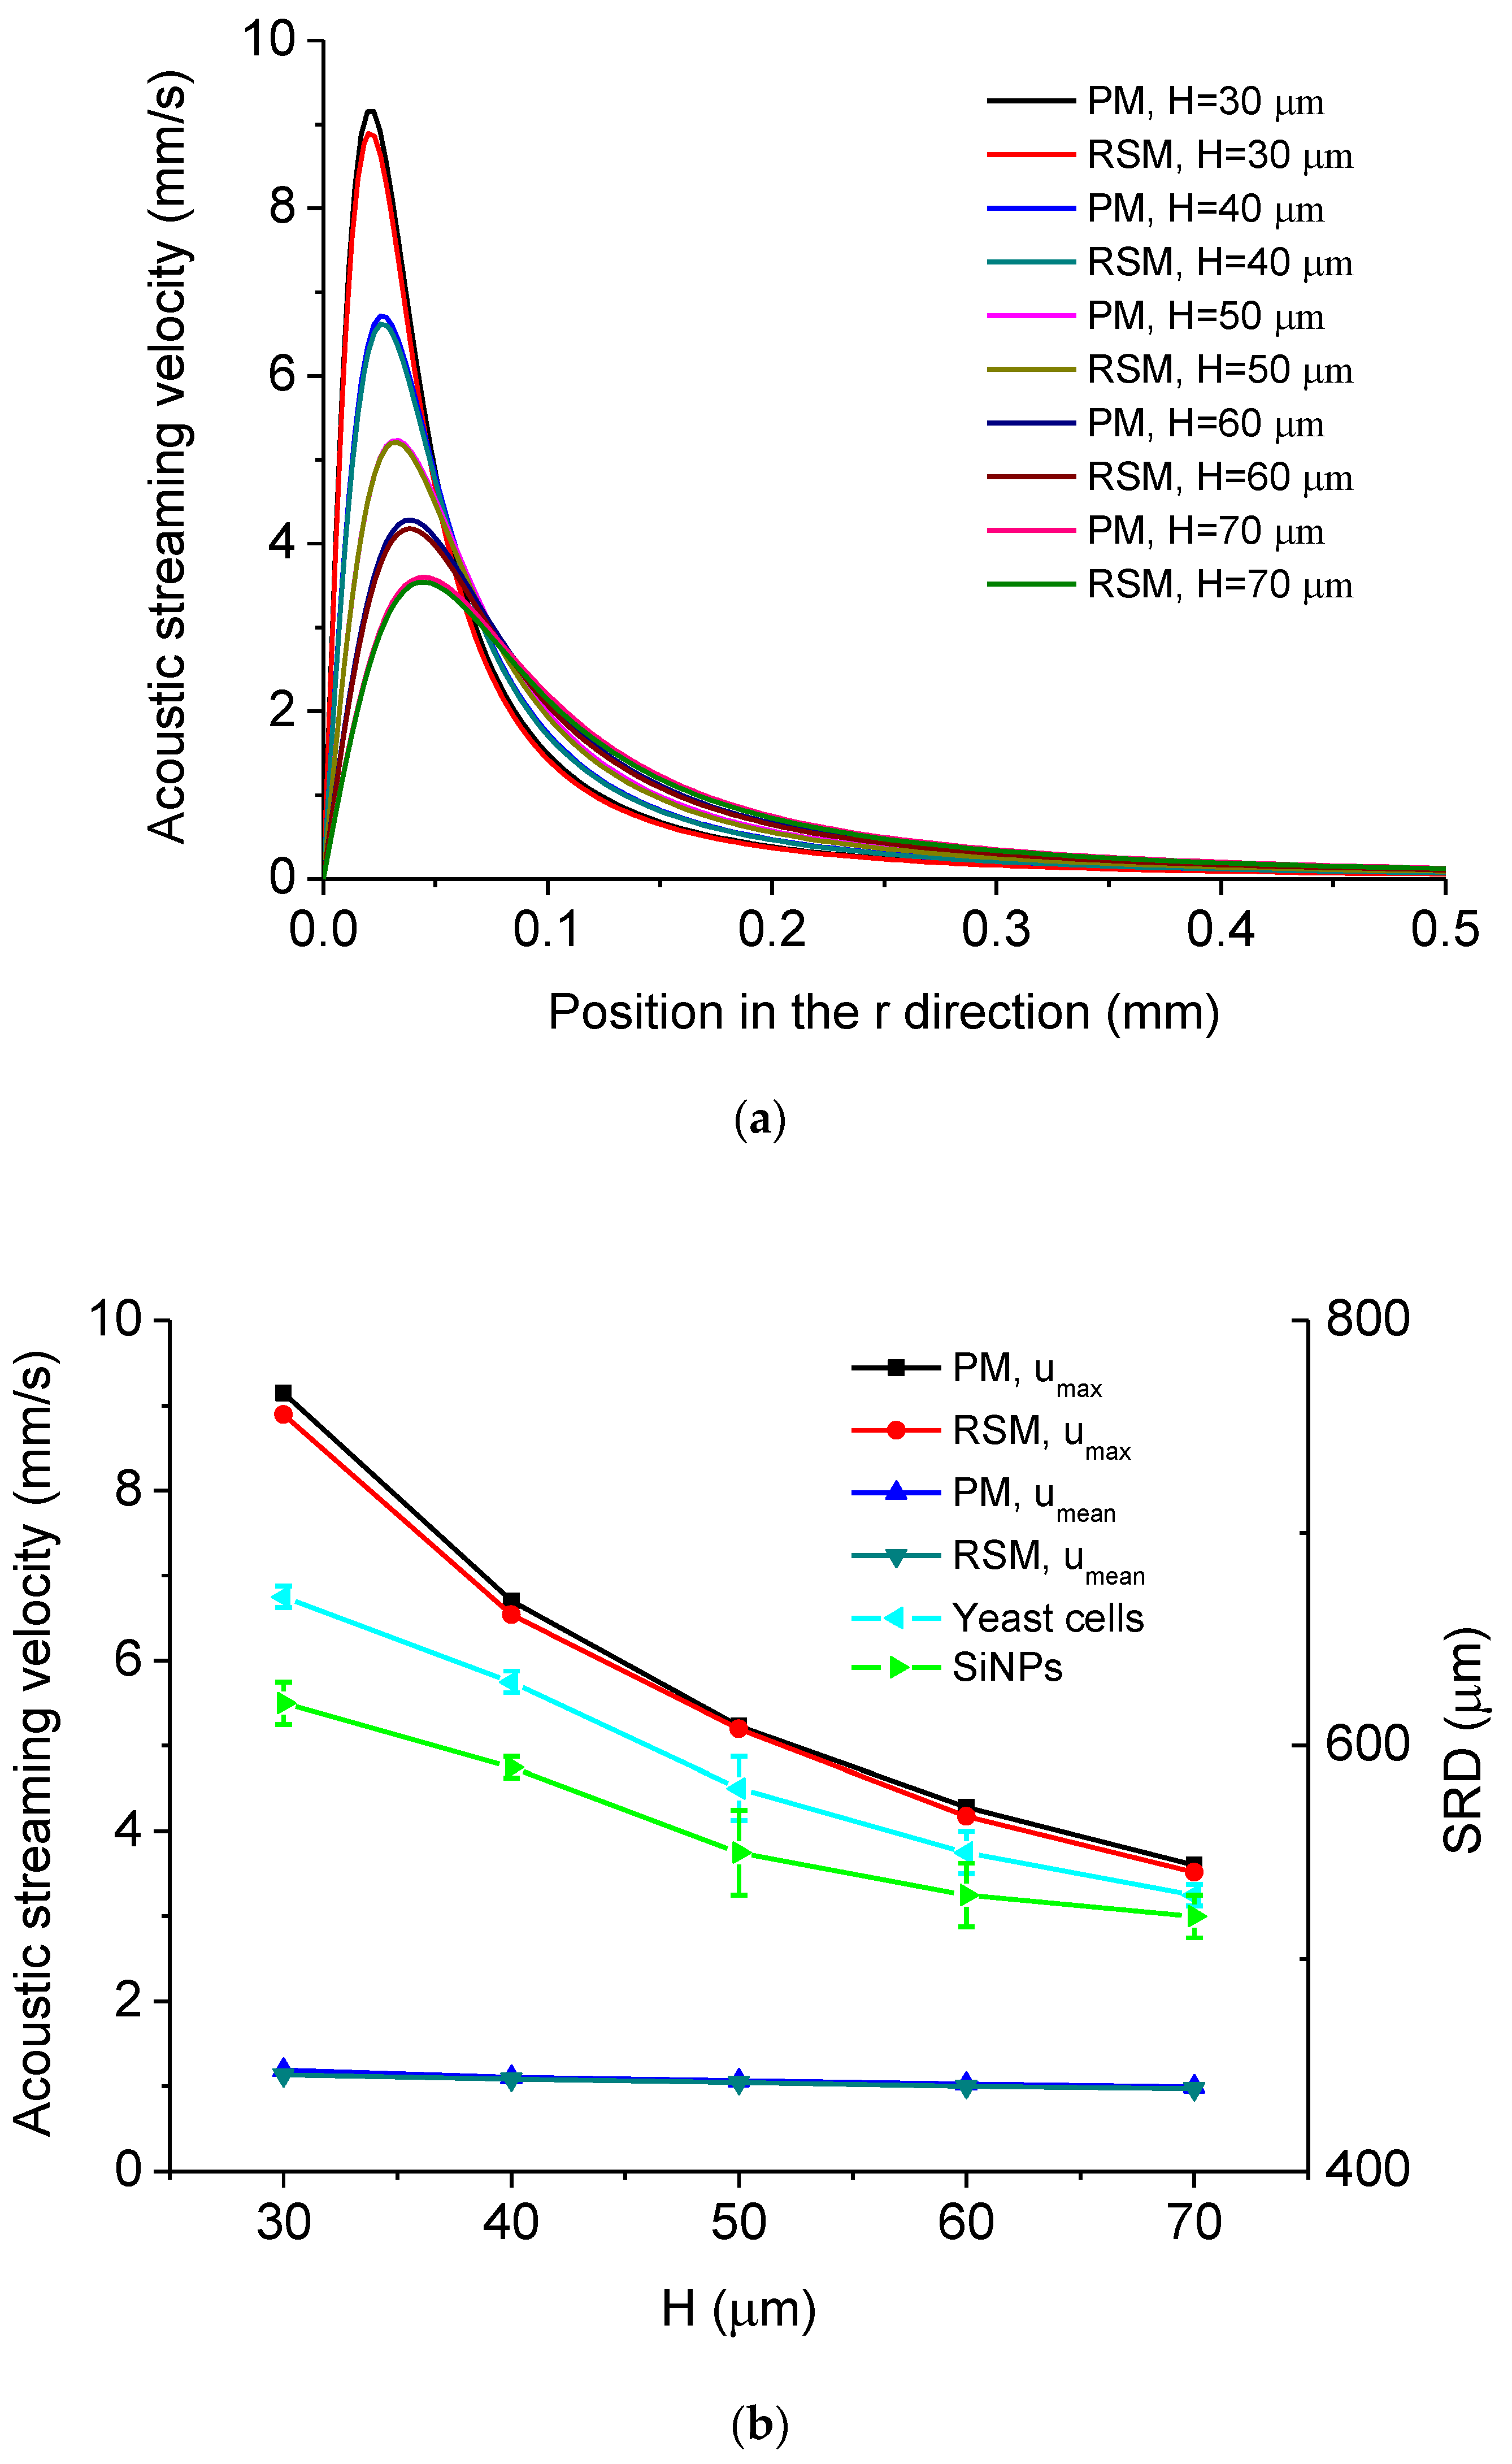
5.1. Simulated Acoustofluidic Fields in the Ultrasonic Probe-Droplet-Substrate System for Micro/Nanoscale Particle Removal

The simulated acoustic streaming fields in the ultrasonic probe-droplet-substrate system for micro/nanoscale particle removal by the PM and RSM are shown in Figure 4a,b, respectively, and the local enlarged images show the acoustic streaming patterns at the droplet-substrate interface near the MMP. It is seen from Figure 4a,b that as the acoustic streaming flows outwards from point o, micro/nanoscale particles can be dragged outwards and then a round cleaned area can be formed after a period of sonication (Figure 3b). Finally, a cleaned area with stable removal diameter (SRD) can be obtained, and the SRD is measured to be below millimeter scale.
In the ultrasonic probe-droplet-substrate system, we compare the drag force induced by acoustic streaming with the acoustic radiation force applied on the manipulated micro/nanoscale particles and find that acoustic streaming is dominant when the radius of manipulated particles falls between 100 nm and 10 microns (see Supplementary Materials). Thus, the effect of acoustic radiation force can be neglected in the ultrasonic probe-droplet-substrate system. The detailed information of the acoustic streaming fields will be discussed and analyzed in the following sections.
As emphasized in Section 2.2, to validate the significance and indispensability of the nonlinear terms in FR, we compare the simulated acoustic streaming fields in the ultrasonic probe-droplet-substrate system when the driving forces of acoustic streaming are FR and FR1, respectively. Figure 4c shows the acoustic streaming velocity distribution at the droplet-substrate interface when the driving forces of acoustic streaming are FR and FR1, respectively. We extract the maximum acoustic streaming velocity umax in Figure 4c and the mean acoustic streaming velocity umean, which is defined as
u m e a n = 0 0.5   mm u r d r 0.5   mm
where ur is the acoustic streaming velocity at the r position. From Figure 4c, the deviations for umax and umean are calculated to be 8.66% and 5.3%, respectively. Therefore, the nonlinear terms in FR are non-negligible for simulating acoustic streaming fields in the ultrasonic probe-droplet-substrate system by the RSM.
The dependency of acoustic streaming velocity on the vibration velocity amplitude of the MMP Vpvib is shown in Figure 5. Figure 5a shows the distribution of acoustic streaming velocity along the r direction at the droplet-substrate interface computed by the PM and RSM under different Vpvib. It is seen that the acoustic streaming velocity firstly increases with the increase of r and then reaches umax, after which the acoustic streaming velocity decreases with the increase of r and tends to 0 when r = 0.5 mm. Figure 5b shows umax, umean and experimentally measured SRD of the cleaned area for yeast cells and SiNPs versus Vpvib. In Figure 5b, Vpvib was controlled by changing the input power of the device (Figure 3a), and the standard deviation is obtained by five times of experimental measurements. It is seen that both umax and umean increase with the increase of Vpvib, which accounts for that the SRD increases with the increase of Vpvib. In this case, one can realize the pinpoint or relatively large-area removal of micro/nanoscale particles [90] by easily tuning the input power of the device. Meanwhile, in Figure 5b, both umax and umean computed by the PM are always larger than those computed by the RSM when Vpvib is the same. To quantitatively demonstrate the deviation of acoustic streaming velocity computed by the PM and RSM, we define the deviation as
D = u P M u R S M u R S M × 100 %
where uPM and uRSM are the simulated acoustic streaming velocities by the PM and RSM, respectively, and the results for umax and umean versus Vpvib are shown in Figure 5c. It is seen from Figure 5c that D of umax is always smaller than that of umean. Also, D of umax decreases with the increase of Vpvib, while D of umean changes little. To physically understanding this result, we further process the driving force of acoustic streaming under the framework of the PM FP. Firstly, we multiply both sides of Equation (6) by -u1 and take the time-averaged form. Then, we can obtain
u 1 ρ 1 t ρ 0 u 1 u 1 = 0
We add Equation (26) to Equation (12) and can obtain
F P = ρ 1 u 1 t u 1 ρ 1 t ρ 0 u 1 u 1 ρ 0 u 1 u 1 = ( ρ 1 u 1 ) t + F R
Obviously, it is seen from Equation (27) that the difference of driving force of acoustic streaming between the PM and RSM is ( ρ 1 u 1 ) / t , and we define it as Fadd. The reason for that D of umax decreases with the increase of Vpvib may be that as Vpvib increases, i.e., the input power for the acoustic field increases, Fadd becomes less important compared to the main driving force of acoustic streaming (FR) in this system.
The dependency of acoustic streaming velocity on the driving frequency of the system fp is shown in Figure 6. Figure 6a shows the distribution of acoustic streaming velocity along the r direction at the droplet-substrate interface computed by the PM and RSM under different fp. Figure 6b shows umax, umean and experimentally measured SRD of the cleaned area for yeast cells and SiNPs versus fp. In Figure 6b, the SRD versus fp was measured with five Langevin transducers with different resonance frequencies (20 kHz, 28 kHz, 40 kHz, 51 kHz, 60 kHz). It is seen from Figure 6b that both umax and umean decrease with the increase of fp, which accounts for that the SRD decreases with the increase of fp. This result indicates that the lower driving frequency is beneficial to removing micro/nanoscale particles within larger areas. Figure 6c shows D of umax and D of umean versus fp, respectively, and it is seen that D of umax decreases with the increase of fp. This is because that although Vpvib is kept the same, the higher input frequency corresponds to the higher input power for the acoustic field [91], in which case Fadd becomes less significant compared to FR when fp increases in this system.
The dependency of acoustic streaming velocity on the distance between the MMP’s tip and substrate surface H is shown in Figure 7. Figure 7a shows the distribution of acoustic streaming velocity along the r direction at the droplet-substrate interface computed by the PM and RSM under different H, from which it is seen that the position where umax occurs moves outwards from point o when H increases. Figure 7b shows umax, umean and experimentally measured SRD of the cleaned area for yeast cells and SiNPs versus H, from which it is seen that both umax and umean decrease with the increase of H, which accounts for that the SRD decreases with the increase of H. In this case, one can realize the pinpoint or relatively large-area removal of micro/nanoscale particles just by tuning the distance between the MMP’s tip and substrate surface through controlling the X-Y-Z moving stage. Figure 7c shows D of umax and D of umean versus H, respectively, and it is seen that D of umax is in the range of 0.6% to 2.9%, while D of umean is in the range of 1.9% to 4.6%.
The dependency of acoustic streaming velocity on the radius of the MMP R is shown in Figure 8. Figure 8a shows the distribution of acoustic streaming velocity along the r direction at the droplet-substrate interface computed by the PM and RSM under different R. Figure 8b shows umax, umean and experimentally measured SRD of the cleaned area for yeast cells and SiNPs versus R, from which it is seen that both umax and umean increase with the increase of R, which results in that the SRD increases with the increase of R. This result indicates that the removal effect of micro/nanoscale particles can be controlled by using MMPs with different radii. Figure 8c shows D of umax and D of umean versus R, respectively, and it is seen that D of umax is in the range of 0.6% to 2.8%, while D of umean is in the range of 1.6% to 3.5%.
The dependency of acoustic streaming velocity on the length of the MMP L is shown in Figure 9. Figure 9a shows the distribution of acoustic streaming velocity along the r direction at the droplet-substrate interface computed by the PM and RSM under different L, from which it is seen that the distribution of acoustic streaming velocity changes little when L varies. Figure 9b shows umax, umean and experimentally measured SRD of the cleaned area for yeast cells and SiNPs versus L, from which it is seen that umax, umean and the SRD change little when L changes. This is because that the vibration of the MMP’s portion outside the droplet does not affect the acoustofluidic field within the droplet (Figure 1a and Figure 3a). As a result, it can be known that L has little influence on the removal effect of micro/nanoscale particles at the droplet-substrate interface in this system. Figure 9c shows D of umax and D of umean versus L, respectively, and it is seen that D of umax is in the range of 0.6% to 1.8%, while D of umean is in the range of 1.9% to 2.9%.

5.2. Simulated Acoustofluidic Fields in the Droplet-Ultrasonic Substrate System for Micro/Nanoscale Particle Concentration

The simulated acoustic streaming fields in the droplet-ultrasonic substrate system for micro/nanoscale particle concentration by the PM and RSM are shown in Figure 10a,b, respectively, from which it is seen that there exist vortices in the droplet. At the droplet-substrate interface, as the acoustic streaming flows from the outside boundary of the droplet to point o, micro/nanoscale particles can be dragged to point o, and be concentrated in the central area (Figure 3c). Finally, the stable concentration diameter (SCD) of aggregation of micro/nanoscale particles can be reached.
In the droplet-ultrasonic substrate system, we also compare the drag force induced by acoustic streaming with the acoustic radiation force applied on the manipulated micro/nanoscale particles and find that acoustic streaming is also dominant when the radius of manipulated particles falls between 100 nm and 10 microns (see Supplementary Materials). Thus, the effect of acoustic radiation force can also be neglected in the droplet-ultrasonic substrate system. The detailed information of the acoustic streaming fields will be discussed and analyzed in the following sections.
We also compare the simulated acoustic streaming fields in the droplet-ultrasonic substrate system when the driving forces of acoustic streaming are FR and FR1, respectively. Figure 10 shows the acoustic streaming velocity magnitude distribution at the droplet-substrate interface when the driving forces of acoustic streaming are FR and FR1, respectively. We extract the maximum acoustic streaming velocity magnitude uMAX in Figure 10c and the mean acoustic streaming velocity magnitude uMEAN, which is defined as
u M E A N = 0 5   mm u R d r 5   mm
where uR is the acoustic streaming velocity magnitude at the r position. From Figure 10c, the deviations for uMAX and uMEAN are calculated to be 2.32% and 2.59%, respectively. Therefore, the nonlinear terms in FR are also non-negligible for simulating acoustic streaming fields in the droplet-ultrasonic substrate system by the RSM.
The dependency of acoustic streaming velocity magnitude on the excitation velocity amplitude Vsvib is shown in Figure 11. Figure 11a shows the distribution of acoustic streaming velocity magnitude along the r direction at the droplet-substrate interface computed by the PM and RSM under different Vsvib. It is seen that the acoustic streaming velocity magnitude firstly increases with the increase of r, and then reaches uMAX, after which the acoustic streaming velocity magnitude decreases with the increase of r and tends to 0 when r = 5 mm. Also, the position where uMAX occurs moves inwards when Vsvib increases. Figure 11b shows uMAX, uMEAN and experimentally measured SCD of aggregation of yeast cells and AgNPs versus Vsvib. In Figure 11b, Vsvib was controlled by changing the input power of the device (Figure 3c), and the standard deviation is obtained by five times of experimental measurements. It is seen in Figure 11b that both uMAX and uMEAN increase with the increase of Vsvib, which accounts for that the SCD decreases with the increase of Vsvib. In this case, by easily tuning the input power of the device, one can tune the scale and density of aggregation of micro/nanoscale particles, both of which have significant applications in biochemical sensing [32] and assembly/fabrication of micro/nano devices [9]. Figure 11c shows D of uMAX and D of uMEAN computed by the PM and RSM versus Vsvib, respectively, from which it is seen that D of uMAX is always larger than that of uMEAN. It is also seen from Figure 11c that D of uMAX decreases with the increase of Vsvib. This is because that as Vsvib increases, i.e., the input power for the acoustic field increases, Fadd becomes less important compared to the main driving force of acoustic streaming (FR) in this system.
The dependency of acoustic streaming velocity magnitude on the driving frequency of the system fs is shown in Figure 12. Figure 12a shows the distribution of acoustic streaming velocity magnitude along the r direction at the droplet-substrate interface computed by the PM and RSM under different fs, from which it is seen that the distributions of acoustic streaming velocity magnitudes change little when fs varies. Figure 12b shows uMAX, uMEAN and experimentally measured SCD of aggregation of yeast cells and AgNPs versus fs. In Figure 12b, the SCD versus fs was measured with five Langevin transducers with different resonance frequencies (20 kHz, 28 kHz, 40 kHz, 51 kHz, 60 kHz). It is seen from Figure 12b both uMAX and uMEAN change little when fs varies, which accounts for that the SCD changes little when fs varies. Therefore, it can be known that the driving frequency of the device has little influence on the concentration effect of micro/nanoscale particles at the droplet-substrate interface in this system. Figure 12c shows D of uMAX and D of uMEAN versus fs, respectively, from which it is seen that D of uMAX increases with the increase of fs. This may result from that when fs increases, Fadd (generated from the time average of the partial derivative of −ρ1u1 with respect to time) becomes more important compared to the main driving force of acoustic streaming (FR) in this system.
The dependency of acoustic streaming velocity magnitude on the radius of excitation part RE is shown in Figure 13. Figure 13a shows the distribution of acoustic streaming velocity magnitude along the r direction at the droplet-substrate interface computed by the PM and RSM under different RE, from which it is seen that the position where uMAX occurs moves outwards from point o when RE increases. Figure 13b shows uMAX, uMEAN and experimentally measured SCD of aggregation of yeast cells and AgNPs versus RE. In Figure 13b, the SCD versus RE was measured with VTCs with different radiation heads’ radii (Figure 3c). It is seen from Figure 13b that uMAX firstly increases with the increase of RE and then decreases with the increase of RE, while uMEAN increases with the increase of RE. It is also seen from Figure 13b that the SCD increases with the increase of RE. This may result from that when RE increases, the coverage area of the inward acoustic streaming flow increases (Figure 13a), which is beneficial to concentrating micro/nanoscale particles within larger areas. Figure 13c shows D of uMAX and D of uMEAN versus RE, respectively, and it is seen that the D of uMAX is in the range of 0.77% to 0.92%, while D of uMEAN is in the range of 0.41% to 0.65%.

6. Conclusions

We have numerically simulated and analyzed the 2D axisymmetric acoustofluidic fields in the ultrasonic probe-droplet-substrate system and droplet-ultrasonic substrate system by the PM and RSM, respectively. It is found that in the ultrasonic probe-droplet-substrate system for micro/nanoscale particle removal, the acoustic streaming field changes with the variation of vibration velocity of the MMP, driving frequency of the device, distance between the MMP’s tip and substrate surface, and radius of the MMP. It is also found that in the droplet-ultrasonic substrate system for micro/nanoscale particle concentration, the acoustic streaming field changes with the variation of excitation velocity and length of excitation part. It is also shown that there exist small differences between the simulation results of acoustic streaming fields computed by the PM and RSM. The demonstrated simulation results in this paper may provide some useful guidelines for controlling acoustic streaming fields in the droplet-based acoustofluidic systems.

Supplementary Materials

The following are available online at https://www.mdpi.com/2072-666X/11/1/22/s1, Figure S1 (a) Acoustic streaming velocity distribution along the r direction at the droplet-substrate interface in Region 1 in the ultrasonic probe-droplet-substrate system under different mesh constitutions computed by the RSM. (b) umax and umean at the droplet-substrate interface in Region 1 in the ultrasonic probe-droplet-substrate system under different mesh constitutions computed by the RSM. Figure S2 (a) Acoustic streaming velocity magnitude distribution along the r direction at the droplet-substrate interface in the droplet-ultrasonic substrate system under different mesh constitutions computed by the RSM. (b) uMAX and uMEAN at the droplet-substrate interface in the droplet-ultrasonic substrate system under different mesh constitutions computed by the RSM. Figure S3 (a) Computed acoustic radiation force field for yeast cells in the ultrasonic probe-droplet-substrate system under the mesh constitution for the PM. (b) Computed acoustic radiation force field for SiNPs in the ultrasonic probe-droplet-substrate system under the mesh constitution for the PM. Figure S4 (a) Computed acoustic radiation force field for yeast cells in the droplet-ultrasonic substrate system under the mesh constitution for the PM. (b) Computed acoustic radiation force field for AgNPs in the droplet-ultrasonic substrate system under the mesh constitution for the PM.

Author Contributions

P.L. and Q.T. conceived the concept; P.L. performed the simulation and wrote the manuscript; Q.T., S.S., J.H. and Y.Y. contributed to proofreading writing. All authors have read and agreed to the published version of the manuscript.

Funding

This work is supported by the following funding organizations in China: National Natural Science Foundation of China (Grant No. 11904117), Postgraduate Research & Practice Innovation Program of Jiangsu Province (No. KYCX17_0237), the Fundamental Research Funds for the Central Universities, and PAPD. Pengzhan Liu also thanks the China Scholarship Council (CSC) for the financial support.

Acknowledgments

Pengzhan Liu thanks Zhichao Pei’s help in the figure set.

Conflicts of Interest

The authors declare no conflict of interest.

References

  1. Hu, J. Ultrasonic Micro/Nano Manipulations: Principles and Examples; World Scientific: Singapore, 2014. [Google Scholar]
  2. Friend, J.; Yeo, L.Y. Microscale acoustofluidics: Microfluidics driven via acoustics and ultrasonics. Rev. Mod. Phys. 2011, 83, 647–704. [Google Scholar] [CrossRef] [Green Version]
  3. Connacher, W.; Zhang, N.Q.; Huang, A.; Mei, J.Y.; Zhang, S.; Gopesh, T.; Friend, J. Micro/nano acoustofluidics: Materials, phenomena, design, devices, and applications. Lab Chip 2018, 18, 1952–1996. [Google Scholar] [CrossRef] [PubMed]
  4. Ozcelik, A.; Rufo, J.; Guo, F.; Gu, Y.Y.; Li, P.; Lata, J.; Huang, T.J. Acoustic tweezers for the life sciences. Nat. Methods 2018, 15, 1021–1028. [Google Scholar] [CrossRef] [PubMed] [Green Version]
  5. Yeo, L.Y.; Chang, H.C.; Chan, P.P.Y.; Friend, J.R. Microfluidic Devices for Bioapplications. Small 2011, 7, 12–48. [Google Scholar] [CrossRef] [PubMed]
  6. Li, P.; Huang, T.J. Applications of Acoustofluidics in Bioanalytical Chemistry. Anal. Chem. 2019, 91, 757–767. [Google Scholar] [CrossRef]
  7. Fu, Y.Q.; Luo, J.K.; Nguyen, N.T.; Walton, A.J.; Flewitt, A.J.; Zu, X.T.; Li, Y.; McHale, G.; Matthews, A.; Iborra, E.; et al. Advances in piezoelectric thin films for acoustic biosensors, acoustofluidics and lab-on-chip applications. Prog. Mater. Sci. 2017, 89, 31–91. [Google Scholar] [CrossRef] [Green Version]
  8. Qi, A.S.; Chan, P.; Ho, J.; Rajapaksa, A.; Friend, J.; Yeo, L.L. Template-free Synthesis and Encapsulation Technique for Layer-by-Layer Polymer Nanocarrier Fabrication. ACS Nano 2011, 5, 9583–9591. [Google Scholar] [CrossRef]
  9. Sazan, H.; Piperno, S.; Layani, M.; Magdassi, S.; Shpaisman, H. Directed assembly of nanoparticles into continuous microstructures by standing surface acoustic waves. J. Colloid. Interf. Sci. 2019, 536, 701–709. [Google Scholar] [CrossRef]
  10. Chen, Y.C.; Ding, X.Y.; Lin, S.C.S.; Yang, S.K.; Huang, P.H.; Nama, N.; Zhao, Y.H.; Nawaz, A.A.; Guo, F.; Wang, W.; et al. Tunable Nanowire Patterning Using Standing Surface Acoustic Waves. ACS Nano 2013, 7, 3306–3314. [Google Scholar] [CrossRef] [Green Version]
  11. Gadkari, S.A.; Nayfeh, T.H. Micro fabrication using electro deposition and ultrasonic acoustic liquid manipulation. Int. J. Adv. Manuf. Technol. 2008, 39, 107–117. [Google Scholar] [CrossRef]
  12. Barani, A.; Paktinat, H.; Janmaleki, M.; Mohammadi, A.; Mosaddegh, P.; Fadaei-Tehrani, A.; Sanati-Nezhad, A. Microfluidic integrated acoustic waving for manipulation of cells and molecules. Biosens. Bioelectron. 2016, 85, 714–725. [Google Scholar] [CrossRef] [PubMed]
  13. Xi, H.D.; Zheng, H.; Guo, W.; Ganan-Calvo, A.M.; Ai, Y.; Tsao, C.W.; Zhou, J.; Li, W.H.; Huang, Y.Y.; Nguyen, N.T.; et al. Active droplet sorting in microfluidics: A review. Lab Chip 2017, 17, 751–771. [Google Scholar] [CrossRef] [PubMed]
  14. Ashkin, A.; Dziedzic, J.M. Optical Trapping and Manipulation of Viruses and Bacteria. Science 1987, 235, 1517–1520. [Google Scholar] [CrossRef] [PubMed]
  15. Ashkin, A.; Dziedzic, J.M.; Yamane, T. Optical Trapping and Manipulation of Single Cells Using Infrared-Laser Beams. Nature 1987, 330, 769–771. [Google Scholar] [CrossRef]
  16. Agiotis, L.; Theodorakos, I.; Samothrakitis, S.; Papazoglou, S.; Zergioti, I.; Raptis, Y.S. Magnetic manipulation of superparamagnetic nanoparticles in a microfluidic system for drug delivery applications. J. Magn. Magn. Mater. 2016, 401, 956–964. [Google Scholar] [CrossRef]
  17. Zhu, T.T.; Cheng, R.; Sheppard, G.R.; Locklin, J.; Mao, L.D. Magnetic-Field-Assisted Fabrication and Manipulation of Nonspherical Polymer Particles in Ferrofluid-Based Droplet Microfluidics. Langmuir 2015, 31, 8531–8534. [Google Scholar] [CrossRef]
  18. Feng, H.F.; Xu, X.; Hao, W.C.; Du, Y.; Tian, D.L.; Jiang, L. Magnetic field actuated manipulation and transfer of oil droplets on a stable underwater superoleophobic surface. Phys. Chem. Chem. Phys. 2016, 18, 16202–16207. [Google Scholar] [CrossRef] [Green Version]
  19. Schiwek, S.; Heim, L.O.; Stark, R.W.; Dietz, C. Manipulation of polystyrene nanoparticles on a silicon wafer in the peak force tapping mode in water: pH-dependent friction and adhesion force. J. Appl. Phys. 2015, 117, 104303. [Google Scholar] [CrossRef]
  20. Zhou, P.L.; Yu, H.B.; Yang, W.G.; Wen, Y.D.; Wang, Z.D.; Li, W.J.; Liu, L.Q. Spatial Manipulation and Assembly of Nanoparticles by Atomic Force Microscopy Tip-Induced Dielectrophoresis. ACS Appl. Mater. Interfaces 2017, 9, 16715–16724. [Google Scholar] [CrossRef]
  21. Freer, E.M.; Grachev, O.; Duan, X.F.; Martin, S.; Stumbo, D.P. High-yield self-limiting single-nanowire assembly with dielectrophoresis. Nat. Nanotechnol. 2010, 5, 525–530. [Google Scholar] [CrossRef]
  22. Hermanson, K.D.; Lumsdon, S.O.; Williams, J.P.; Kaler, E.W.; Velev, O.D. Dielectrophoretic assembly of electrically functional microwires from nanoparticle suspensions. Science 2001, 294, 1082–1086. [Google Scholar] [CrossRef] [PubMed]
  23. Lee, M.W.; Lin, Y.H.; Lee, G.B. Manipulation and patterning of carbon nanotubes utilizing optically induced dielectrophoretic forces. Microfluid. Nanofluid. 2010, 8, 609–617. [Google Scholar] [CrossRef]
  24. Yeo, L.Y.; Friend, J.R. Surface Acoustic Wave Microfluidics. Annu. Rev. Fluid Mech. 2014, 46, 379–406. [Google Scholar] [CrossRef] [Green Version]
  25. Gantner, A.; Hoppe, R.H.W.; Köster, D.; Siebert, K.; Wixforth, A. Numerical simulation of piezoelectrically agitated surface acoustic waves on microfluidic biochips. Comput. Vis. Sci. 2007, 10, 145–161. [Google Scholar] [CrossRef] [Green Version]
  26. Guo, F.; Mao, Z.M.; Chen, Y.C.; Xie, Z.W.; Lata, J.P.; Li, P.; Ren, L.Q.; Liu, J.Y.; Yang, J.; Dao, M.; et al. Three-dimensional manipulation of single cells using surface acoustic waves. Proc. Natl. Acad. Sci. USA 2016, 113, 1522–1527. [Google Scholar] [CrossRef] [PubMed] [Green Version]
  27. Collins, D.J.; Devendran, C.; Ma, Z.C.; Ng, J.W.; Neild, A.; Ai, Y. Acoustic tweezers via sub-time-of-flight regime surface acoustic waves. Sci. Adv. 2016, 2, e1600089. [Google Scholar] [CrossRef] [PubMed] [Green Version]
  28. Jia, H.; Liu, X.; Feng, P.X.L. Manipulating and Patterning Micro/Nanoparticles in Liquid Using Multimode Membrane Resonators. In Proceedings of the 2018 IEEE Biomedical Circuits and Systems Conference (BioCAS), Cleveland, OH, USA, 17–19 October 2018; pp. 4314–4334. [Google Scholar]
  29. Zheng, T.F.; Wang, C.H.; Xu, C.P.; Hu, Q.; Wei, S.P. Patterning microparticles into a two-dimensional pattern using one column standing surface acoustic waves. Sens. Actuators A Phys. 2018, 284, 168–171. [Google Scholar] [CrossRef]
  30. Sehgal, P.; Kirby, B.J. Separation of 300 and 100 nm Particles in Fabry-Perot Acoustofluidic Resonators. Anal. Chem. 2017, 89, 12192–12200. [Google Scholar] [CrossRef]
  31. Gautam, G.P.; Gurung, R.; Fencl, F.A.; Piyasena, M.E. Separation of sub-micron particles from micron particles using acoustic fluid relocation combined with acoustophoresis. Anal. Bioanal. Chem. 2018, 410, 6561–6571. [Google Scholar] [CrossRef]
  32. Mao, Z.M.; Li, P.; Wu, M.X.; Bachman, H.; Mesyngier, N.; Guo, X.S.; Liu, S.; Costanzo, F.; Huang, T.J. Enriching Nanoparticles via Acoustofluidics. ACS Nano 2017, 11, 603–612. [Google Scholar] [CrossRef] [Green Version]
  33. Bourquin, Y.; Syed, A.; Reboud, J.; Ranford-Cartwright, L.C.; Barrett, M.P.; Cooper, J.M. Rare-Cell Enrichment by a Rapid, Label-Free, Ultrasonic Isopycnic Technique for Medical Diagnostics. Angew. Chem. Int. Ed. 2014, 53, 5587–5590. [Google Scholar] [CrossRef] [PubMed] [Green Version]
  34. Nam, J.; Lim, C.S. Micromixing using swirling induced by three-dimensional dual surface acoustic waves (3D-dSAW). Sens. Actuators B Chem. 2018, 255, 3434–3440. [Google Scholar] [CrossRef]
  35. Rezk, A.R.; Qi, A.; Friend, J.R.; Li, W.H.; Yeo, L.Y. Uniform mixing in paper-based microfluidic systems using surface acoustic waves. Lab Chip 2012, 12, 773–779. [Google Scholar] [CrossRef] [PubMed]
  36. Bernard, I.; Doinikov, A.A.; Marmottant, P.; Rabaud, D.; Poulain, C.; Thibault, P. Controlled rotation and translation of spherical particles or living cells by surface acoustic waves. Lab Chip 2017, 17, 2470–2480. [Google Scholar] [CrossRef] [PubMed] [Green Version]
  37. Zhang, J.; Yang, S.; Chen, C.; Hartman, J.H.; Huang, P.-H.; Wang, L.; Tian, Z.; Zhang, P.; Faulkenberry, D.; Meyer, J.N.; et al. Surface acoustic waves enable rotational manipulation of Caenorhabditis elegans. Lab Chip 2019, 19, 984–992. [Google Scholar] [CrossRef]
  38. Andrade, M.A.B.; Camargo, T.S.A.; Marzo, A. Automatic contactless injection, transportation, merging, and ejection of droplets with a multifocal point acoustic levitator. Rev. Sci. Instrum. 2018, 89, 125105. [Google Scholar] [CrossRef] [Green Version]
  39. Bouyer, C.; Chen, P.; Guven, S.; Demirtas, T.T.; Nieland, T.J.F.; Padilla, F.; Demirci, U. A Bio-Acoustic Levitational (BAL) Assembly Method for Engineering of Multilayered, 3D Brain-Like Constructs, Using Human Embryonic Stem Cell Derived Neuro-Progenitors. Adv. Mater. 2016, 28, 161–167. [Google Scholar] [CrossRef]
  40. Chen, P.; Luo, Z.Y.; Guven, S.; Tasoglu, S.; Ganesan, A.V.; Weng, A.; Demirci, U. Microscale Assembly Directed by Liquid-Based Template. Adv. Mater. 2014, 26, 5936–5941. [Google Scholar] [CrossRef] [Green Version]
  41. Owens, C.E.; Shields, C.W.; Cruz, D.F.; Charbonneau, P.; Lopez, G.P. Highly parallel acoustic assembly of microparticles into well-ordered colloidal crystallites. Soft. Matter. 2016, 12, 717–728. [Google Scholar] [CrossRef] [Green Version]
  42. Gao, L.; Shields, C.W.; Johnson, L.M.; Graves, S.W.; Yellen, B.B.; Lopez, G.P. Two-dimensional spatial manipulation of microparticles in continuous flows in acoustofluidic systems. Biomicrofluidics 2015, 9, 014105. [Google Scholar] [CrossRef] [Green Version]
  43. Shu, X.; Liu, H.Q.; Zhu, Y.Z.; Cai, B.; Jin, Y.X.; Wei, Y.C.; Zhou, F.L.; Liu, W.; Guo, S.S. An improved bulk acoustic waves chip based on a PDMS bonding layer for high-efficient particle enrichment. Microfluid. Nanofluid. 2018, 22, 32. [Google Scholar] [CrossRef]
  44. Reichert, P.; Deshmukh, D.; Lebovitz, L.; Dual, J. Thin film piezoelectrics for bulk acoustic wave (BAW) acoustophoresis. Lab Chip 2018, 18, 3655–3667. [Google Scholar] [CrossRef] [PubMed]
  45. Gor’kov, L.P. On the Forces Acting on a Small Particle in an Acoustical Field in an Ideal Fluid. Sov. Phys. Dokl. 1962, 6, 773–775. [Google Scholar]
  46. Nyborg, W.L. Acoustic Streaming Due to Attenuated Plane Waves. J. Acoust. Soc. Am. 1953, 25, 68–75. [Google Scholar] [CrossRef]
  47. Lighthill, J. Acoustic Streaming. J. Sound Vib. 1978, 61, 391–418. [Google Scholar] [CrossRef]
  48. Riley, N. Steady streaming. Annu. Rev. Fluid Mech. 2001, 33, 43–65. [Google Scholar] [CrossRef]
  49. Antil, H.; Glowinski, R.; Hoppe, R.H.W.; Linsenmann, C.; Pan, T.-W.; Wixforth, A. Modeling, Simulation, and Optimaization of Surface Acoustic Wave Driven Microfluidic Biochips. J. Comput. Math. 2010, 28, 149–169. [Google Scholar] [CrossRef] [Green Version]
  50. Riley, N. Acoustic Streaming. Theor. Comput. Fluid Dyn. 1998, 10, 349–356. [Google Scholar] [CrossRef]
  51. Barnkob, R.; Augustsson, P.; Laurell, T.; Bruus, H. Acoustic radiation- and streaming-induced microparticle velocities determined by microparticle image velocimetry in an ultrasound symmetry plane. Phys. Rev. E 2012, 86, 056307. [Google Scholar] [CrossRef] [Green Version]
  52. Barnkob, R.; Iranmanesh, I.; Wiklund, M.; Bruus, H. Measuring acoustic energy density in microchannel acoustophoresis using a simple and rapid light-intensity method. Lab Chip 2012, 12, 2337–2344. [Google Scholar] [CrossRef]
  53. Nama, N.; Huang, T.J.; Costanzo, F. Acoustic streaming: An arbitrary Lagrangian-Eulerian perspective. J. Fluid Mech. 2017, 825, 600–630. [Google Scholar] [CrossRef] [PubMed] [Green Version]
  54. Barnkob, R.; Nama, N.; Ren, L.Q.; Huang, T.J.; Costanzo, F.; Kahler, C.J. Acoustically Driven Fluid and Particle Motion in Confined and Leaky Systems. Phys. Rev. Appl. 2018, 9, 014027. [Google Scholar] [CrossRef] [Green Version]
  55. Barnkob, R.; Augustsson, P.; Laurell, T.; Bruus, H. Measuring the local pressure amplitude in microchannel acoustophoresis. Lab Chip 2010, 10, 563–570. [Google Scholar] [CrossRef] [PubMed]
  56. Frampton, K. The scaling of acoustic streaming for application in microfluidic devices. J. Acoust. Soc. Am. 2001, 109, 2348. [Google Scholar] [CrossRef]
  57. Shamloo, A.; Boodaghi, M. Design and simulation of a microfluidic device for acoustic cell separation. Ultrasonics 2018, 84, 234–243. [Google Scholar] [CrossRef]
  58. Xu, D.; Cai, F.; Chen, M.; Li, F.; Wang, C.; Meng, L.; Xu, D.; Wang, W.; Wu, J.; Zheng, H. Acoustic manipulation of particles in a cylindrical cavity: Theoretical and experimental study on the effects of boundary conditions. Ultrasonics 2019, 93, 18–25. [Google Scholar] [CrossRef]
  59. Lei, J.J.; Glynne-Jones, P.; Hill, M. Acoustic streaming in the transducer plane in ultrasonic particle manipulation devices. Lab Chip 2013, 13, 2133–2143. [Google Scholar] [CrossRef] [Green Version]
  60. Lei, J.J.; Hill, M.; Glynne-Jones, P. Numerical simulation of 3D boundary-driven acoustic streaming in microfluidic devices. Lab Chip 2014, 14, 532–541. [Google Scholar] [CrossRef] [Green Version]
  61. Chen, C.Y.; Zhang, S.P.; Mao, Z.M.; Nama, N.; Gu, Y.Y.; Huang, P.H.; Jing, Y.; Guo, X.S.; Costanzo, F.; Huang, T.J. Three-dimensional numerical simulation and experimental investigation of boundary-driven streaming in surface acoustic wave microfluidics. Lab Chip 2018, 18, 3645–3654. [Google Scholar] [CrossRef]
  62. Muller, P.B.; Barnkob, R.; Jensen, M.J.H.; Bruus, H. A numerical study of microparticle acoustophoresis driven by acoustic radiation forces and streaming-induced drag forces. Lab Chip 2012, 12, 4617–4627. [Google Scholar] [CrossRef] [Green Version]
  63. Catarino, S.O.; Miranda, J.M.; Lanceros-Mendez, S.; Minas, G. Numerical Prediction of Acoustic Streaming in a Microcuvette. Can. J. Chem. Eng. 2014, 92, 1988–1998. [Google Scholar] [CrossRef]
  64. Catarino, S.O.; Minas, G.; Miranda, J.M. Evaluation of the successive approximations method for acoustic streaming numerical simulations. J. Acoust. Soc. Am. 2016, 139, 2269–2279. [Google Scholar] [CrossRef] [PubMed]
  65. Sadhal, S.S. Acoustofluidics 13: Analysis of acoustic streaming by perturbation methods Foreword. Lab Chip 2012, 12, 2292–2300. [Google Scholar] [CrossRef] [PubMed]
  66. Koster, D. Numerical simulation of acoustic streaming on surface acoustic wave-driven biochips. SIAM J. Sci. Comput. 2007, 29, 2352–2380. [Google Scholar] [CrossRef]
  67. Tang, Q.; Hu, J.H. Diversity of acoustic streaming in a rectangular acoustofluidic field. Ultrasonics 2015, 58, 27–34. [Google Scholar] [CrossRef]
  68. Lei, J.J.; Glynne-Jones, P.; Hill, M. Modal Rayleigh-like streaming in layered acoustofluidic devices. Phys. Fluids 2016, 28, 012004. [Google Scholar] [CrossRef] [Green Version]
  69. Eckart, C. Vortices and Streams Caused by Sound Waves. Phys. Rev. 1948, 73, 68–76. [Google Scholar] [CrossRef]
  70. Boluriaan, S.; Morris, P.J. Acoustic streaming: From Rayleigh to today. Int. J. Aeroacoust. 2003, 2, 255–292. [Google Scholar] [CrossRef]
  71. Wiklund, M.; Green, R.; Ohlin, M. Acoustofluidics 14: Applications of acoustic streaming in microfluidic devices. Lab Chip 2012, 12, 2438–2451. [Google Scholar] [CrossRef]
  72. Nama, N.; Barnkob, R.; Mao, Z.M.; Kahler, C.J.; Costanzo, F.; Huang, T.J. Numerical study of acoustophoretic motion of particles in a PDMS microchannel driven by surface acoustic waves. Lab Chip 2015, 15, 2700–2709. [Google Scholar] [CrossRef]
  73. Lei, J.J.; Glynne-Jones, P.; Hill, M. Comparing methods for the modelling of boundary-driven streaming in acoustofluidic devices. Microfluid. Nanofluid. 2017, 21, 23. [Google Scholar] [CrossRef] [Green Version]
  74. Tang, Q.; Hu, J.H.; Qian, S.Z.; Zhang, X.Y. Eckart acoustic streaming in a heptagonal chamber by multiple acoustic transducers. Microfluid. Nanofluid. 2017, 21, 28. [Google Scholar] [CrossRef]
  75. Li, N.; Hu, J.H.; Li, H.Q.; Bhuyan, S.; Zhou, Y.J. Mobile acoustic streaming based trapping and 3-dimensional transfer of a single nanowire. Appl. Phys. Lett. 2012, 101, 093113. [Google Scholar] [CrossRef]
  76. Wang, X.; Hu, J.H. An ultrasonic manipulator with noncontact and contact-type nanowire trapping functions. Sens. Actuators A Phys. 2015, 232, 13–19. [Google Scholar] [CrossRef]
  77. Zhu, X.B.; Hu, J.H. Ultrasonic drive of small mechanical components on a tapered metal strip. Ultrasonics 2013, 53, 417–422. [Google Scholar] [CrossRef]
  78. Zhou, Y.J.; Li, H.Q.; Hu, J.H. An ultrasonic stage for controlled spin of micro particles. Rev. Sci. Instrum. 2012, 83, 045004. [Google Scholar] [CrossRef]
  79. Li, N.; Hu, J.H. Sound-Controlled Rotary Driving of a Single Nanowire. IEEE Trans. Nanotechnol. 2014, 13, 437–441. [Google Scholar] [CrossRef]
  80. Liu, P.Z.; Hu, J.H. Controlled removal of micro/nanoscale particles in submillimeter-diameter area on a substrate. Rev. Sci. Instrum. 2017, 88, 105003. [Google Scholar] [CrossRef]
  81. Qi, X.M.; Tang, Q.; Liu, P.Z.; Minin, I.V.; Minin, O.V.; Hu, J.H. Controlled concentration and transportation of nanoparticles at the interface between a plain substrate and droplet. Sens. Actuators B Chem. 2018, 274, 381–392. [Google Scholar] [CrossRef]
  82. Zhou, Y.J.; Hu, J.H.; Bhuyan, S. Manipulations of Silver Nanowires in a Droplet on a Low-Frequency Ultrasonic Stage. IEEE Trans. Ultrason. Ferr. 2013, 60, 622–629. [Google Scholar] [CrossRef]
  83. Lighthill, J. Waves in Fluids; Cambridge University Press: Cambridge, UK, 1978. [Google Scholar]
  84. Lei, J.J.; Hill, M.; Albarran, C.P.D.; Glynne-Jones, P. Effects of micron scale surface profiles on acoustic streaming. Microfluid. Nanofluid. 2018, 22, 140. [Google Scholar] [CrossRef]
  85. Tang, Q.; Hu, J.H. Analyses of acoustic streaming field in the probe-liquid-substrate system for nanotrapping. Microfluid. Nanofluid. 2015, 19, 1395–1408. [Google Scholar] [CrossRef]
  86. Tang, Q.; Wang, X.F.; Hu, J.H. Nano concentration by acoustically generated complex spiral vortex field. Appl. Phys. Lett. 2017, 110, 104105. [Google Scholar] [CrossRef]
  87. Tang, Q.; Liu, P.Z.; Hu, J.H. Analyses of acoustofluidic field in ultrasonic needle-liquid-substrate system for micro-/nanoscale material concentration. Microfluid. Nanofluid. 2018, 22, 46. [Google Scholar] [CrossRef]
  88. Nama, N.; Huang, P.H.; Huang, T.J.; Costanzo, F. Investigation of micromixing by acoustically oscillated sharp-edges. Biomicrofluidics 2016, 10, 024124. [Google Scholar] [CrossRef] [PubMed]
  89. Wang, Y.J.; Hu, J.H. Ultrasonic removal of coarse and fine droplets in air. Sep. Purif. Technol. 2015, 153, 156–161. [Google Scholar] [CrossRef]
  90. Hattori, T. Non-Aqueous Cleaning Challenges for Preventing Damage to Fragile Nano-Structures: A Review. ECS J. Solid State Sci. 2014, 3, N3054–N3059. [Google Scholar] [CrossRef]
  91. Blackstock, D.T. Fundamentals of Physical Acoustics; Wiley-Interscience: Hoboken, NJ, USA, 2000. [Google Scholar]
Figure 1. (a) 2D axisymmetric model of the acoustofluidic field in the ultrasonic probe-droplet-substrate system. (b) Boundary condition for the acoustic field in the ultrasonic probe-droplet-substrate system. (c) Boundary condition for the acoustic streaming field in the ultrasonic probe-droplet-substrate system. (d) Meshed model for the acoustofluidic field in the ultrasonic probe-droplet-substrate system under the simulation scheme of the PM. (e) Meshed model for the acoustofluidic field in the ultrasonic probe-droplet-substrate system under the simulation scheme of the RSM.
Micromachines 11 00022 g001
Figure 2. (a) 2D axisymmetric model of the acoustofluidic field in the droplet-ultrasonic substrate system. (b) Boundary condition for the acoustic field in the droplet-ultrasonic substrate system. (c) Boundary condition for the acoustic streaming field in the droplet-ultrasonic substrate system. (d) Meshed model for the acoustofluidic field in the droplet-ultrasonic substrate system under the simulation scheme of the PM. (e) Meshed model for the acoustofluidic field in the droplet-ultrasonic substrate system under the simulation scheme of the RSM.
Micromachines 11 00022 g002aMicromachines 11 00022 g002b
Figure 3. Experimental setups to verify the simulation results. (a) Schematic diagram of the ultrasonic probe-droplet-substrate system for micro/nanoscale particle removal. (b) Stable removal effect of yeast cells when R = 15 μm, L = 4 mm, Vpvib = 0.3 m/s, H = 50 μm and fp = 40 kHz. (c) Schematic diagram of the droplet-ultrasonic substrate system for micro/nanoscale particle concentration. (d) Stable aggregation of AgNPs when RE = 3 mm, Vsvib = 10 mm/s and fs = 40 kHz.
Micromachines 11 00022 g003aMicromachines 11 00022 g003b
Figure 4. (a) Acoustic streaming field in the ultrasonic probe-droplet-substrate system computed by the PM. (b) Acoustic streaming field in the ultrasonic probe-droplet-substrate system computed by the RSM. (c) Computed acoustic streaming velocity distribution along the r direction at the droplet-substrate interface in the ultrasonic probe-droplet-substrate system when the driving forces of acoustic streaming are FR and FR1, respectively.
Micromachines 11 00022 g004aMicromachines 11 00022 g004b
Figure 5. (a) Computed acoustic streaming velocity distribution along the r direction at the droplet-substrate interface in the ultrasonic probe-droplet-substrate system under different Vpvib. (b) umax, umean and SRD versus Vpvib in the ultrasonic probe-droplet-substrate system. (c) Deviations of umax and umean computed by the PM and RSM versus Vpvib in the ultrasonic probe-droplet-substrate system.
Micromachines 11 00022 g005aMicromachines 11 00022 g005b
Figure 6. (a) Computed acoustic streaming velocity distribution along the r direction at the droplet-substrate interface in the ultrasonic probe-droplet-substrate system under different fp. (b) umax, umean and SRD versus fp in the ultrasonic probe-droplet-substrate system. (c) Deviations of umax and umean computed by the PM and RSM versus fp in the ultrasonic probe-droplet-substrate system.
Micromachines 11 00022 g006aMicromachines 11 00022 g006b
Figure 7. (a) Computed acoustic streaming velocity distribution along the r direction at the droplet-substrate interface in the ultrasonic probe-droplet-substrate system under different H. (b) umax, umean and SRD versus H in the ultrasonic probe-droplet-substrate system. (c) Deviations of umax and umean computed by the PM and RSM versus H in the ultrasonic probe-droplet-substrate system.
Micromachines 11 00022 g007aMicromachines 11 00022 g007b
Figure 8. (a) Computed acoustic streaming velocity distribution along the r direction at the droplet-substrate interface in the ultrasonic probe-droplet-substrate system under different R. (b) umax, umean and SRD versus R in the ultrasonic probe-droplet-substrate system. (c) Deviations of umax and umean computed by the PM and RSM versus R in the ultrasonic probe-droplet-substrate system.
Micromachines 11 00022 g008aMicromachines 11 00022 g008b
Figure 9. (a) Computed acoustic streaming velocity distribution along the r direction at the droplet-substrate interface in the ultrasonic probe-droplet-substrate system under different L. (b) umax, umean and SRD versus L in the ultrasonic probe-droplet-substrate system. (c) Deviations of umax and umean computed by the PM and RSM versus L in the ultrasonic probe-droplet-substrate system.
Micromachines 11 00022 g009
Figure 10. (a) Acoustic streaming field in the droplet-ultrasonic substrate system computed by the PM. (b) Acoustic streaming field in the droplet-ultrasonic substrate system computed by the RSM. (c) Computed acoustic streaming velocity magnitude distribution along the r direction at the droplet-substrate interface in the droplet-ultrasonic substrate system when the driving forces of acoustic streaming are FR and FR1, respectively.
Micromachines 11 00022 g010aMicromachines 11 00022 g010b
Figure 11. (a) Computed acoustic streaming velocity magnitude distribution along the r direction at the droplet-substrate interface in the droplet-ultrasonic substrate system under different Vsvib. (b) uMAX, uMEAN and SCD versus Vsvib in the droplet-ultrasonic substrate system. (c) Deviations of uMAX and uMEAN computed by the PM and RSM versus Vsvib in the droplet-ultrasonic substrate system.
Micromachines 11 00022 g011aMicromachines 11 00022 g011b
Figure 12. (a) Computed acoustic streaming velocity magnitude distribution along the r direction at the droplet-substrate interface in the droplet-ultrasonic substrate system under different fs. (b) uMAX, uMEAN and SCD versus fs in the droplet-ultrasonic substrate system. (c) Deviations of uMAX and uMEAN computed by the PM and RSM versus fs in the droplet-ultrasonic substrate system.
Micromachines 11 00022 g012
Figure 13. (a) Computed acoustic streaming velocity magnitude distribution along the r direction at the droplet-substrate interface in the droplet-ultrasonic substrate system under different RE. (b) uMAX, uMEAN and SCD versus RE in the droplet-ultrasonic substrate system. (c) Deviations of uMAX and uMEAN computed by the PM and RSM versus RE in the droplet-ultrasonic substrate system.
Micromachines 11 00022 g013aMicromachines 11 00022 g013b
Table 1. Structural sizes, material parameters and working conditions of the manipulation systems used in the simulations.
Height of the Droplet (mm)Radius of the Droplet (mm)Density of Water ρ0 (kg/m3)
25998
Sound speed in water c0 (m/s)Shear viscosity of water μ (Pa∙s)Bulk-to-shear viscosity ratio in water μb/μ
14820.0012.1
Driving frequency of the ultrasonic probe-droplet-substrate system fp (kHz)Vibration velocity of the MMP Vpvib (m/s)Distance between the MMP’s tip and substrate surface H (μm)
400.350
Radius of the MMP R (μm)Length of the MMP L (mm)Density of the MMP (kg/m3)
1542210
Young’s modulus of the MMP (Pa)Poisson ratio of the MMP Driving frequency of the droplet-ultrasonic substrate system fs (kHz)
7.2 × 10100.240
Excitation velocity of the droplet-ultrasonic substrate system Vsvib (mm/s)Radius of the excitation part RE (mm)Density of yeast cells (kg/m3)
631114
Sound speed in yeast cells (m/s)Density of SiNPs (kg/m3)Sound speed in SiNPs (m/s)
160623305664
Density of AgNPs (kg/m3)Sound speed in AgNPs (m/s)Sound speed in air cair (m/s)
10,5002600343
Density of air ρair (kg/m3)
1.205

