A Digital Calibration Technique of MEMS Gyroscope for Closed-Loop Mode-Matching Control


Abstract
:1. Introduction
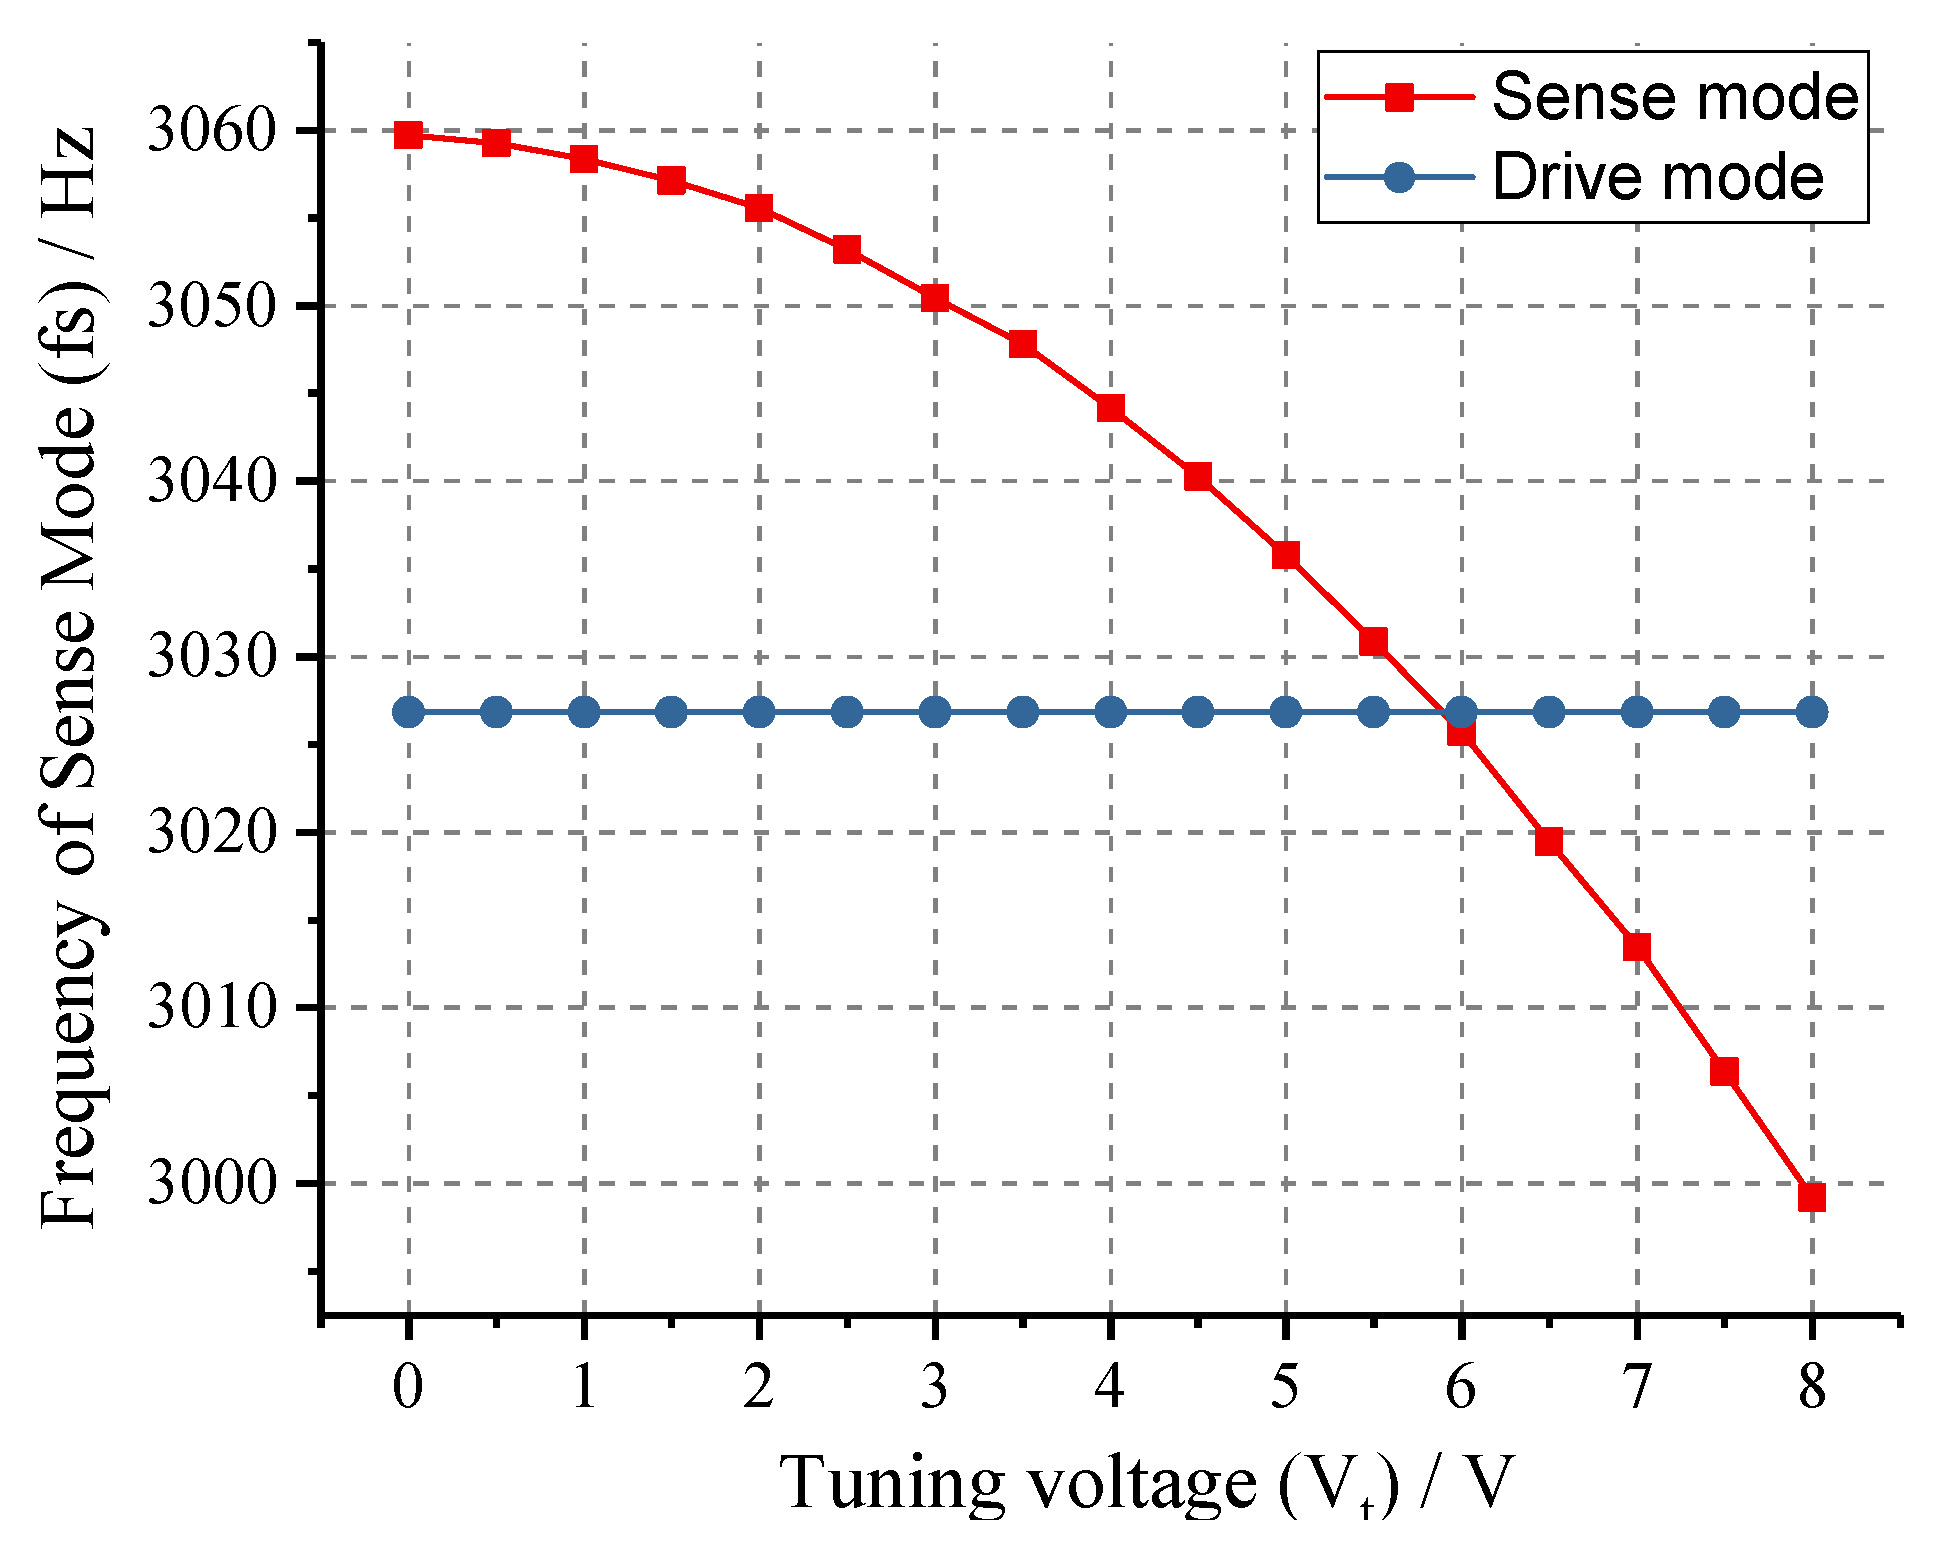
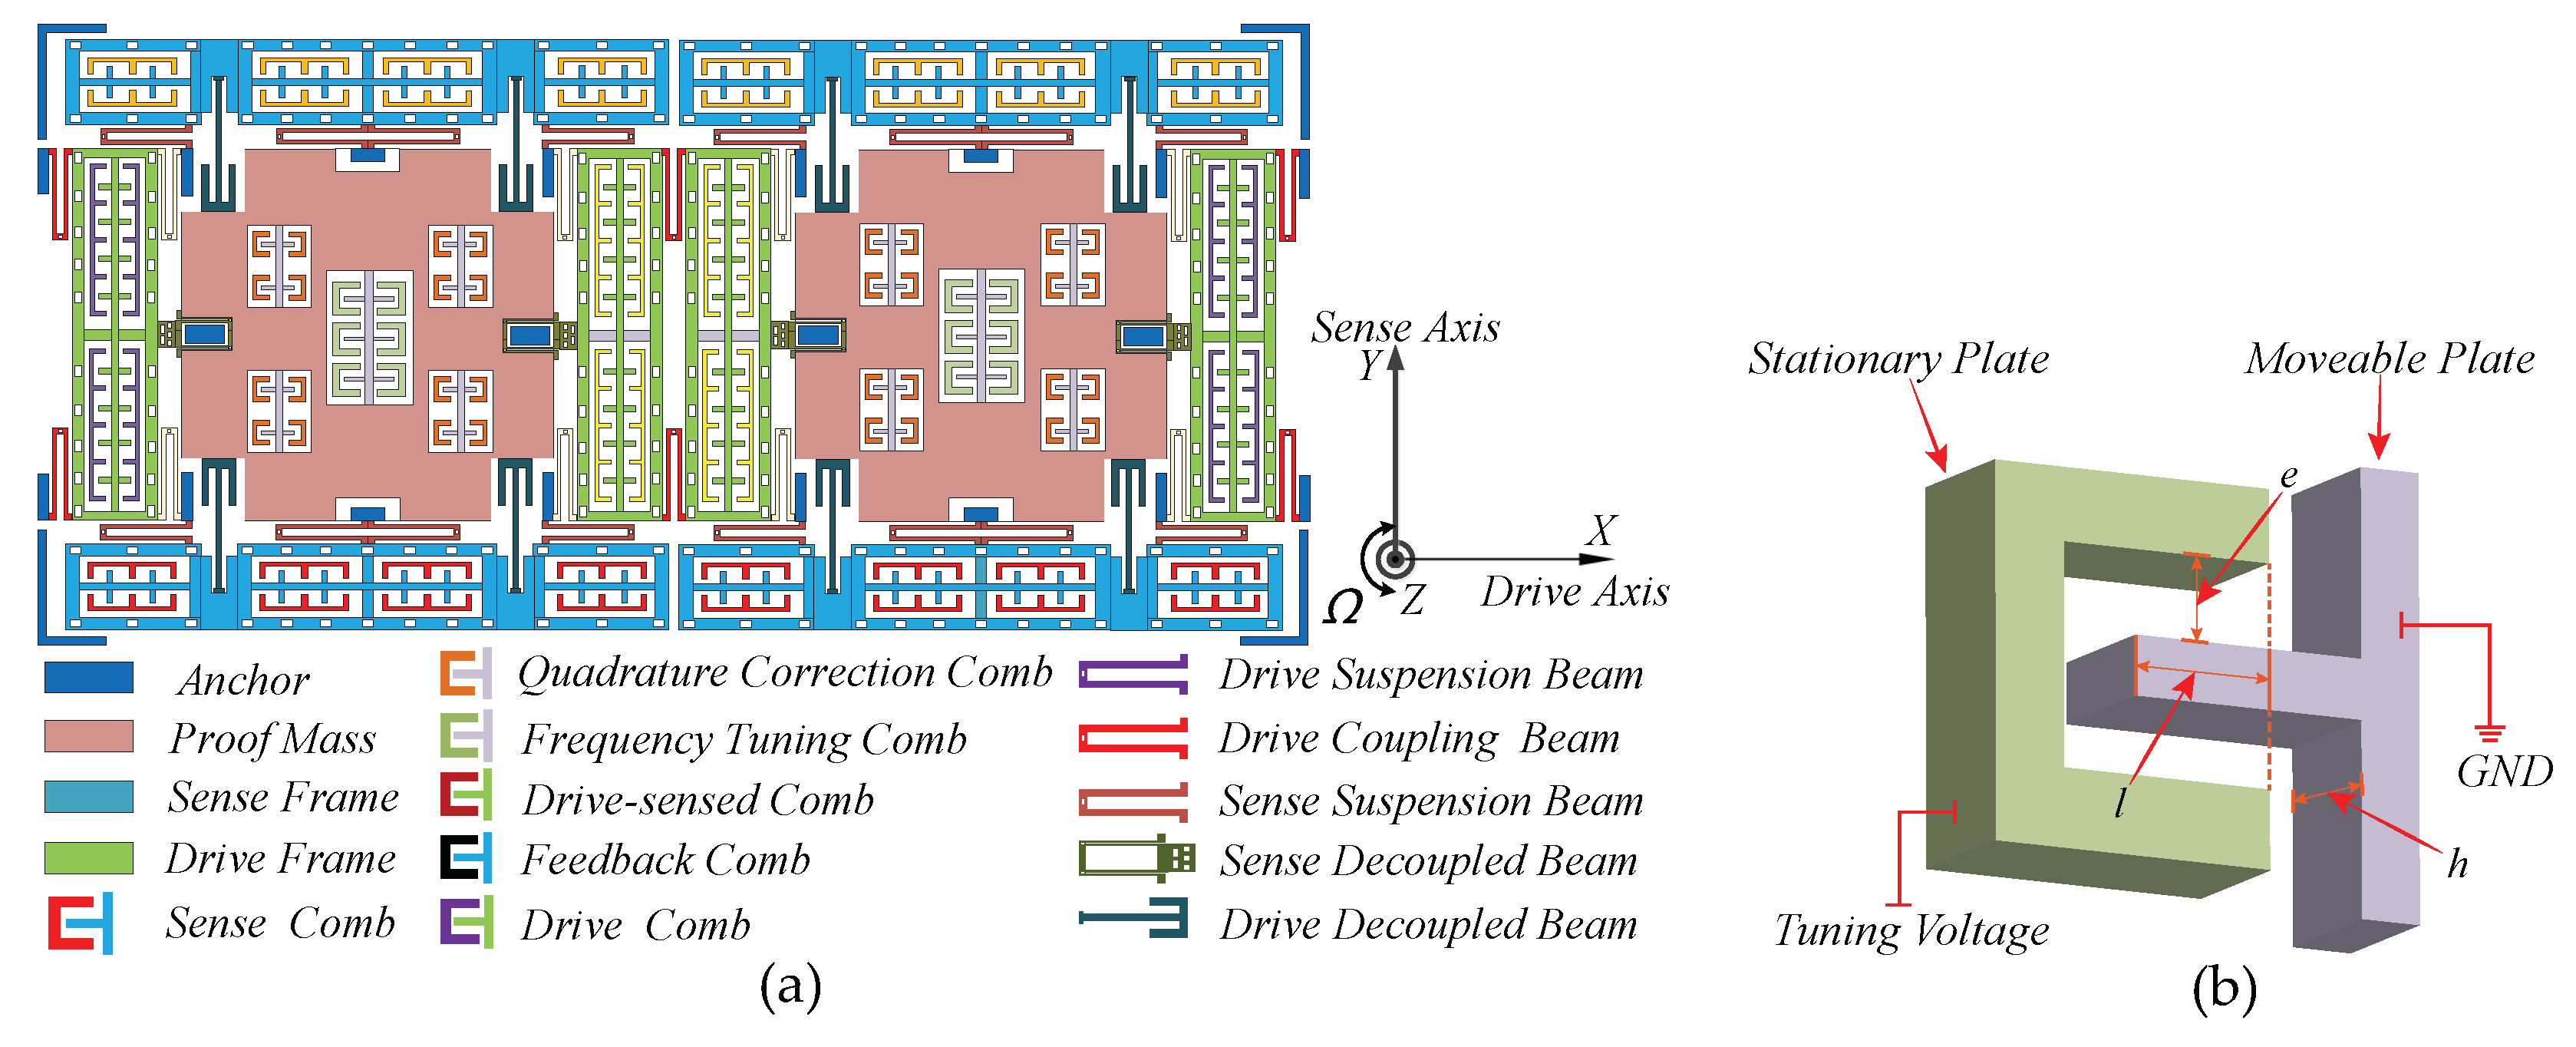
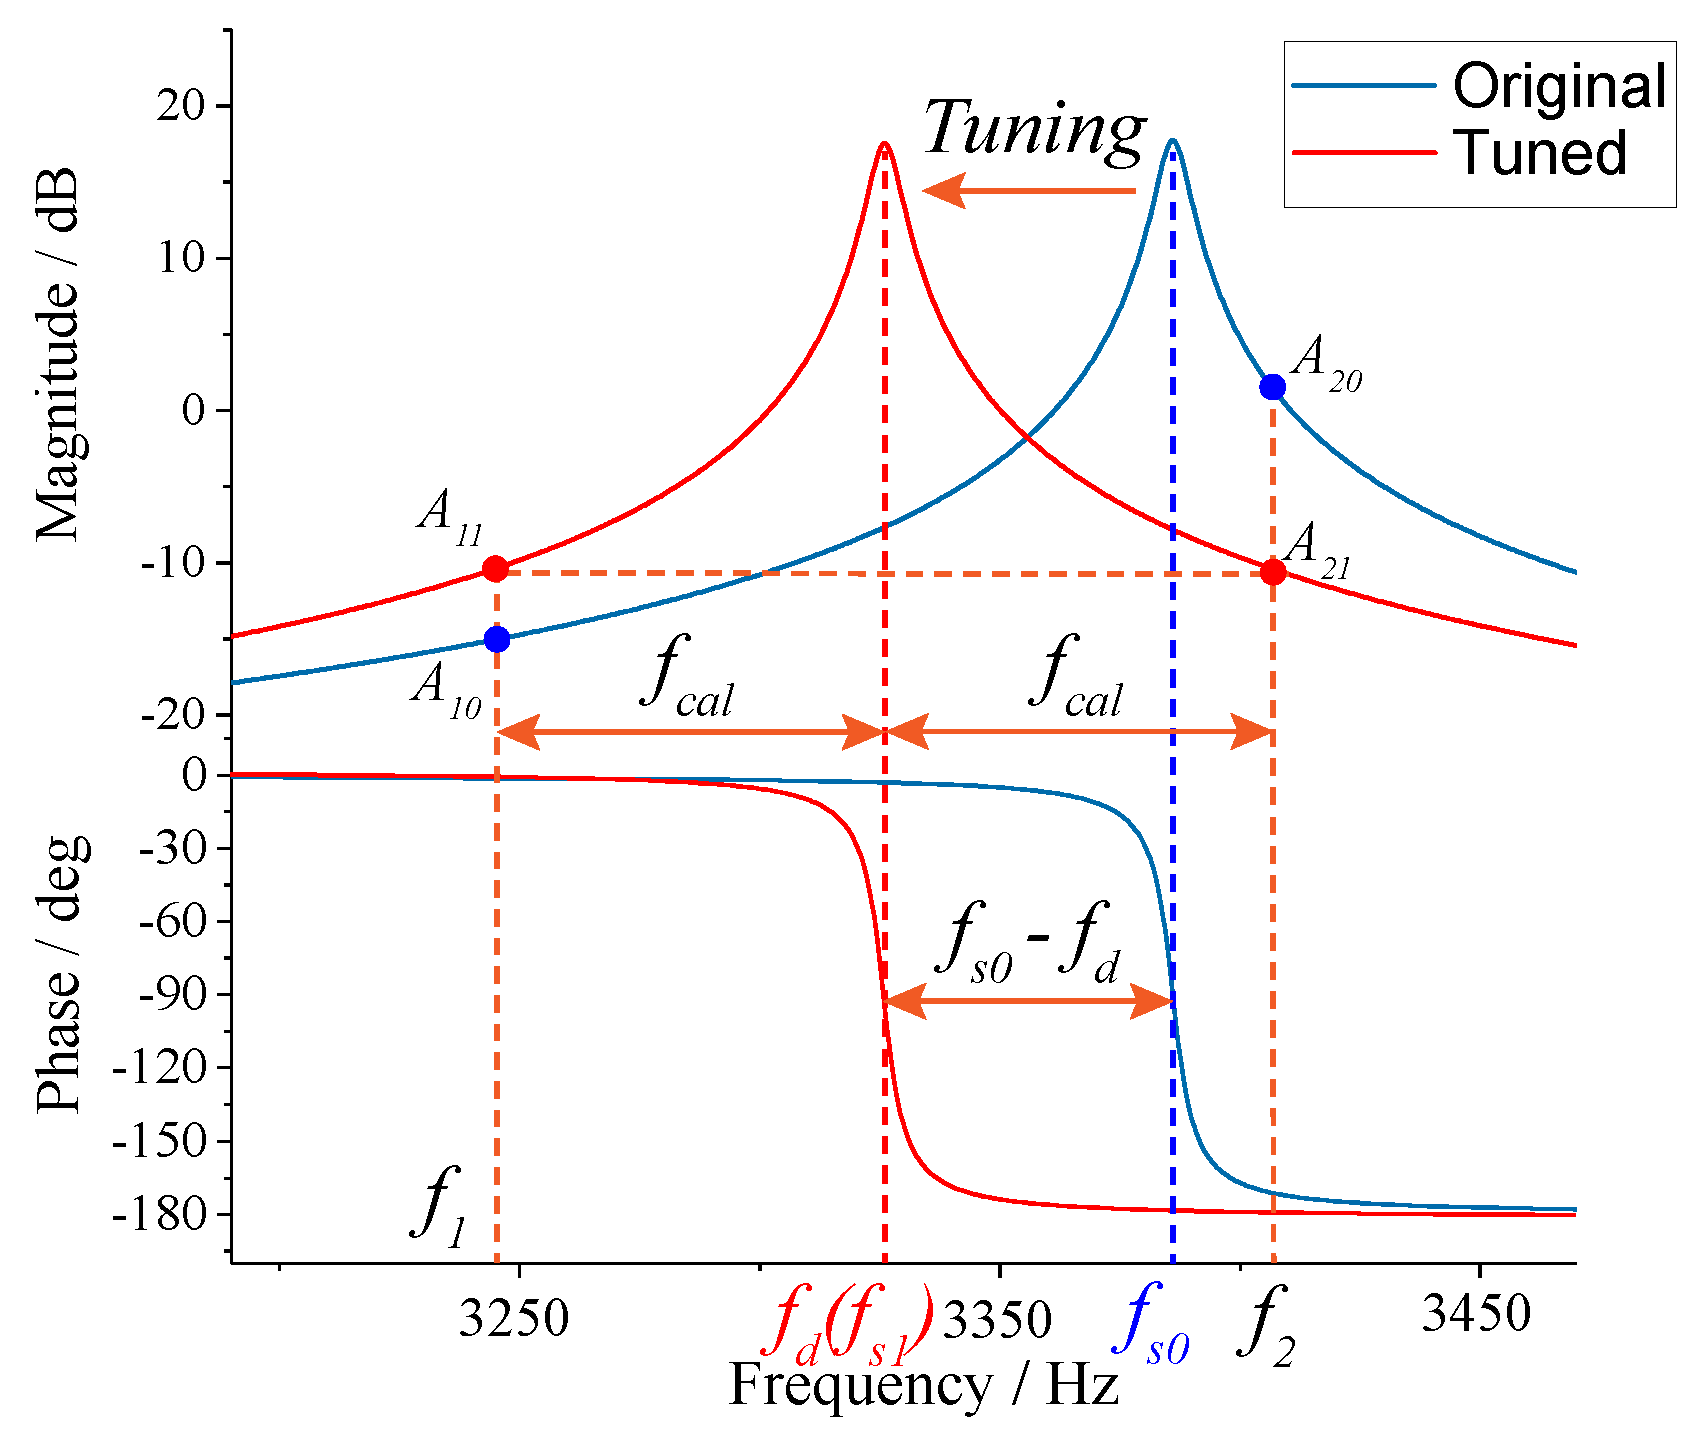
2. Dual-Mass MEMS Gyroscope and Frequency Tuning Principle
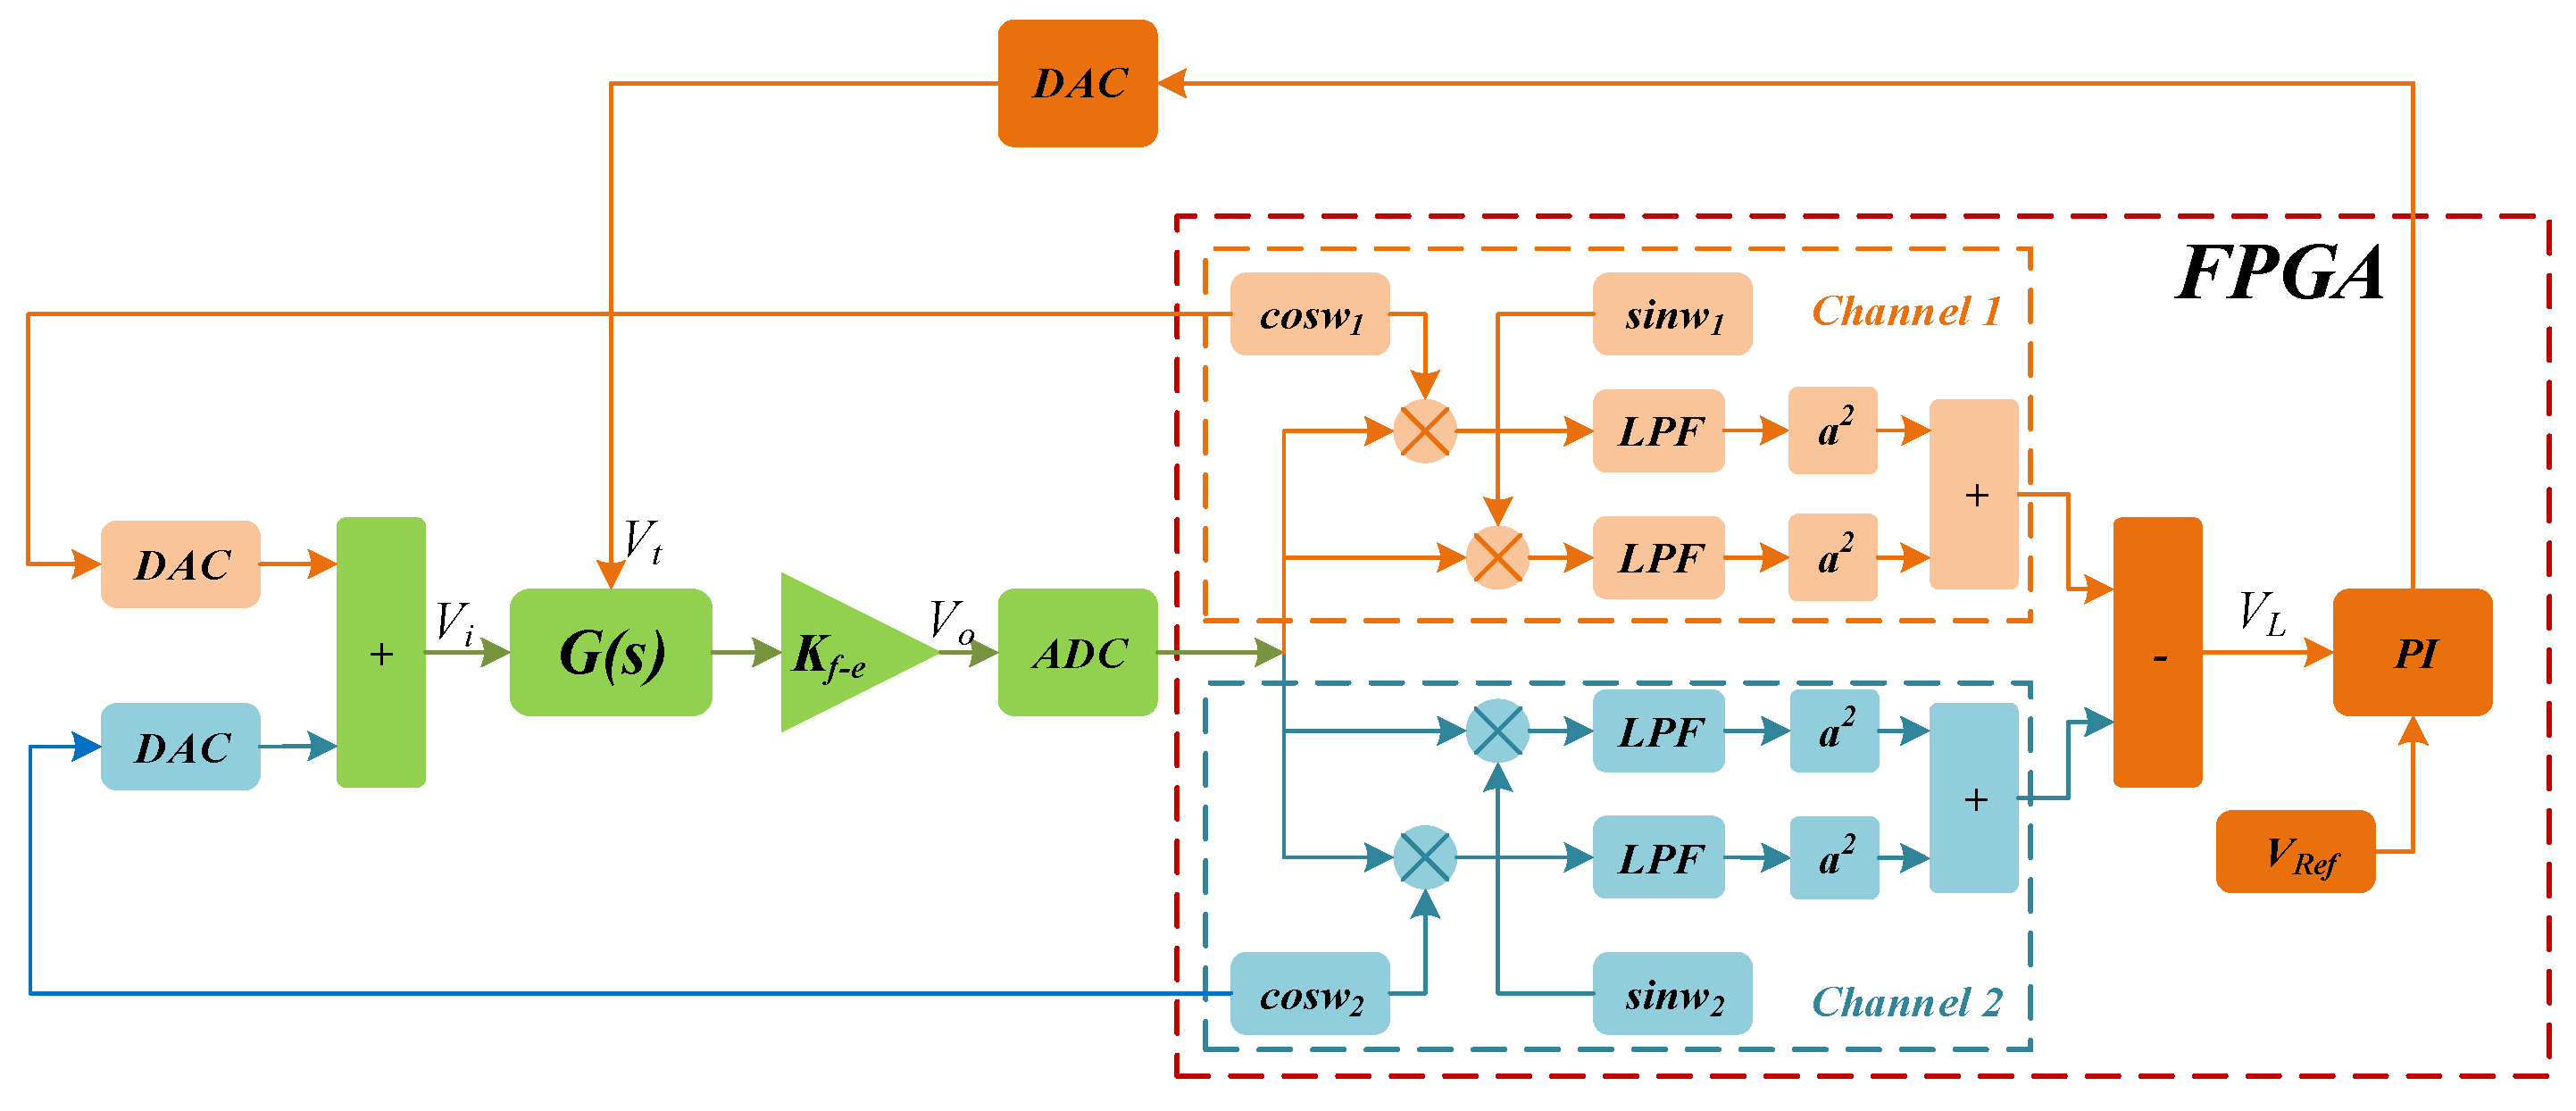
3. Digital Excitation-Calibration Control System
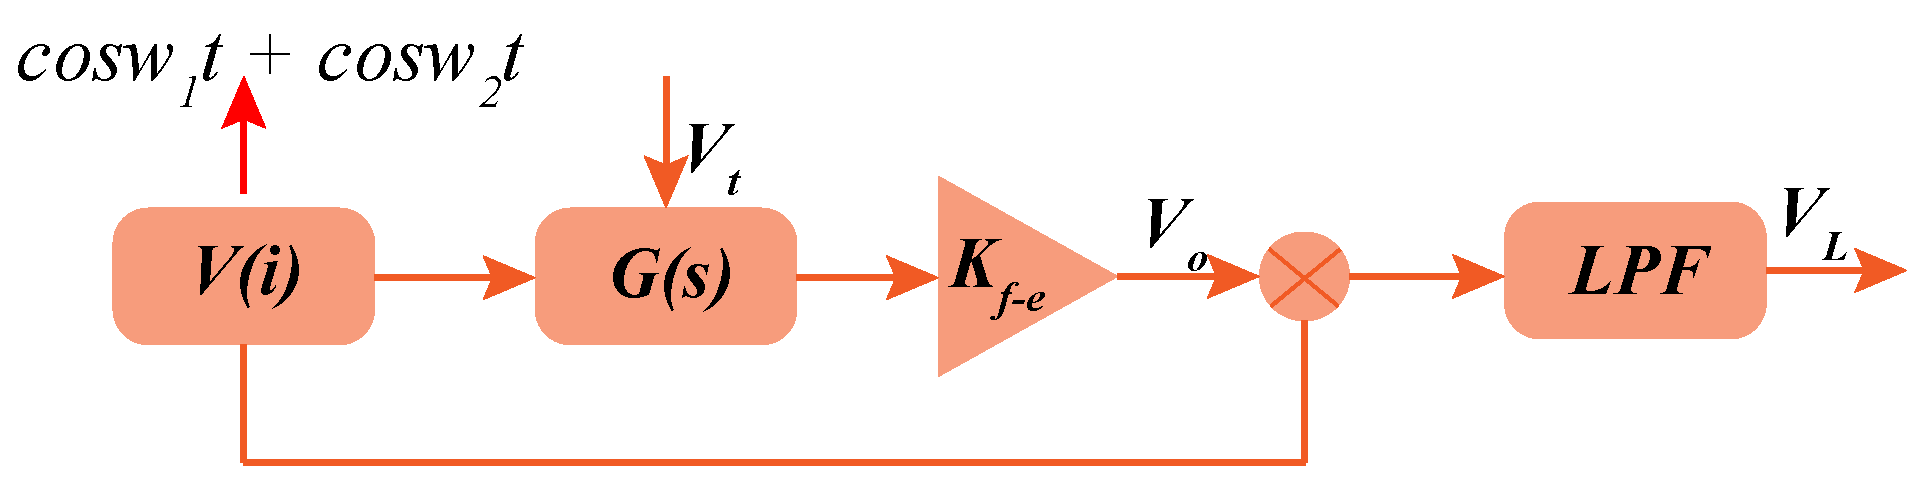
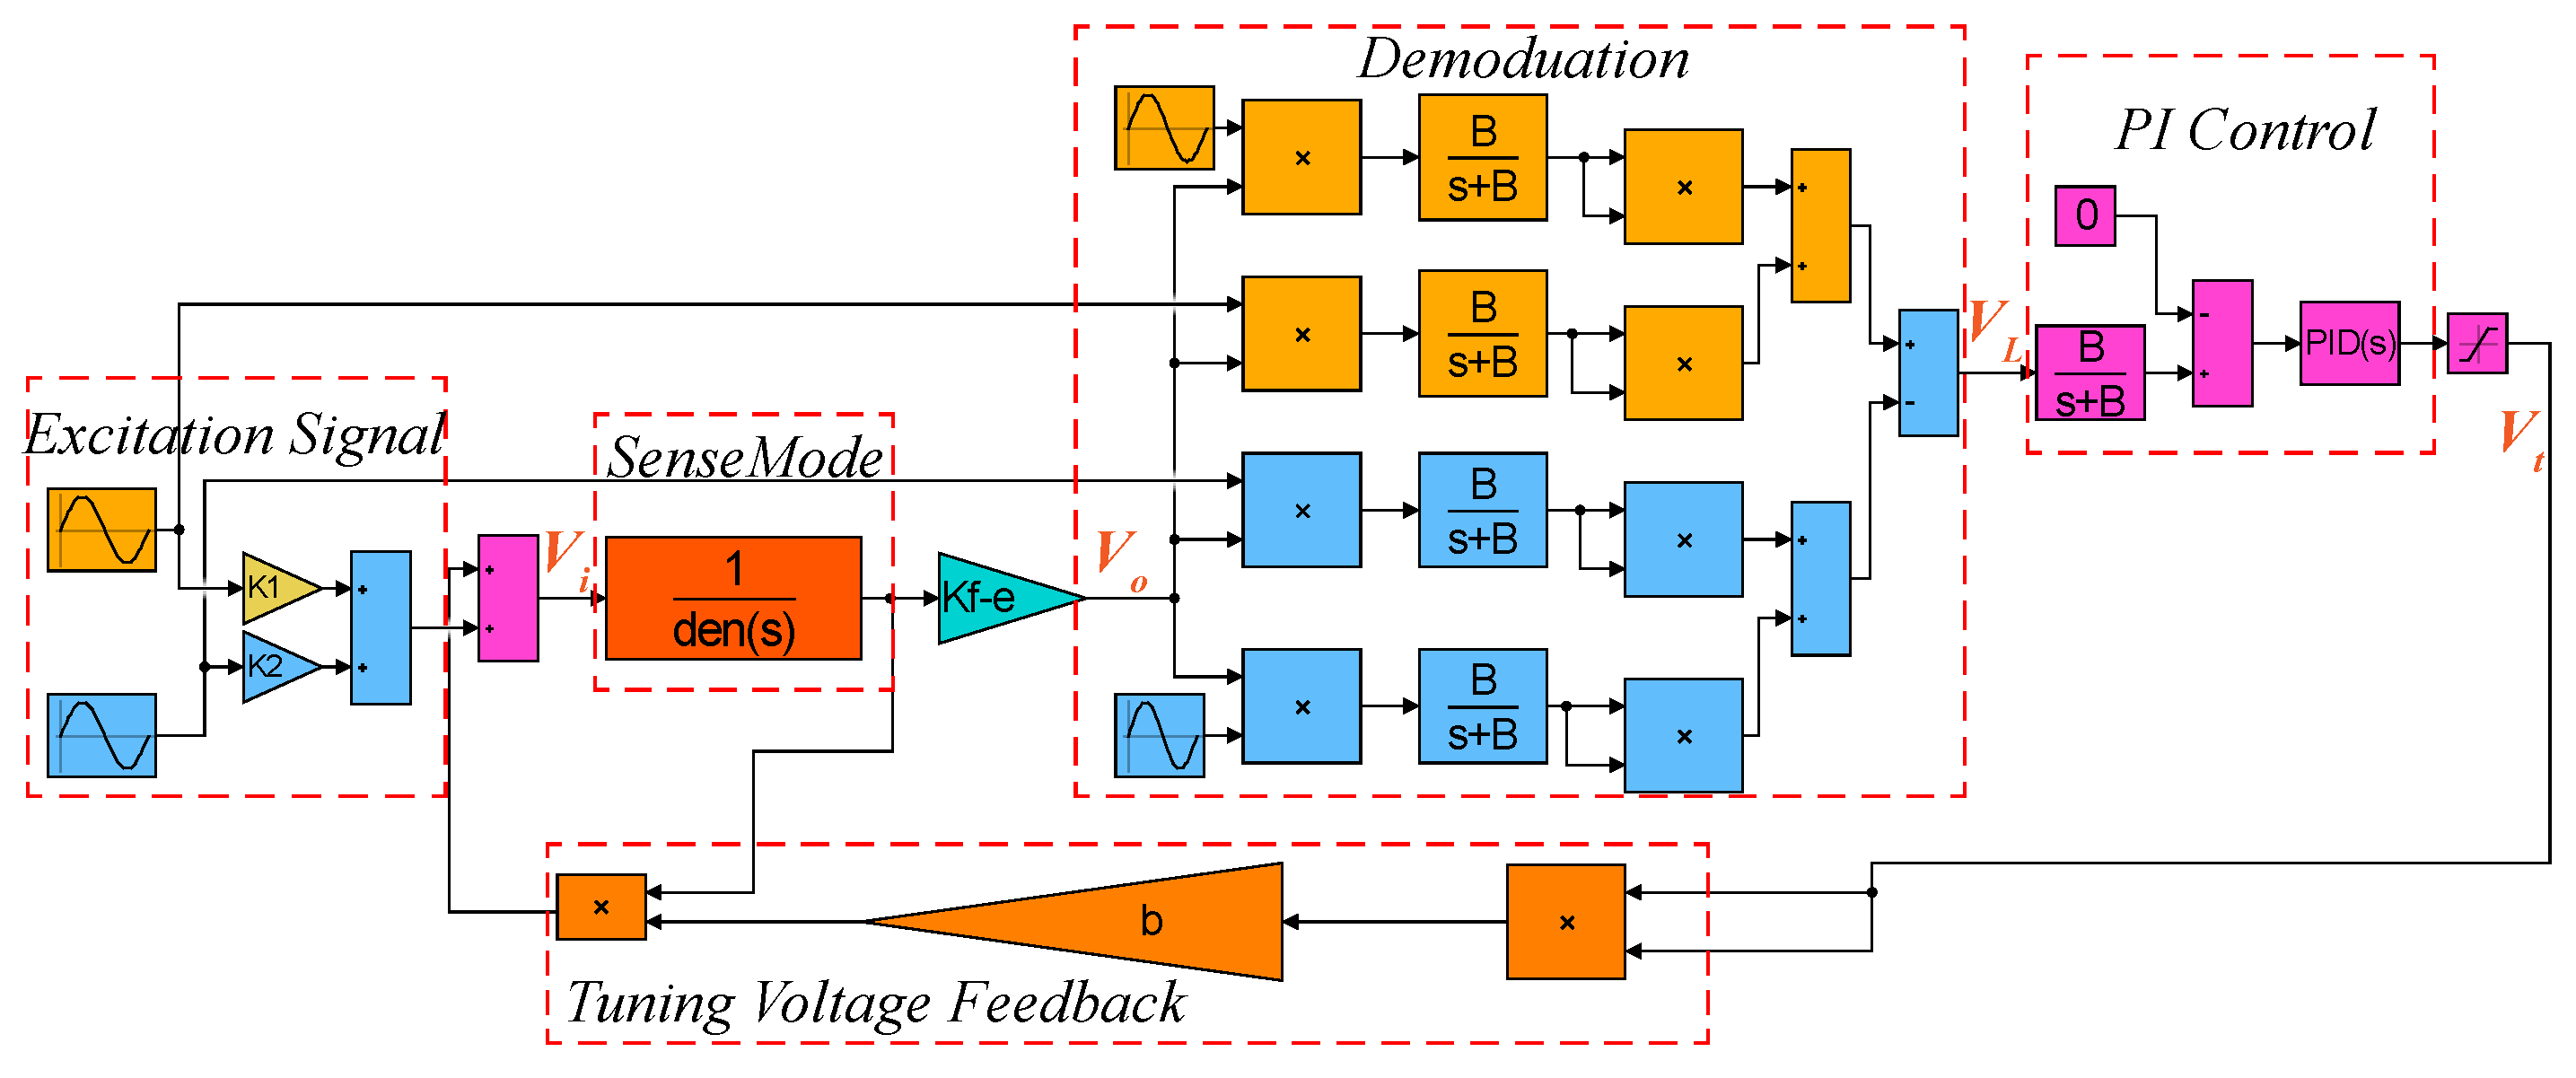
3.1. System Design
3.2. Open-Loop Analysis
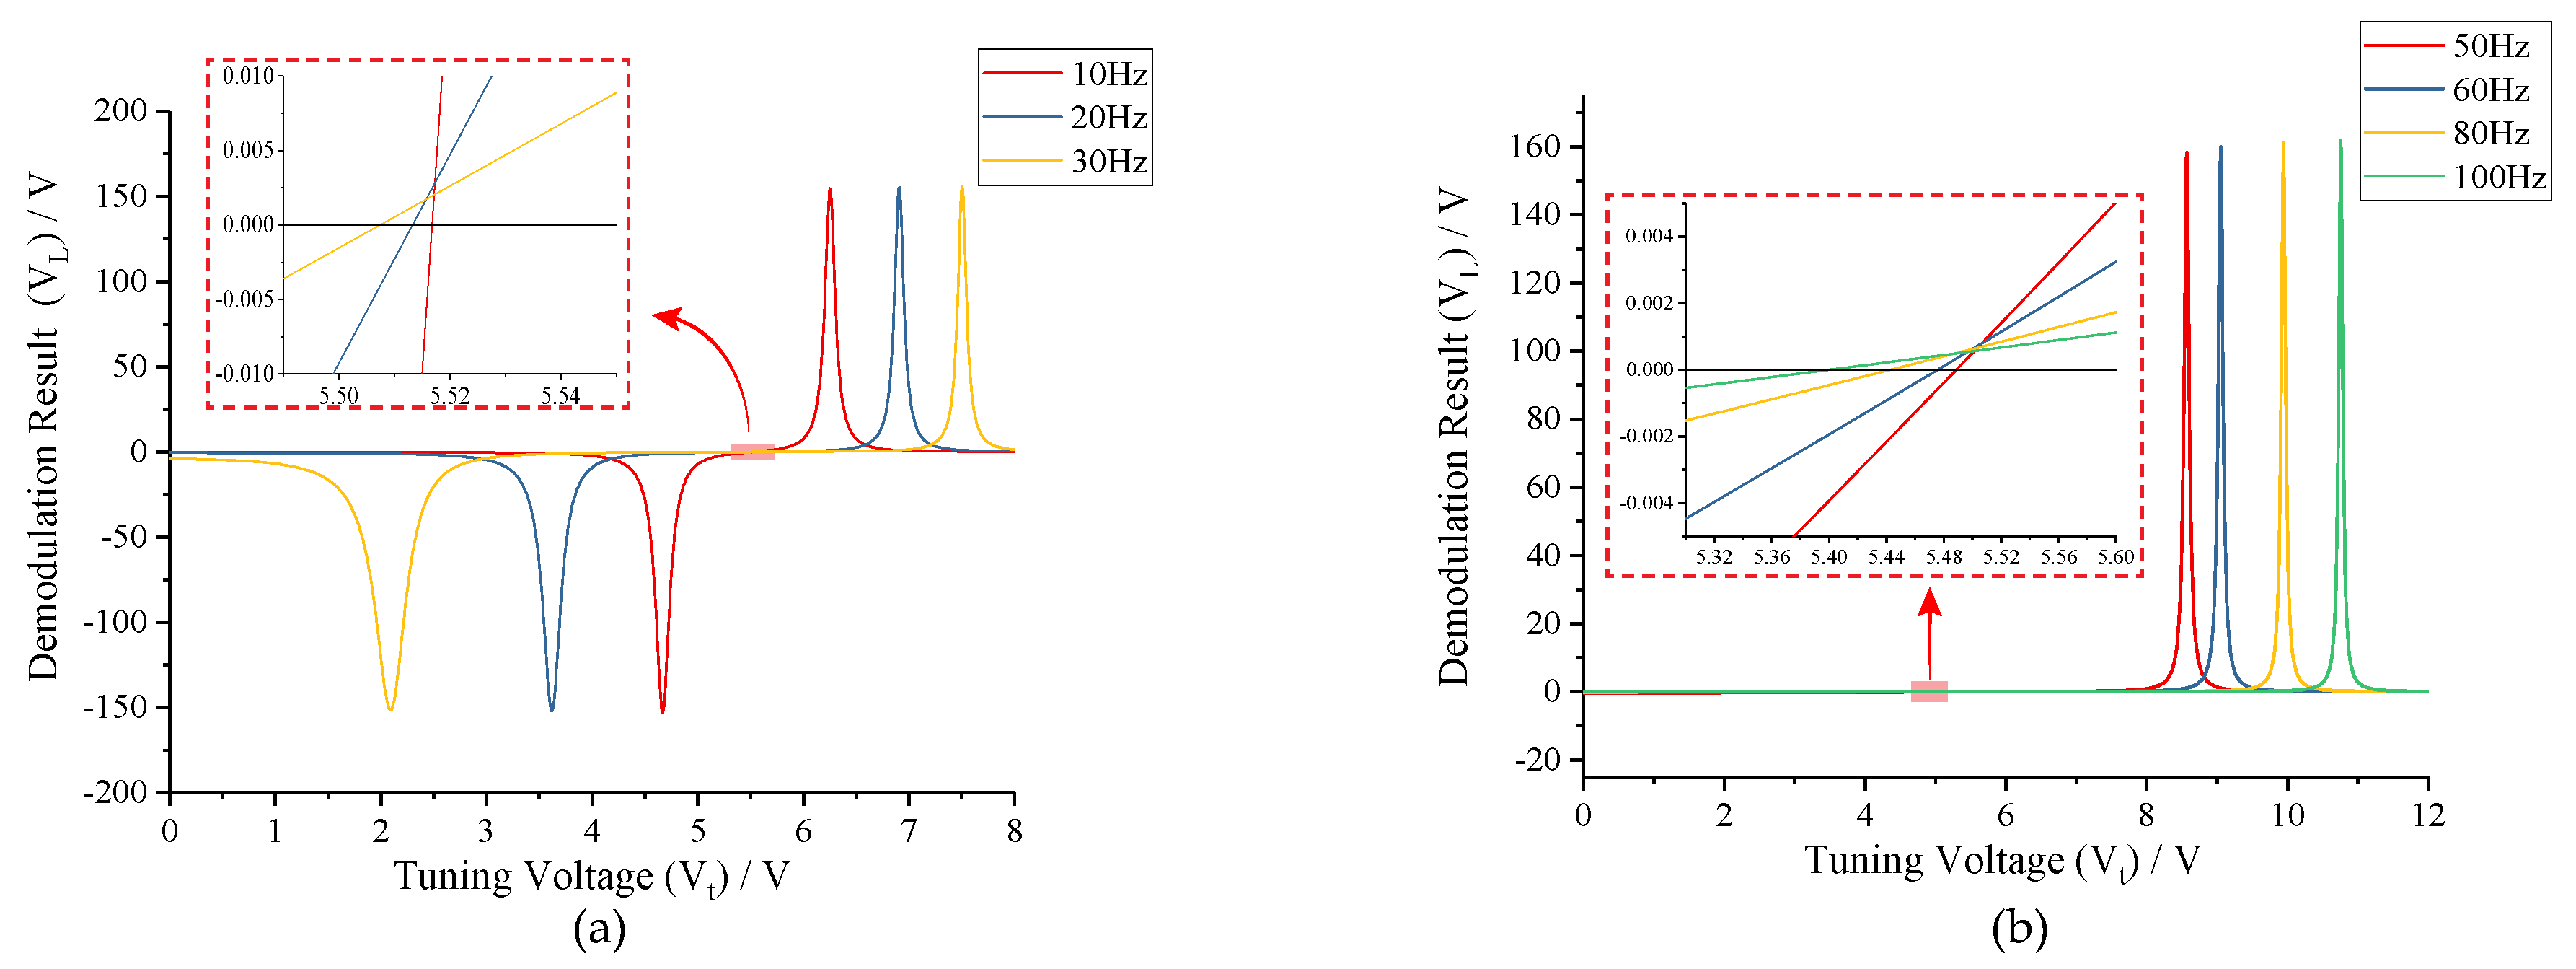
3.2.1. Frequency Limit of Excitation Signal
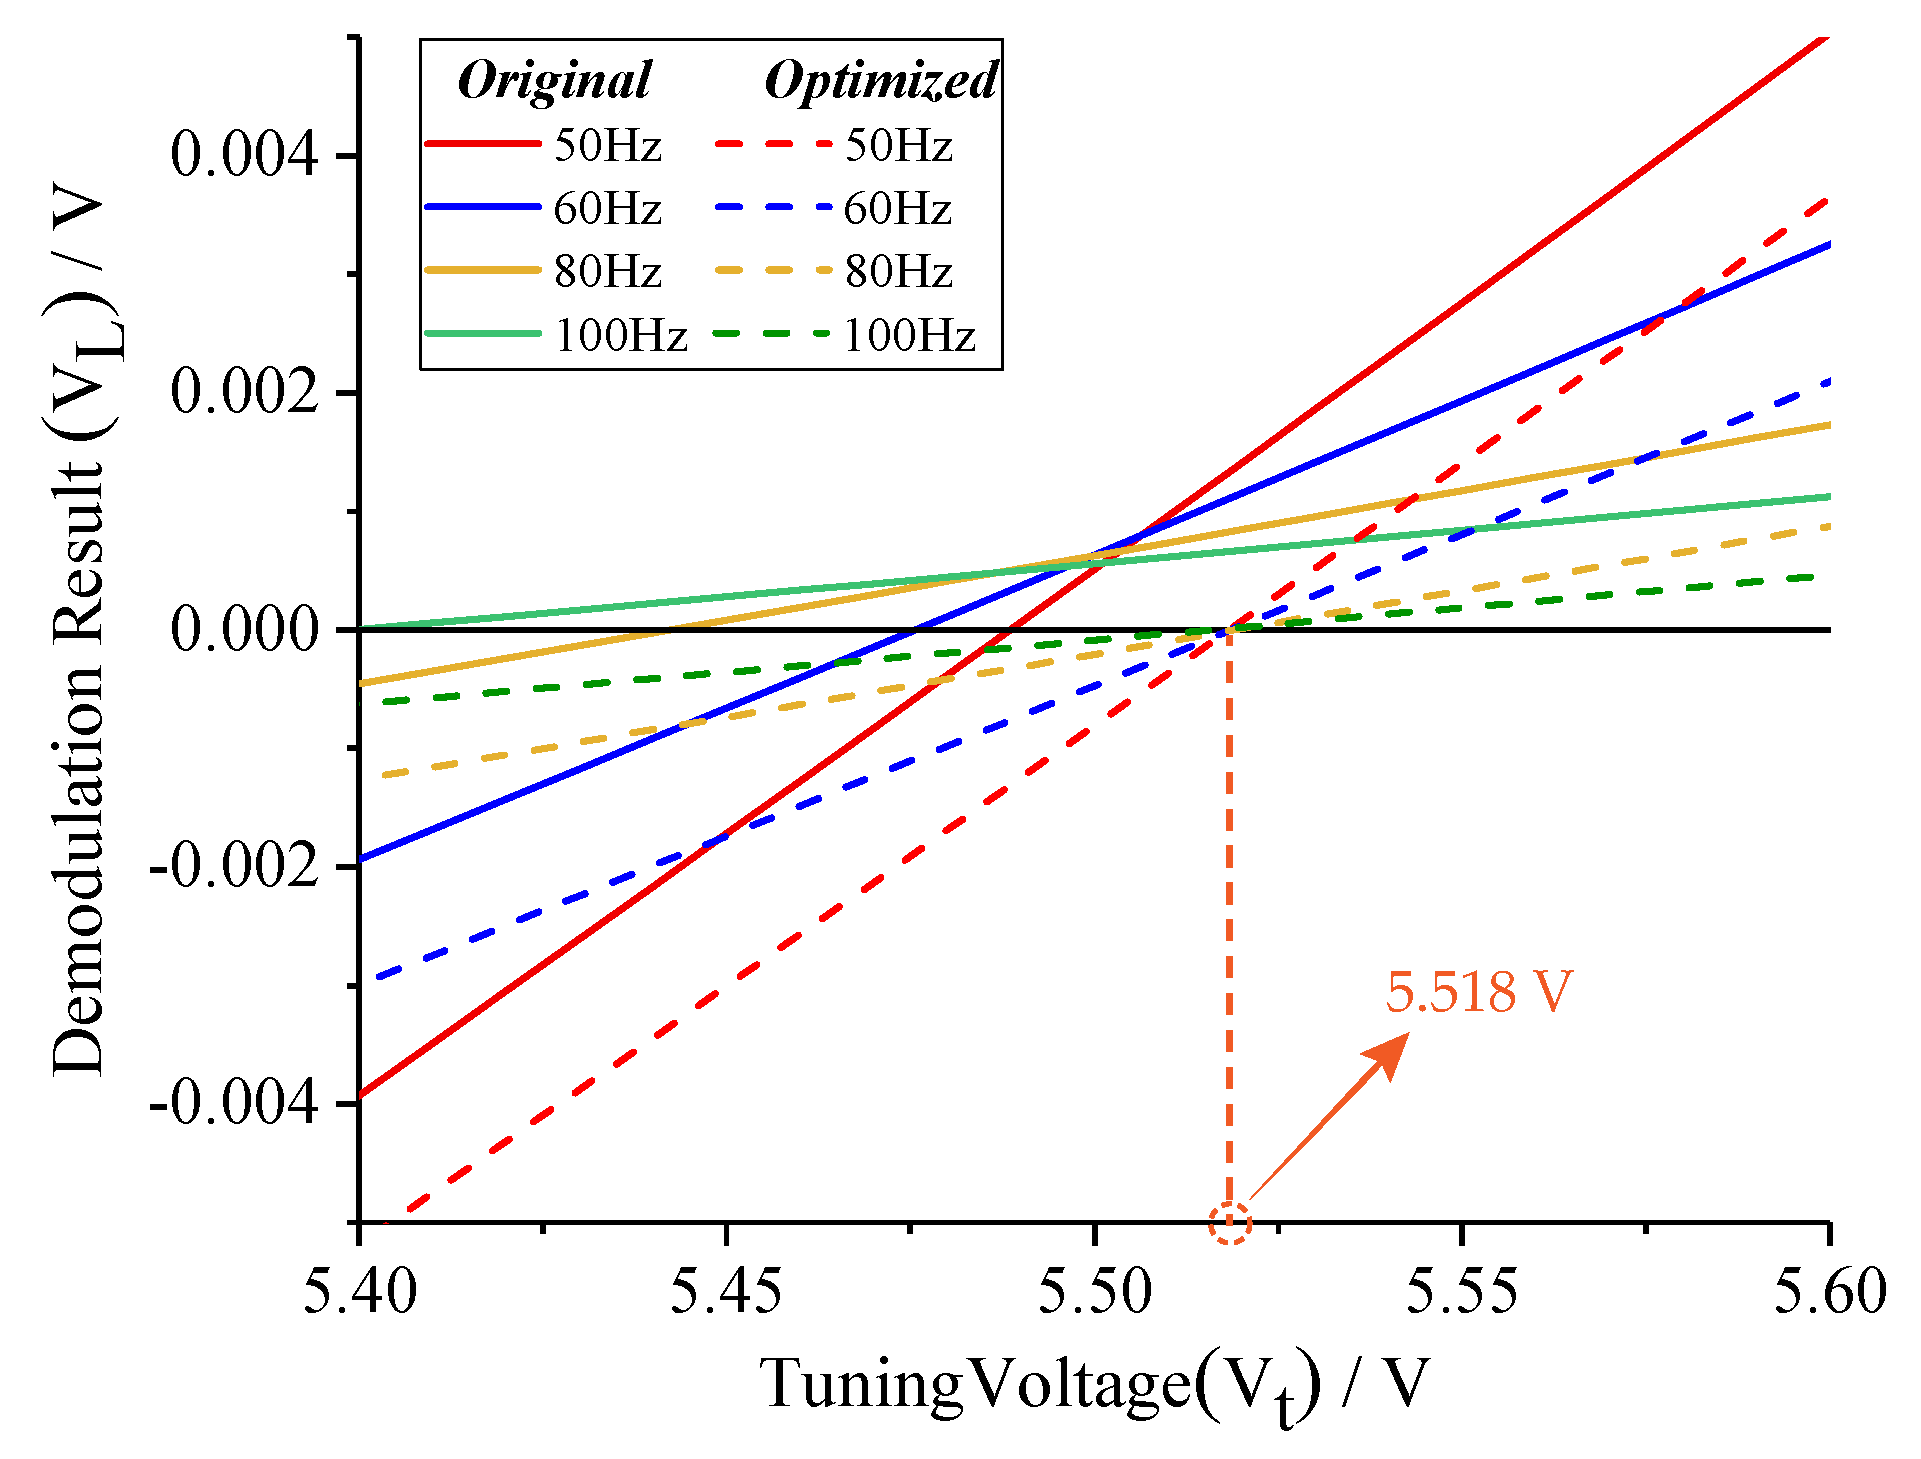
3.2.2. Amplitude Ratio of Excitation Signal
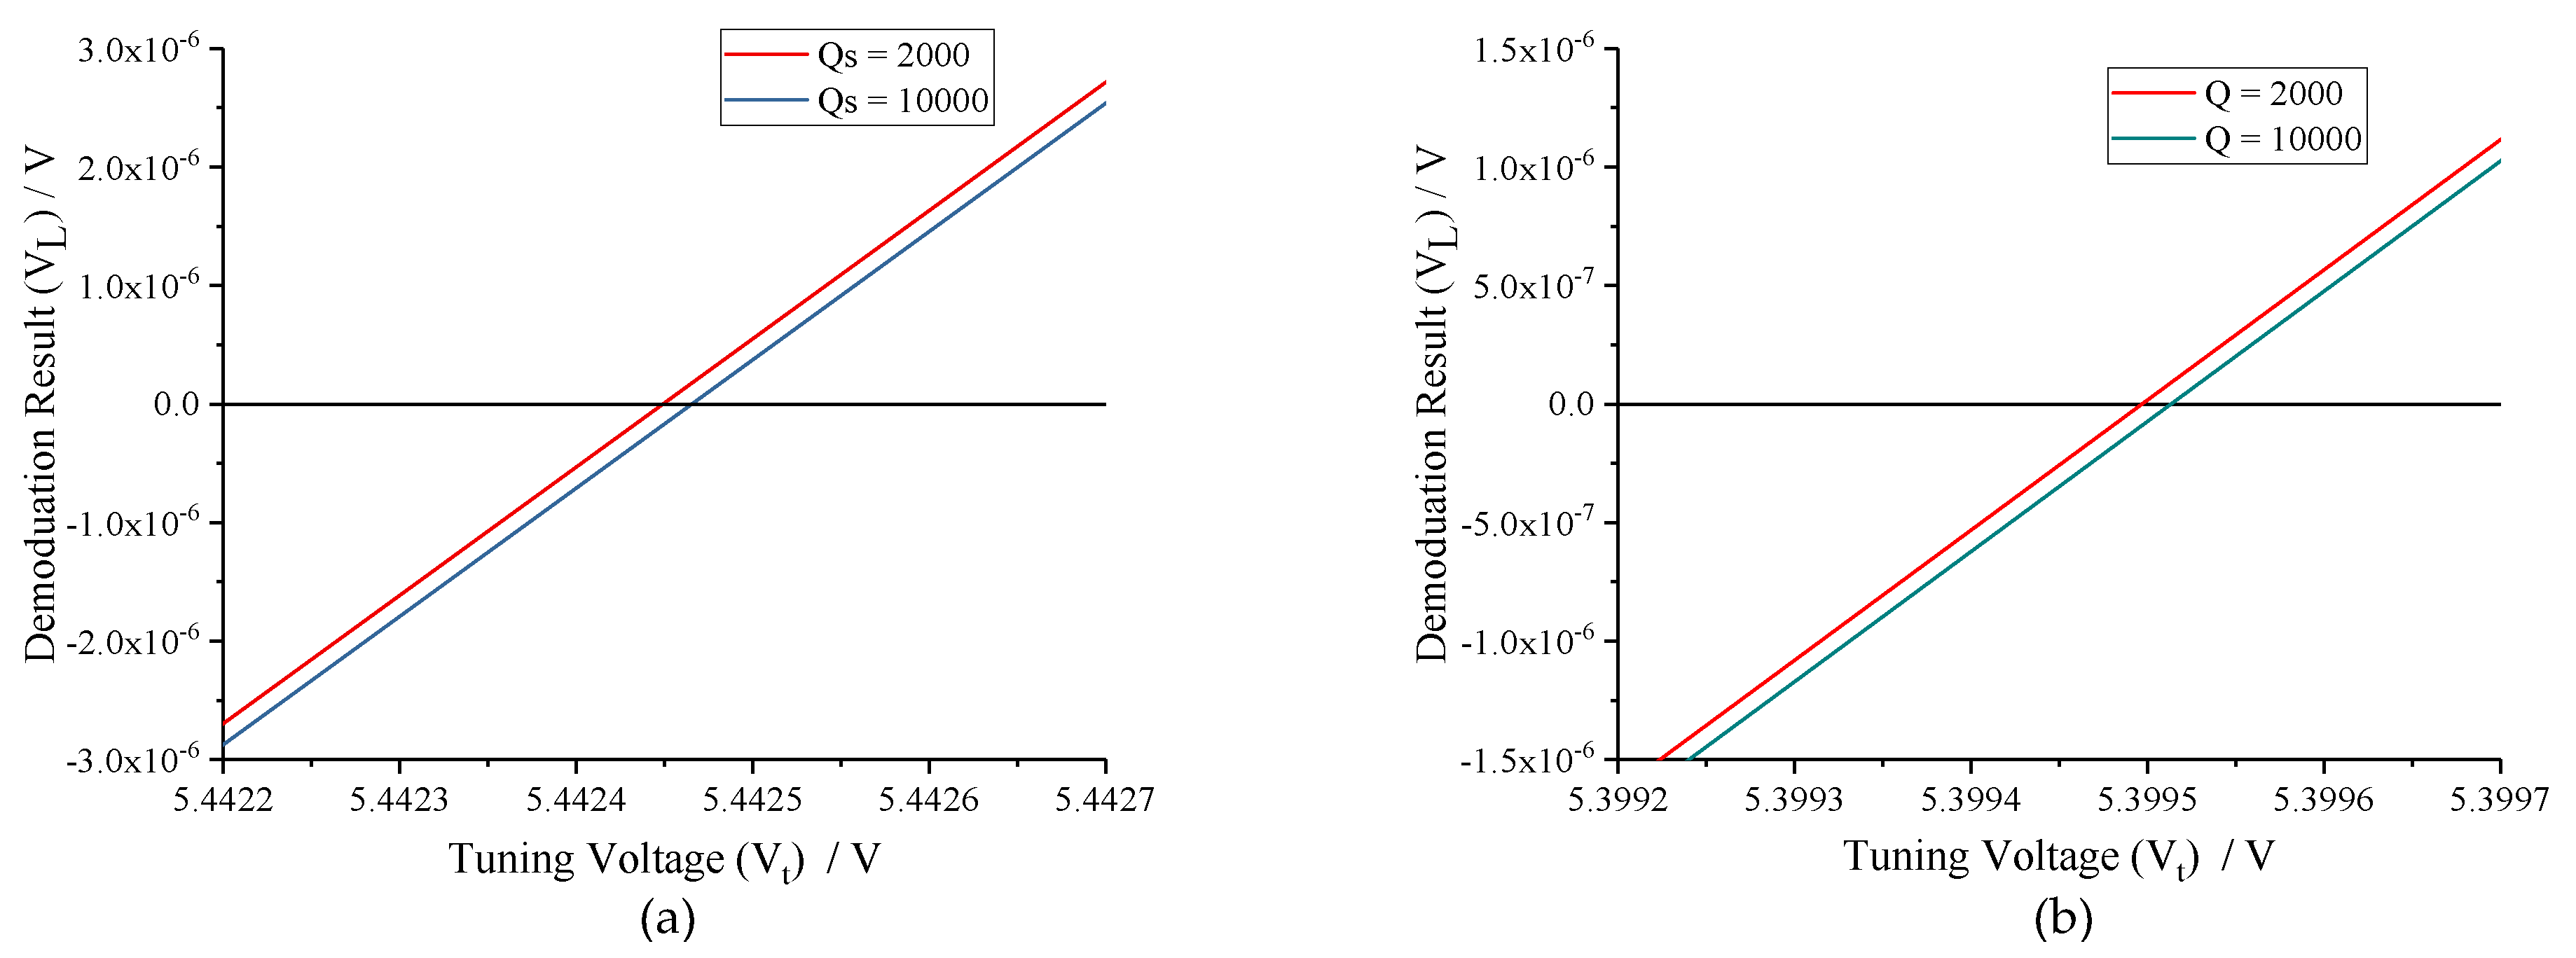
3.2.3. Quality Factor of Sense Mode
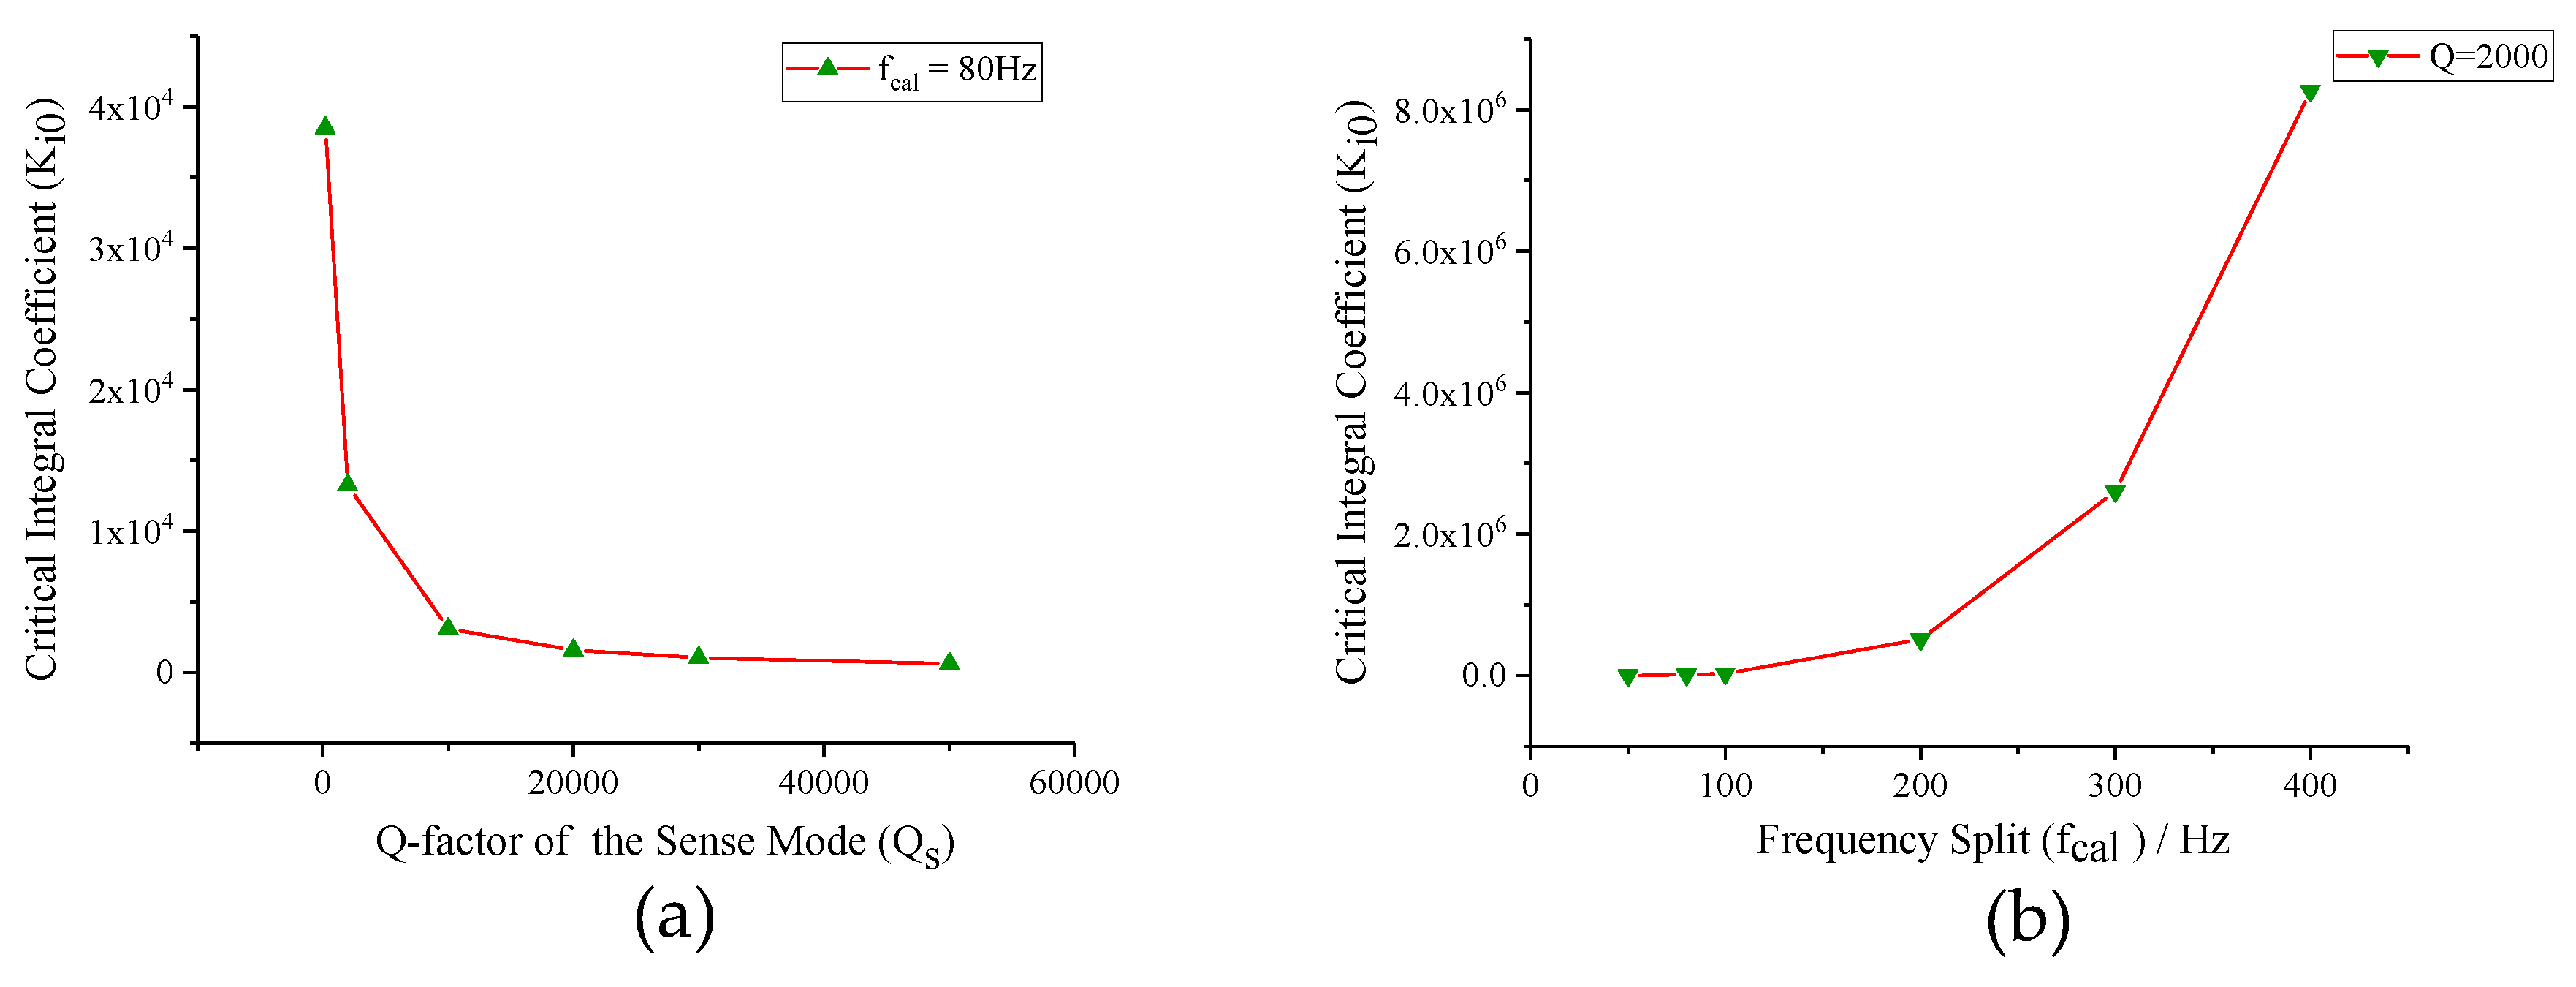
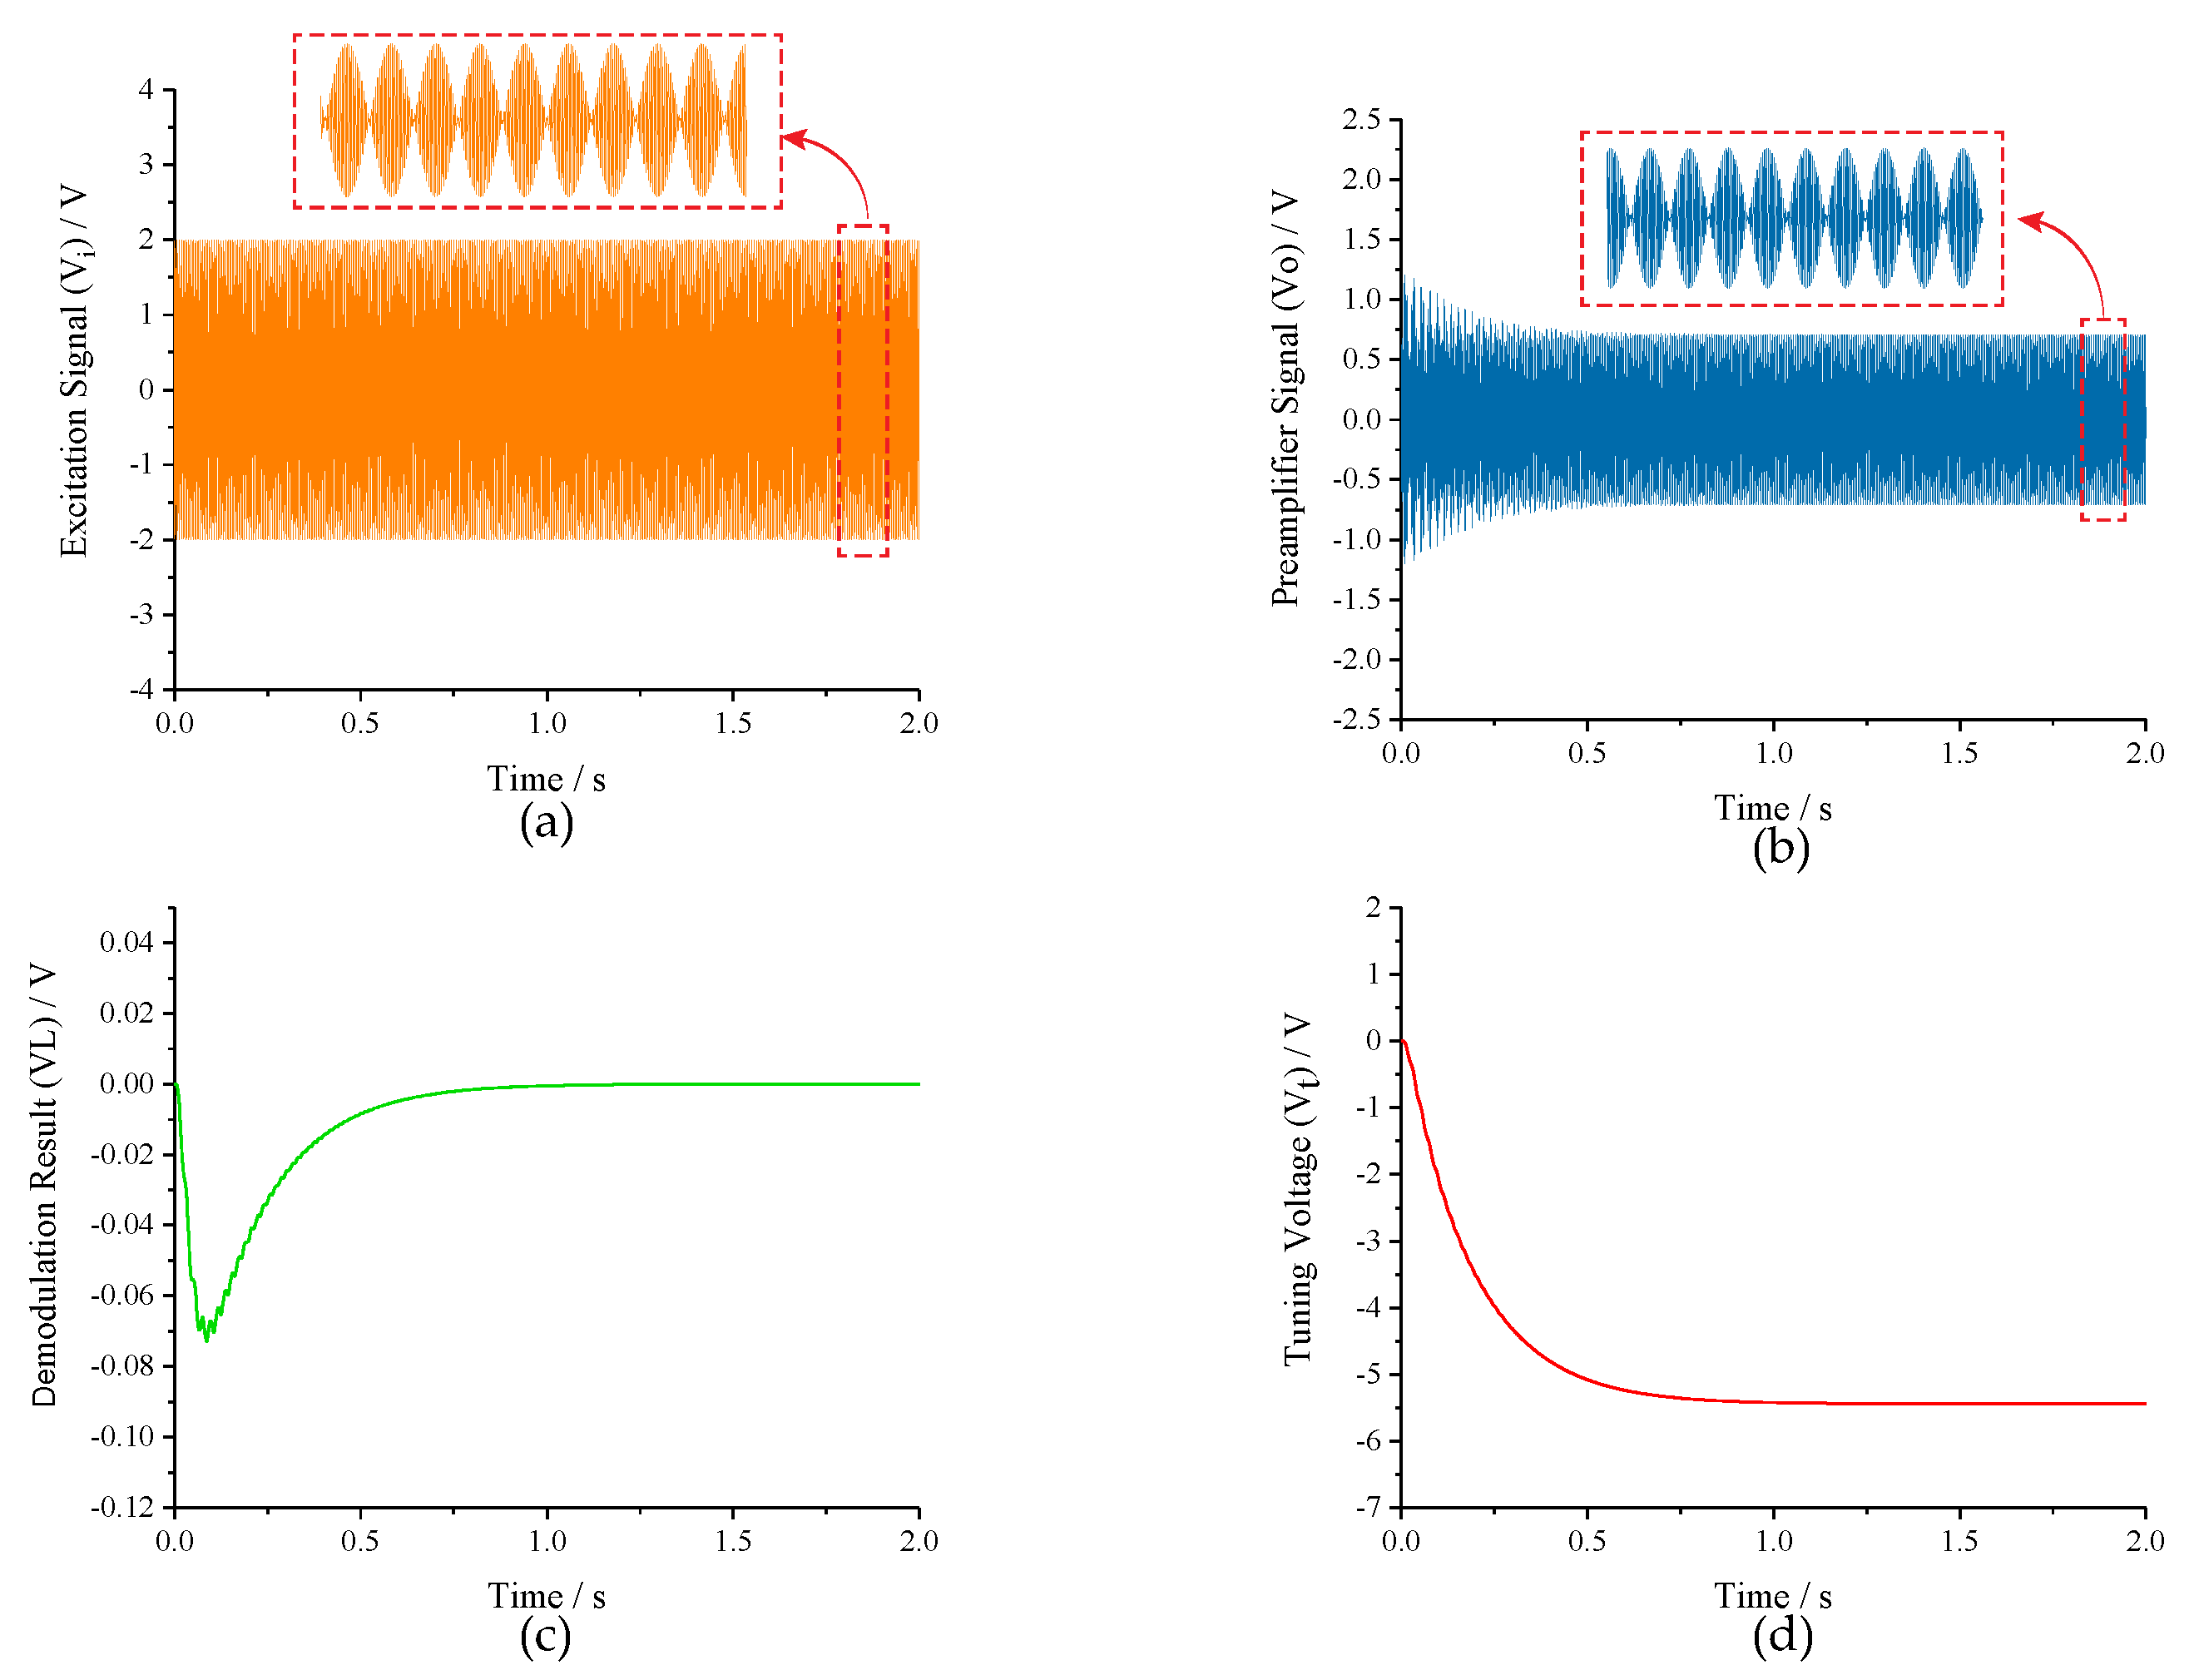
3.3. Closed-Loop Analysis
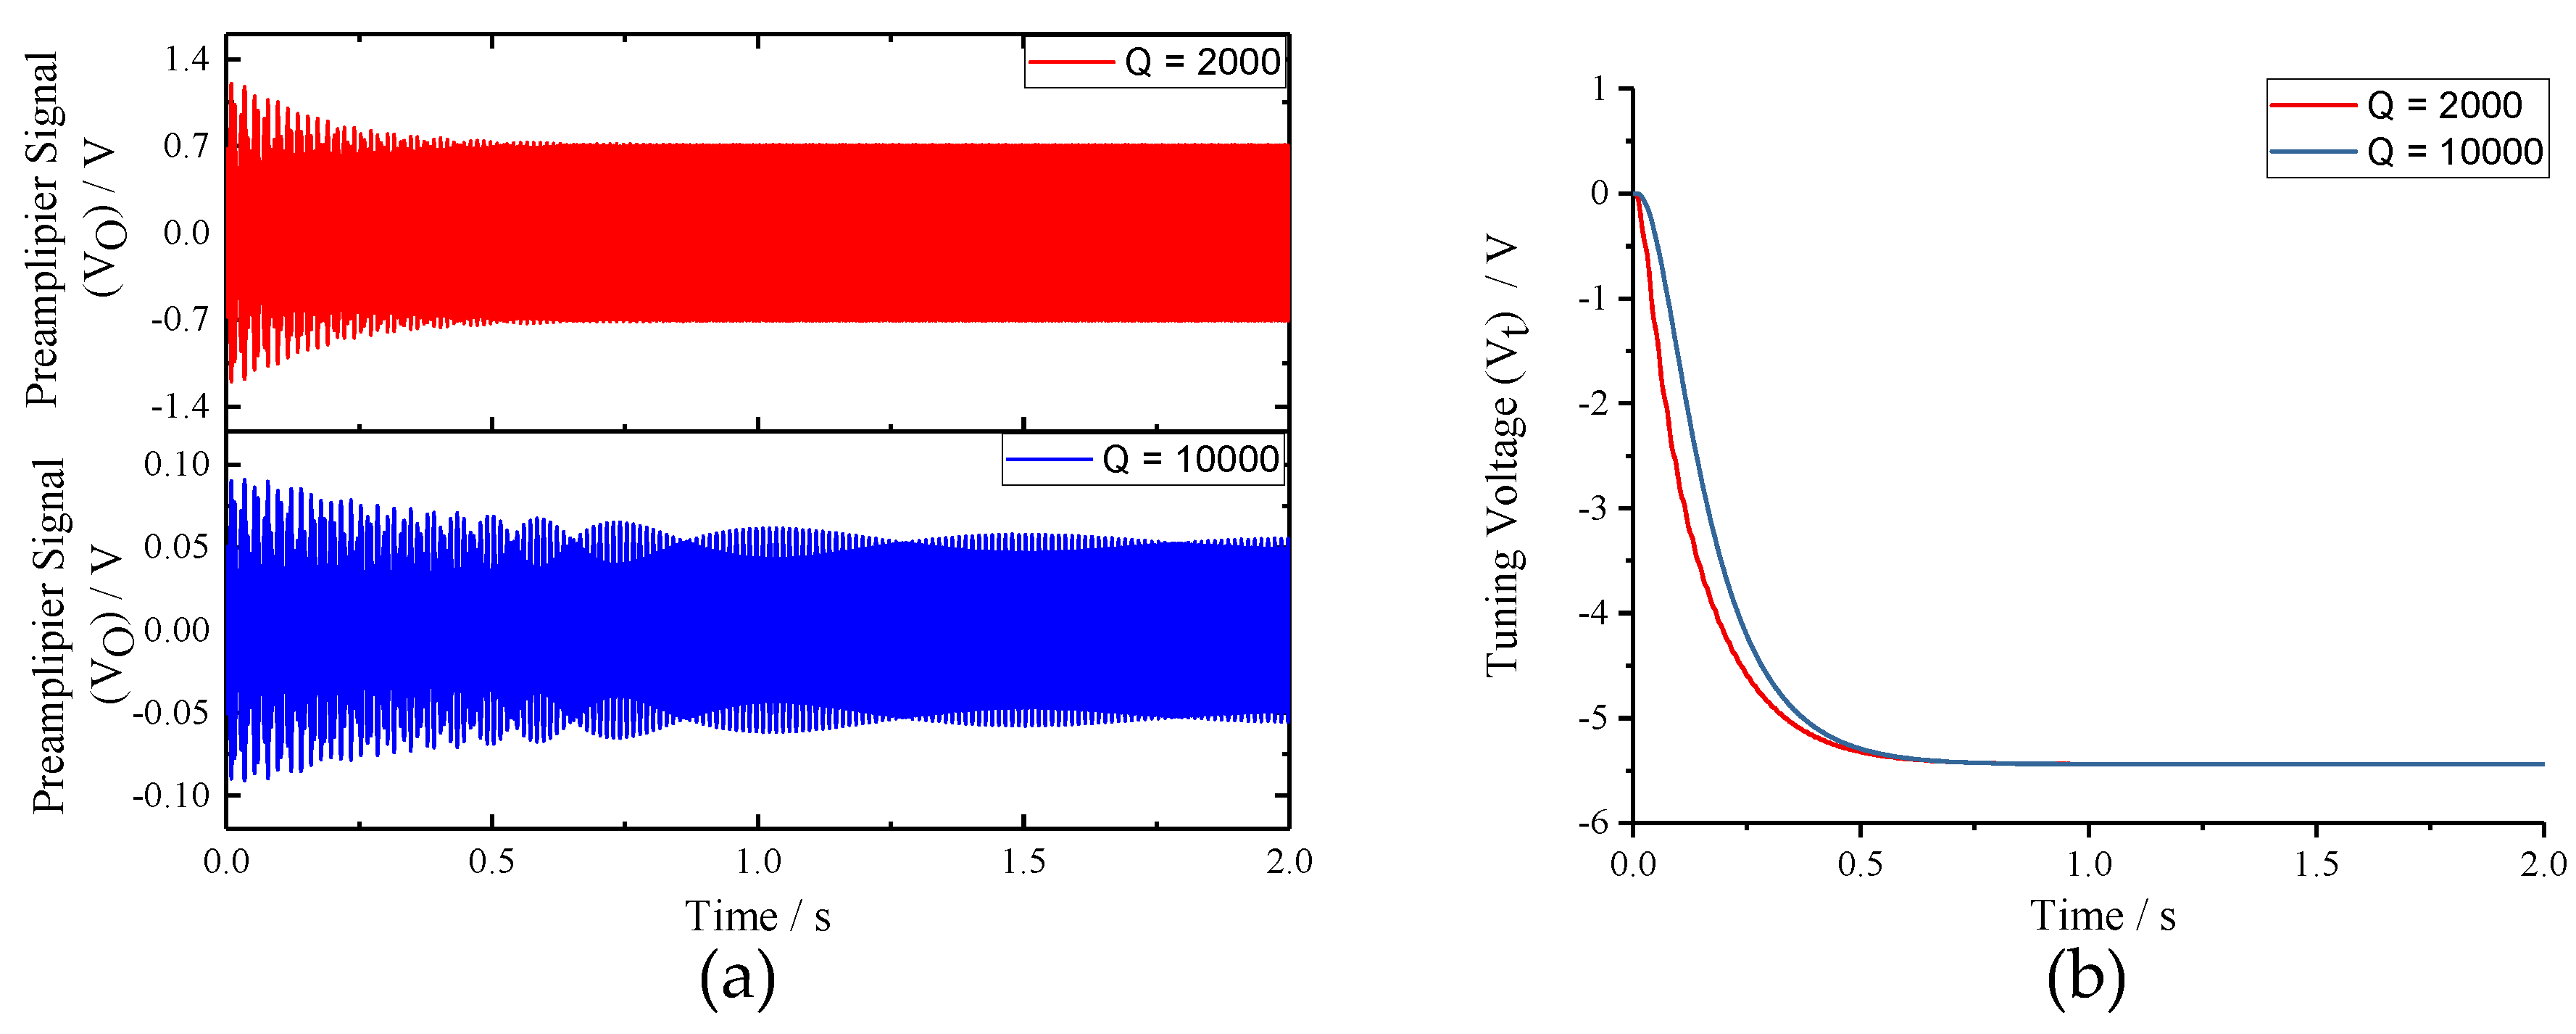
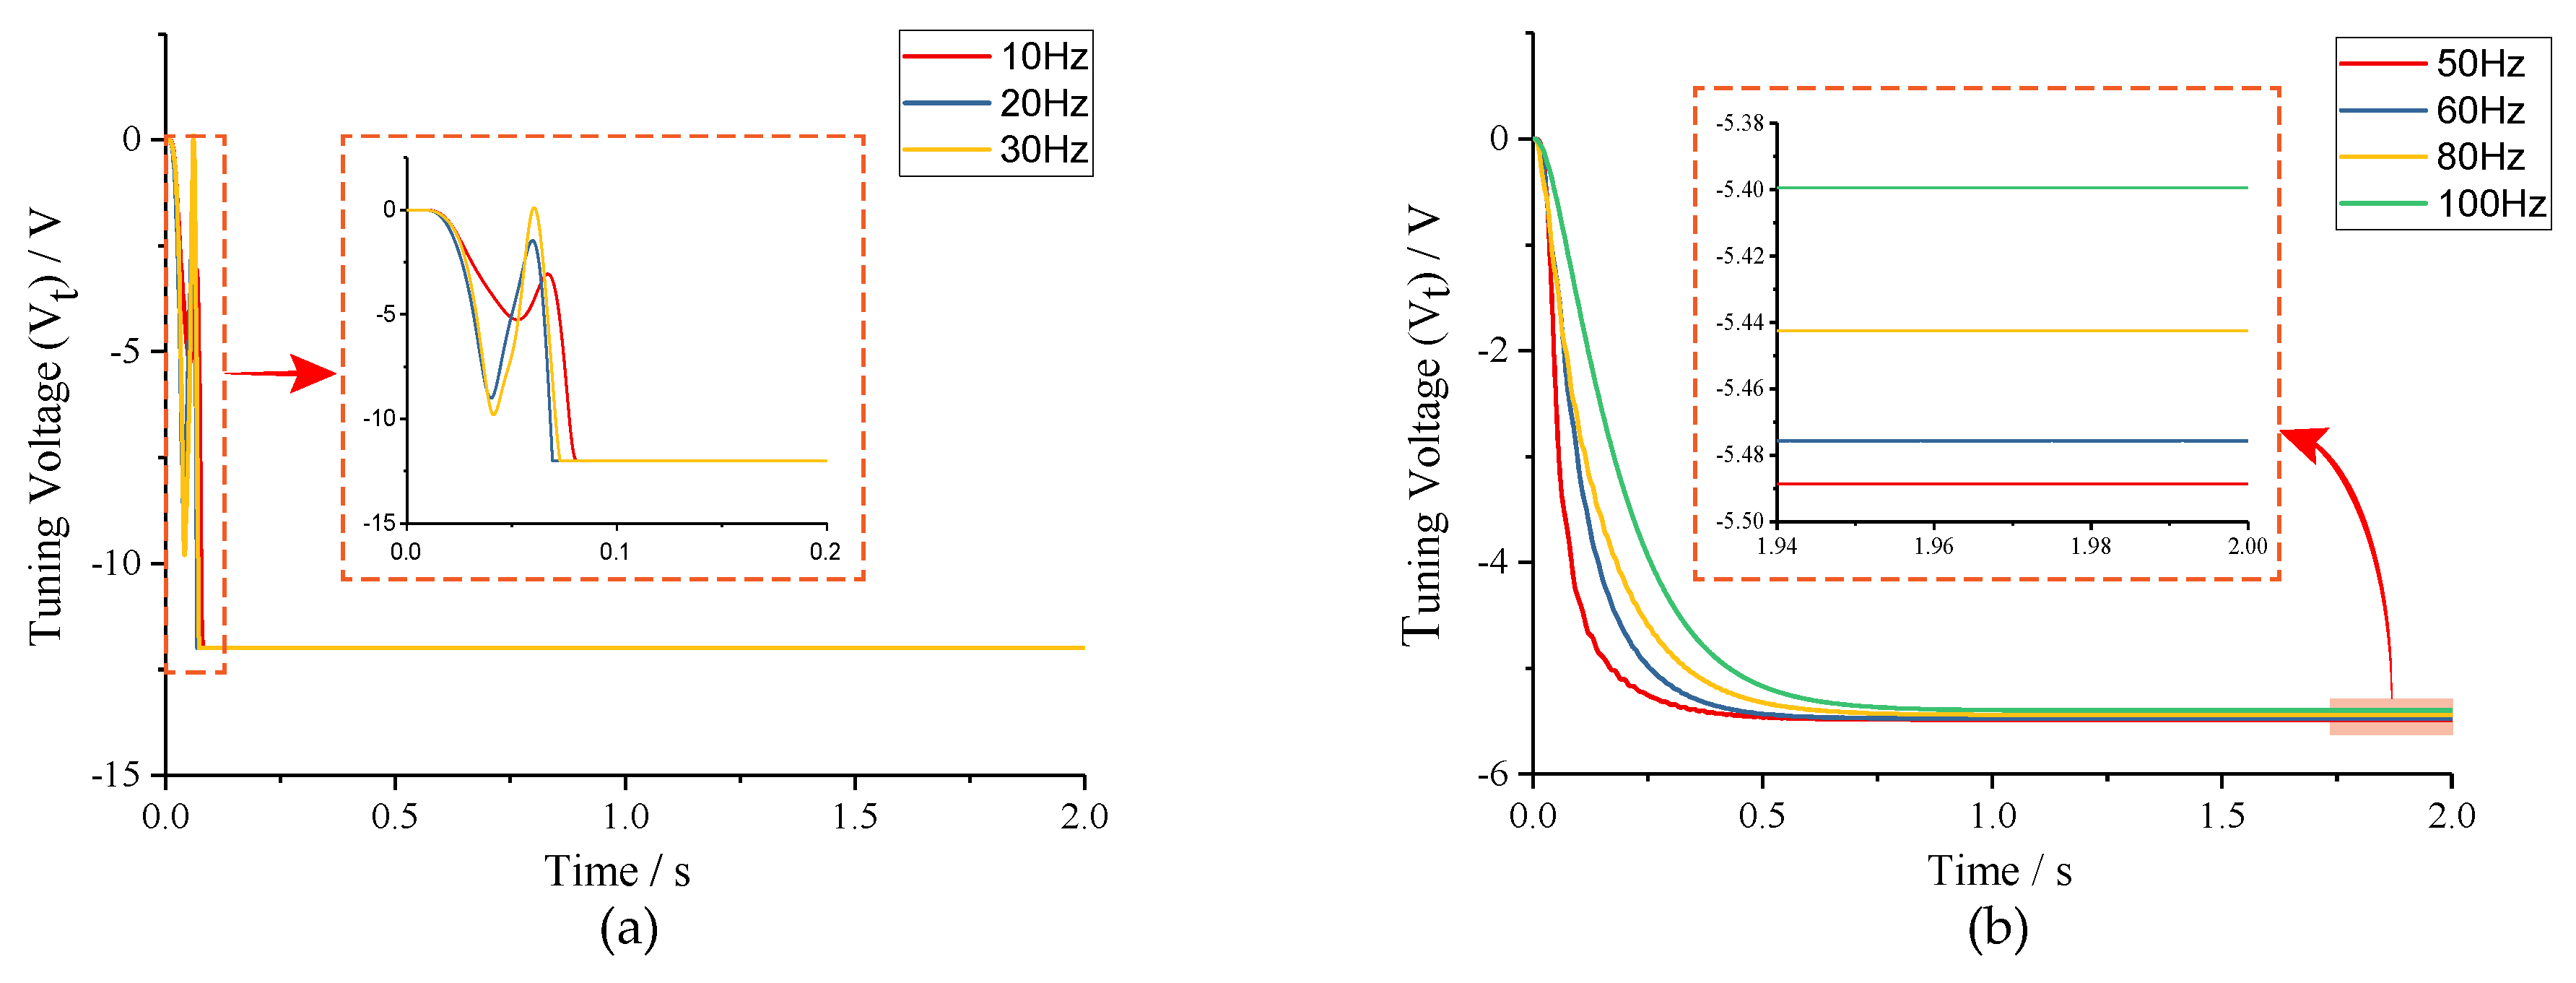
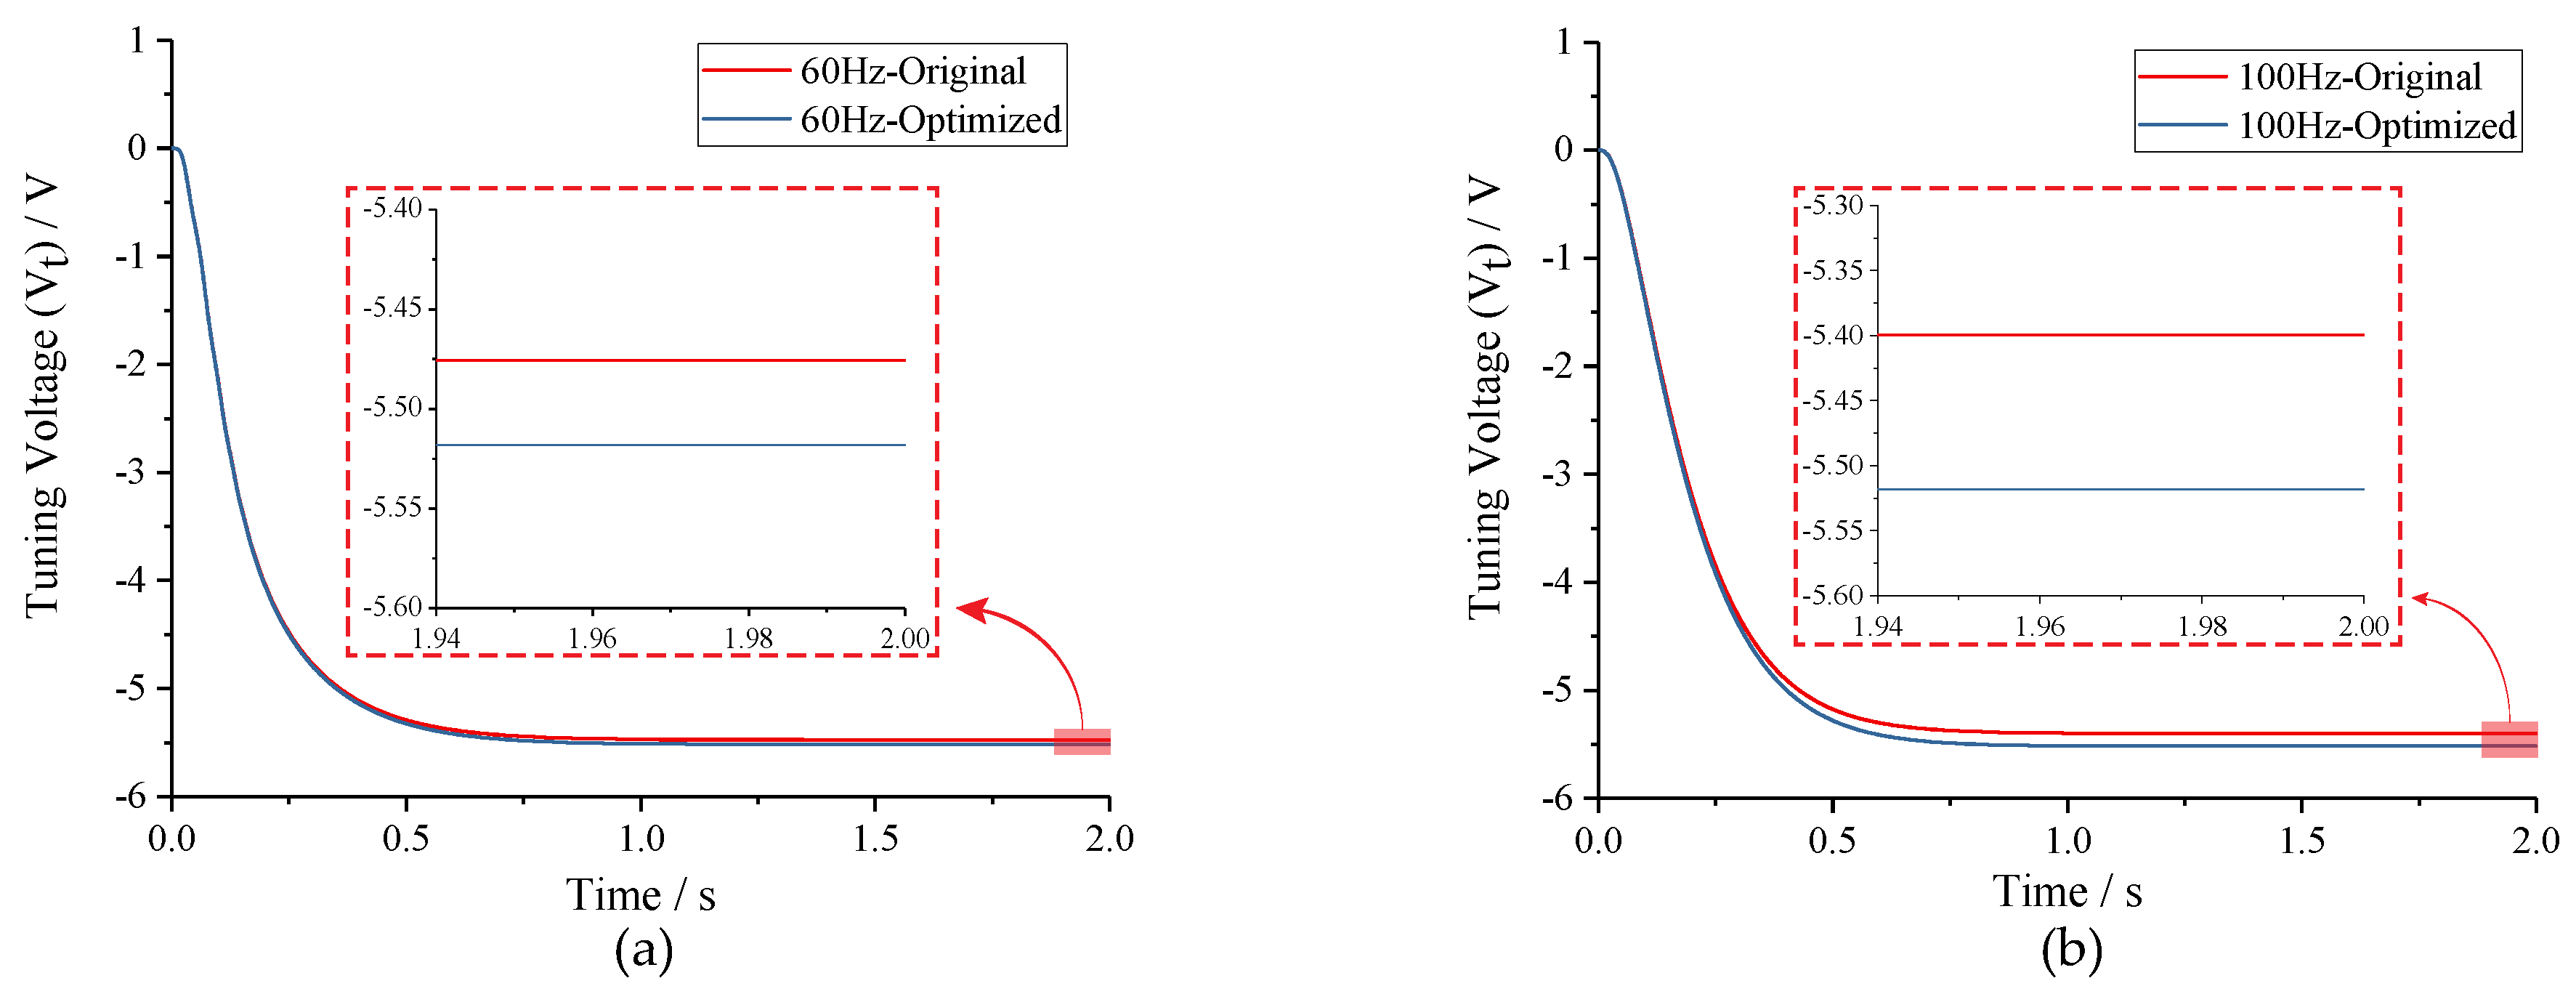
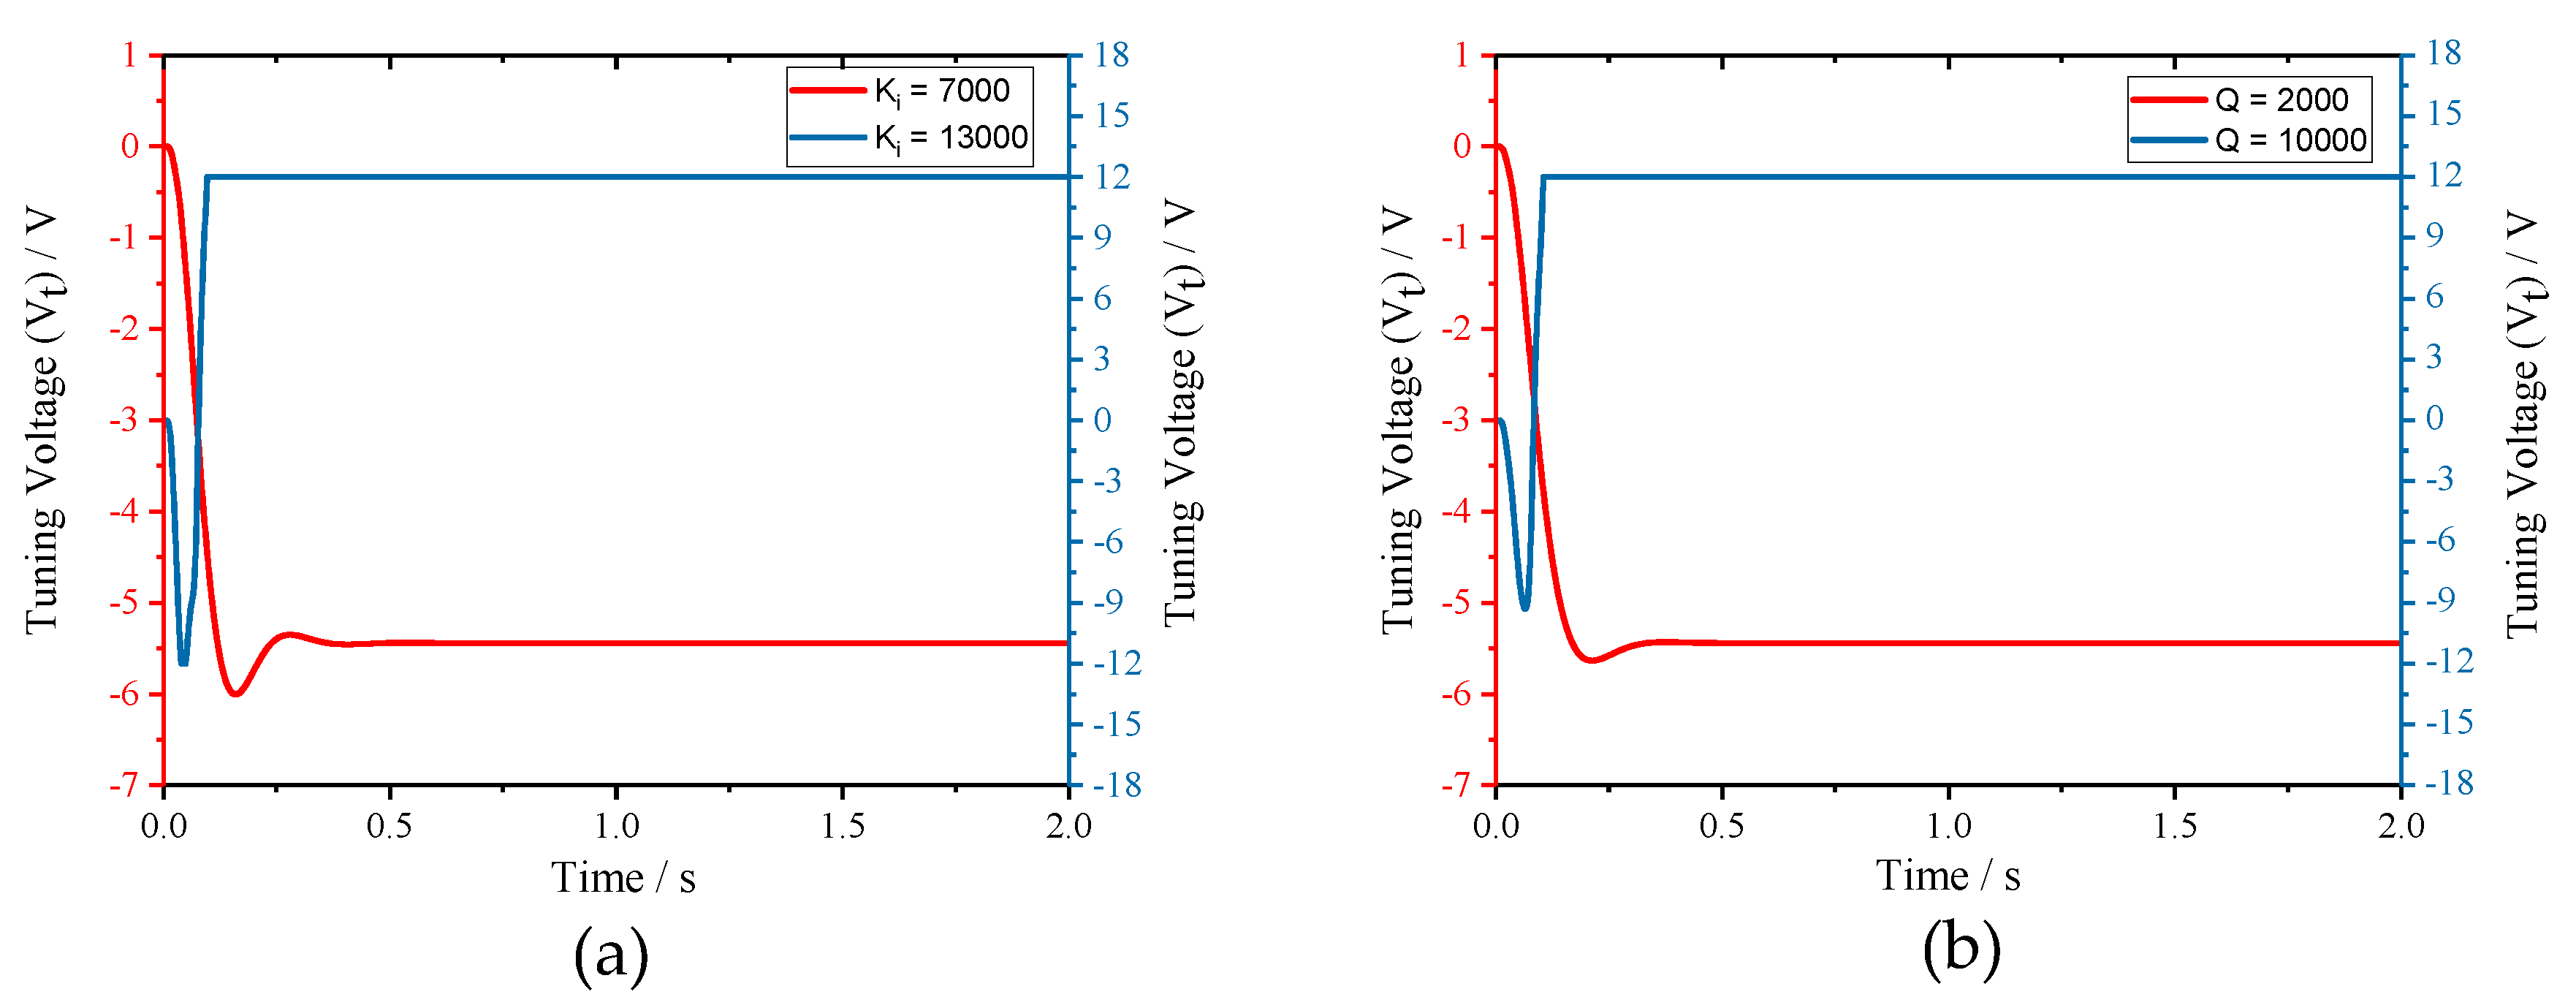
4. Simulation
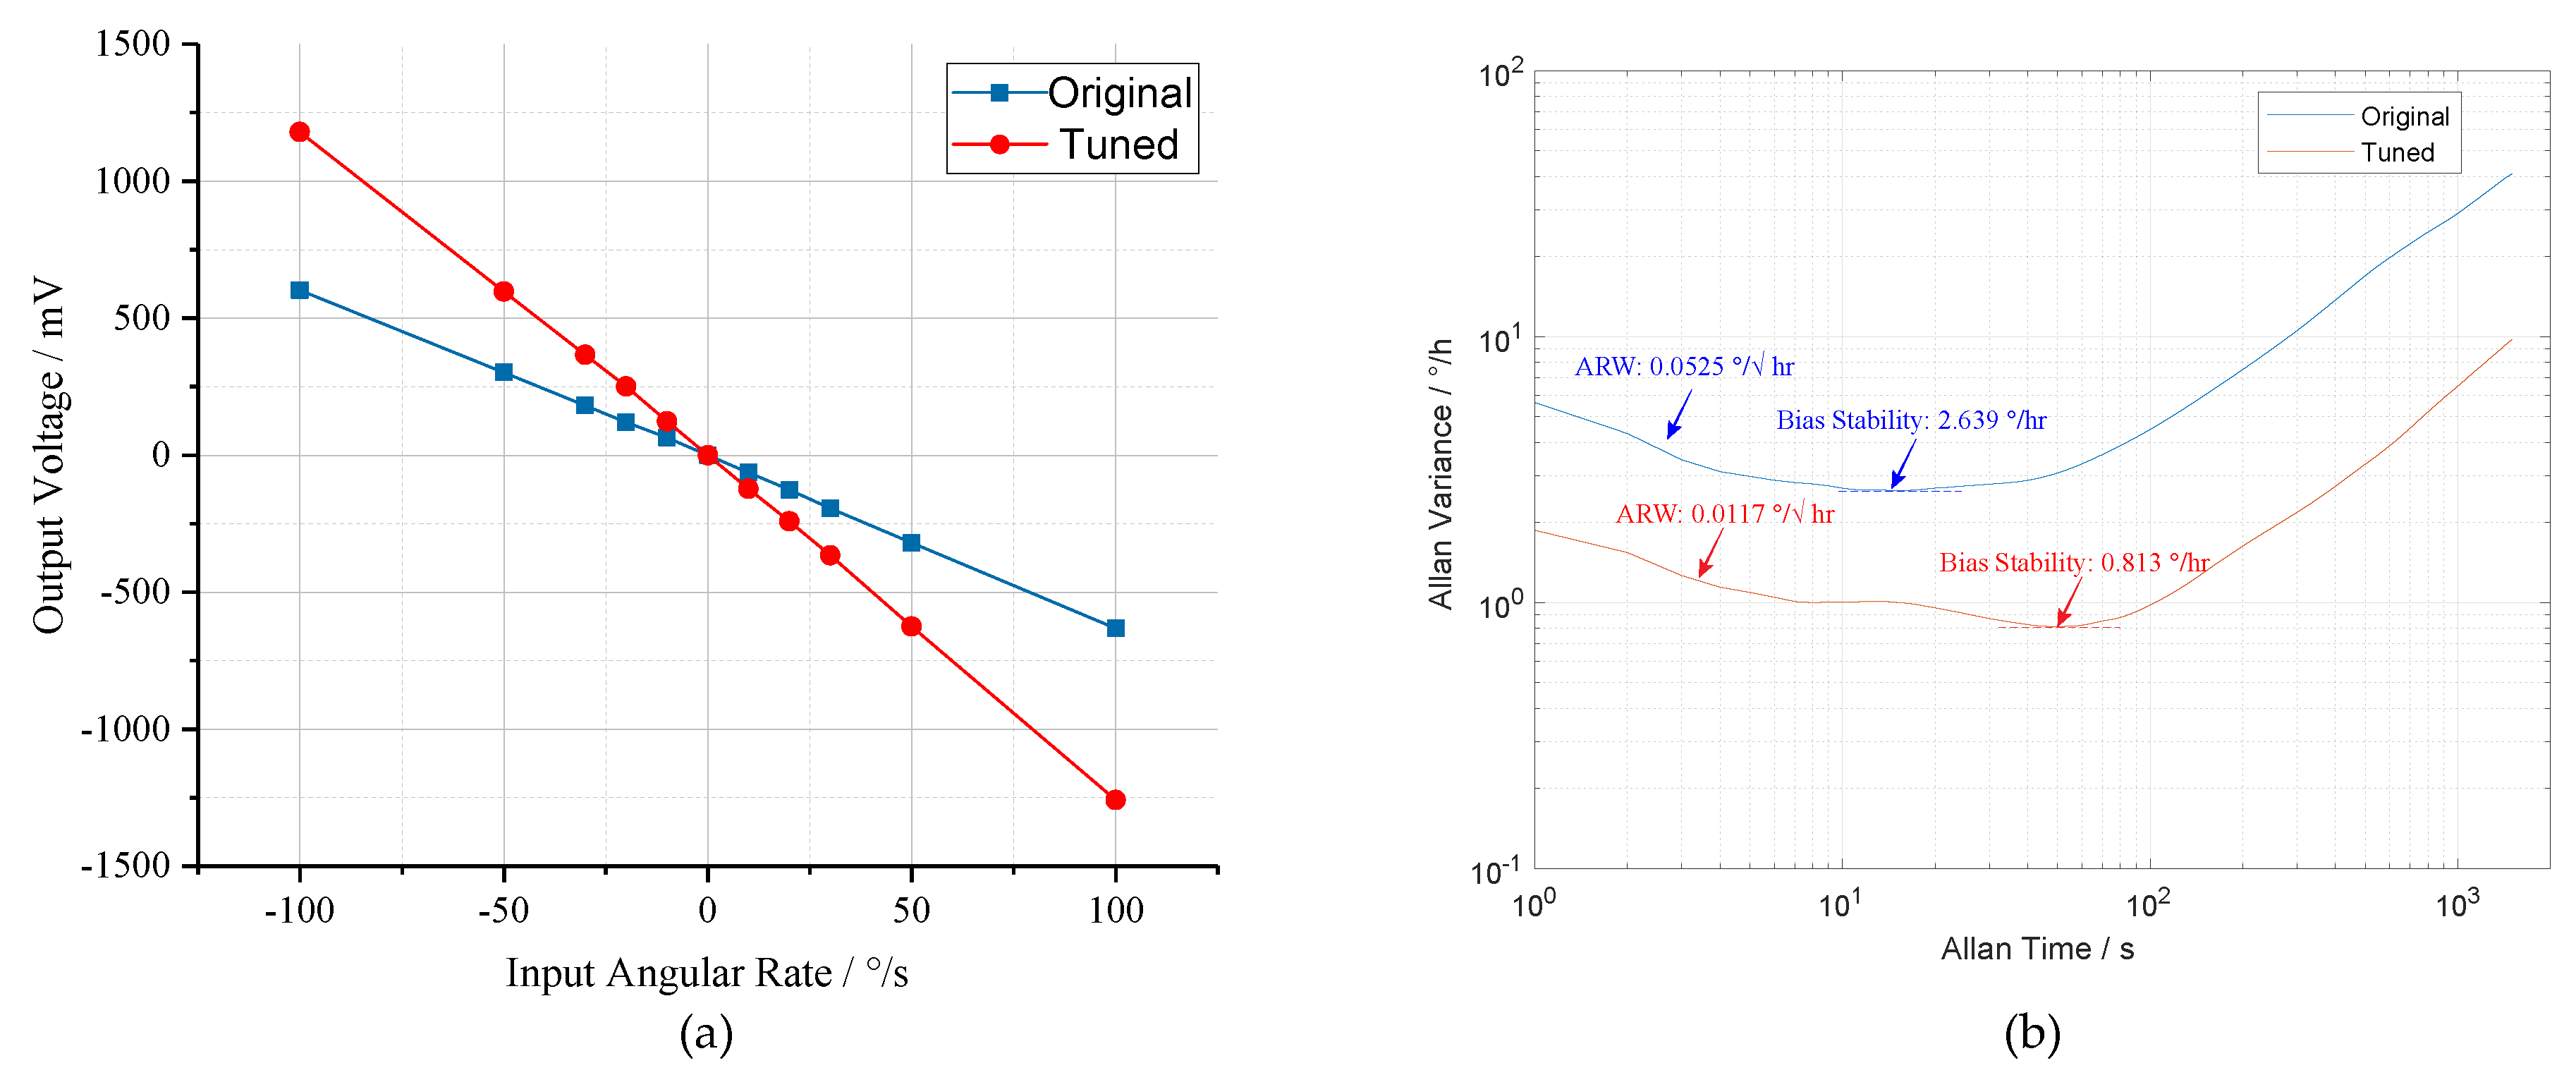
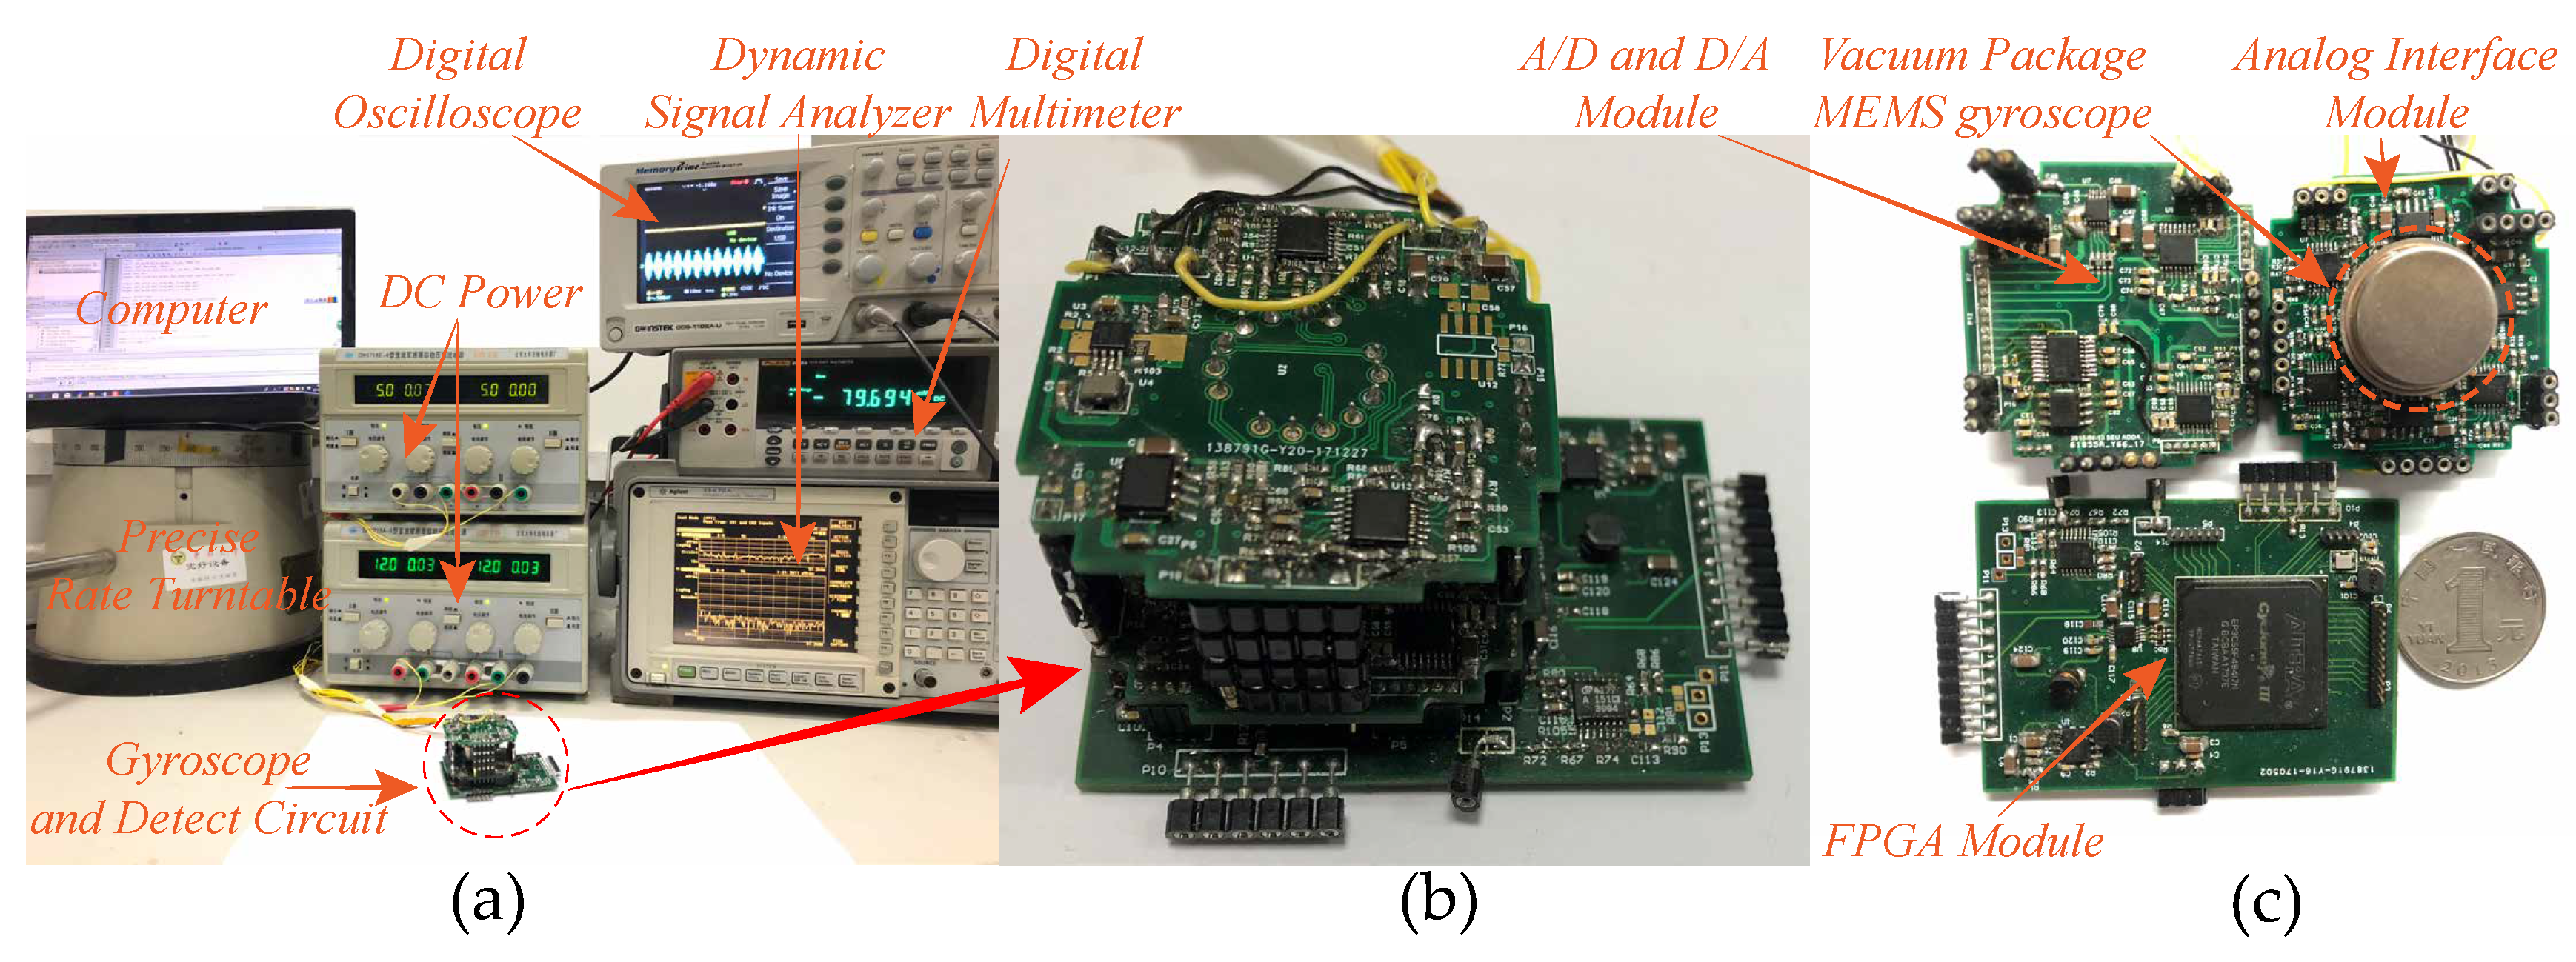
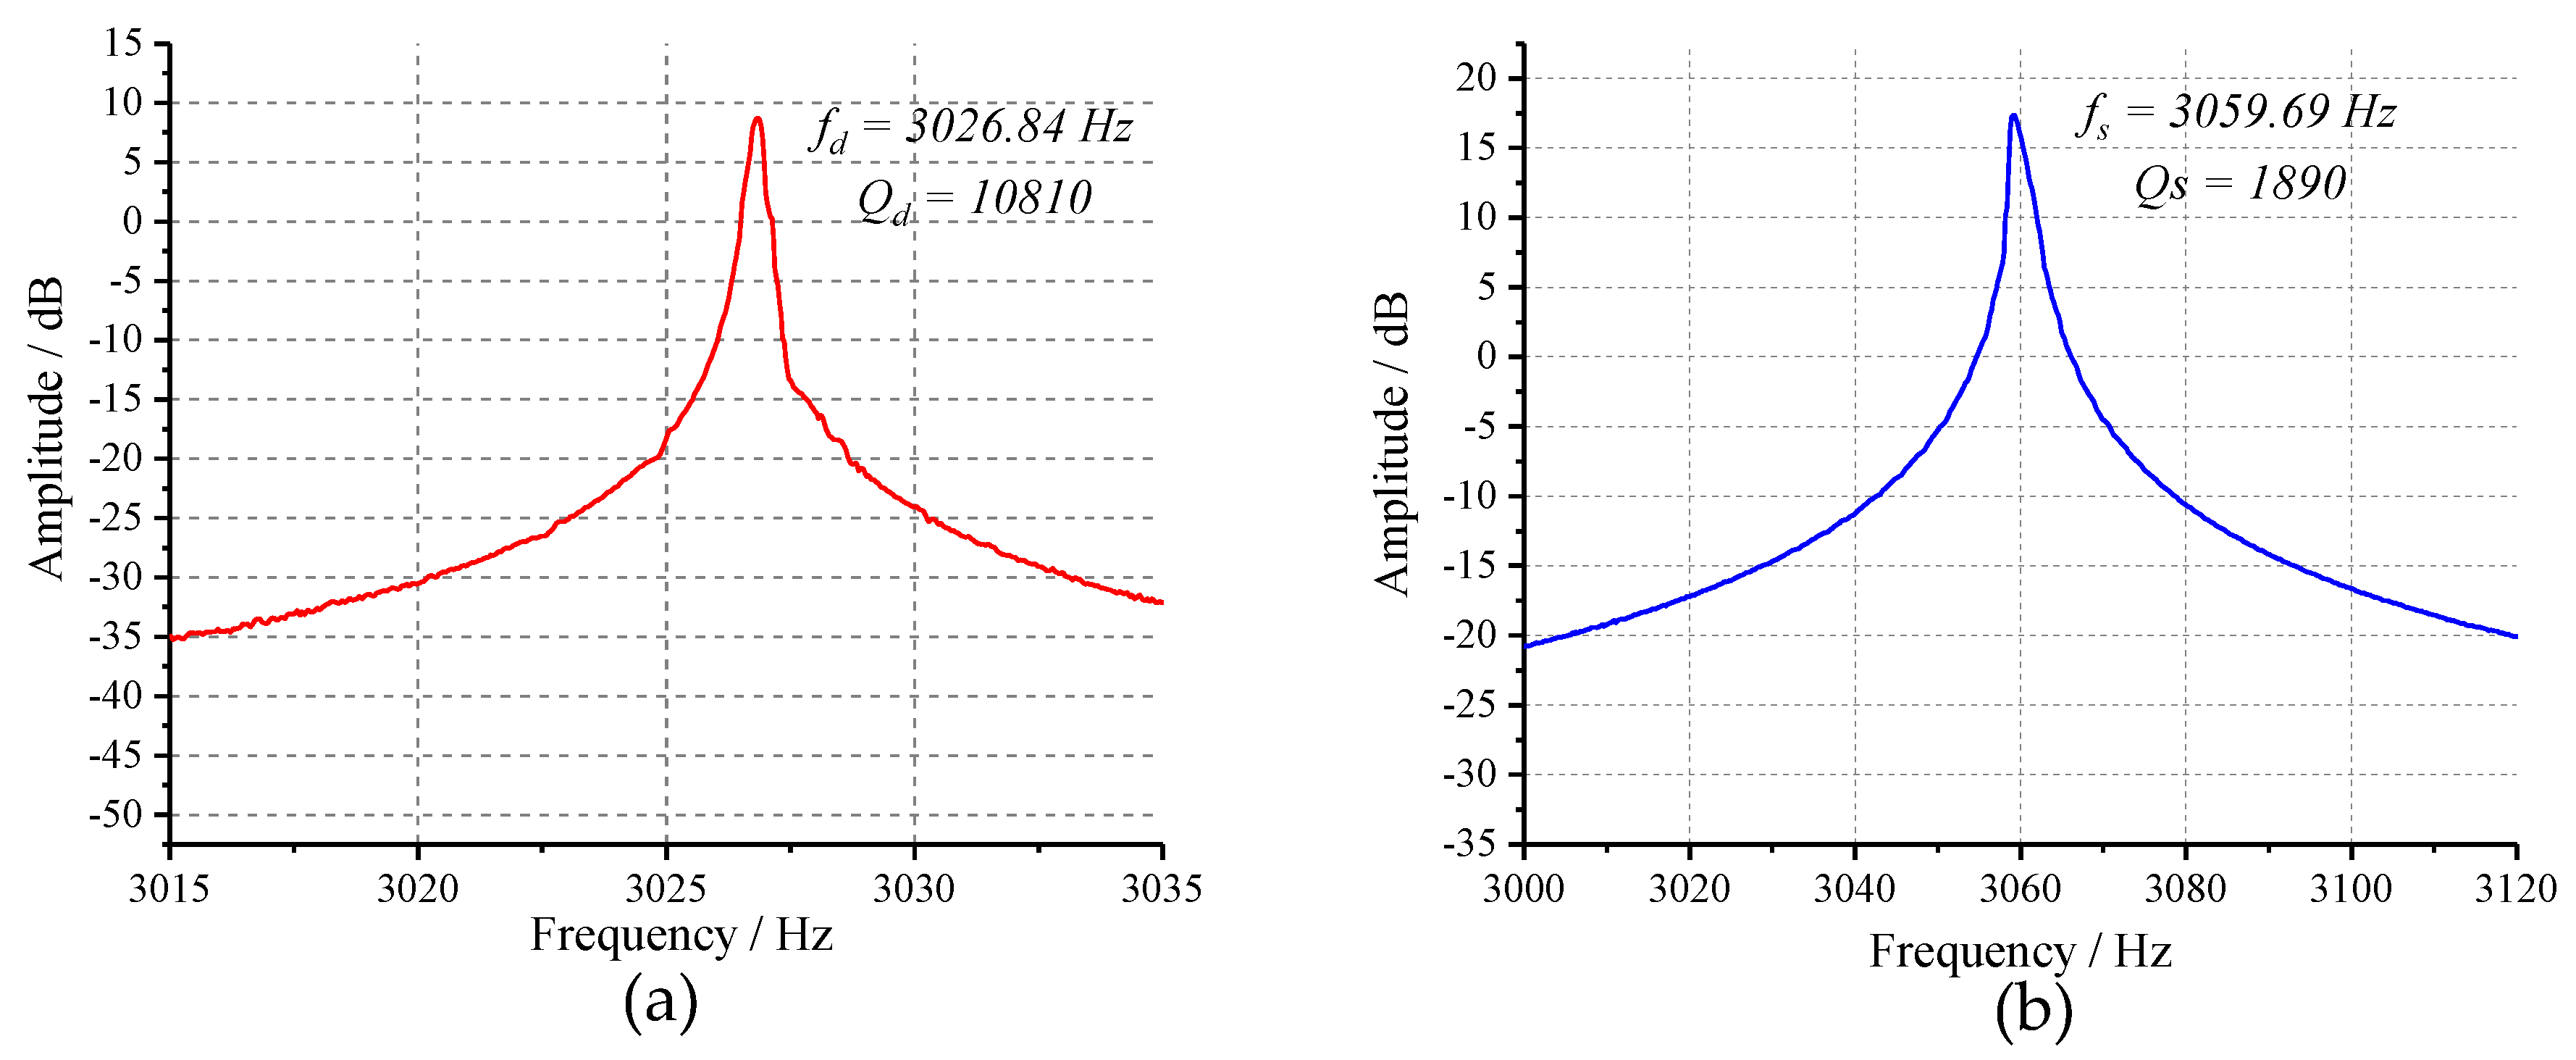
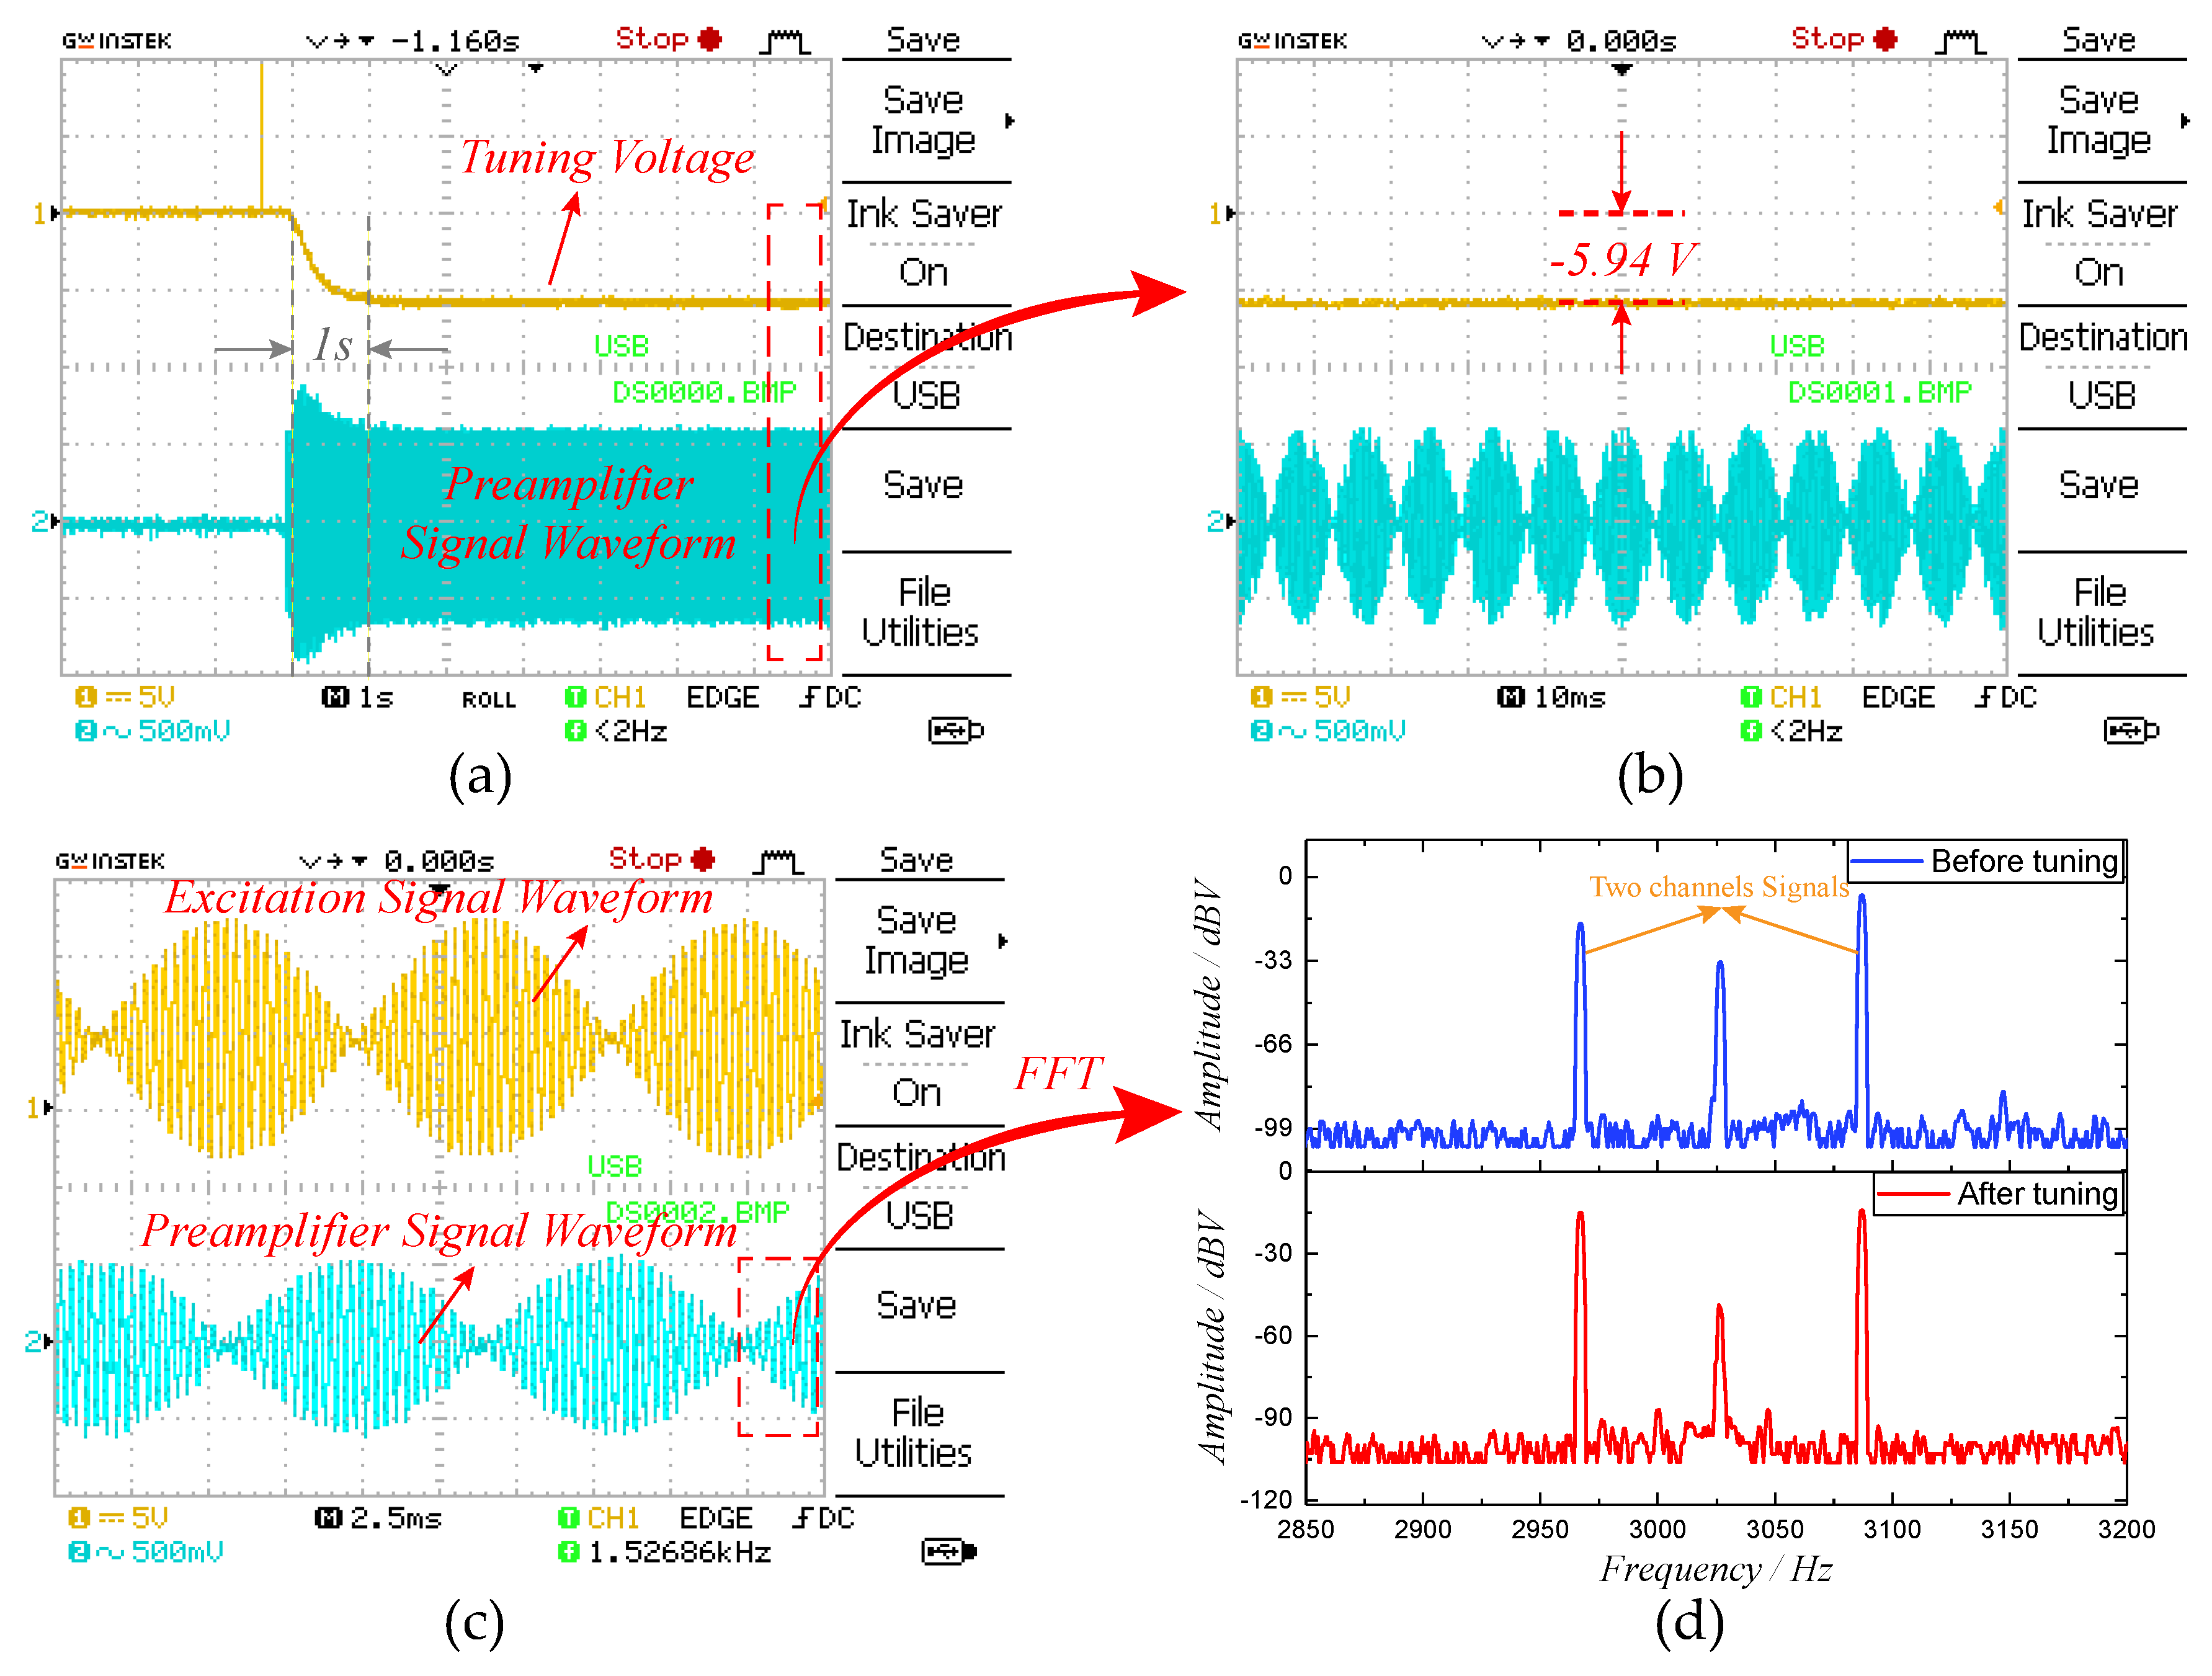
5. Experiment
6. Conclusions
Author Contributions
Funding
Conflicts of Interest
References
- Xia, D.; Yu, C.; Kong, L. The development of micromachined gyroscope structure and circuitry technology. Sensors 2014, 14, 1394–1473. [Google Scholar] [CrossRef] [PubMed]
- Liu, K.; Zhang, W.; Chen, W.; Li, K.; Dai, F.; Cui, F.; Wu, X.; Ma, G.; Xiao, Q. The development of micro-gyroscope technology. J. Micromech. Microeng. 2009, 19, 113001. [Google Scholar] [CrossRef]
- Passaro, V.; Cuccovillo, A.; Vaiani, L.; De Carlo, M.; Campanella, C.E. Gyroscope technology and applications: A review in the industrial perspective. Sensors 2017, 17, 2284. [Google Scholar] [CrossRef] [PubMed]
- Ho, C.Y.; Lee, F.Y.; Fang, W. Development of a CMOS-MEMS gyroscope using pure-oxide and symmetric metal-oxide stacking structures. In Proceedings of the 19th International Conference on Solid-State Sensors, Actuators and Microsystems (TRANSDUCERS), Kaohsiung, Taiwan, 18–22 June 2017; pp. 1128–1131. [Google Scholar]
- Cao, H.; Zhang, Y.; Han, Z.; Shao, X.; Gao, J.; Huang, K.; Shi, Y.; Tang, J.; Shen, C.; Liu, J. Pole-Zero Temperature Compensation Circuit Design and Experiment for Dual-Mass MEMS Gyroscope Bandwidth Expansion. IEEE/ASME Trans. Mechatron. 2019, 24, 677–688. [Google Scholar] [CrossRef]
- Zhanshe, G.; Fucheng, C.; Boyu, L.; Le, C.; Chao, L.; Ke, S. Research development of silicon MEMS gyroscopes: A review. Microsyst. Technol. 2015, 21, 2053–2066. [Google Scholar] [CrossRef]
- Prikhodko, I.P.; Nadig, S.; Gregory, J.A.; Clark, W.A.; Judy, M.W. Half-a-month stable 0.2 degree-per-hour mode-matched MEMS gyroscope. In Proceedings of the IEEE International Symposium on Inertial Sensors and Systems (INERTIAL), Kauai, HI, USA, 27–30 March 2017; pp. 1–4. [Google Scholar]
- Rahafrooz, A.; Serrano, D.E.; Jafri, I. Method and Apparatus for Electrostatic Mode-Alignment on Planar MEMS Gyroscopes. U.S. Patent 15/169,033, 25 September 2018. [Google Scholar]
- Sonmezoglu, S.; Alper, S.E.; Akin, T. An automatically mode-matched MEMS gyroscope with wide and tunable bandwidth. J. Microelectromech. Syst. 2014, 23, 284–297. [Google Scholar] [CrossRef]
- Xiao, D.; Zhou, X.; Li, Q.; Hou, Z.; Xi, X.; Wu, Y.; Wu, X. Design of a disk resonator gyroscope with high mechanical sensitivity by optimizing the ring thickness distribution. J. Microelectromech. Syst. 2016, 25, 606–616. [Google Scholar] [CrossRef]
- Sharma, A.; Zaman, M.F.; Ayazi, F. A Sub-0.2∘/hr Bias Drift Micromechanical Silicon Gyroscope With Automatic CMOS Mode-Matching. IEEE J. Solid-State Circuits 2009, 44, 1593–1608. [Google Scholar] [CrossRef]
- Gando, R.; Kubo, H.; Masunishi, K.; Tomizawa, Y.; Ogawa, E.; Maeda, S.; Hatakeyama, Y.; Itakura, T.; Ikehashi, T. A catch-and-release drive MEMS gyroscope with enhanced sensitivity by mode-matching. In Proceedings of the IEEE International Symposium on Inertial Sensors and Systems (INERTIAL), Kauai, HI, USA, 27–30 March 2017; pp. 50–53. [Google Scholar]
- Yang, C.; Li, H. Digital control system for the MEMS tuning fork gyroscope based on synchronous integral demodulator. IEEE Sens. J. 2015, 15, 5755–5764. [Google Scholar] [CrossRef]
- Joachim, D.; Lin, L. Characterization of selective polysilicon deposition for MEMS resonator tuning. J. Microelectromech. Syst. 2003, 12, 193–200. [Google Scholar] [CrossRef]
- Remtema, T.; Lin, L. Active frequency tuning for micro resonators by localized thermal stressing effects. Sens. Actuators Phys. 2001, 91, 326–332. [Google Scholar] [CrossRef]
- Wang, K.; Wong, A.C.; Hsu, W.T.; Nguyen, C.C. Frequency trimming and Q-factor enhancement of micromechanical resonators via localized filament annealing. In Proceedings of the International Solid State Sensors and Actuators Conference (Transducers’ 97), Chicago, IL, USA, 19 June 1997; Volume 1, pp. 109–112. [Google Scholar]
- Jia, J.; Ding, X.; Gao, Y.; Li, H. Automatic Frequency Tuning Technology for Dual-Mass MEMS Gyroscope Based on a Quadrature Modulation Signal. Micromachines 2018, 9, 511. [Google Scholar] [CrossRef] [PubMed]
- Gallacher, B.J.; Hedley, J.; Burdess, J.S.; Harris, A.J.; Rickard, A.; King, D.O. Electrostatic correction of structural imperfections present in a microring gyroscope. J. Microelectromech. Syst. 2005, 14, 221–234. [Google Scholar] [CrossRef]
- Yesil, F.; Alper, S.; Akin, T. An automatic mode matching system for a high Q-factor MEMS gyroscope using a decoupled perturbation signal. In Proceedings of the Transducers-2015 18th International Conference on Solid-State Sensors, Actuators and Microsystems (TRANSDUCERS), Anchorage, AK, USA, 21–25 June 2015; pp. 1148–1151. [Google Scholar]
- Kim, D.J.; M’Closkey, R.T. A systematic method for tuning the dynamics of electrostatically actuated vibratory gyros. IEEE Trans. Control. Syst. Technol. 2006, 14, 69–81. [Google Scholar]
- Keymeulen, D.; Fink, W.; Ferguson, M.I.; Peay, C.; Oks, B.; Terrile, R.; Yee, K. Evolutionary Computation Applied to the Tuning of MEMS Gyroscopes; Jet Propulsion Laboratory, National Aeronautics and Space Administration: Pasadena, CA, USA, 2005. [Google Scholar]
- Keymeulen, D.; Ferguson, M.I.; Breuer, L.; Peay, C.; Oks, B.; Kim, D.; MacDonald, E.; Foor, D.; Terrile, R.; Yee, K.; et al. Tuning of MEMS gyroscope using evolutionary algorithm and “switched drive-angle” method. In Proceedings of the IEEE Aerospace Conference, Big Sky, MT, USA, 4–11 March 2006; pp. 1–8. [Google Scholar]
- Sung, S.; Sung, W.T.; Kim, C.; Yun, S.; Lee, Y.J. On the mode-matched control of MEMS vibratory gyroscope via phase-domain analysis and design. IEEE/ASME Trans. Mechatron. 2009, 14, 446–455. [Google Scholar] [CrossRef]
- Chang, B.S.; Sung, W.T.; Lee, J.G.; Lee, K.Y.; Sung, S. Automatic mode matching control loop design and its application to the mode matched MEMS gyroscope. In Proceedings of the IEEE International Conference on Vehicular Electronics and Safety, Beijing, China, 13–15 December 2007; pp. 1–6. [Google Scholar]
- He, C.; Zhao, Q.; Liu, D.; Dong, L.; Yang, Z.; Yan, G. An automatic real-time mode-matching MEMS gyroscope with fuzzy and neural network control. In Proceedings of the Transducers & Eurosensors XXVII: The 17th International Conference on Solid-State Sensors, Actuators and Microsystems (TRANSDUCERS & EUROSENSORS XXVII), Barcelona, Spain, 16–20 June 2013; pp. 54–57. [Google Scholar]
- He, C.; Zhao, Q.; Huang, Q.; Liu, D.; Yang, Z.; Zhang, D.; Yan, G. A MEMS vibratory gyroscope with real-time mode-matching and robust control for the sense mode. IEEE Sens. J. 2015, 15, 2069–2077. [Google Scholar] [CrossRef]
- Ezekwe, C.D.; Boser, B.E. A Mode-Matching ΣΔ Closed-Loop Vibratory Gyroscope Readout Interface with a 0.004∘/s/√Hz Noise Floor Over a 50 Hz Band. IEEE J. Solid-State Circuits 2008, 43, 3039–3048. [Google Scholar] [CrossRef]
- Marx, M.; Cuignet, X.; Nessler, S.; De Dorigo, D.; Manoli, Y. An Automatic MEMS Gyroscope Mode Matching Circuit Based on Noise Observation. IEEE Trans. Circuits Syst. II Exp. Briefs 2019, 66, 743–747. [Google Scholar] [CrossRef]
- Yang, B.; Wang, X.; Deng, Y.; Hu, D. Mechanical coupling error suppression technology for an improved decoupled dual-mass micro-gyroscope. Sensors 2016, 16, 503. [Google Scholar] [CrossRef] [PubMed]
- Wu, L.; Yang, B.; Wang, G. Design of an Automatic Mode-matching System for MEMS Gyroscope. In Proceedings of the Seventh International Conference on Instrumentation & Measurement, Computer, Communication and Control, IMCCC, Changchun, China, 22–24 September 2019; pp. 47–51. [Google Scholar]
- Pedicini, C.; Iannelli, L.; Vasca, F. The averaging method for control design and stability analysis of practical switched systems. In Proceedings of the IEEE International Conference on Control Applications, Dubrovnik, Croatia, 3–5 October 2012; pp. 1285–1290. [Google Scholar]


| Parameter | Value | Unit |
|---|---|---|
| Drive mode resonant frequency (w) | 3345 × 2 | rad/s |
| Drive mode quality factor (Q) | 10,000 | |
| Sense mode resonant frequency (w) | 3380 × 2 | rad/s |
| Sense mode quality factor (Q) | 2000 | |
| Sense effective mass (m) | 9.02 × 10 | Kg |
| Stiffness of sense structure (k) | 242.30 | N/m |
| Structure thickness (h) | 80 | μm |
| Number of tuning combs (n) | 92 | |
| Tuning comb length (l) | 180 | μm |
| Tuning comb gap (e) | 4.4 | μm |
| Vacuum permittivity () | 8.854 × 10 | F/m |
| Tuning comb mechanical parameter (b) | 3.0518 × 10 | N/(mV) |
| Frequency Split (Hz) | Analytic Tuning Voltage (V) | Tuning Error (Hz) |
|---|---|---|
| 50 | 5.489 | 0.369 |
| 60 | 5.476 | 0.534 |
| 80 | 5.442 | 0.962 |
| 100 | 5.399 | 1.500 |
| Frequency Split (f) (Hz) | Tuning Voltage (V) | Tuning Error (Hz) |
|---|---|---|
| 50 | −5.489 | 0.369 |
| 60 | −5.476 | 0.534 |
| 80 | −5.442 | 0.975 |
| 100 | −5.399 | 1.488 |
© 2019 by the authors. Licensee MDPI, Basel, Switzerland. This article is an open access article distributed under the terms and conditions of the Creative Commons Attribution (CC BY) license (http://creativecommons.org/licenses/by/4.0/).
Share and Cite
Li, C.; Yang, B.; Guo, X.; Wu, L. A Digital Calibration Technique of MEMS Gyroscope for Closed-Loop Mode-Matching Control. Micromachines 2019, 10, 496. https://doi.org/10.3390/mi10080496
Li C, Yang B, Guo X, Wu L. A Digital Calibration Technique of MEMS Gyroscope for Closed-Loop Mode-Matching Control. Micromachines. 2019; 10(8):496. https://doi.org/10.3390/mi10080496
Chicago/Turabian StyleLi, Cheng, Bo Yang, Xin Guo, and Lei Wu. 2019. "A Digital Calibration Technique of MEMS Gyroscope for Closed-Loop Mode-Matching Control" Micromachines 10, no. 8: 496. https://doi.org/10.3390/mi10080496
APA StyleLi, C., Yang, B., Guo, X., & Wu, L. (2019). A Digital Calibration Technique of MEMS Gyroscope for Closed-Loop Mode-Matching Control. Micromachines, 10(8), 496. https://doi.org/10.3390/mi10080496