2-Step Drop Impact Analysis of a Miniature Mobile Haptic Actuator Considering High Strain Rate and Damping Effects


Abstract
:1. Introduction
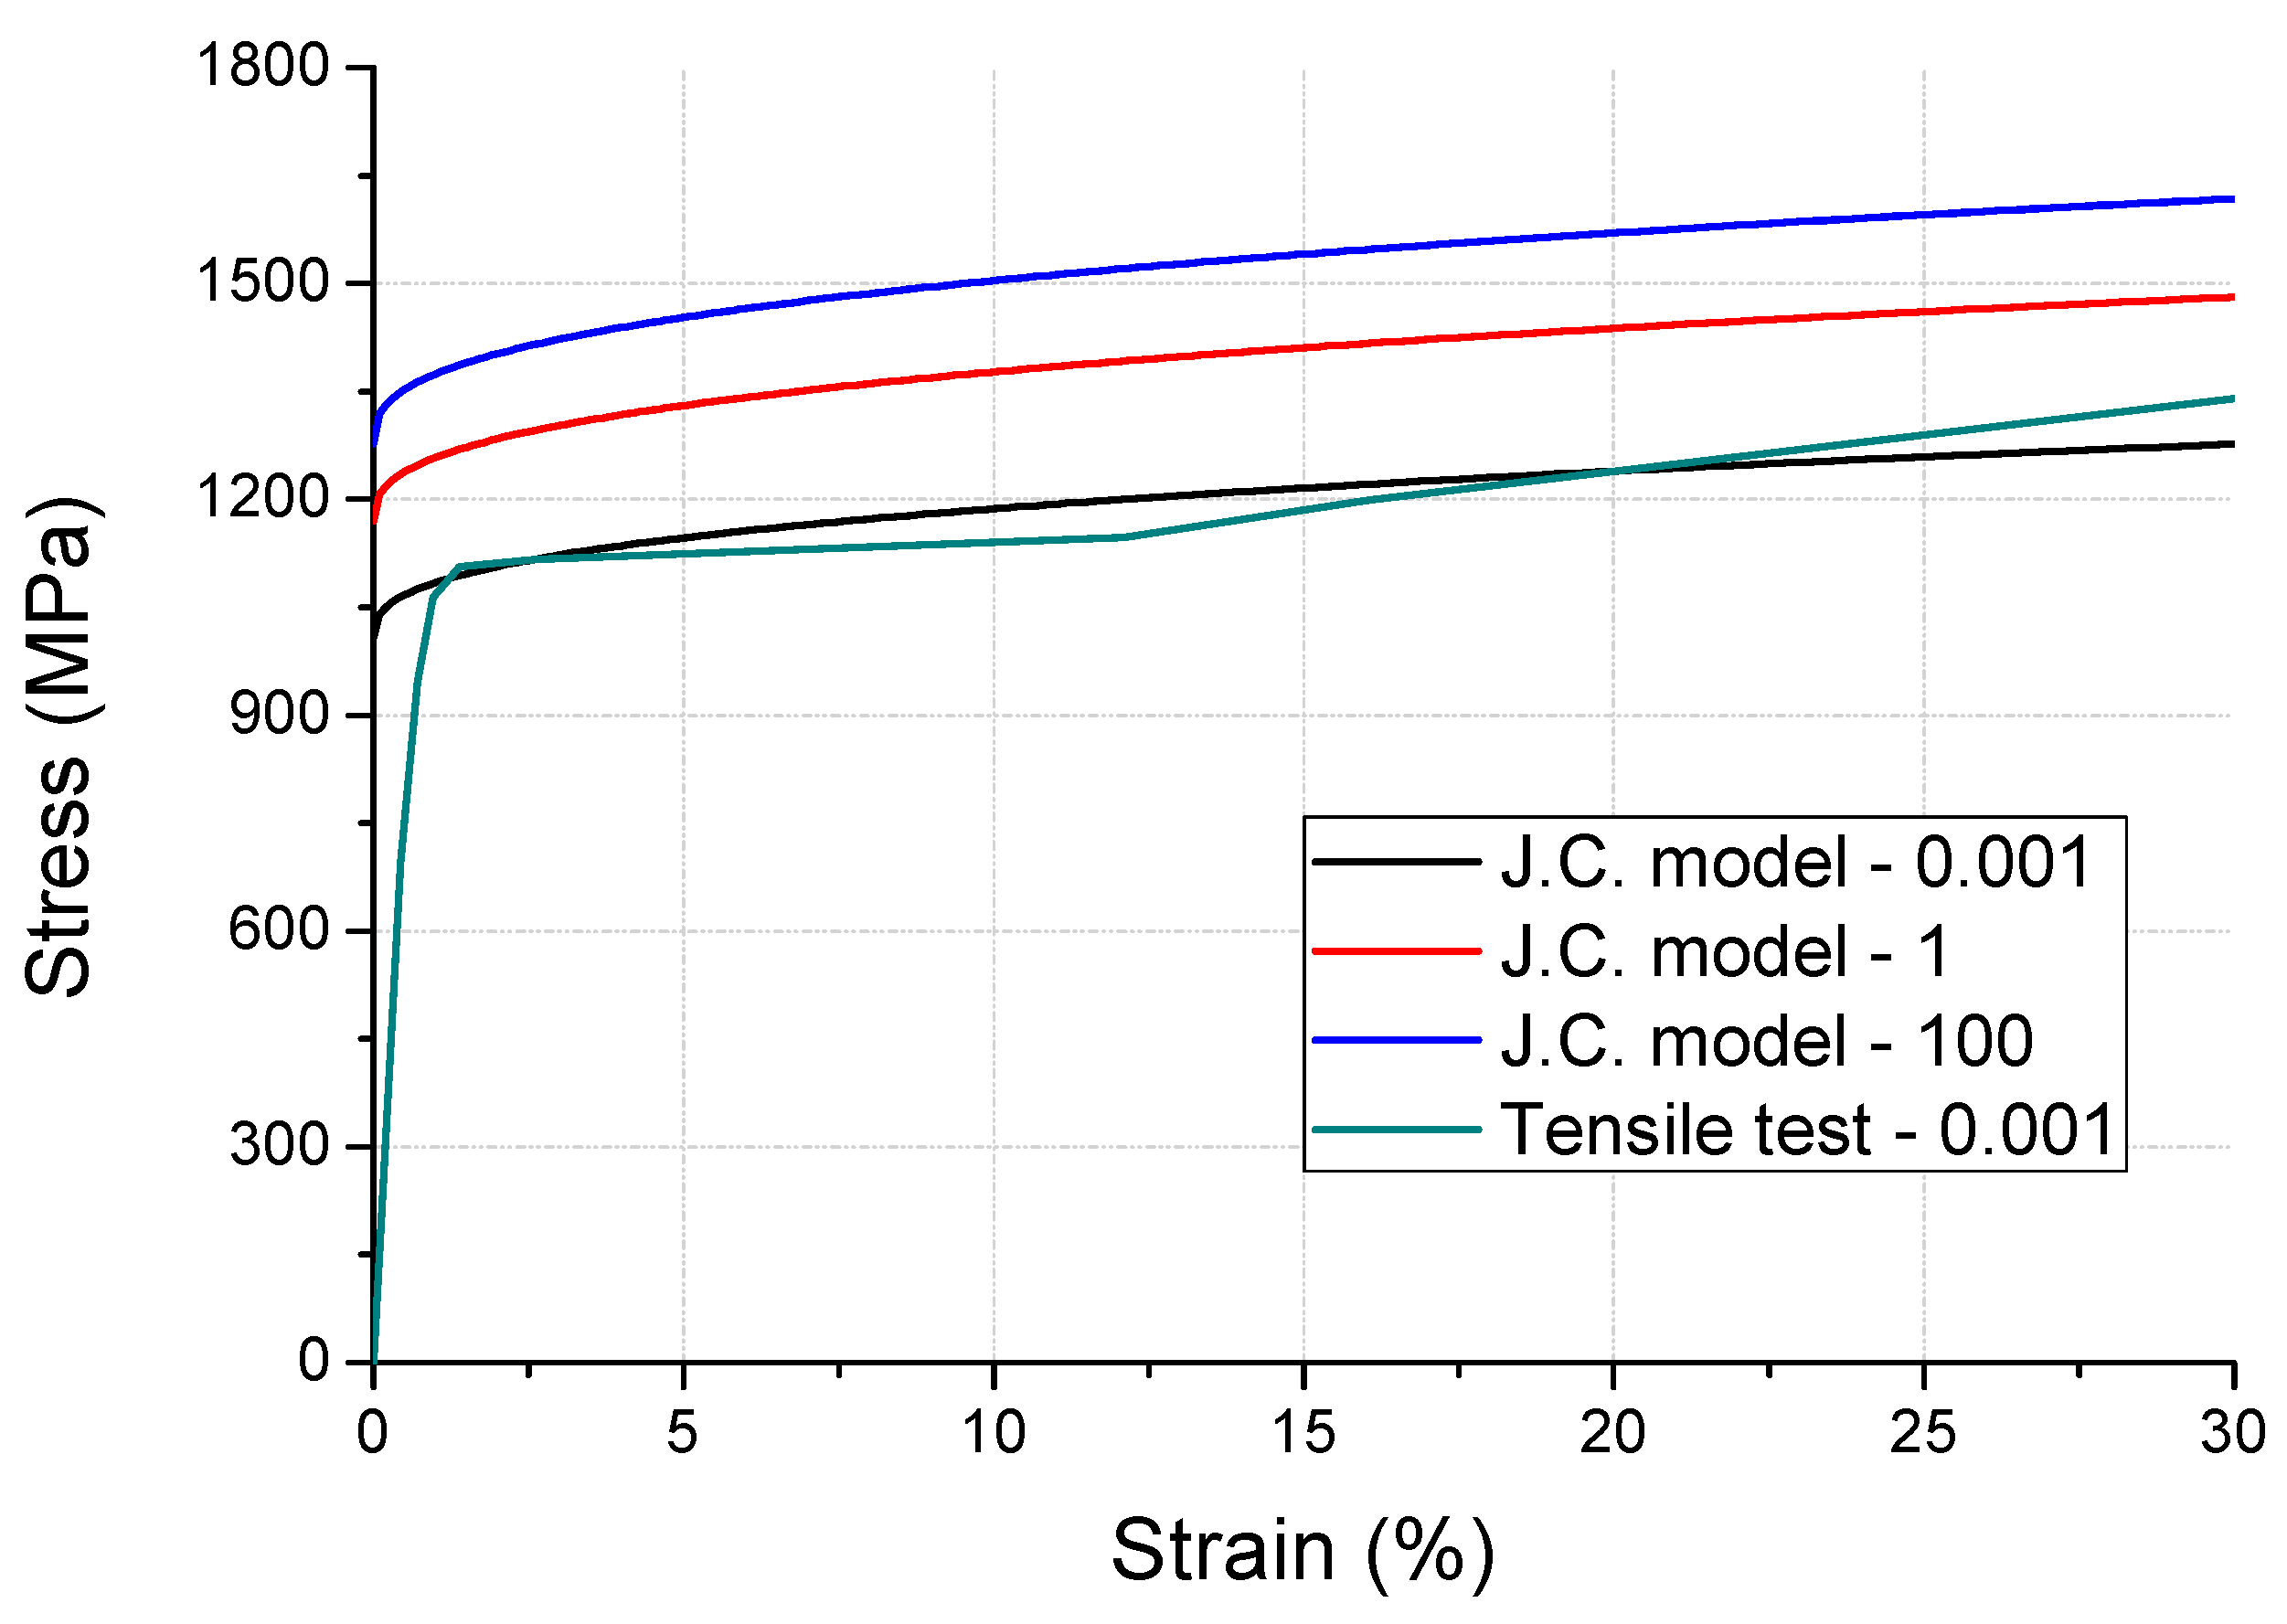
2. Material Modeling
2.1. Haptic Spring
2.2. Other Components
3. 2-Step Analysis Modeling
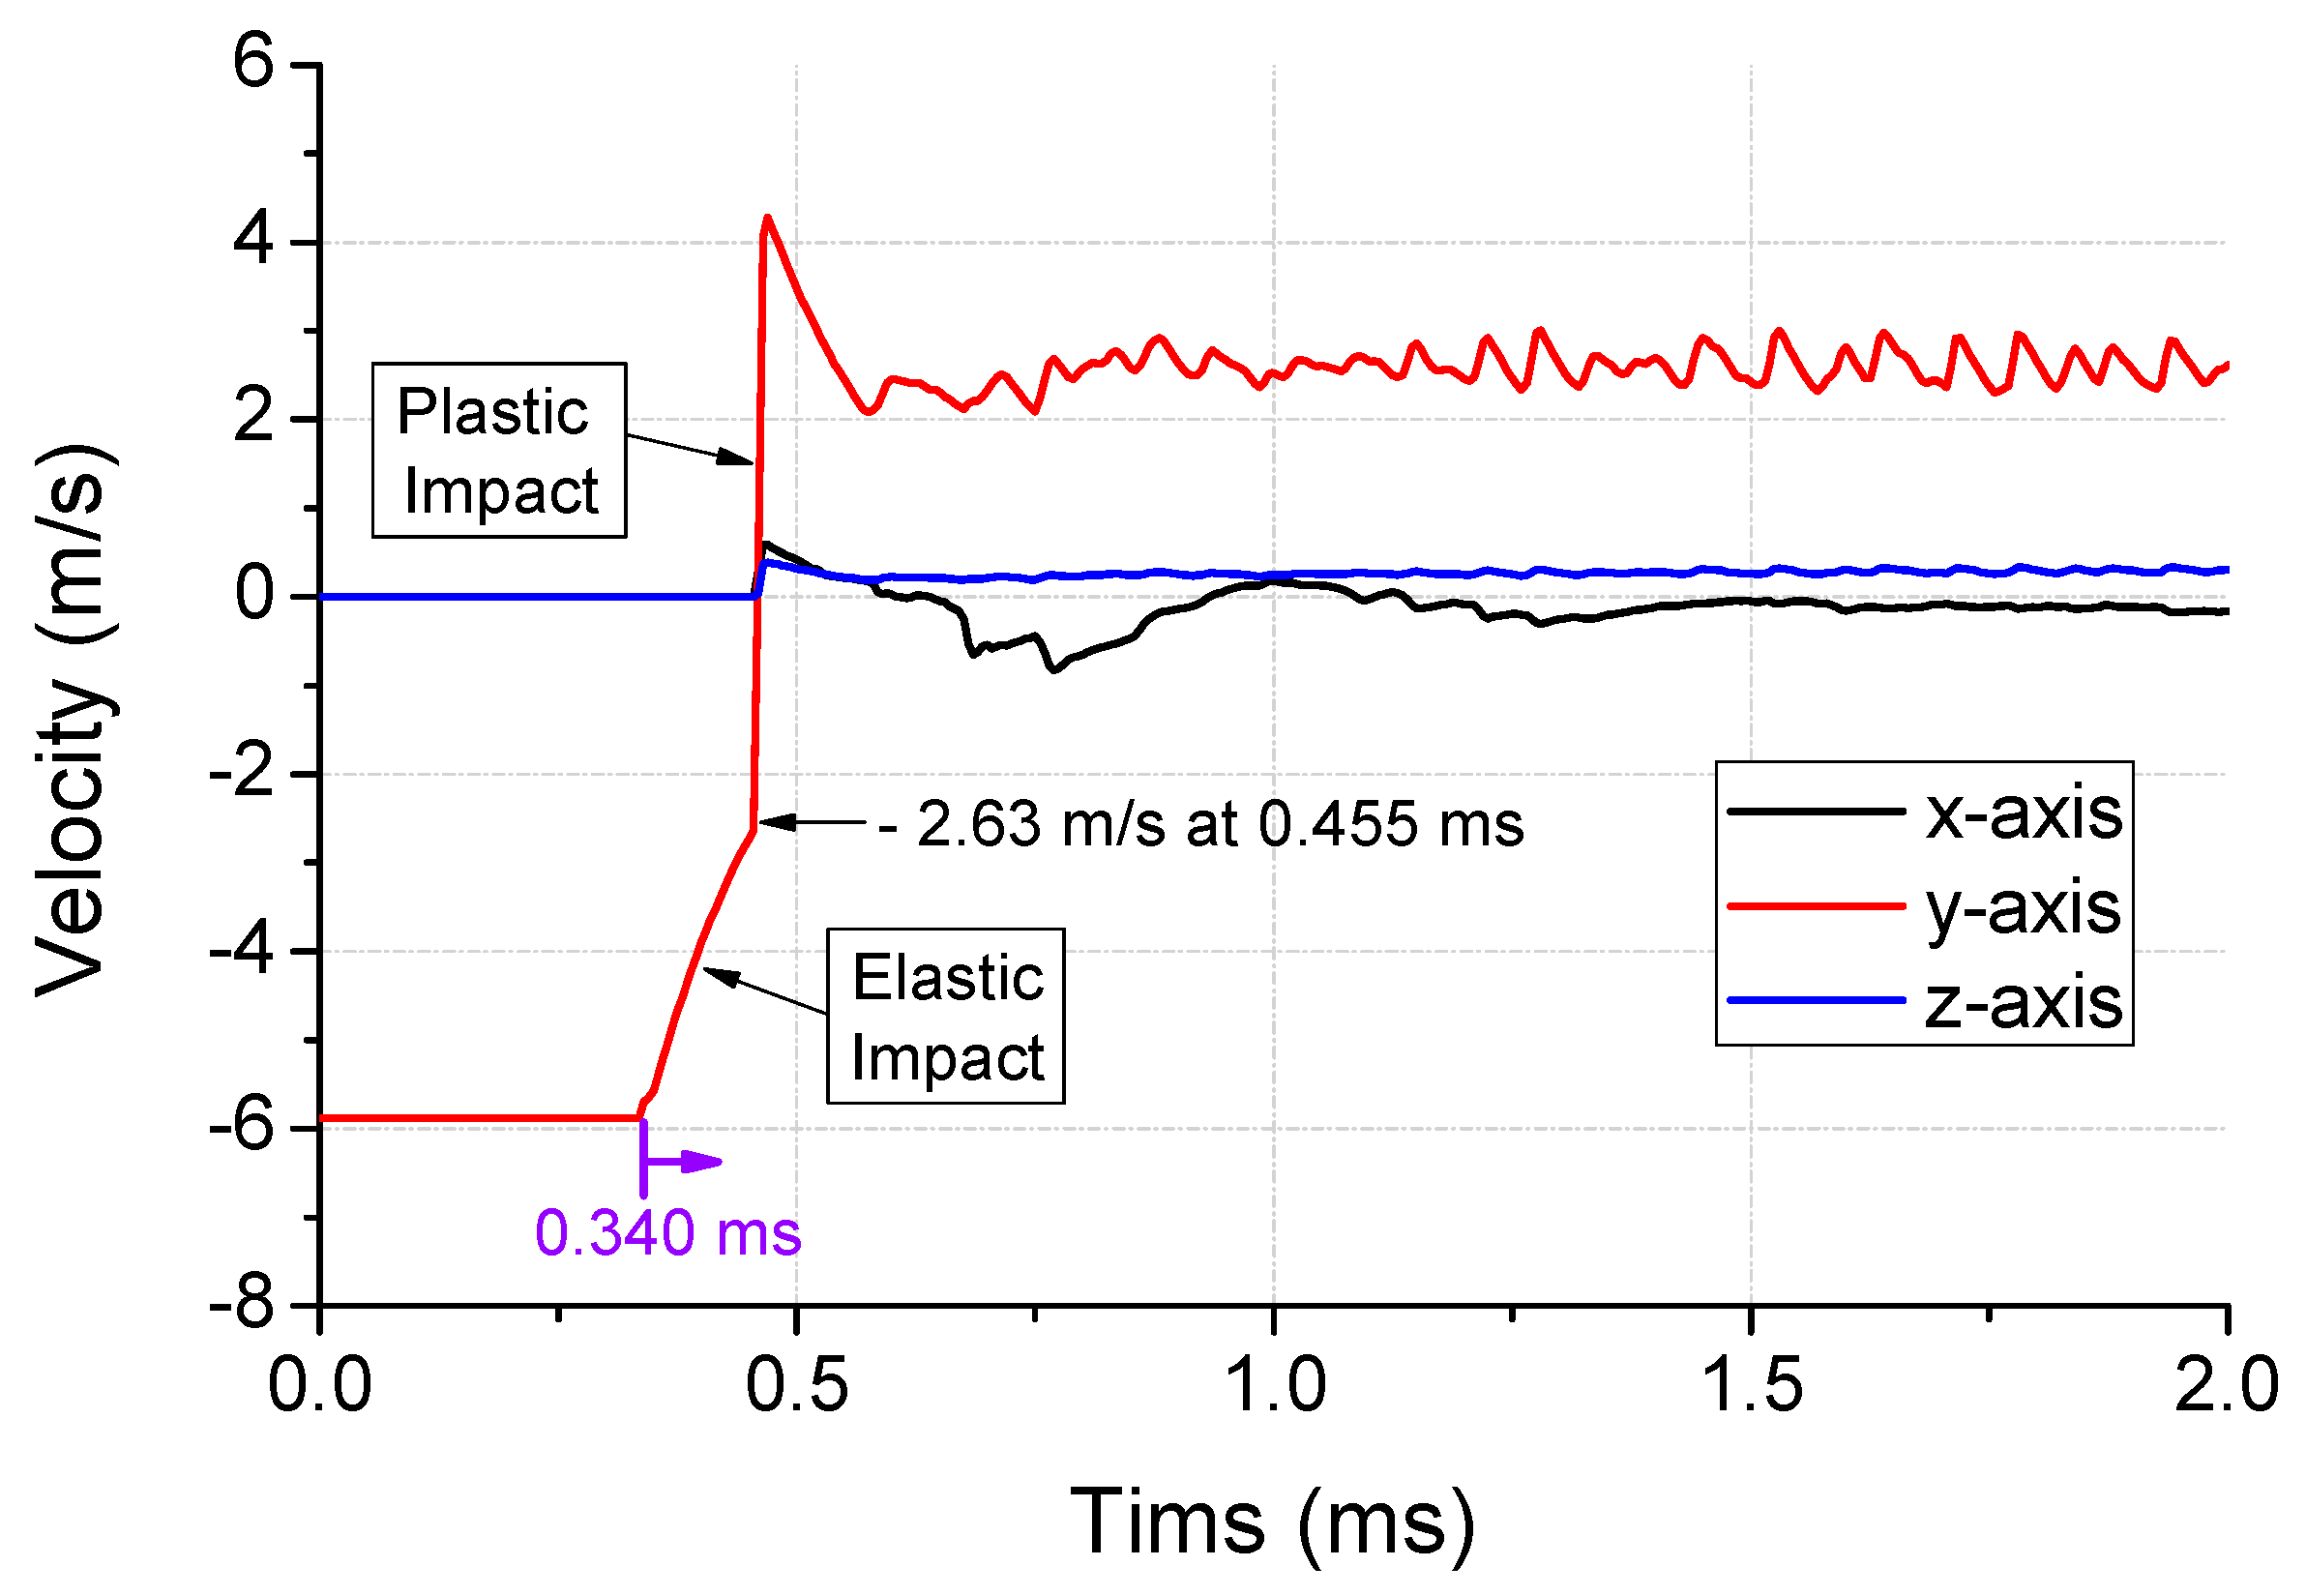
3.1. First Step—External Impact
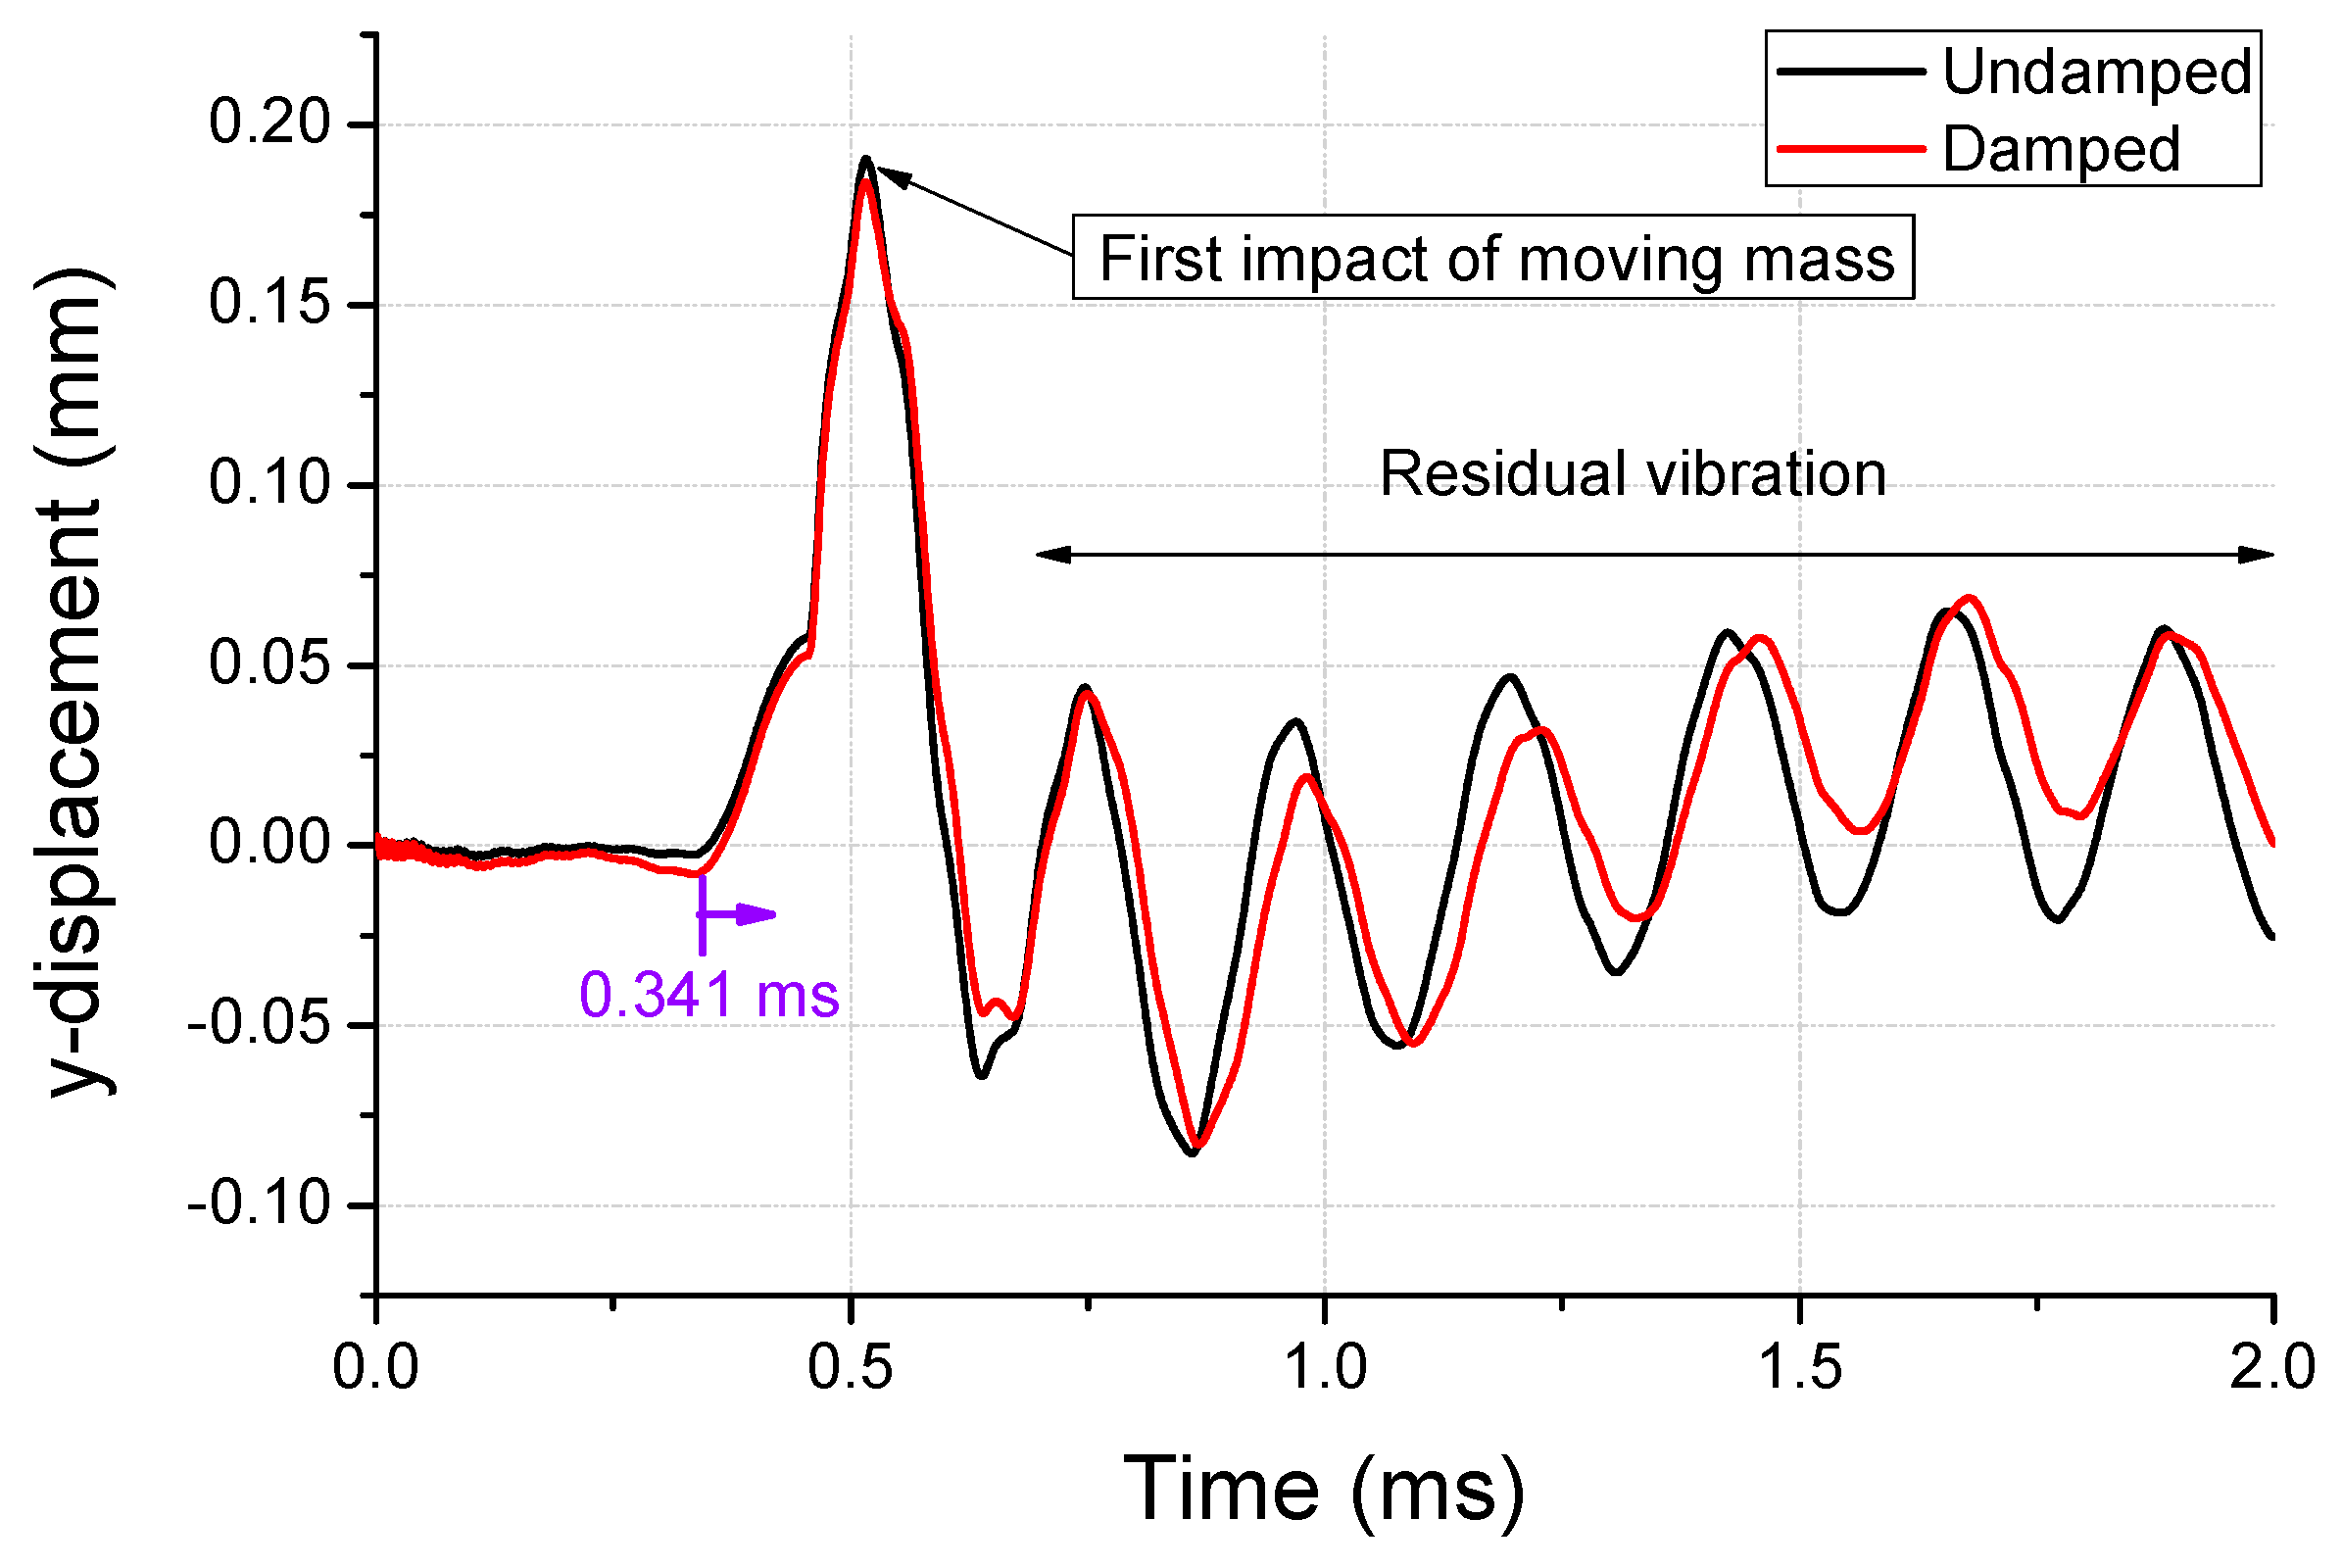
3.2. Second Step—Internal Impact
4. Drop Impact Tests
4.1. Driving Acceleration of the Haptic Actuator
4.2. Correlation between the Analysis and Tests
5. Conclusions
- (1)
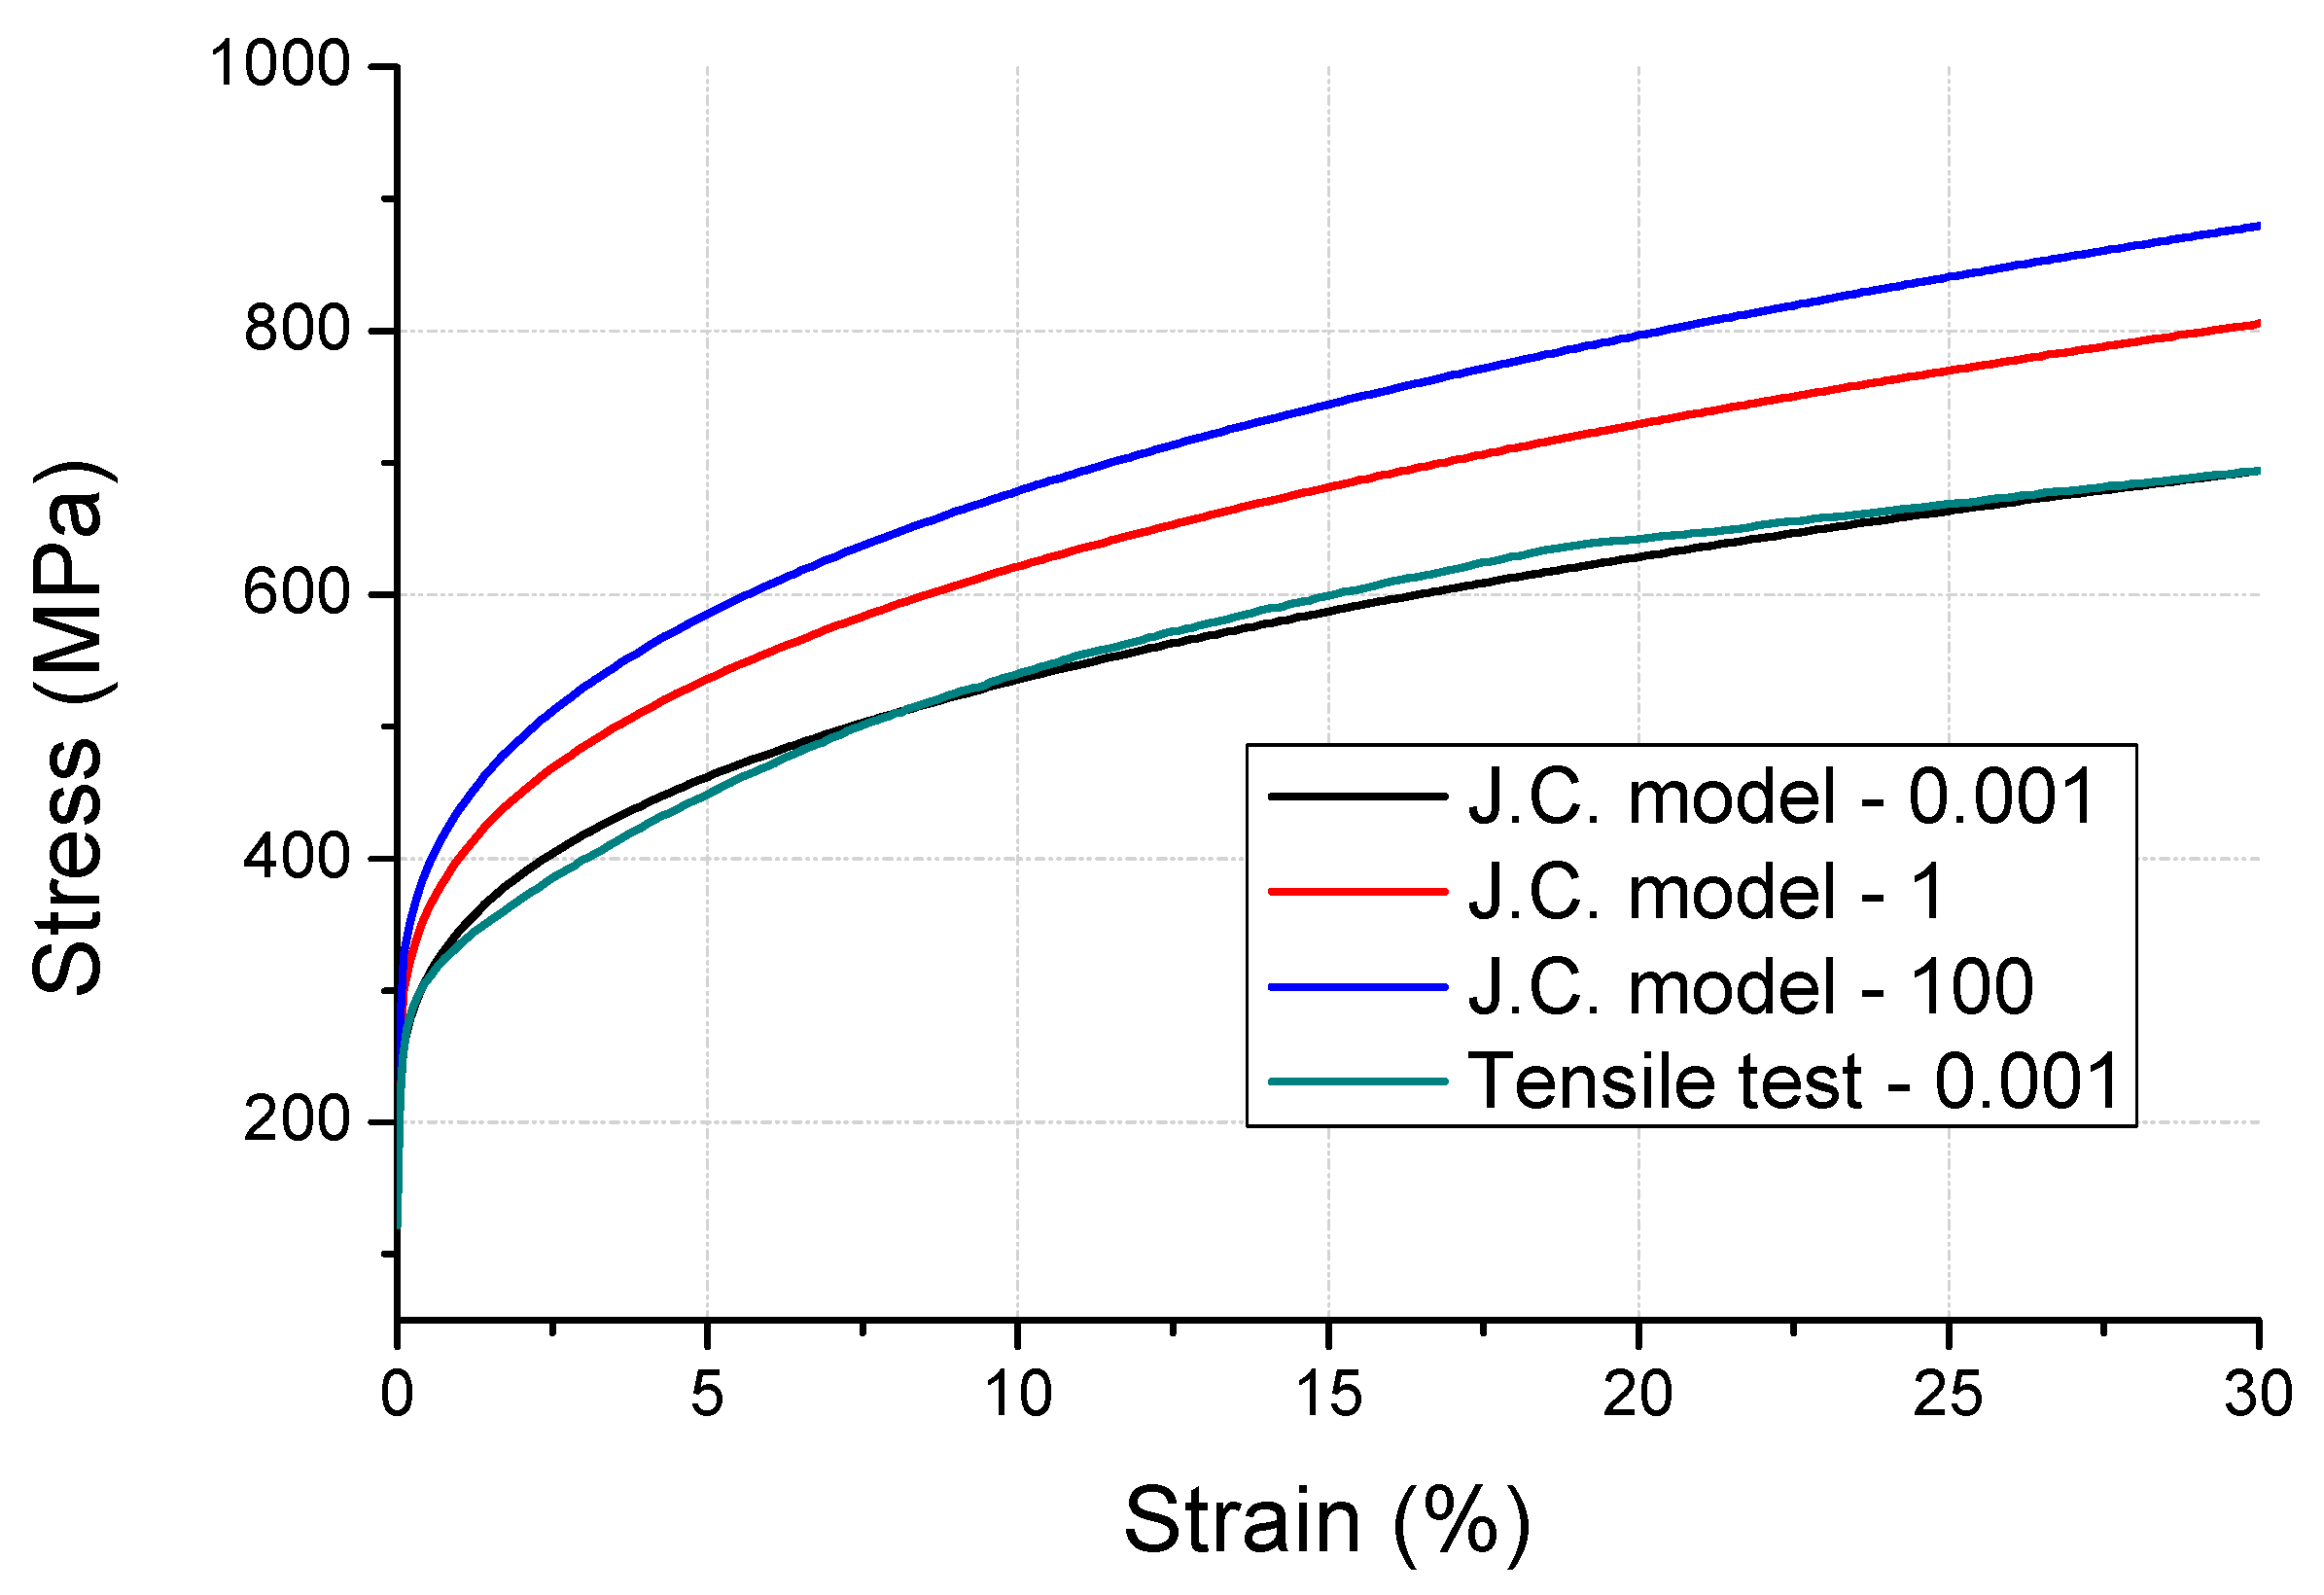
- The Johnson–Cook model was applied to the drop impact analysis of the haptic spring considering a high strain rate effect, and the computation time of the 2-step analysis was observed to be 86% less than that of the single-step analysis.
- (2)
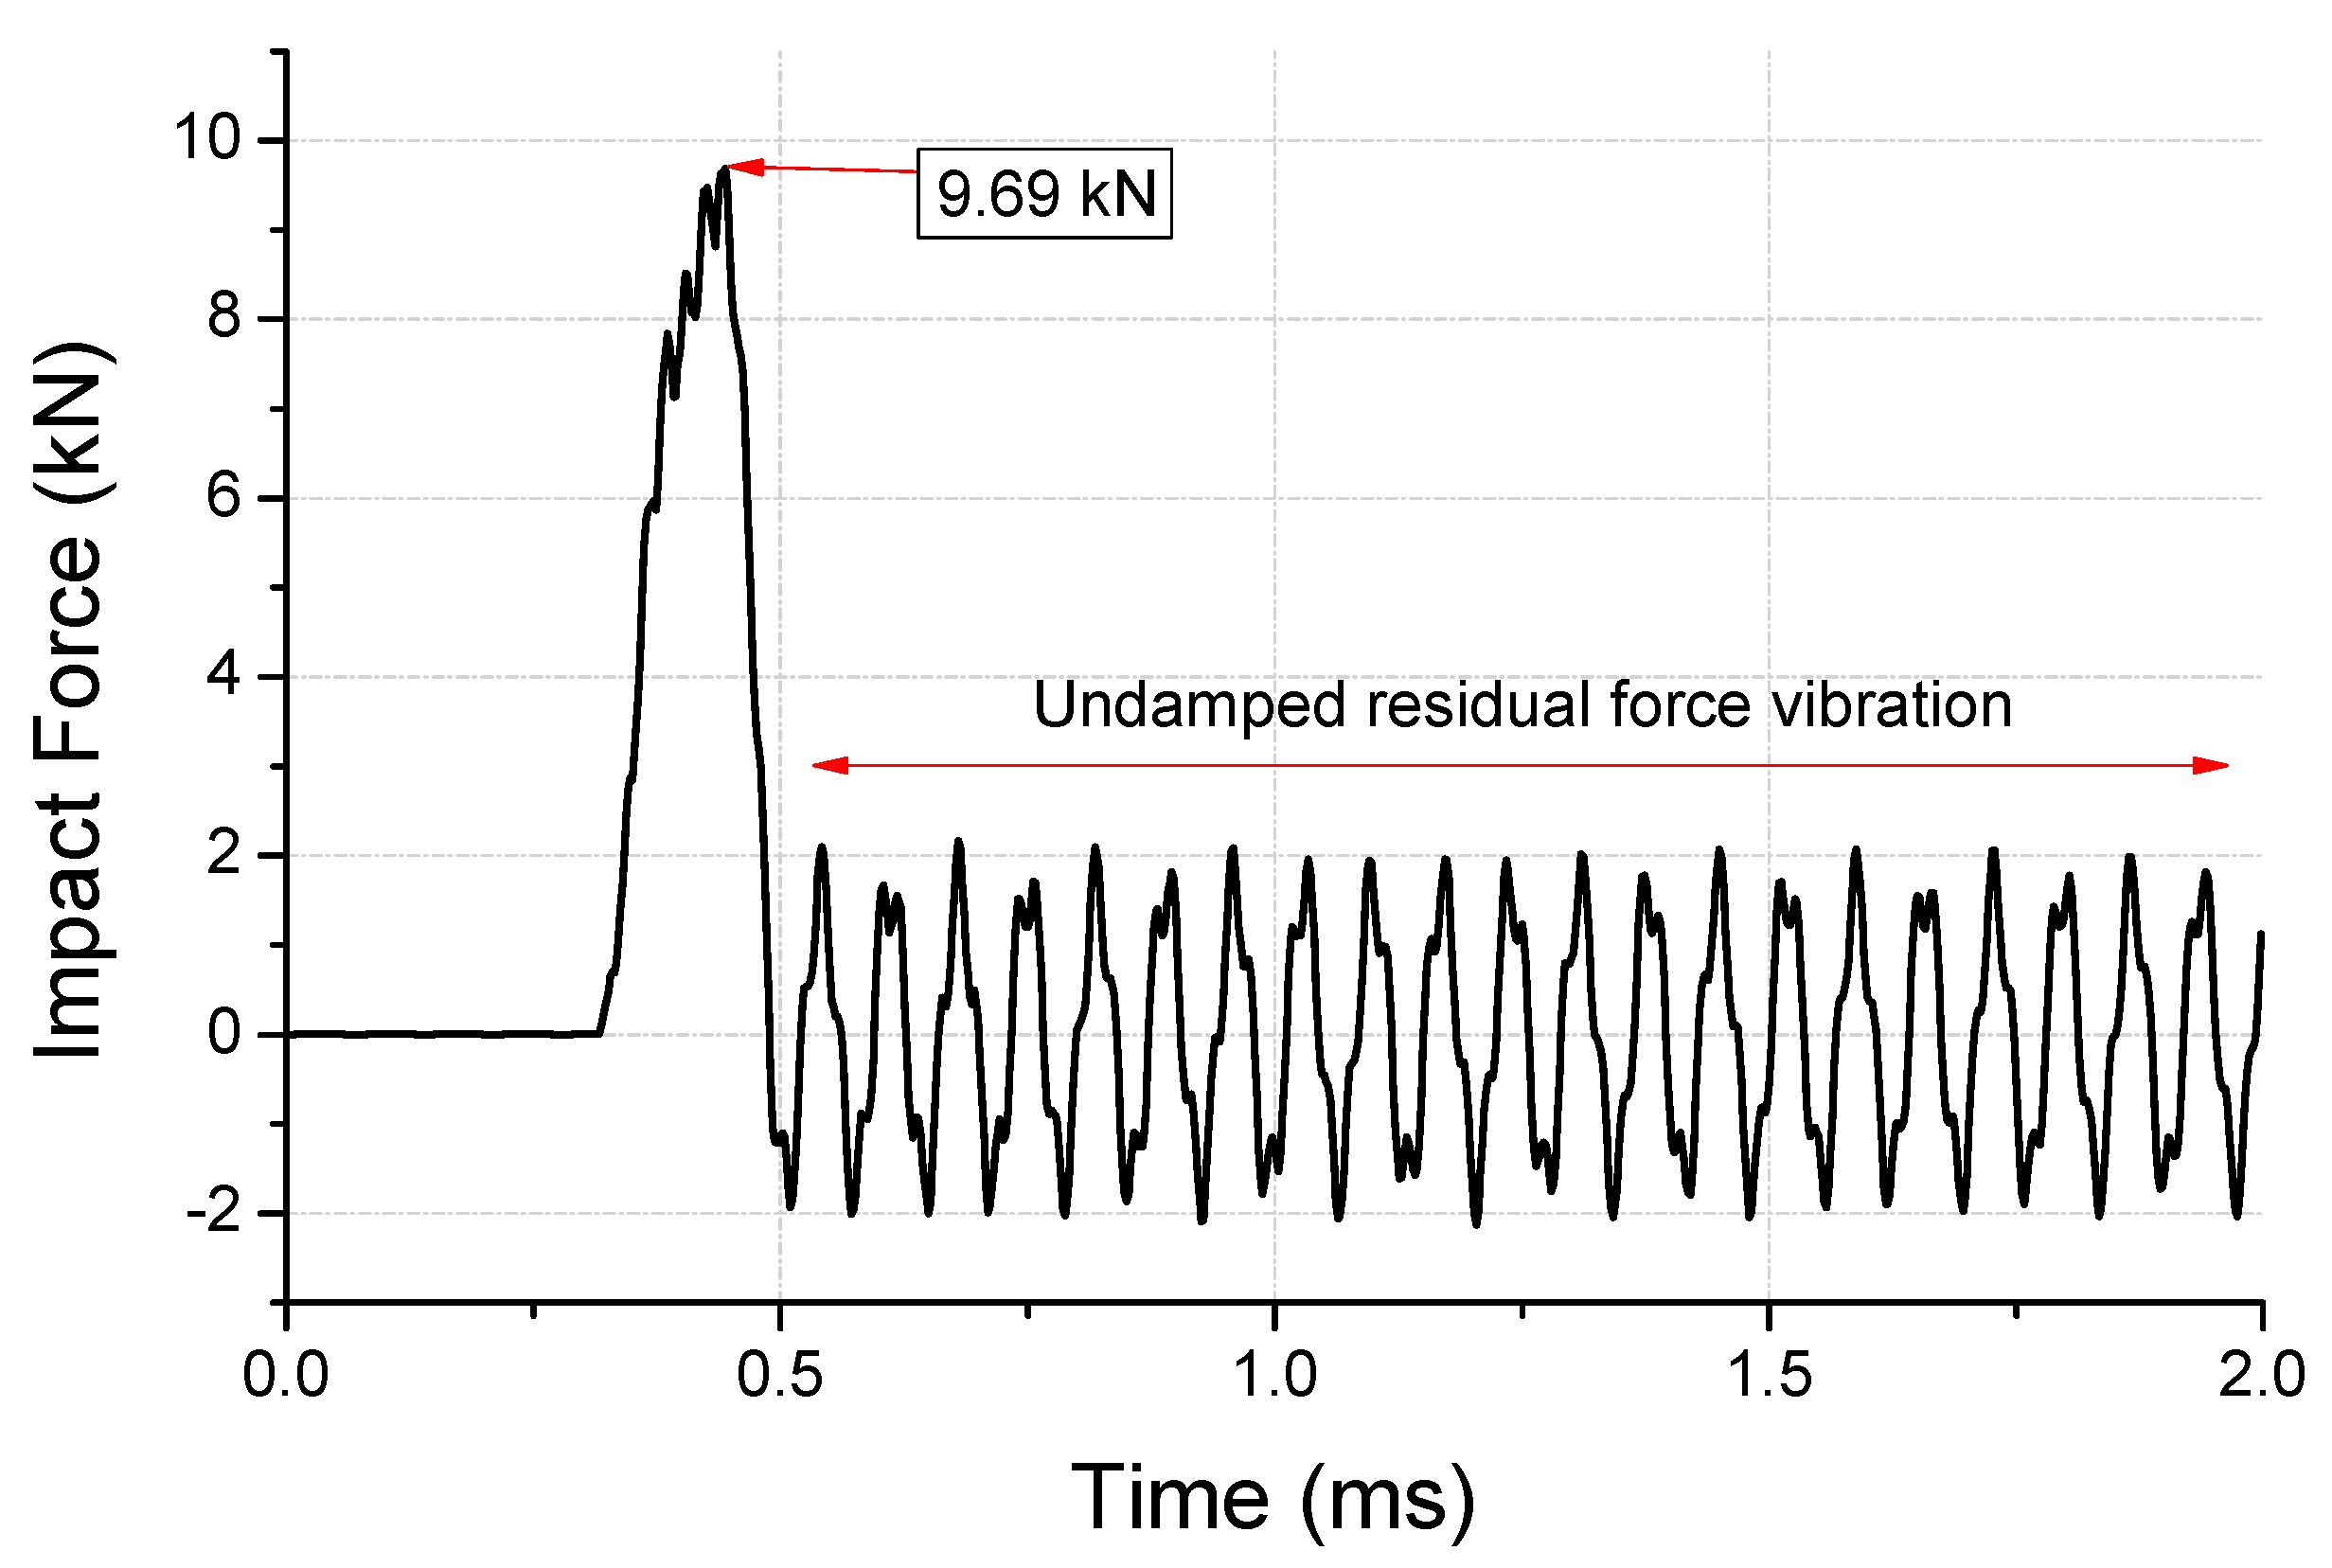
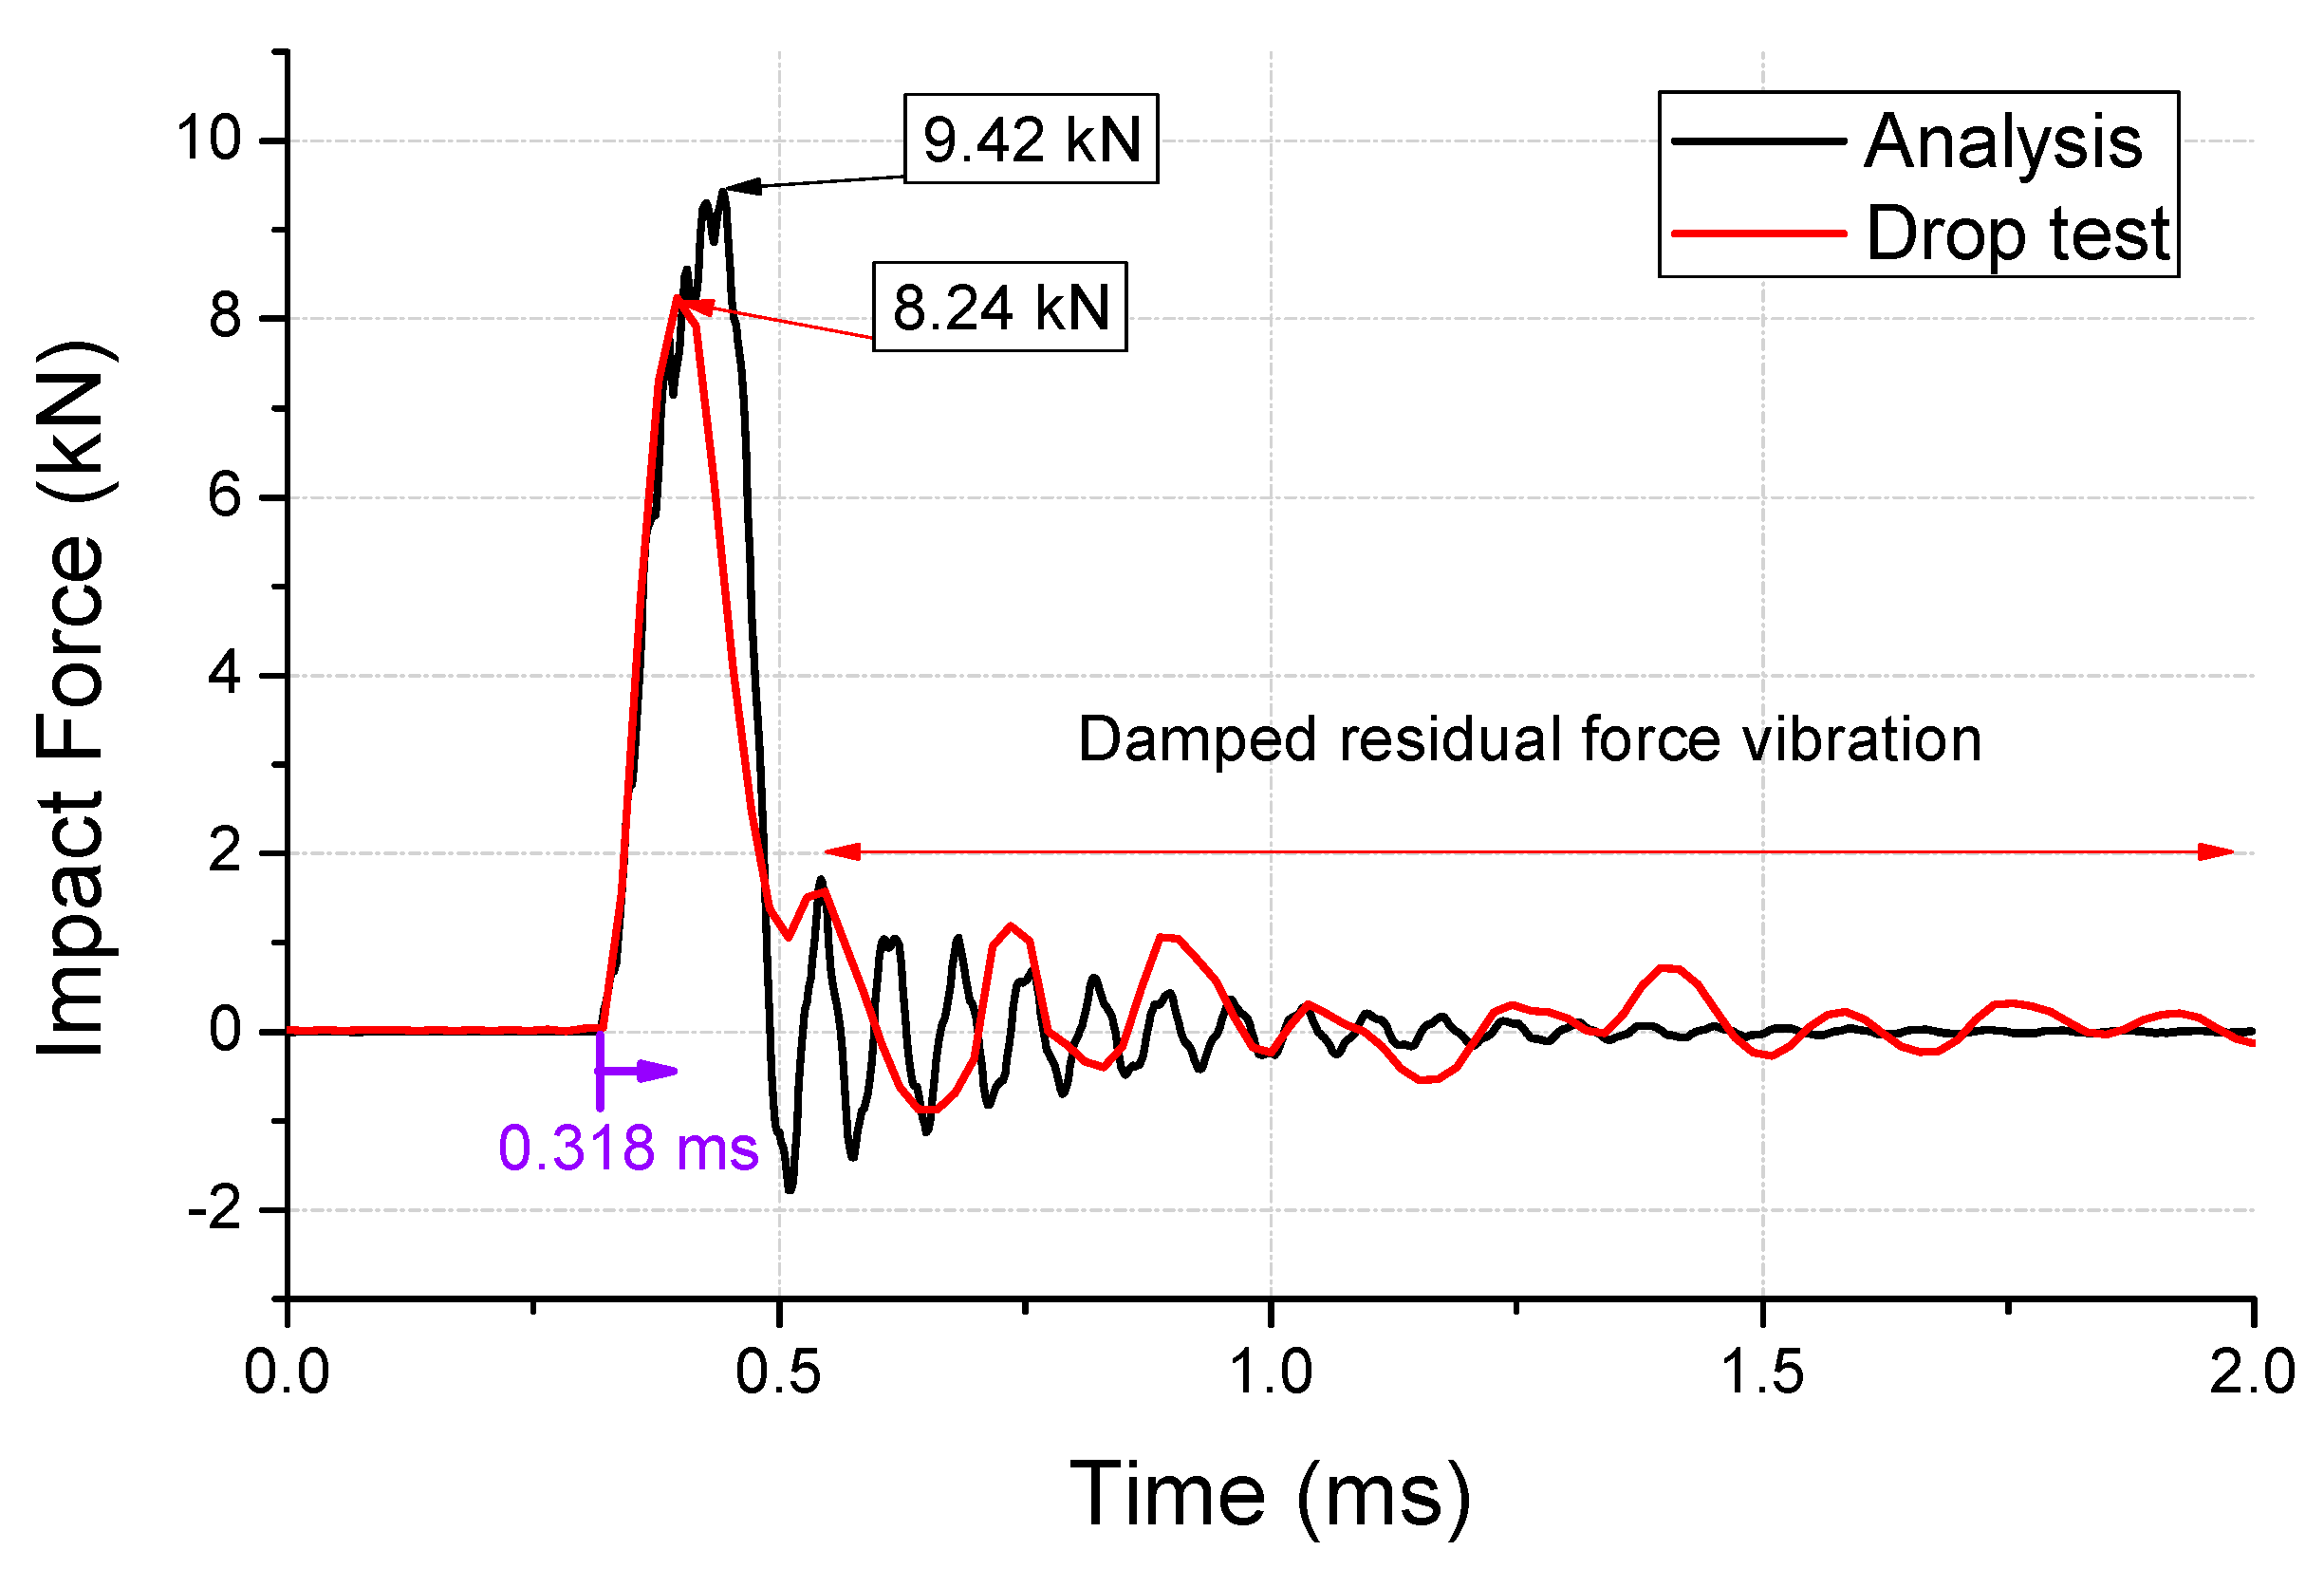
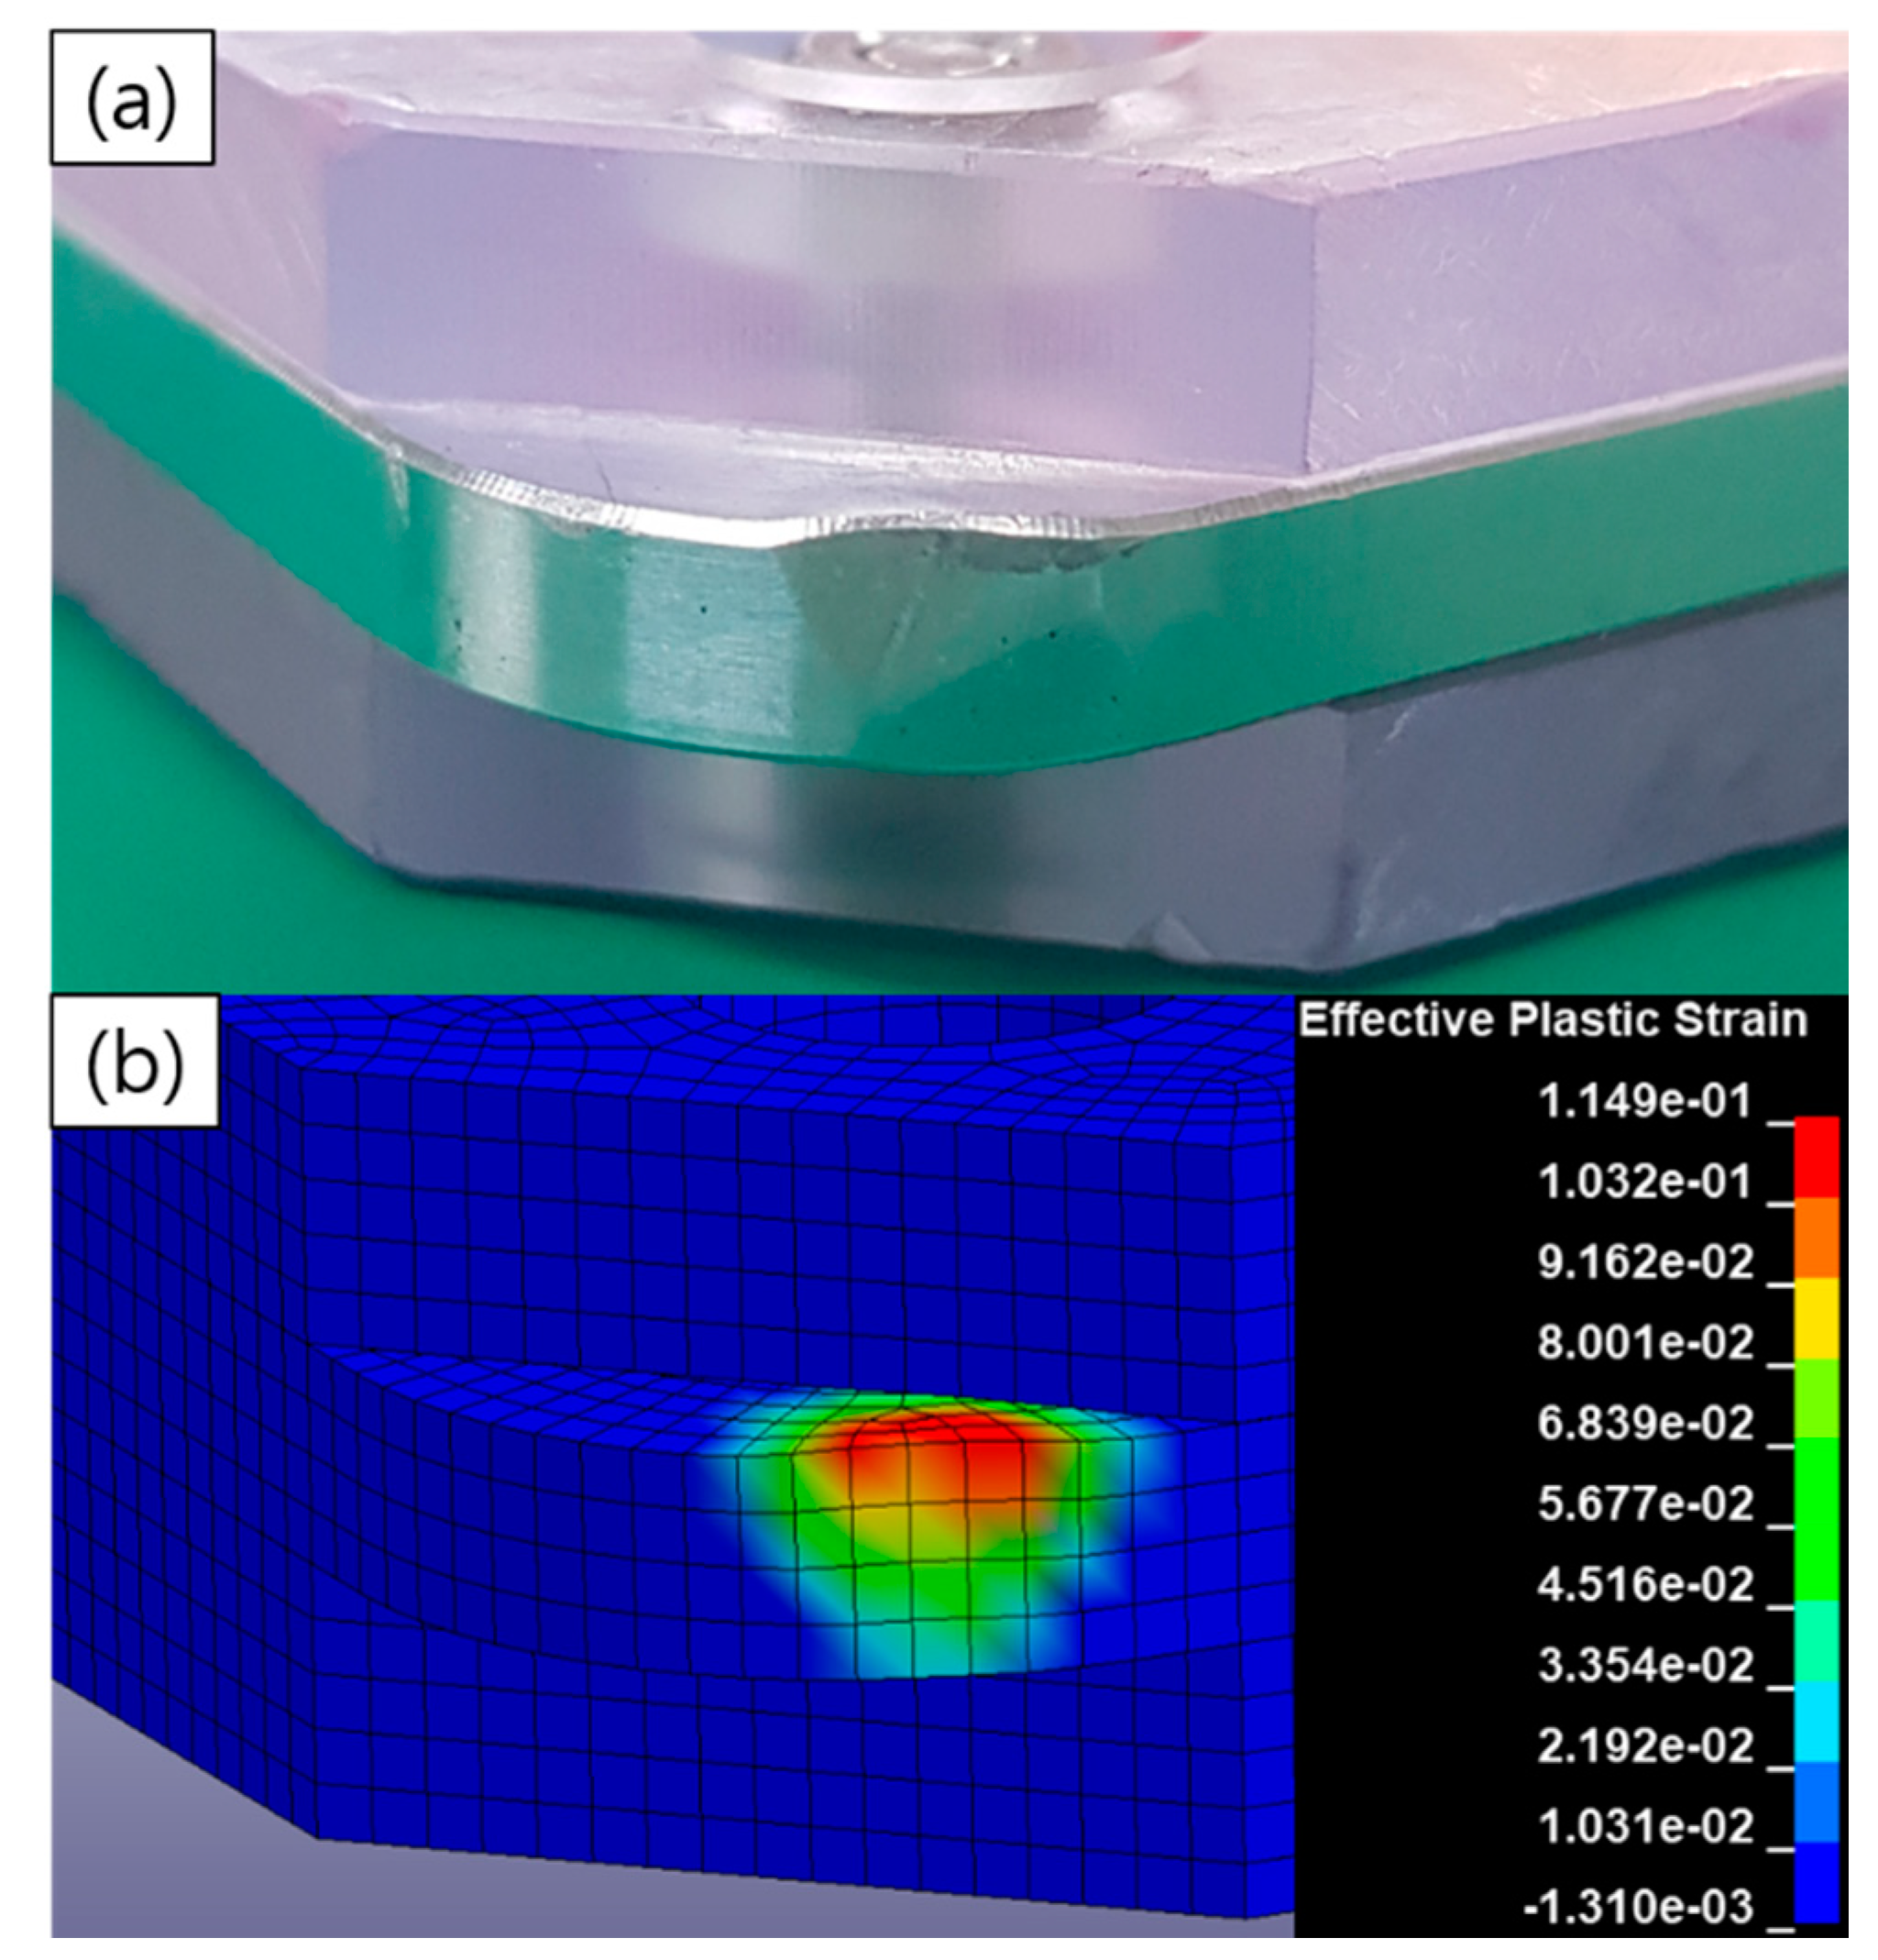
- The attenuation of the signal measured by the impact force sensor was applied to precisely model the impact force in the first-step analysis. The plastic strain of the impact contact area obtained from the analysis and experiment agreed well; however, the peak force was observed to be 14% higher in the analysis than in the experiment. The Johnson–Cook model of an aluminum dummy was required to improve the accuracy of the analysis.
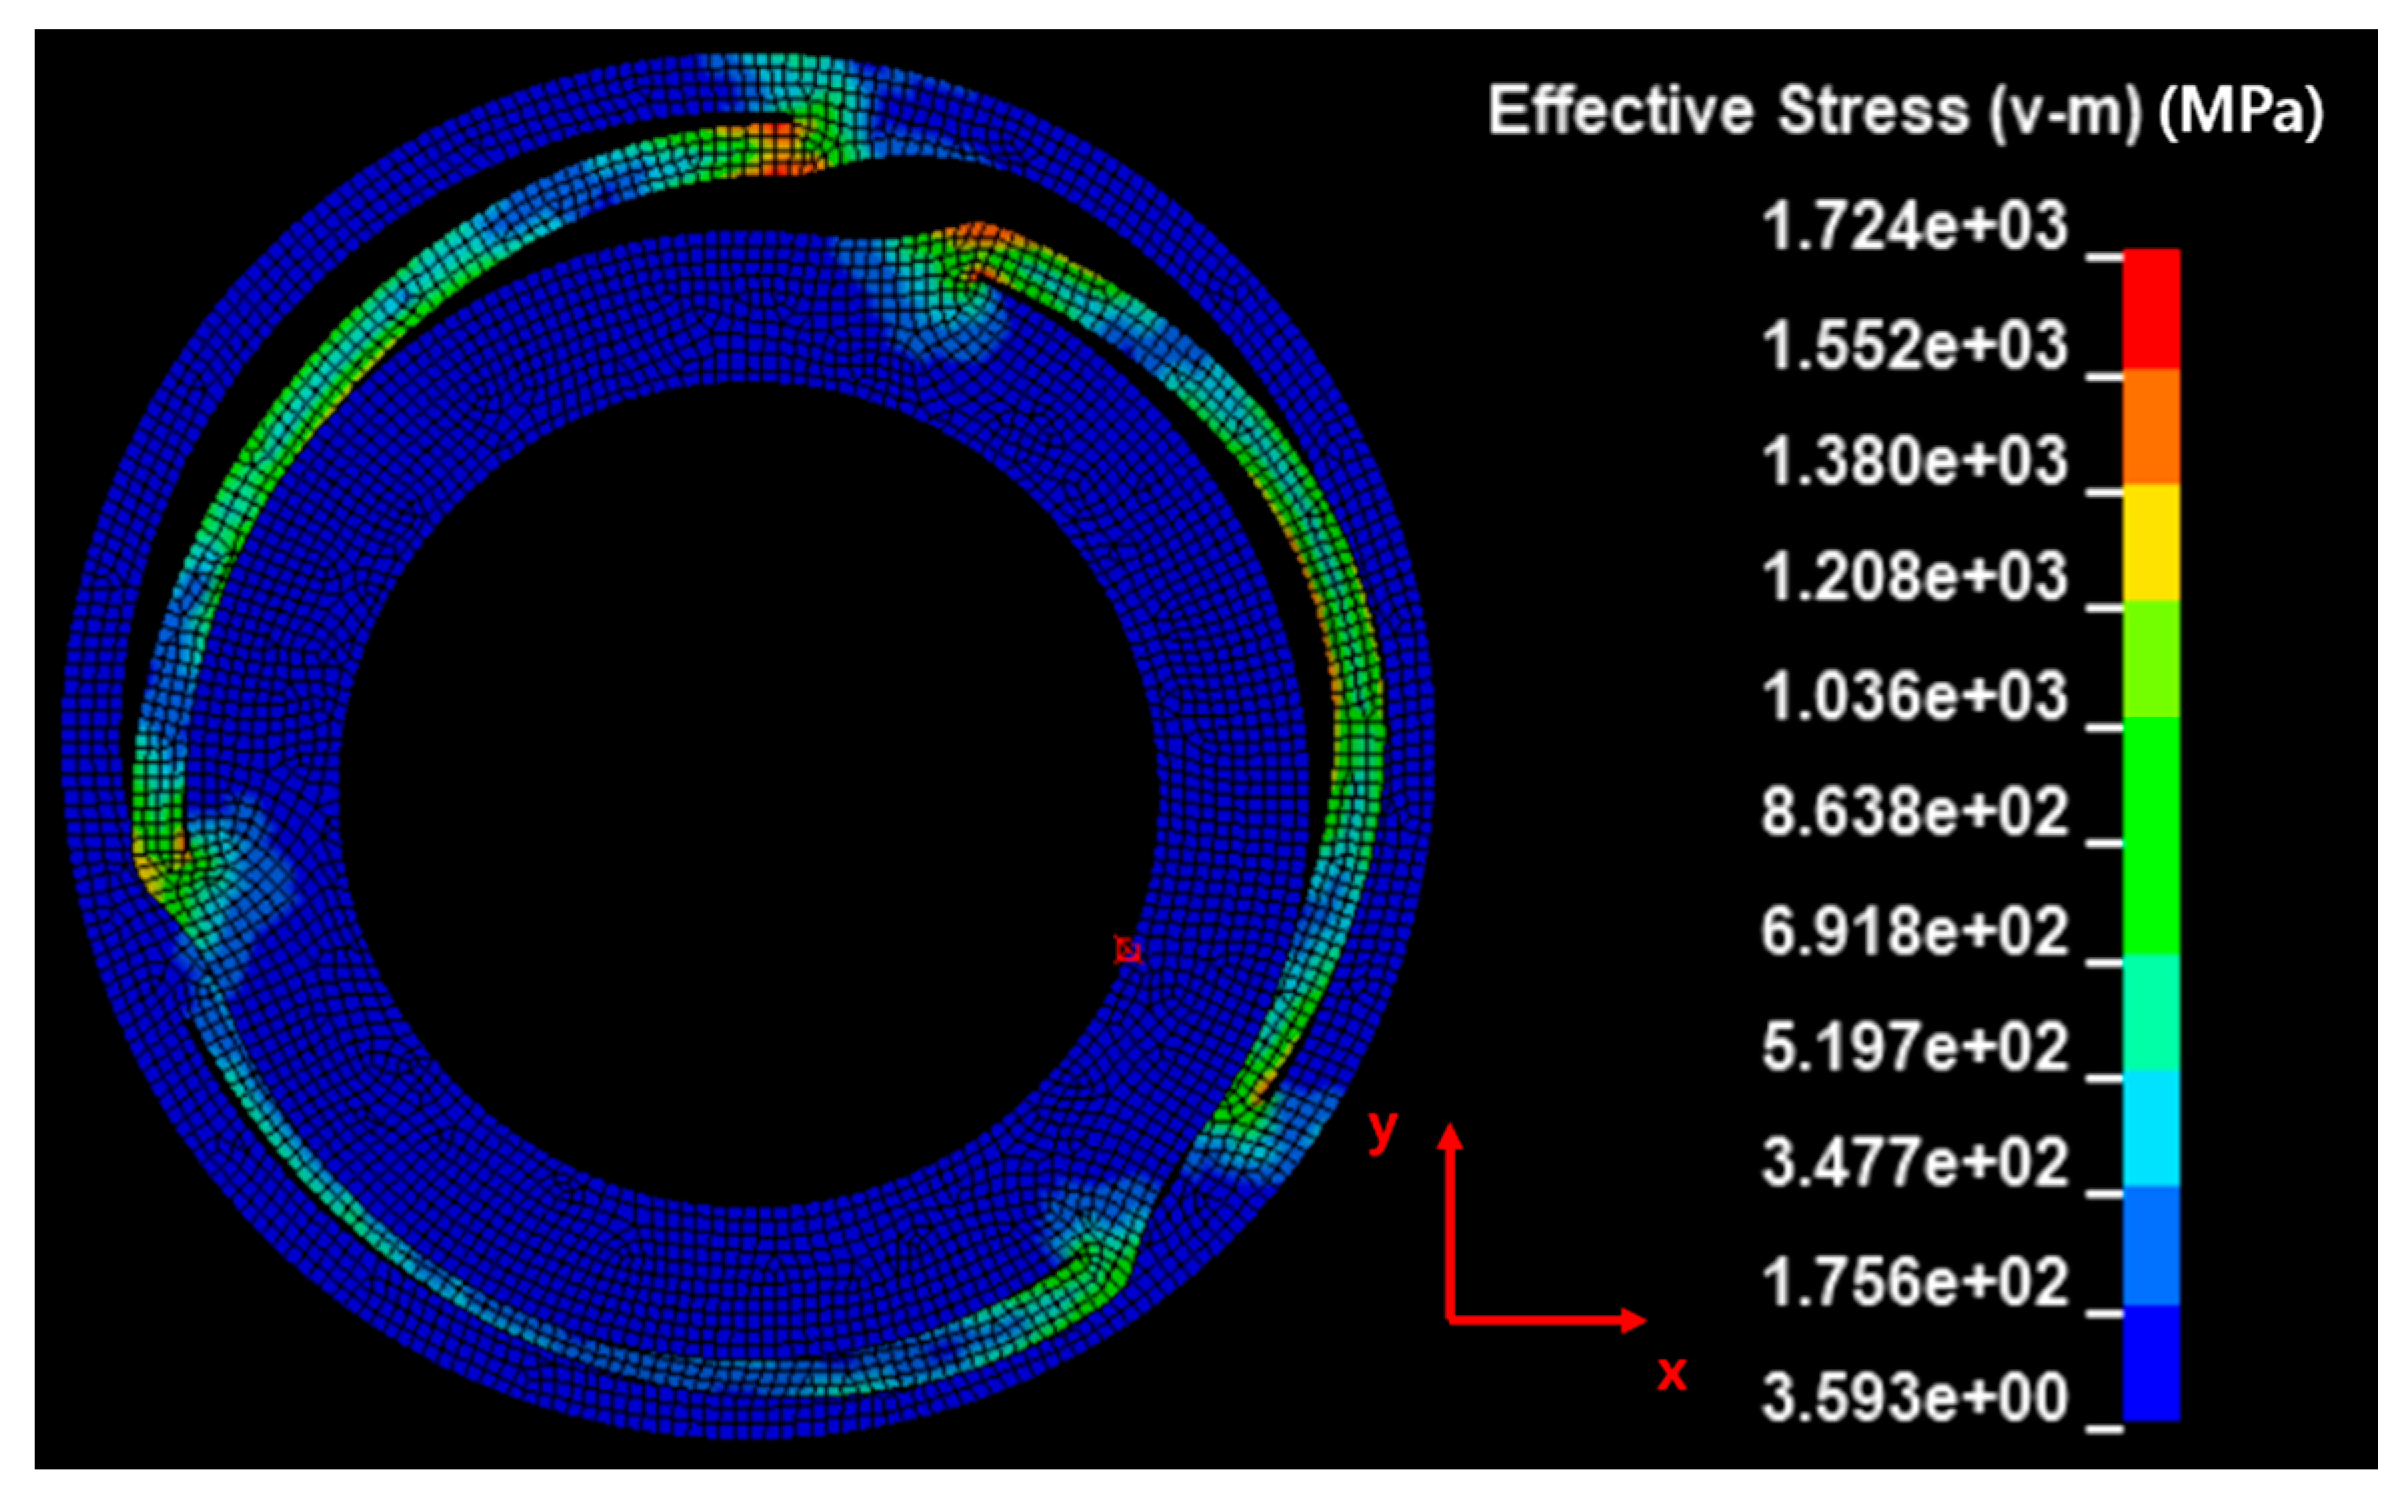
- (3)
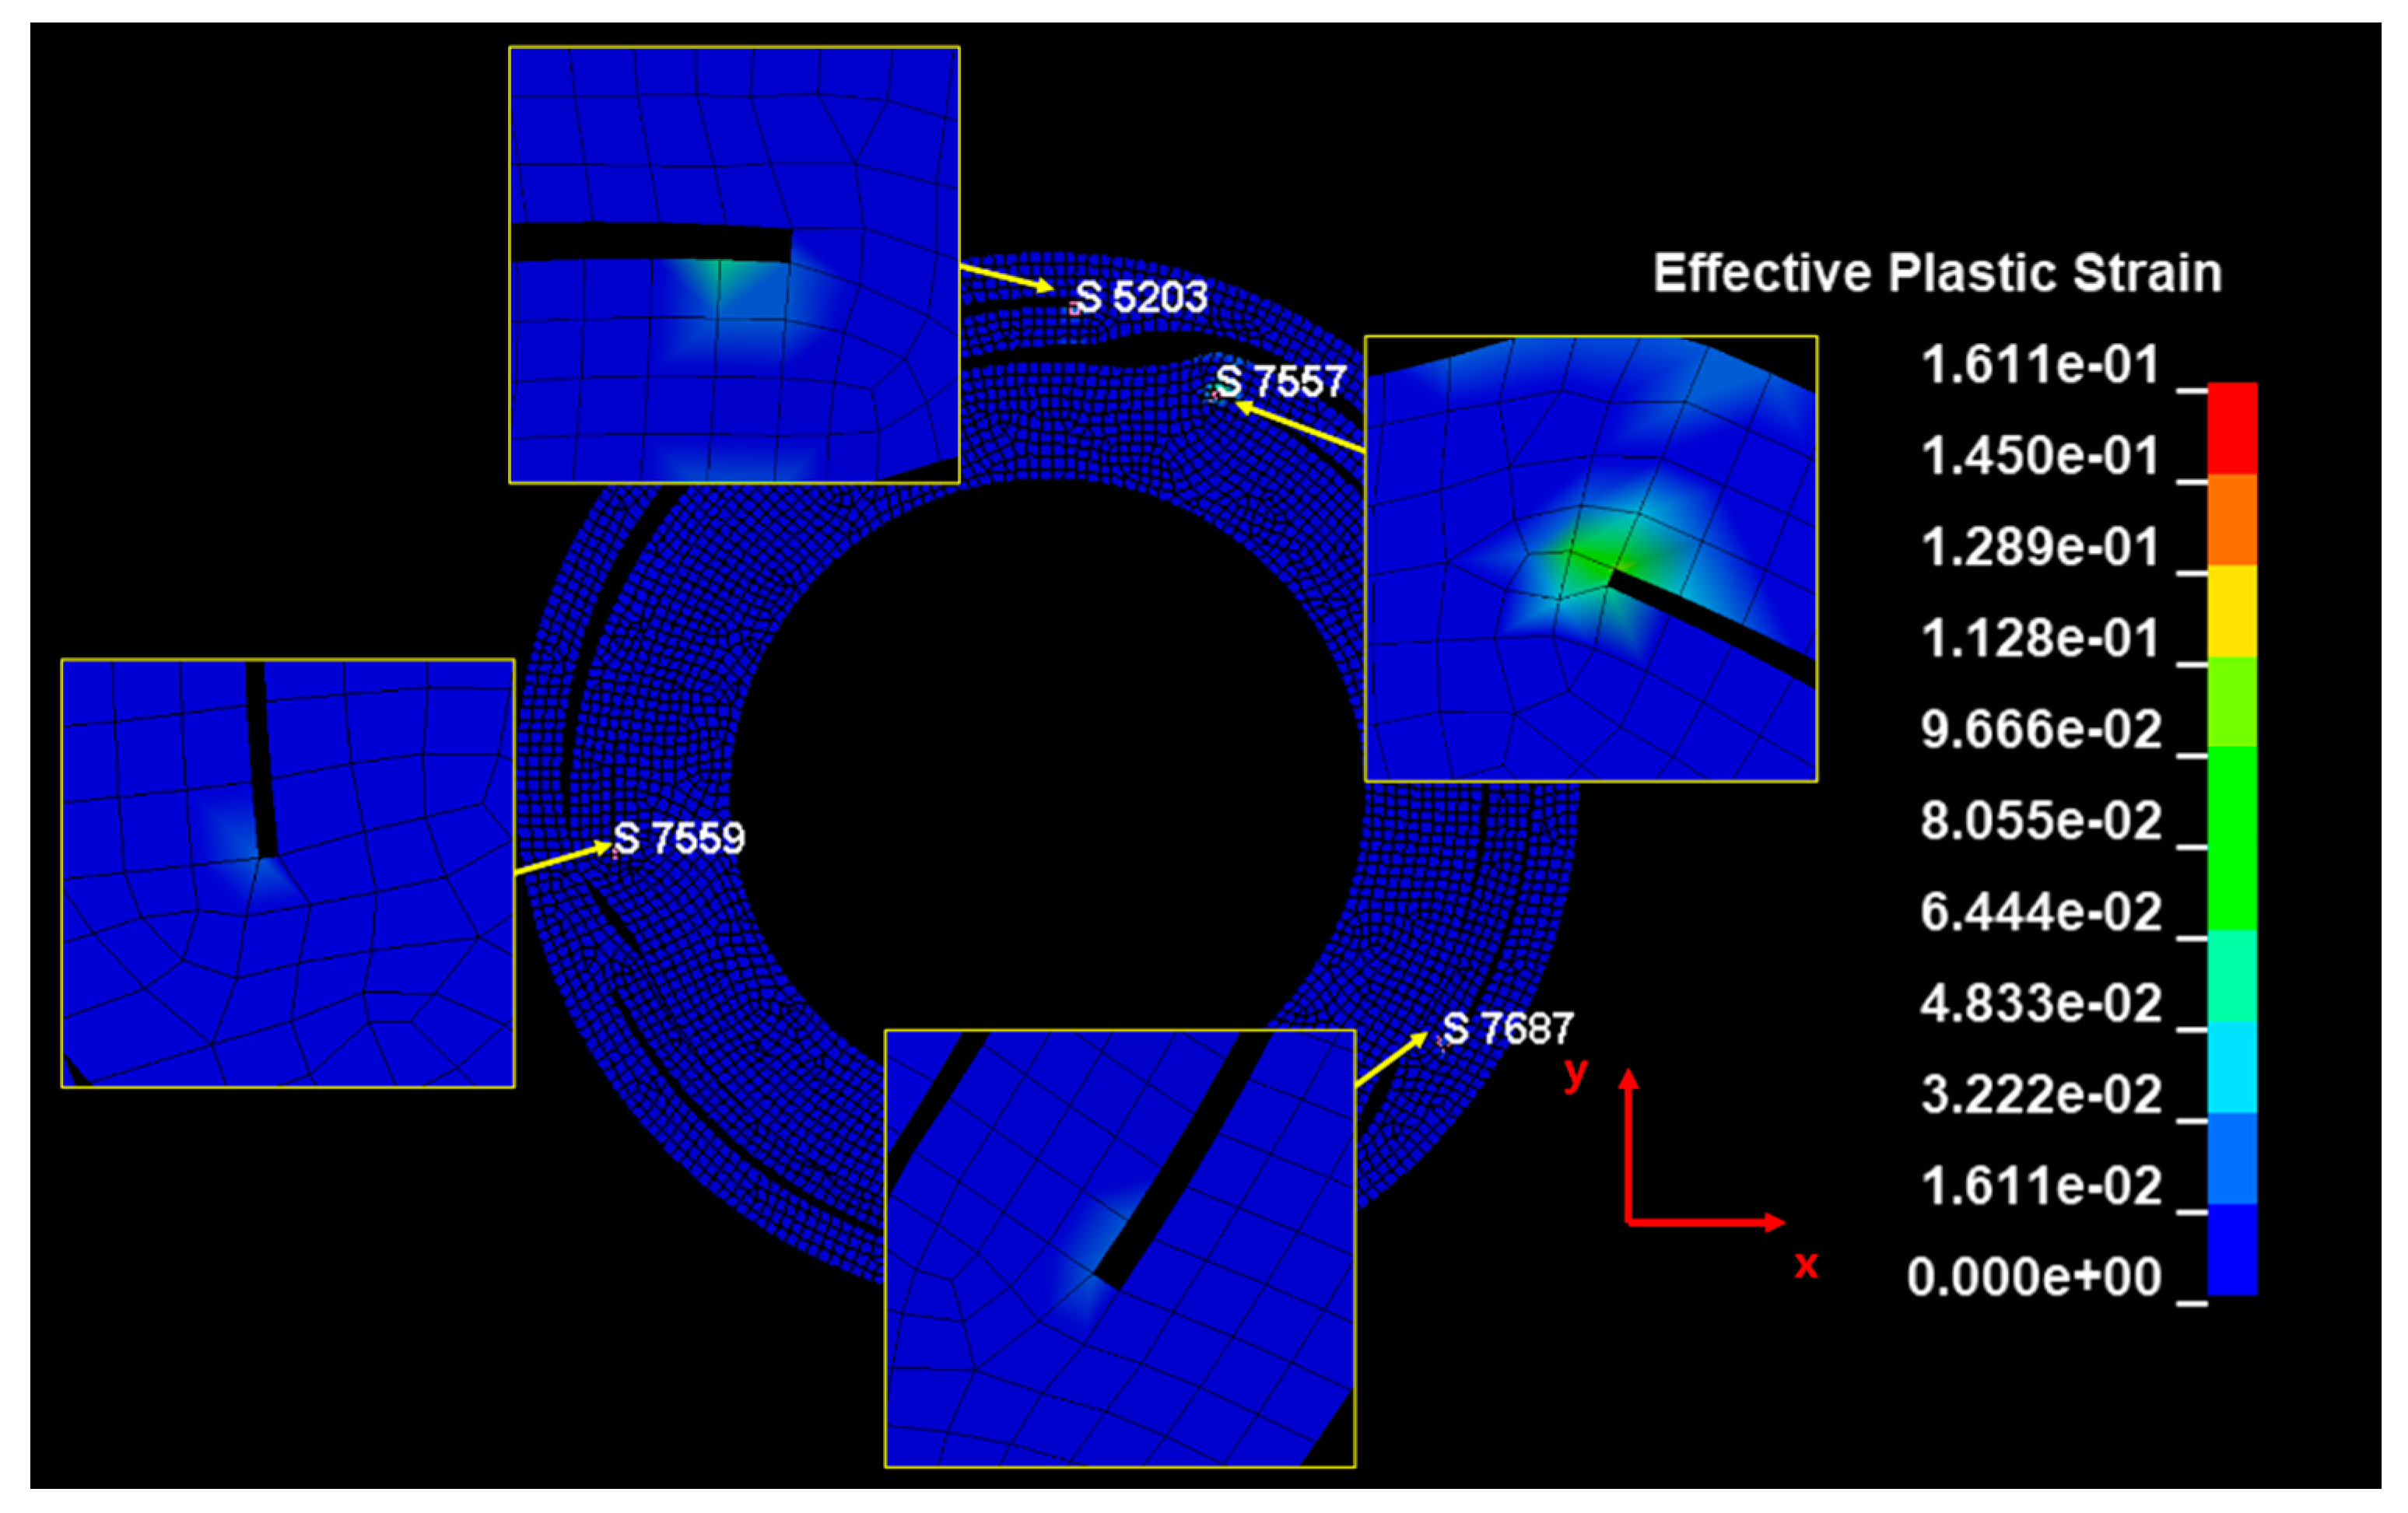
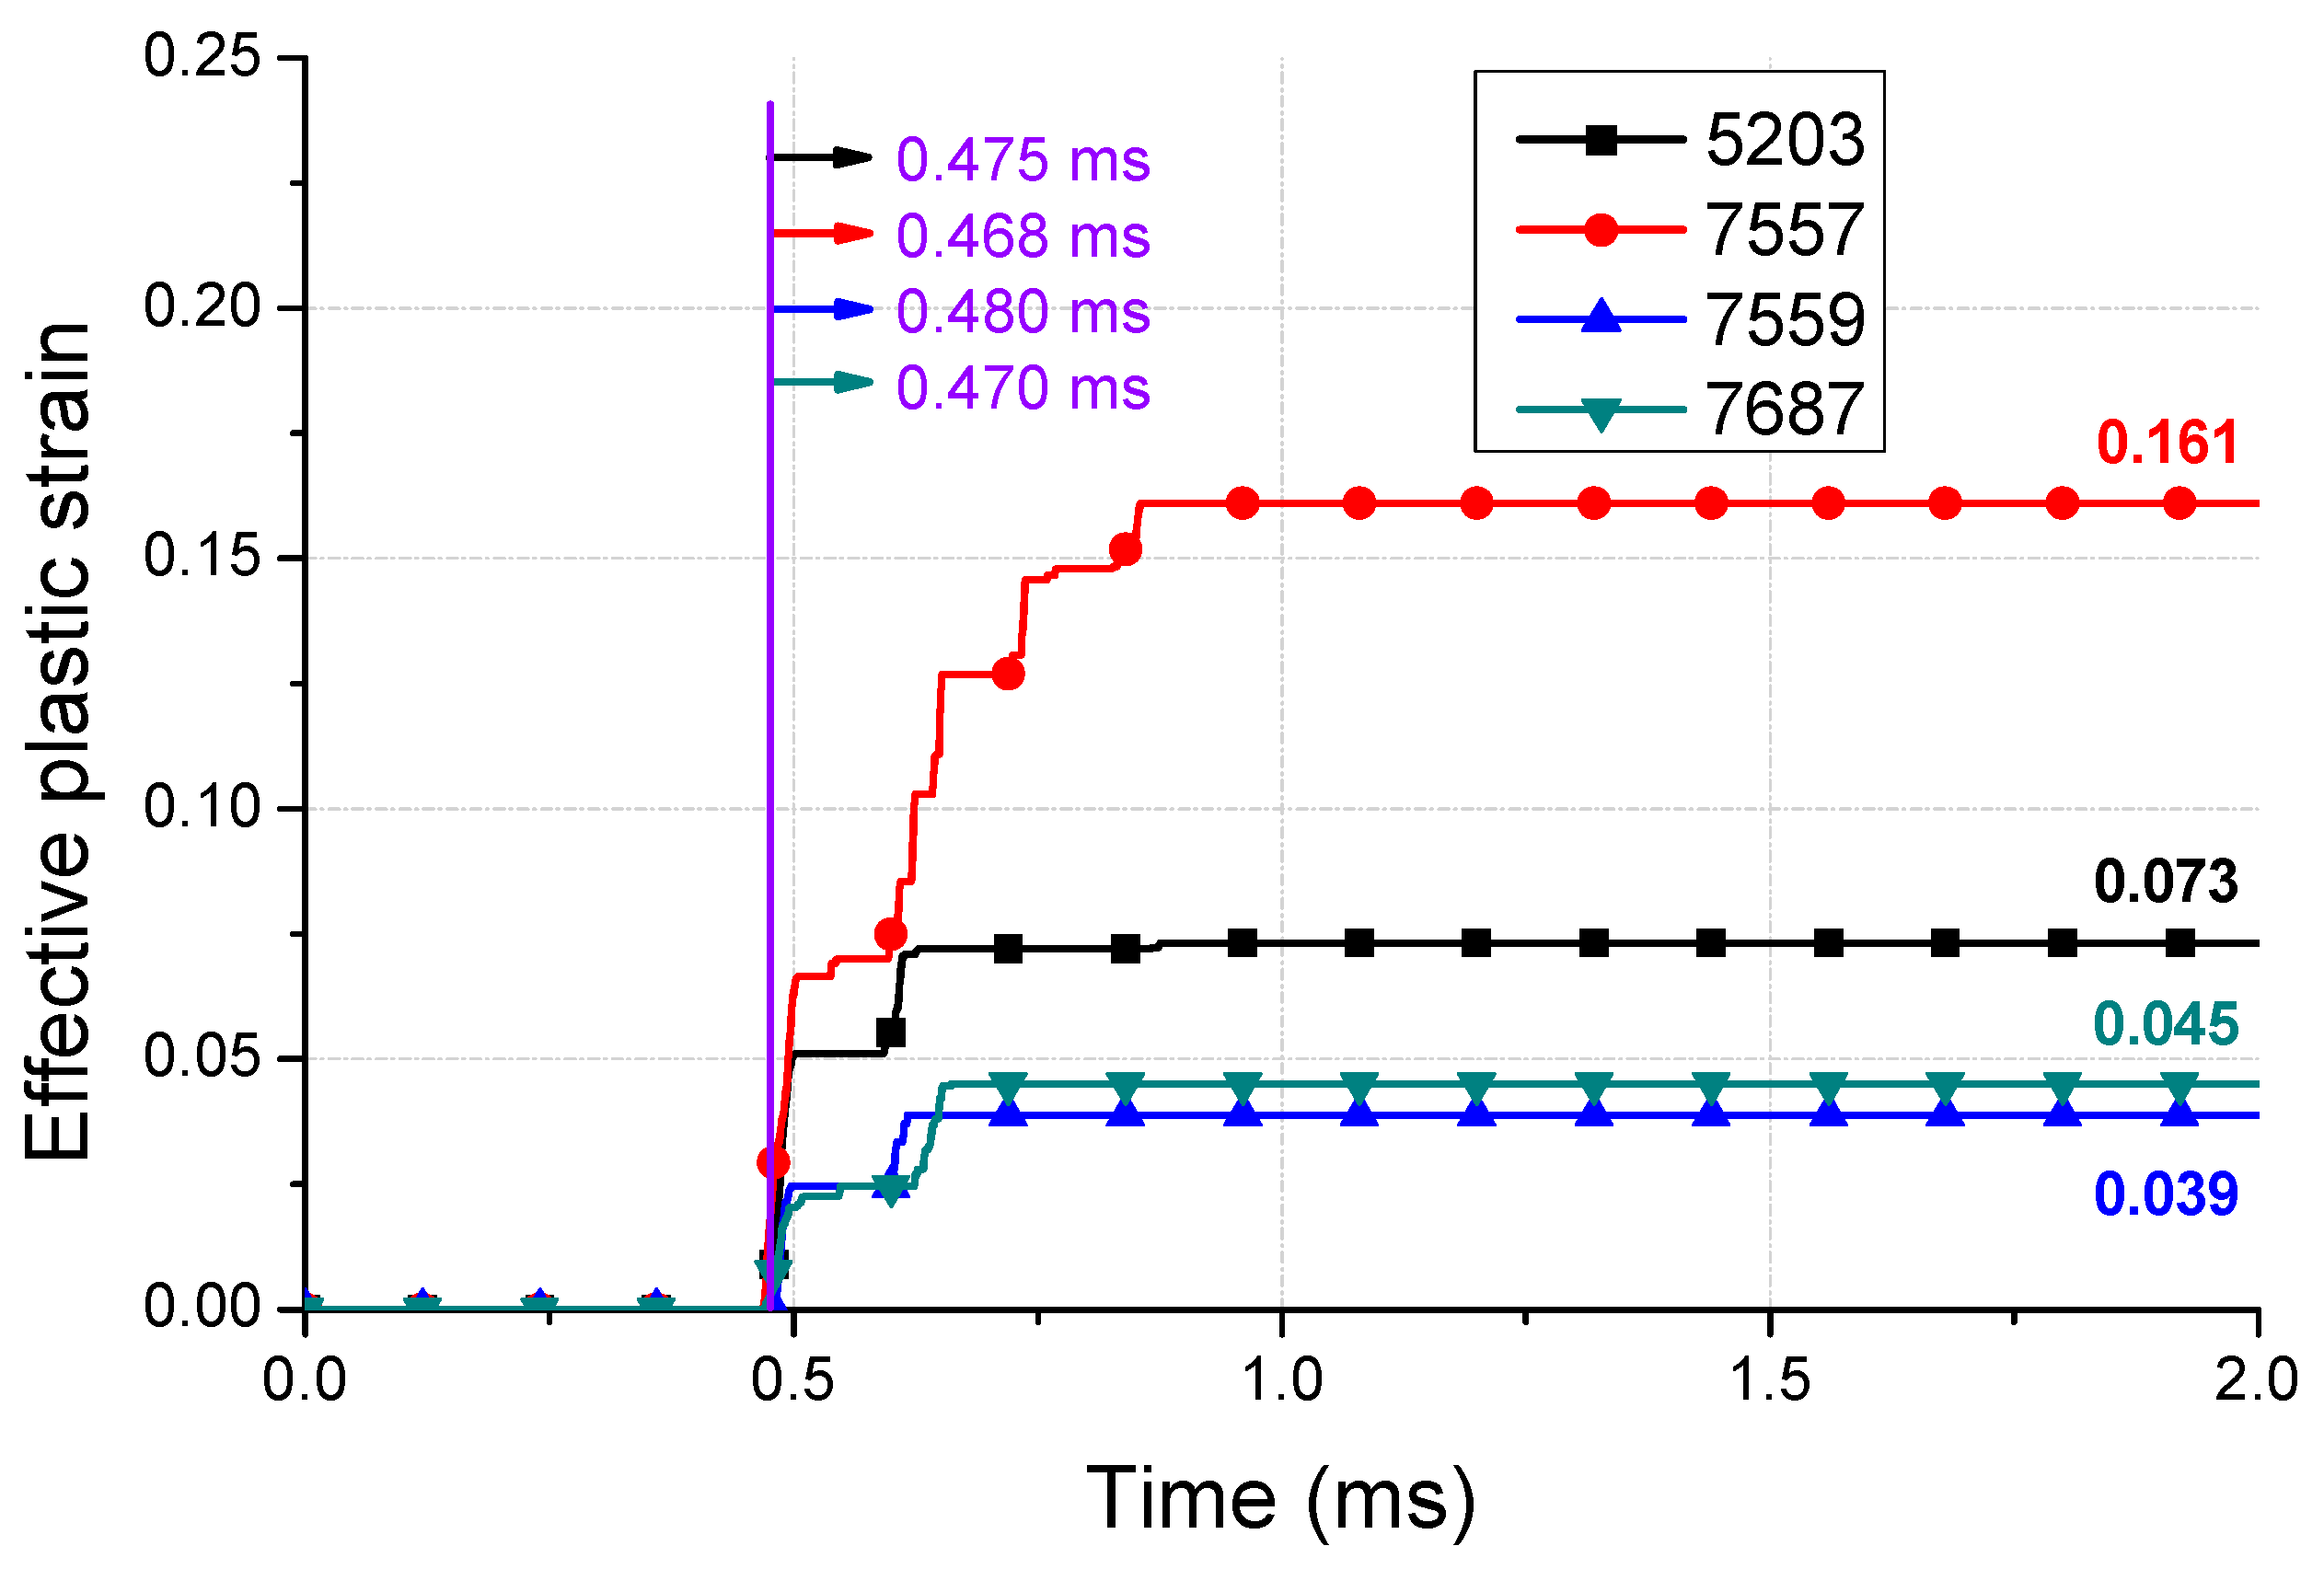
- The damping coefficient () measured in the authors’ previous study was used to model the damping of the spring in the second-step analysis. The occurrence of the maximum stress of the SUS301 spring (1724 MPa) and the greater-than-yield stresses of 1377 MPa at the four notches of the spring was confirmed using the strain constant C of SUS304. The maximum generated plastic strain of 0.161 was the same as the highest stress area.
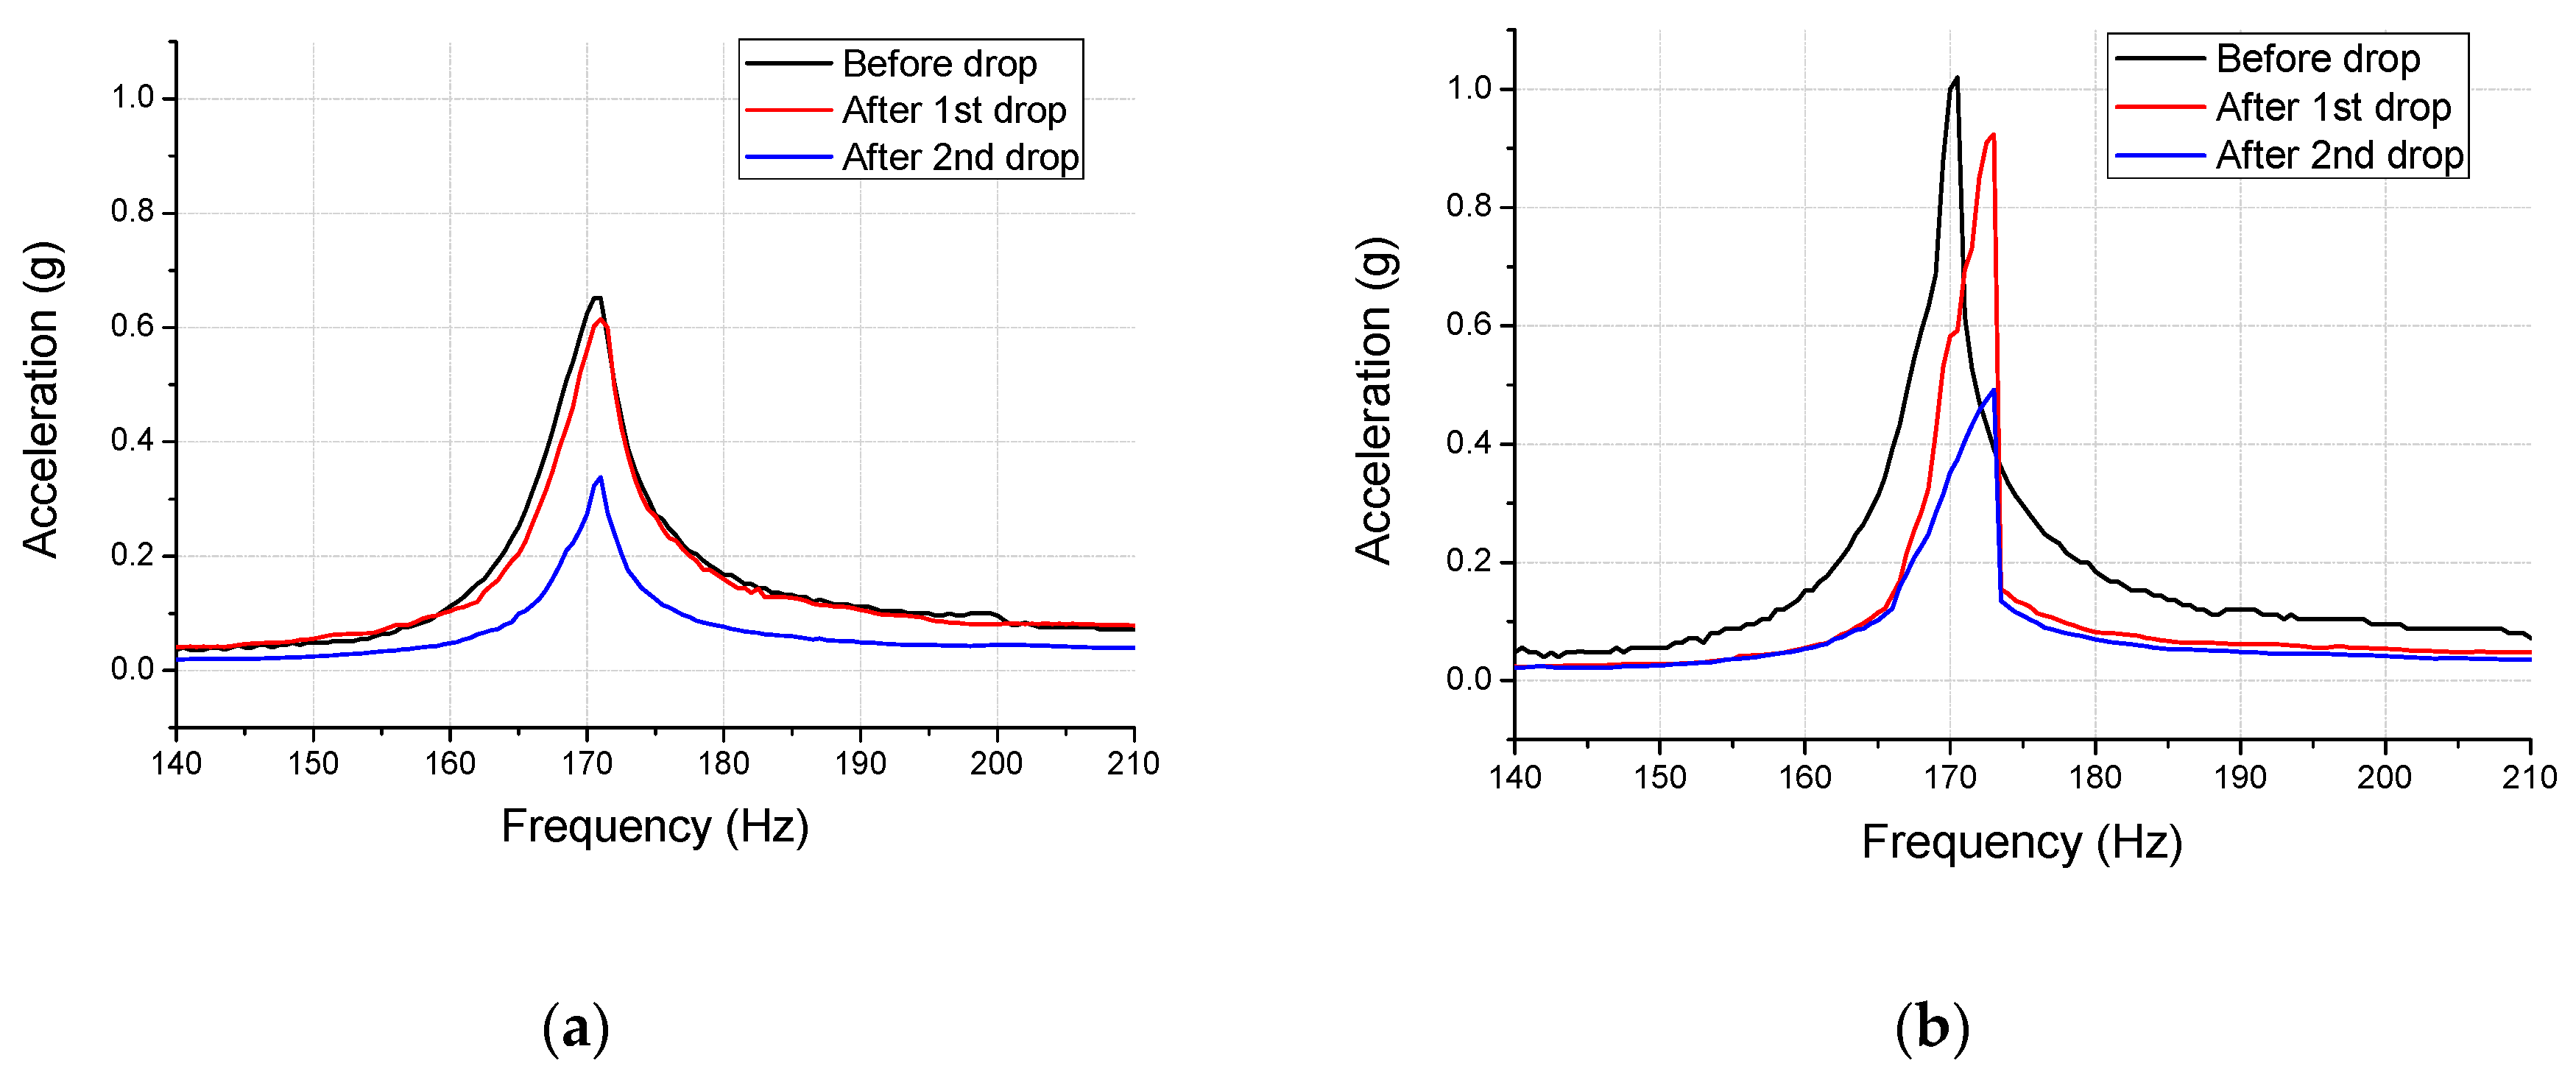
- (4)
- The acceleration changes after the first drop impact were different across the two specimens in the tests. The difference could be because of the increase in the number of variables in these experiments than analysis. Moreover, the plastic strain in the microscopic region may not possibly generate a variation in experimental acceleration. Due to the limited number of specimens used for the drop test, the statistical analysis of a greater number of experiments is needed for improved accuracy.
Author Contributions
Funding
Conflicts of Interest
References
- Goyal, S.; Buratynski, E.K. Method for Realistic Drop-Testing. Int. J. Microcircuits Electron. Packag. 2000, 23, 45–52. [Google Scholar]
- Lim, C.T.; Teo, Y.M.; Shim, V.P.W. Numerical Simulation of the Drop Impact Response of a Portable Electronic Product. IEEE Trans. Compon. Packag. Technol. 2002, 25, 478–485. [Google Scholar]
- Zhu, L. Modeling Technique for Reliability Assessment of Portable Electronic Product Subjected to Drop Impact Loads. In Proceedings of the 2003 Electronic Components and Technology Conference, New Orleans, LA, USA, 27–30 May 2003; pp. 100–104. [Google Scholar]
- Kim, J.G.; Park, Y.K. Experimental Verification of Drop/Impact Simulation for a Cellular Phone. Exp. Mech. 2004, 44, 375–380. [Google Scholar] [CrossRef]
- Karppinen, J.; Li, J.; Pakarinen, J.; Mattila, T.T.; Paulasto-Krockel, M. Shock impact reliability characterization of a handheld product in accelerated test and use environment. Microelectron. Reliab. 2012, 52, 190–198. [Google Scholar] [CrossRef]
- Mattila, T.T.; Vajavaara, L.; Hokka, J.; Hussa, E.; Makela, M.; Halkola, V. Evaluation of the drop response of handheld electronic products. Microelectron. Reliab. 2014, 54, 601–609. [Google Scholar] [CrossRef]
- Choi, B.; Kwon, J.; Jeon, Y.; Lee, M.G. Development of Novel Platform to Predict the Mechanical Damage of a Miniature Mobile Haptic Actuator. Micromach. 2017, 8, 156. [Google Scholar] [CrossRef]
- Johnson, G.R.; Cook, W.H. Fracture characteristics of three metals subjected to various strains, strain rates, temperatures and pressures. Eng. Fract. Mech. 1985, 20, 31–48. [Google Scholar] [CrossRef]
- Ludwik, P. Element der Technologischen Mechanik; Springer: New York City, NY, USA, 1909; pp. 1–57. [Google Scholar]
- Kolsky, H. An Investigation of the Mechanical Properties of Materials at very High Rates of Loading. Proc. Phys. Soc. Sect. B 1949, 62, 676–700. [Google Scholar] [CrossRef]
- Lee, W.; Zhang, C. Computational consistency of the material models and boundary conditions for finite element analyses on cantilever beams. Adv. Mech. Eng. 2018, 10. [Google Scholar] [CrossRef]
- LS-DYNA Keyword User’s Manual; Version 971; Livermore Software Technology Corporation (LSTC): Livermore, CA, USA; pp. 1–2206.


| Parameters | SUS304 | SUS301 |
|---|---|---|
| A (Initial yield strength) | 215 MPa | 1170 MPa |
| B (Hardening constant) | 1945 MPa | 1140MPa |
| n (Hardening exponent) | 0.34 | 0.37 |
| C (Strain constant) | 0.02 | 0.02 |
| Parameters | Al6061-T6 | Stainless Steel |
|---|---|---|
| A (Initial yield strength) | 270 MPa | 792 MPa |
| B (Hardening constant) | 138 MPa | 510 MPa |
| n (Hardening exponent) | 0.18 | 0.26 |
| C (Strain constant) | 0.002 | 0.014 |
| Part | Material | Density (kg/m3) | Bulk Modulus (GPa) | Shear Modulus (GPa) | Mass (g) |
|---|---|---|---|---|---|
| Spring | SUS301 | 7850 | 152 | 78 | 0.10 |
| Moving mass | Stainless steel 4340 | 7830 | 159 | 81 | 0.19 |
| Haptic housing | Stainless steel 4340 | 7830 | 159 | 81 | 0.41 |
| Dummy body | Aluminum 6061-T6 | 2804 | 69 | 26 | 53.86 |
| Dummy cover | Polycarbonate | 1300 | 2 | 1 | 29.57 |
| Sensor head | Stainless steel | 7850 | 169 | 73 | 155.29 |
| Specimen | Peak Acceleration (g) | Band Width at 0.5 g (Hz) | ||||
|---|---|---|---|---|---|---|
| Before Drop | After 1st Drop | After 2nd Drop | Before Drop | After 1st Drop | After 2nd Drop | |
| No. 1 | 0.65 at 171 Hz | 0.62 at 171 Hz | 0.34 at 171 Hz | 3.5 | 2.5 | 0 |
| No. 2 | 1.02 at 170.5 Hz | 0.92 at 173 Hz | 049 at 173 Hz | 4.5 | 3.5 | 0 |
© 2019 by the authors. Licensee MDPI, Basel, Switzerland. This article is an open access article distributed under the terms and conditions of the Creative Commons Attribution (CC BY) license (http://creativecommons.org/licenses/by/4.0/).
Share and Cite
Choi, B.; Choi, H.; Kang, Y.-s.; Jeon, Y.; Lee, M.G. 2-Step Drop Impact Analysis of a Miniature Mobile Haptic Actuator Considering High Strain Rate and Damping Effects. Micromachines 2019, 10, 272. https://doi.org/10.3390/mi10040272
Choi B, Choi H, Kang Y-s, Jeon Y, Lee MG. 2-Step Drop Impact Analysis of a Miniature Mobile Haptic Actuator Considering High Strain Rate and Damping Effects. Micromachines. 2019; 10(4):272. https://doi.org/10.3390/mi10040272
Chicago/Turabian StyleChoi, Byungjoo, Hyunjun Choi, You-sung Kang, Yongho Jeon, and Moon Gu Lee. 2019. "2-Step Drop Impact Analysis of a Miniature Mobile Haptic Actuator Considering High Strain Rate and Damping Effects" Micromachines 10, no. 4: 272. https://doi.org/10.3390/mi10040272
APA StyleChoi, B., Choi, H., Kang, Y.-s., Jeon, Y., & Lee, M. G. (2019). 2-Step Drop Impact Analysis of a Miniature Mobile Haptic Actuator Considering High Strain Rate and Damping Effects. Micromachines, 10(4), 272. https://doi.org/10.3390/mi10040272