1. Introduction
As the “heart” of a microfluidic system, micropumps play a significant role in fluidic transport. Due to the important functions of micropumps, many different principles have been designed to automate the transportation of a fluid [
1,
2,
3]. Depending on the power source, all micropumps can be divided into two categories: Externally-powered and self-powered micropumps. Additionally, all these micropumps have huge application prospects in a wide range of fields, such as drug delivery, blood transport, chemical and biological analysis, and electronic cooling [
4,
5].
Several types of self-powered micropumps have been developed over the last few years. These self-powered micropumps normally use gas diffusion/permeation [
6,
7,
8], surface tension [
9,
10], hydrostatic force [
11,
12], evaporation pressure [
13], or electrical forces [
14,
15,
16] to induce the fluid flow in microfluidic devices.
A self-powered micropump which depends on the permeability coefficient of a silicone [
17] or polydimethylsiloxane (PDMS) elastomer [
10,
18] to control its flow velocity has been proposed. Although this type of passive micropump has displayed good performance for stable sample transport, there are non-negligible shortcomings associated with this method. In the past few years, to achieve a stable flow velocity inside long microchannel during long term, a self-powered micropump that depends on the permeability coefficient of the silicone or PDMS elastomer to control the flow rate was proposed [
17,
18]. Because this type of micropump has an advantageous performance for stable liquid transport, even inside long microchannel concerning 3D channel-configuration and high temperature condition, there is a non-negligible shortcoming that the self-powered flow is virtually automated by the gas permeability of the silicone [
17] or PDMS wall [
18], but the specified permeability coefficient of silicone or PDMS is determined by the size distribution of mini-pores in the elastomer, which usually varies from the fabrication process, curing conditions, and the production batch, and thus increases the difficulty in accurately controlling the passive flow rate.
Recently, the authors have introduced a novel pumping principle and method for application in both the passive and stable velocity transport of a liquid [
19,
20]. This was achieved by applying an end-open gas-impermeable quartz tube to automate the flow for the first time. Although the pump benefitted from this improvement, the flow velocity was fixed for the same pressure, as long as the inner diameter and the length of the quartz tube was fixed. So, there is no need to worry about the variance of the permeability coefficient of silicone or a PDMS elastomer which can be easily influenced by differences in the fabrication process. However, this method still has some non-negligible disadvantages. Firstly, the inner diameter of the tail quartz tube is too small to be able to let the liquid flow smoothly; so, when the liquid enters the quartz tube, there is a great possibility that it will jam the tube and influence the flow velocity of the latter part of the liquid plug. Secondly, the size of the quartz tube is limited and can only be obtained with set inner diameter sizes such as 10 µm, 25 µm, and 50 µm. This means that it is difficult to precisely control the flow and achieve the desired results.
A new method of stretching the Teflon tube at the end of the system to four times its original length to achieve precise control of the flow velocity has been proposed in this paper. This method has not only inherited the advantages of the previous methods, but it also avoids their shortcomings. It is known from Hagen-Poiseuille’s law that when a 15 cm-long Teflon tube (ID = 0.3 mm, OD = 0.6 mm) is stretched to four times its original length, the flow resistance that it causes is the same as that of a 6 cm-long quartz tube (ID = 25 µm). The purpose of using stretched tube instead of quartz tube is to solve the problem that the fluid velocity changes greatly after the liquid enters the smaller diameter quartz tube (ID = 25 µm). Previous experiments showed that when liquid with different viscosities flows to the entrance of the quartz tube, the flow rate changes greatly [
19,
20]. The reason for this phenomenon is that the inner diameter of the interface between quartz tube and Teflon tube has changed dramatically, due to a sudden great change of the resistance at the junction. In order to ensure that the flow velocity of the fluid inside the Teflon tube with different viscosities does not change when they flow into tubes with smaller diameters, the method of stretching the original tubes is adopted, which can not only provide the fluid resistance that the quartz tube do, but also make the inner diameter of pipeline change continuously instead of suddenly becoming smaller. In this way, the problem of fluid velocity instability in the Teflon tube caused by different viscous liquids entering the tube could be solved.
Therefore, a series of experiments were designed to verify the feasibility of this method by exploring the effect of a liquid’s viscosity and pressure on flow control, and the system was applied to both continuous-flow and real-time polymerase chain reactions (PCRs). The results that have been demonstrated in this paper showed that the proposed method is totally feasible, and it can not only achieve steady flow control of a liquid, but the design of the end of the system is flexible enough to realize any flow velocity requirements under almost any conditions.
2. Principle
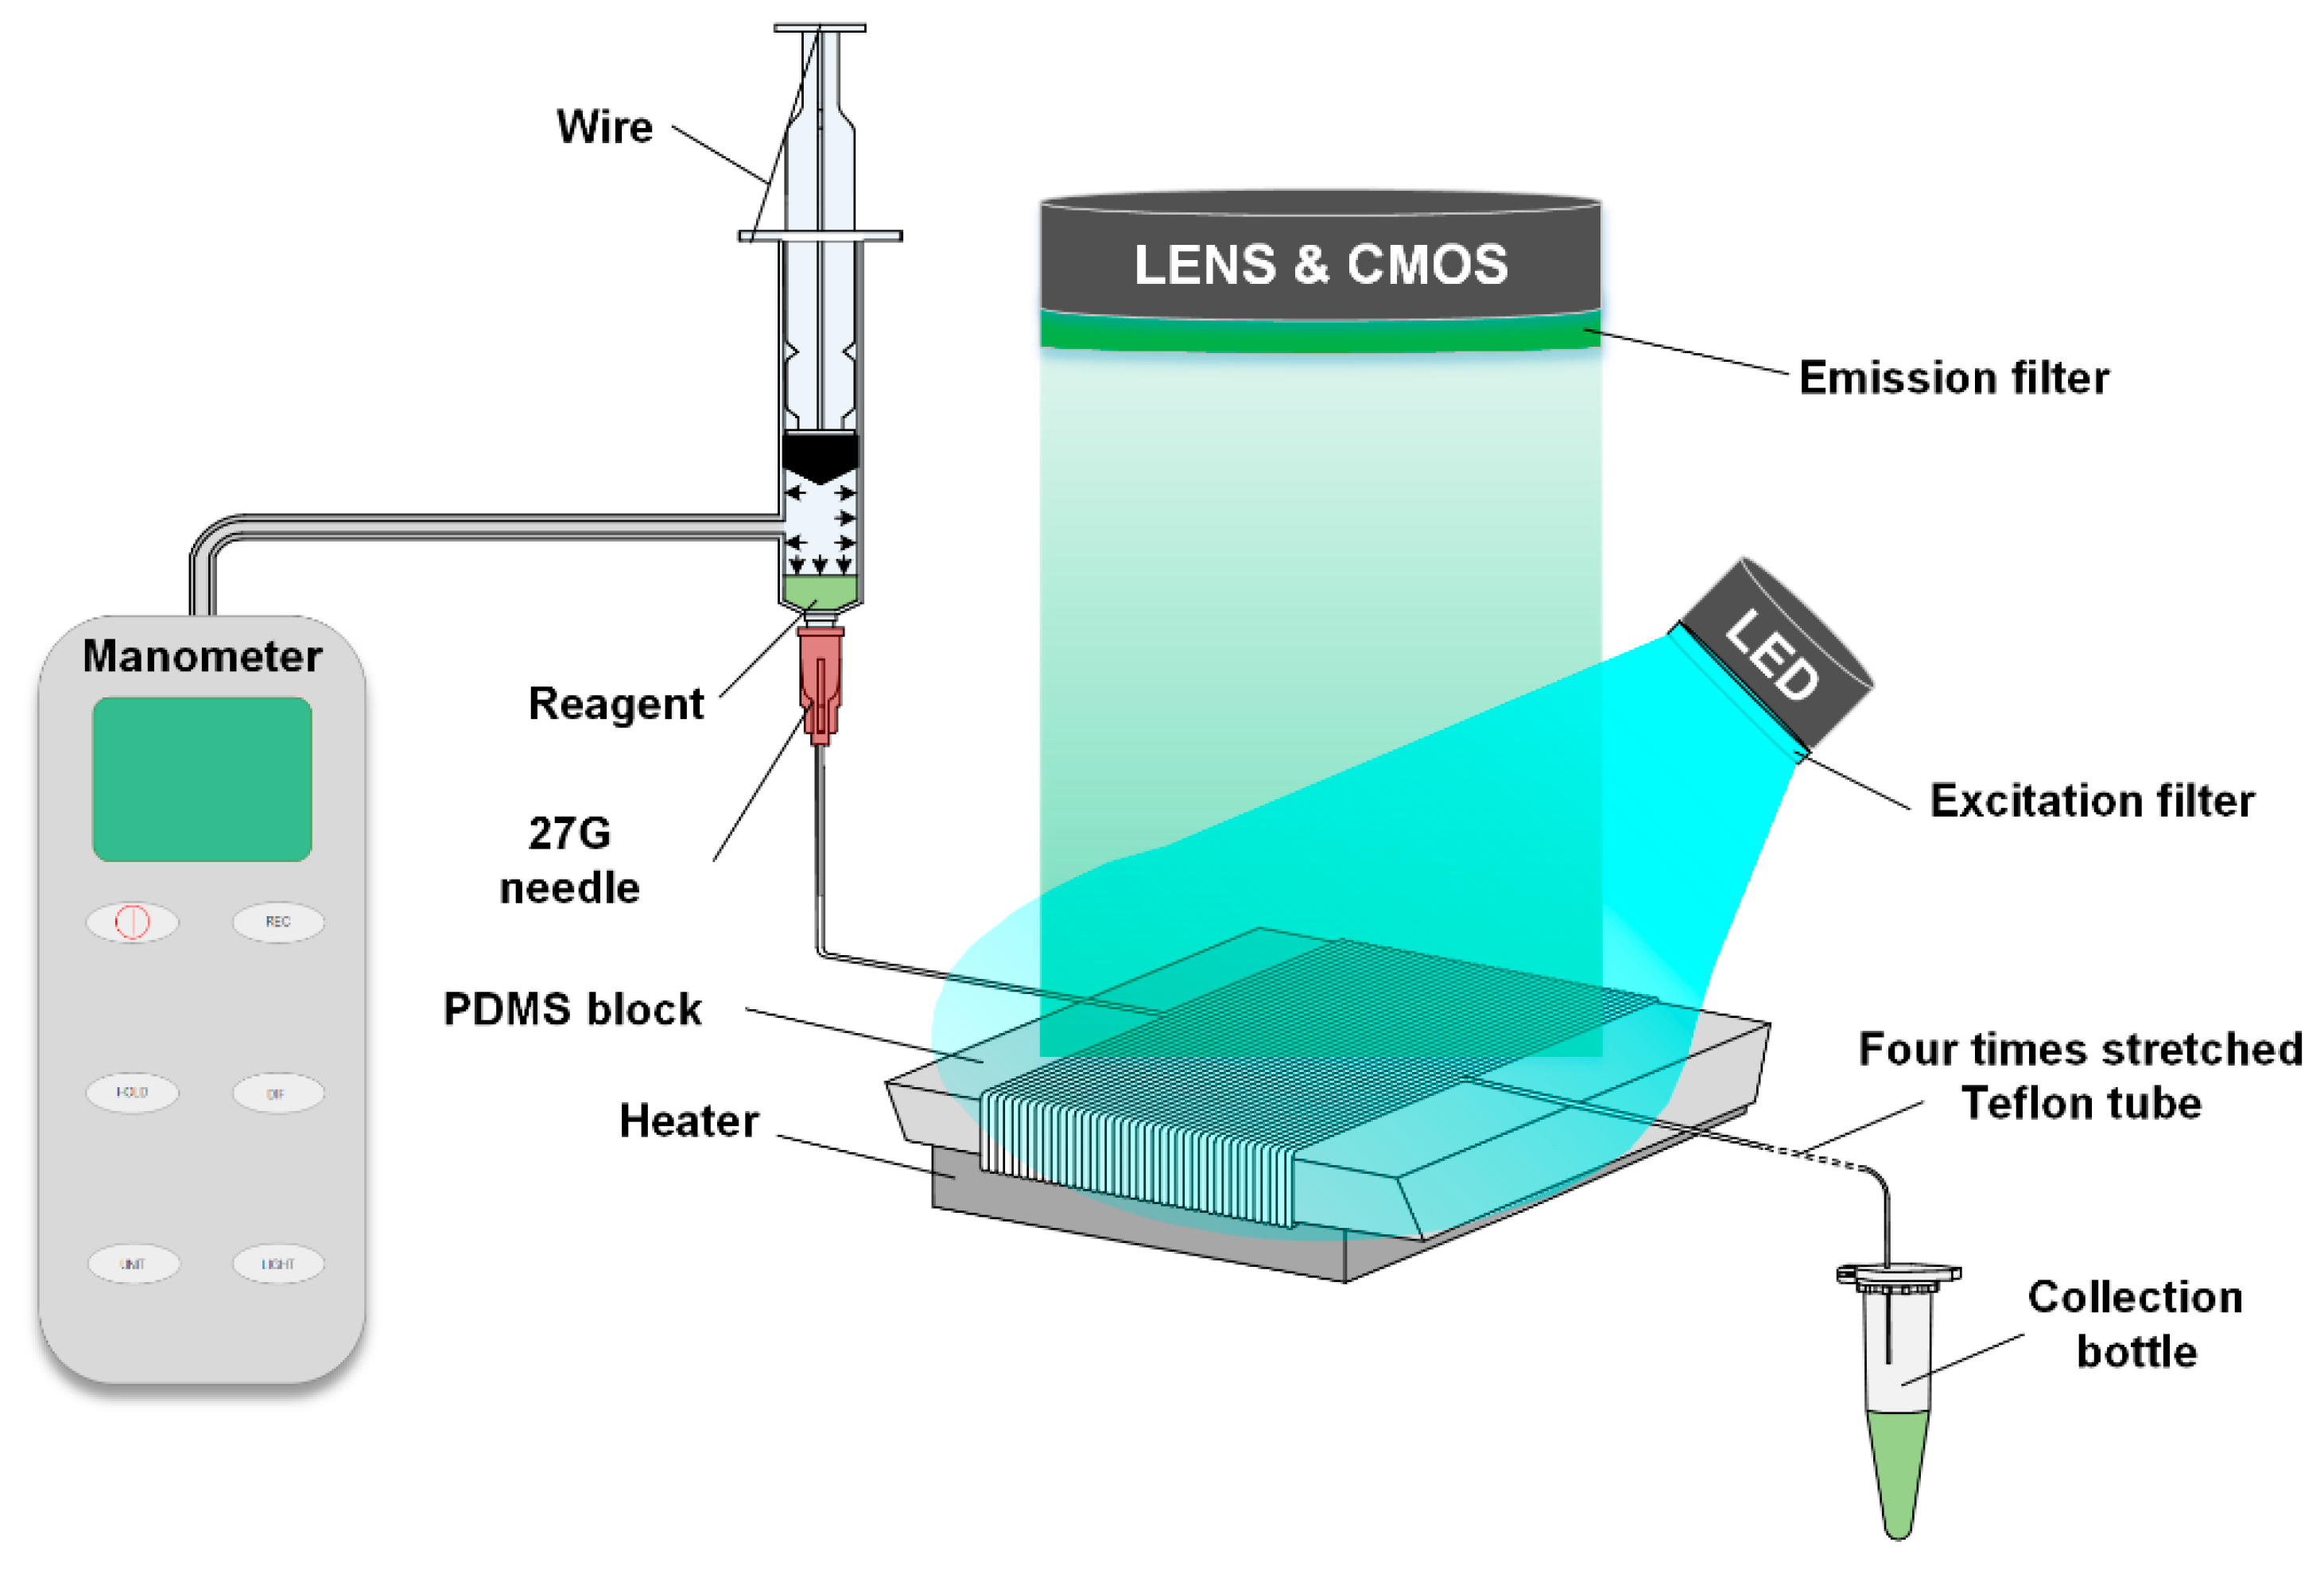
Figure 1 has shown a diagram of the actuation mechanisms of the end-open self-activated micropump system. The system is based on the air permeability from the fluidic conduit to the atmosphere. Since the pressure of the compressed air inside the fluidic conduit is much higher than the external atmospheric pressure, the air molecules inside the channel tend to penetrate through the hollow channel of the stretched Teflon tube to the outside atmosphere. The permeation of the air only occurs at the site of the outlet of the Teflon tube which causes a decrease of the air molecules’ mole-number in the anterior end of the sample plug. This can be calculated using the following equations:
where
is diffusion rate,
is equivalent diffusion coefficient,
is inner air molecule concentration in the anterior end of sample plug,
represents the air pressures in the anterior end of the reagent,
is air molecule concentration of ambient atmosphere,
is diffusion distance and can be represented by the length of the stretched Teflon tube,
is the average diffusion area,
is the diameter of the stretched Teflon tube,
is the correction coefficient between actual condition and an ideal condition.
is the air pressures in the posterior end of the reagent,
is the pressure gradient imposed in the reagent.
It can be regarded as an equivalent condition when the fluidic-flux and air-molecule-penetration is the same with each other, producing the constant pressure
Suppose the microchannel is column-configuration, then
where
is the velocity of the microfluidic,
is the radius of the microchannel,
is the pressure gradient across the hollow channel of the stretched Teflon tube connecting the microchip to the atmosphere. Easily seen, the flow rate decreases if the radius of the microchannel increases.
Besides, it is known from Hagen-Poiseuille’s law which can be written as follows [
21]:
where
is the pressure difference,
R is the inside radius of the tail Teflon tube,
µ is the viscosity coefficient of the liquid,
l is the length of the tail Teflon tube and u is the flow velocity. Therefore, it can be calculated that when a 15 cm-long Teflon tube (ID = 0.3 mm, OD = 0.6 mm) is stretched to four times its original length, the flow resistance of the tube will be the same as a 6 cm-long quartz tube (ID = 25 µm).
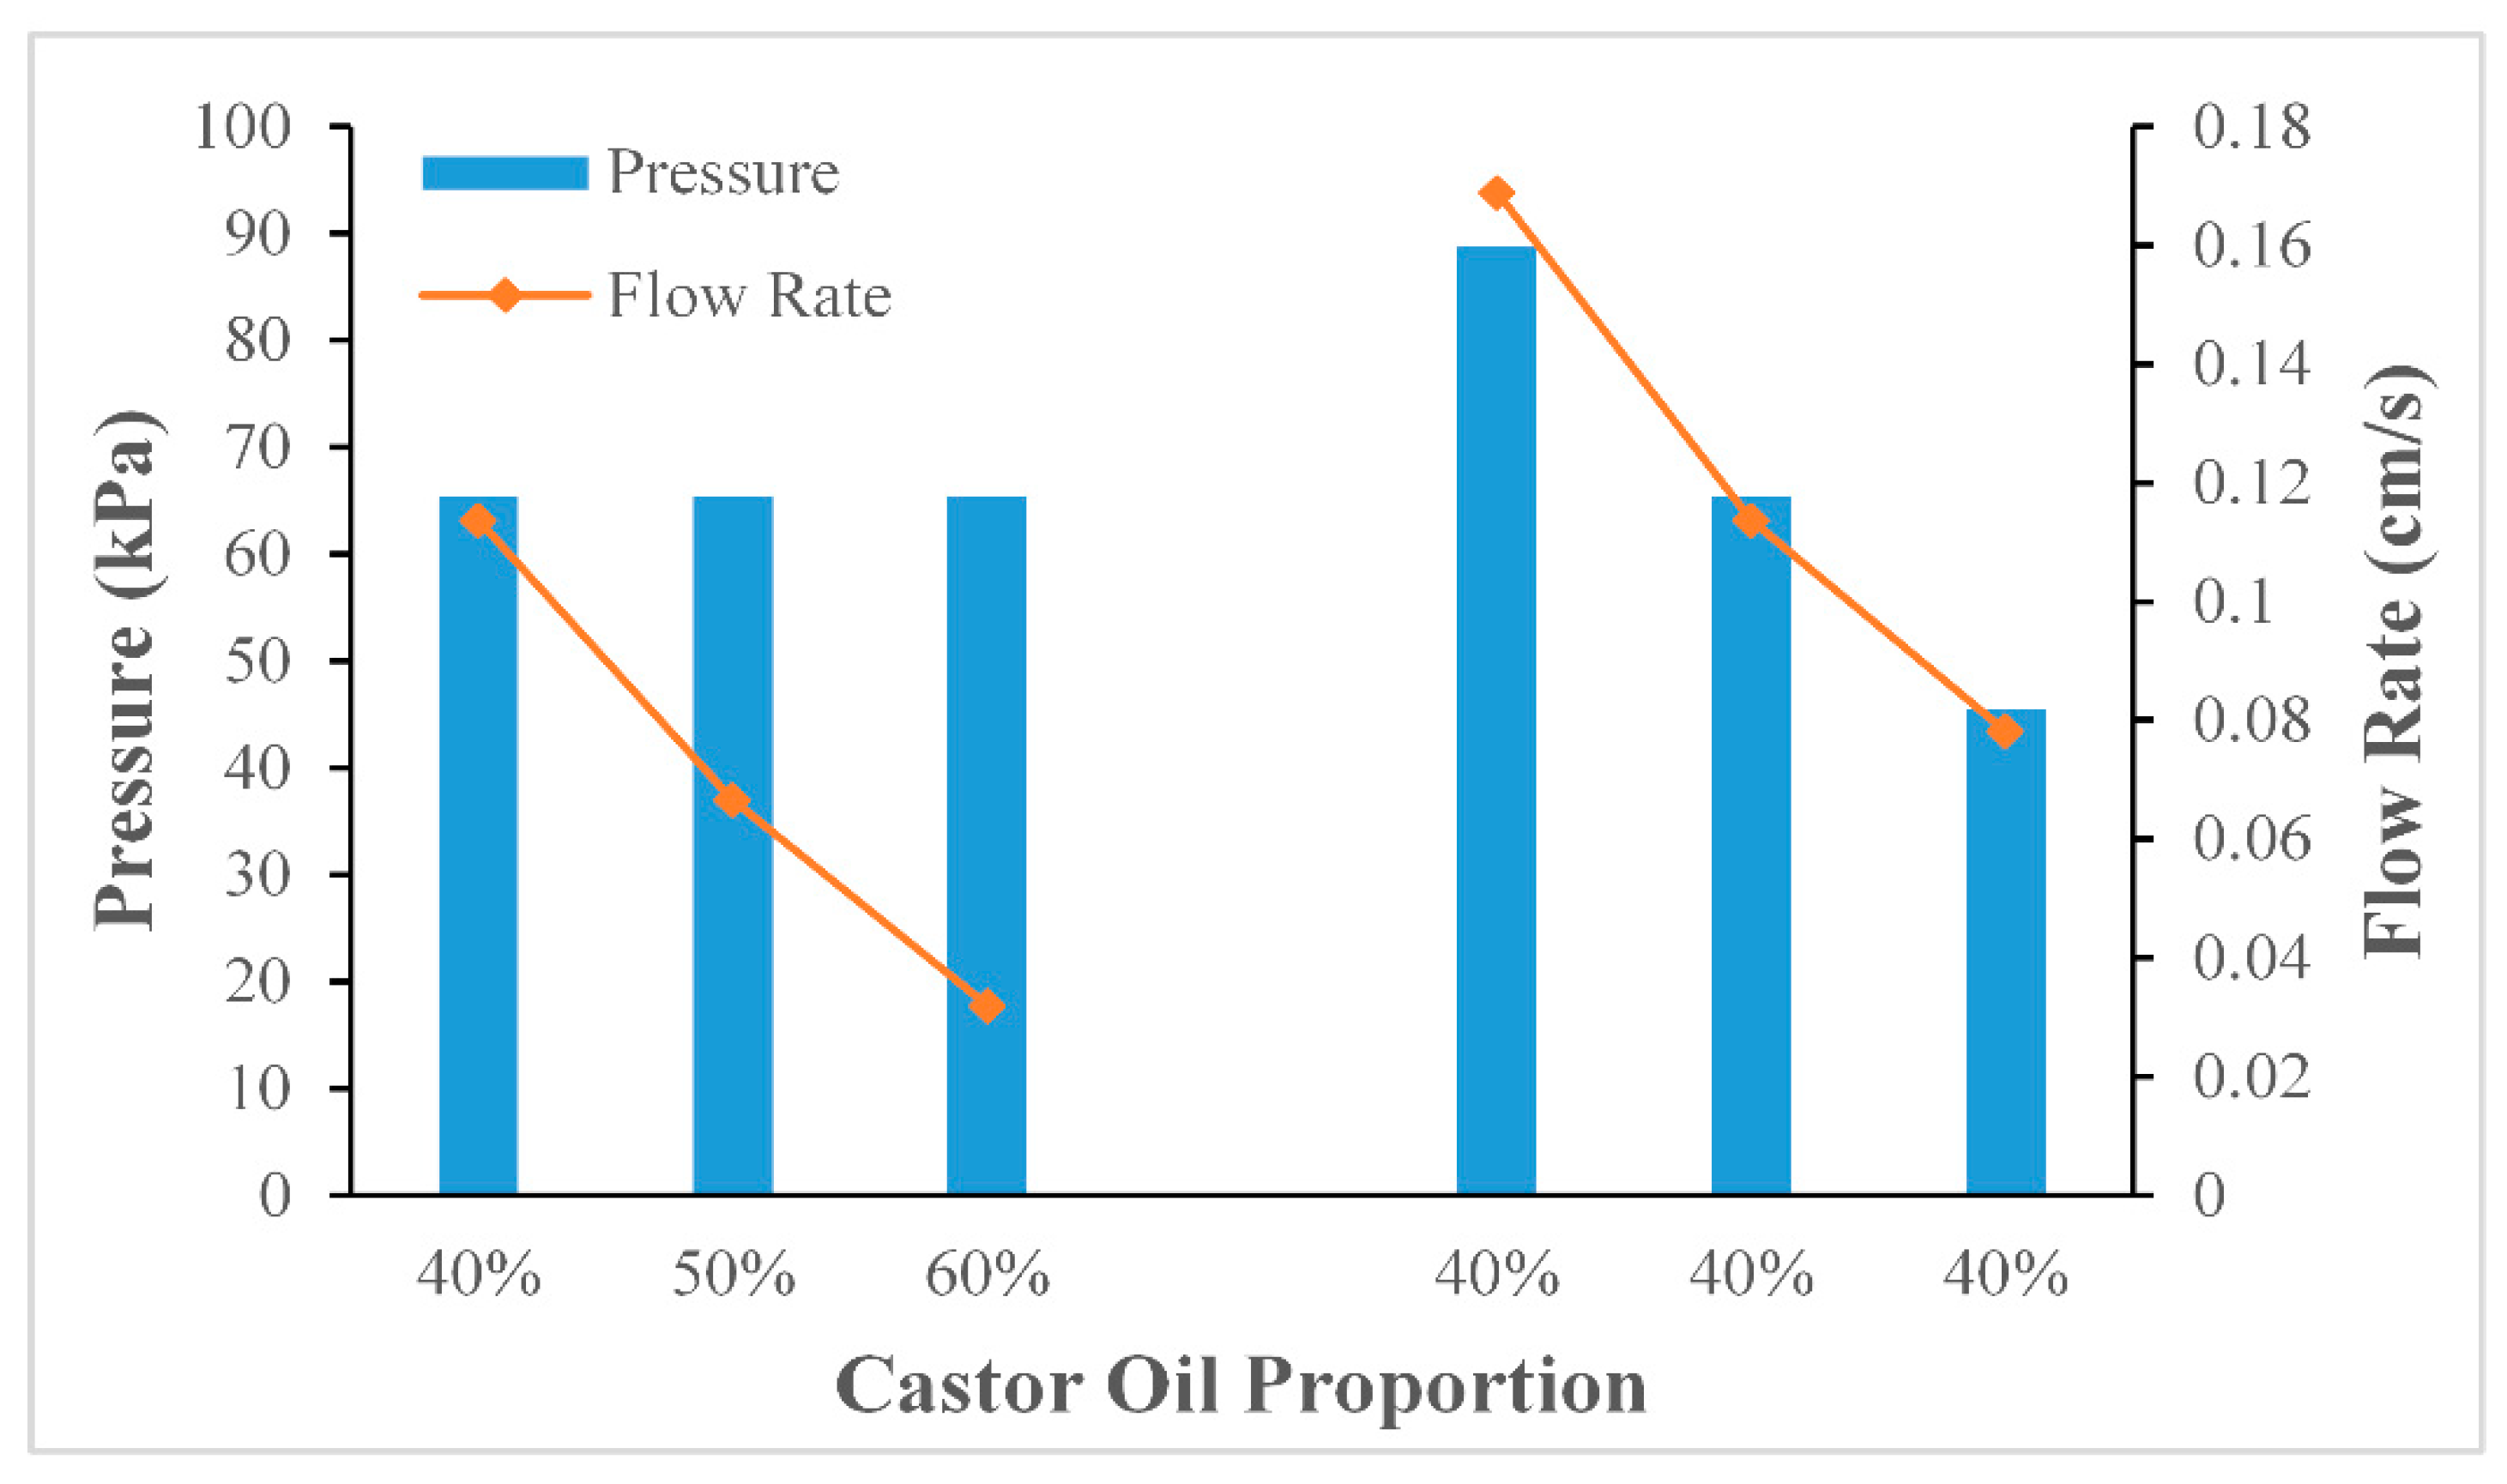
What is more, an experiment was designed by the authors to test the effect of both viscosity and pressure on the flow velocity. Based on Equation (7) it can be known that the flow velocity increases as the viscosity of the oil mixture decreases and that the flow velocity increases as the pressure increases [
22,
23].
It is noteworthy that the principle we proposed applies only to ideal gases, and the experimental results may be slightly different from the theoretical predictions. Besides, the influencing factors of fluid flow at nanoscale, such as the Darcy-Weisbach friction factor [
24,
25], only has negligible influence on our experiment, since the inner and outer diameters of the Teflon tubes we used are 0.3 mm and 0.6 mm, respectively. After being four times stretched, the inner and outer diameters of the stretched Teflon tubes are 0.16 mm and 0.32 mm, respectively. This showed that the size of our Teflon tubes did not reach nanoscale, but micron-scale. So, the phenomenon will not be taken into account in this paper.
3. Experimentation
3.1. Flow Experiment
As shown in
Figure 1, a system was assembled to verify the performance of the liquid transportation. During the assembly of the system, the Teflon tube (ID = 0.3 mm, OD = 0.6 mm) was wrapped around a PDMS block 40 times. The PDMS block was fabricated using a cooper mold with a trapezoidal cross section, and the widths of the top and the bottom surfaces were 35 mm and 10 mm, with the height and length set to be 13.5 mm and 50 mm, respectively. Because a trapezoidal shape block can easily achieve the proper reaction time for PCR reaction under a constant flow speed. Approximately 15 cm of the Teflon tube was saved at the end of the system and then stretched to four times its original length to 60 cm (ID = 0.16 mm, OD = 0.32 mm). The purpose of using PDMS was because it does not have a good thermal conductivity, so that we can achieve the optimum reaction temperature of the PCR reagent at a lower altitude. The advantage is that the distance between a high and low temperature cycle of the PCR reagent decreases, and the total flow time of the whole PCR reaction decreases.
During the flow assays, the device set-up consisted of a 10 ml syringe, a 27 G needle, and an iron wire. Then, 100 µL of a castor oil mixture, 20 µL of reagent and 900 µL of a castor oil mixture were sequentially added to the 27 G needle. The system was then activated by depressing the plunger of the syringe to a certain point, which was then fixed using the iron wire. During this procedure, the Teflon tubing is connected to the syringe. And the end of the tubing is not blocked during the depression of the plunger. Before connecting the syringe and the Teflon tube, the tube is filled with oil, then a small dose of the oil phase is added to the syringe, and a certain amount of reagent is injected into the syringe. After these procedures, the syringe and the Teflon tube are connected. After the system is assembled, the syringe is compressed and fixed with iron wire, and the liquid flow is driven by the pressure difference between inside and outside of the system.
Two groups of experiments were then designed to explore the flow of the liquid plug under different conditions.
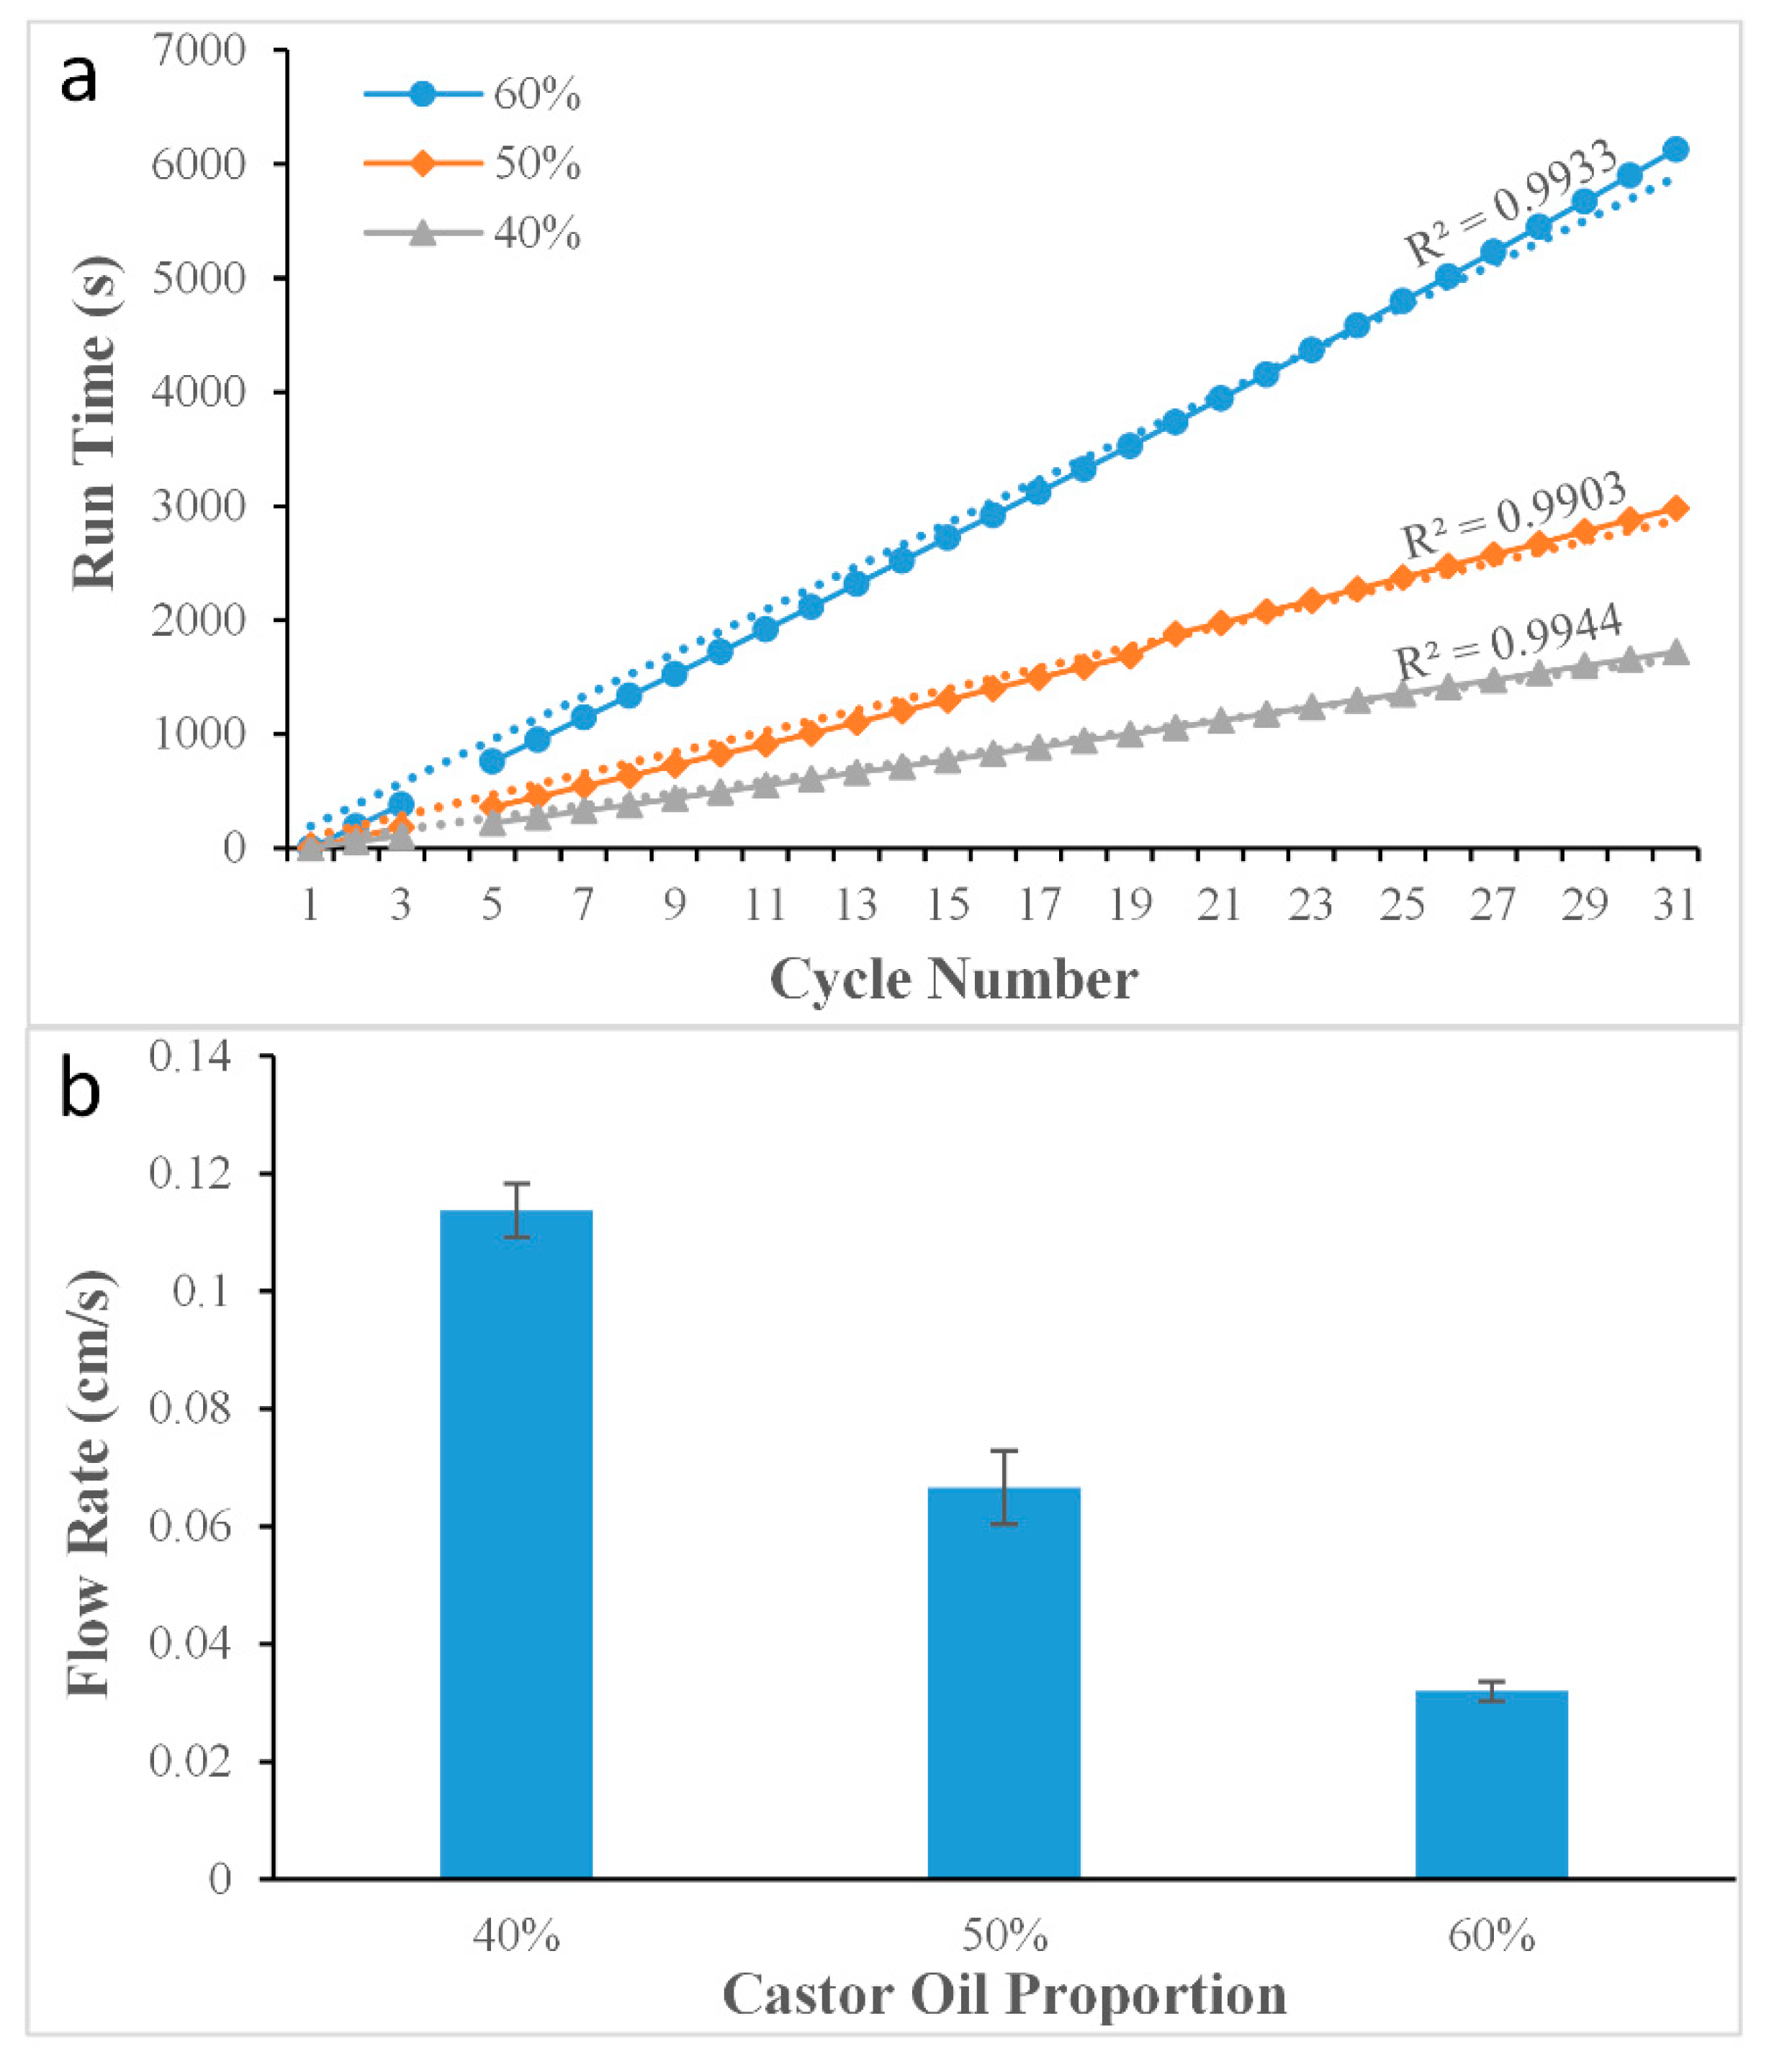
1. Experiment on changing the viscosity of the oil phase
The experiment was carried out using three different proportions of the castor oil and isopropyl palmitate mixture which had different viscosities. In order to maintain the other control parameters at the same values, the temperature was set at 30 °C, and the pressure was set at 71.6 kPa. Each experiment was then carried out three times. In order to ascertain the relationship between the mixing ratio and the viscosity, a viscometer (LICHEN TECH, NDJ-1, Zhejiang, China) was used to measure the parameters. The experimental results have been shown in
Table 1.
2. Experiment on changing the pressure in the syringe
The experiment was carried out with three different pressure values. In order to maintain the other control parameters at the same values, the temperature was set at 30 °C, and the mixing ratio of the oil mixture was 40%, which meant the viscosity was 21.7 mPa·s. Each experiment was then carried out three times.
3.2. Application in Continuous-Flow on-Chip PCRs
After the aforementioned flow experiments, the system was tested for application in continuous-flow on-chip PCRs. The pressure in the syringe was set at 71.6 kPa by adjusting the piezometer. The mixing ratio of the oil mixture was 40%, and all the connections were sealed using silicone adhesive.
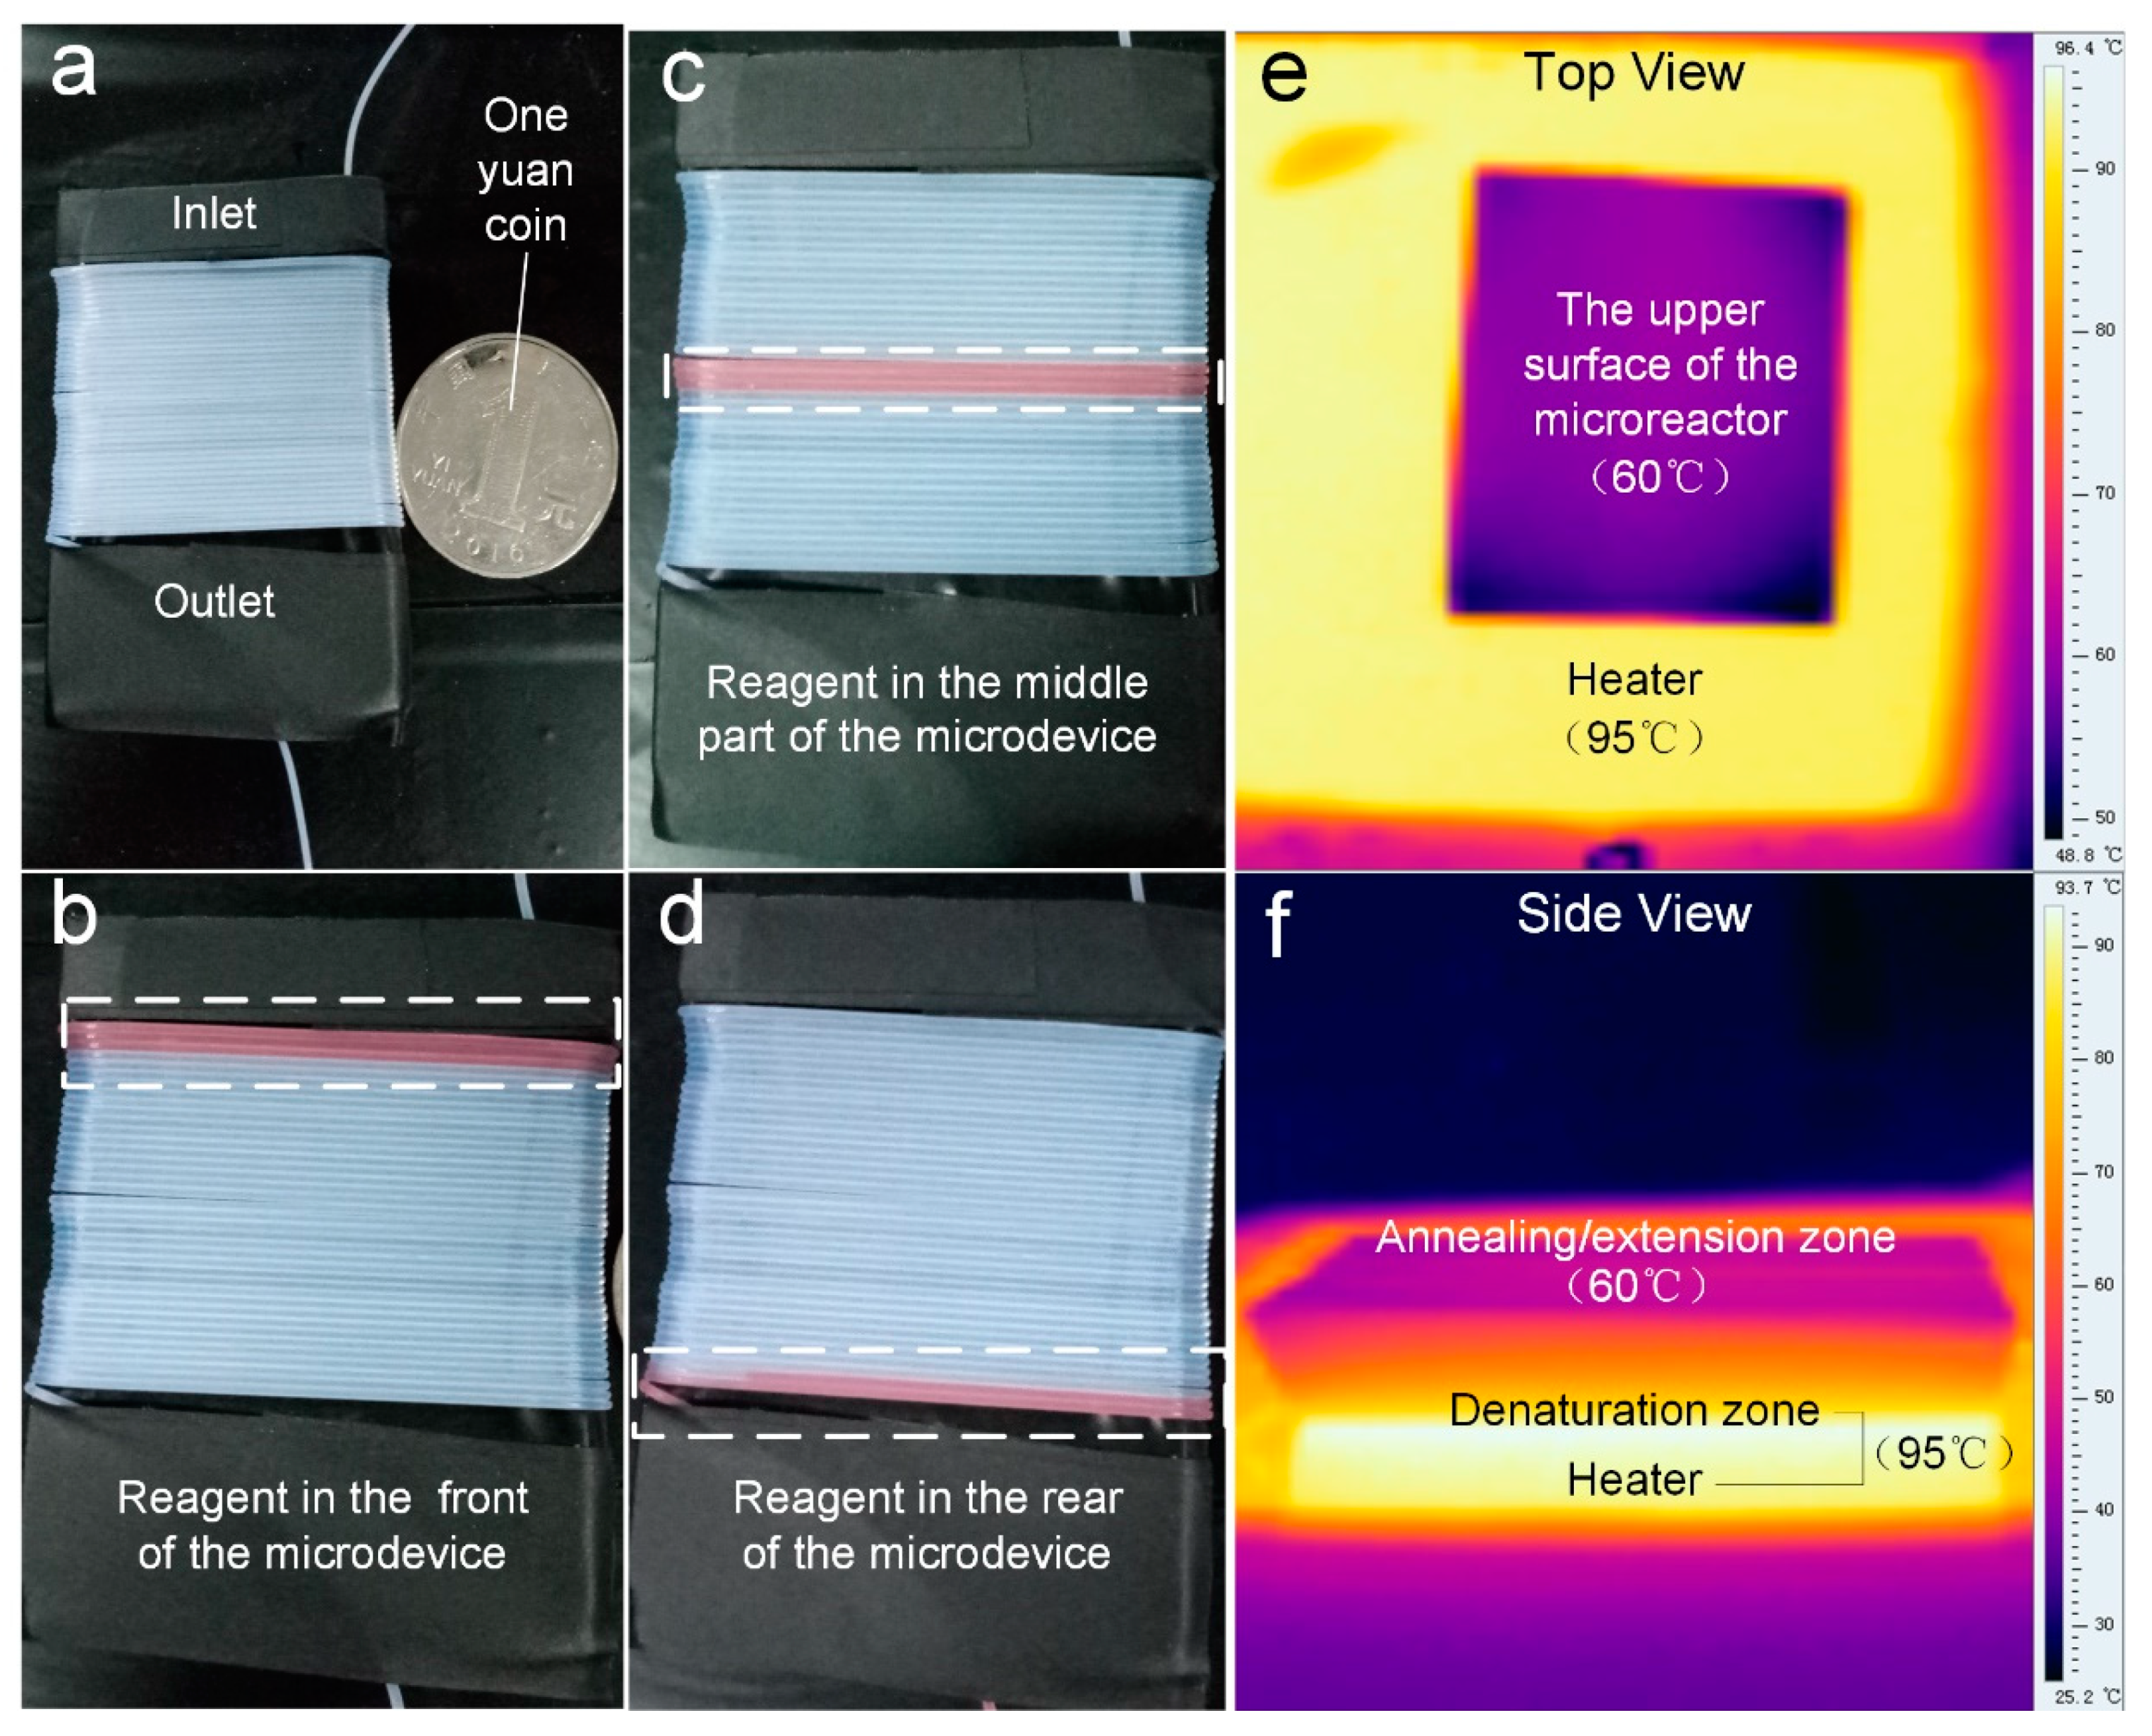
As for temperature control, a single heater was used to achieve the thermal cycle requirements by controlling the temperature gradient of the PDMS block. In order to make sure the temperatures of the upper and lower surfaces were suitable for continuous flow microfluidic PCRs, an infrared (IR) camera (Fotric 220, ZXF Laboratory, Dallas, TX, USA) was used to monitor the temperature of the PDMS block. The tube wrapped around PDMS block was placed on the top of the 95 °C heater (JXMINI-80, Jingxin Tech, Shanghai, China). As shown in
Figure 2, the result showed that the entire PDMS block was able to reach a temperature that was suitable for the PCR reaction.
In order to prove that the system could be successfully used for continuous flow PCRs, a commercial PCR cycler (CFX Connect, Bio Rad, Hercules, CA, USA) was taken as a reference. By comparing the results of the two devices, the function of this system could be verified.
The DNA fragment of the pGEM-3Zf (+) plasmid was amplified using the microreactor. The primer sequences for amplifying the gene fragment of pGEM-3Zf (+) were as follows: 5′ CCA GTC GGG AAA CCT GTC GTG CC 3′ (forward) and 5′ GTG AGC GAG GAA GCG GAA GAG CG 3′ (reverse). The PCR reagent was composed of 1× SYBR Premix Ex TaqII, 0.075 U µL−1 TaKaRa EX Taq, 0.6 mg mL−1 BSA (AS25483; AMEKO, Dalian, China), 1 µM of forward and reverse primers, and 0.03012 ng·µL−1 of template. Each test requires 20 µL of reagent.
3.3. Real-Time Fluorescence Detection
By comparing the intensity of the fluorescence and the products resulting from the commercial PCR cycler and the microdevice, we can prove that the system could be used for real-time continuous flow PCRs.
The DNA fragment of the H7N9 was amplified using the microreactor. The primer sequences for amplifying the gene fragment of H7N9 were as follows: 5′ TAC AGA CAA TCC CCG ACC GA 3′ (forward) and 5′ GCC AAG TGT TAG CCC CAT CC 3′ (reverse). The PCR reagent was composed of 1× SYBR Premix Ex TaqII, 0.075 U µL−1 TaKaRa EX Taq, 0.6 mg mL−1 BSA (AS25483; AMEKO, China), 1 µM of forward and reverse primers, and 107 to 105 copies per µL DNA template.
The fluorescence detection unit that was assembled consisted of a 48W LED array (XPE60W, Cree, Durham, NC, USA), and a digital camera (Canon EOS 7D, Canon, Tokyo, Japan). A 480 nm narrowband filter was fixed in front of the LED array to provide the excitation light, and a 520 nm narrowband filter was fixed in front of the camera lens. The camera was connected to the laptop and automatically took a photo every 20 s. The fluorescent images were captured by the aforementioned digital camera, with parameters that were set as follows: F = 2.8, M = 1/20, and ISO = 2000. The ImageJ software was used to process the images and to distinguish the light from the surroundings. By calculating the light intensity of the liquid plug in each cycle, the fluorescent intensity curve of the PCR’s amplification could be obtained.


