The Effects of Incremental Doses of Aflatoxin B1 on In Vitro Ruminal Nutrient Digestibility and Fermentation Profile of a Lactating Dairy Cow Diet in a Dual-Flow Continuous Culture System

 , , , , , ,
Abstract
1. Introduction
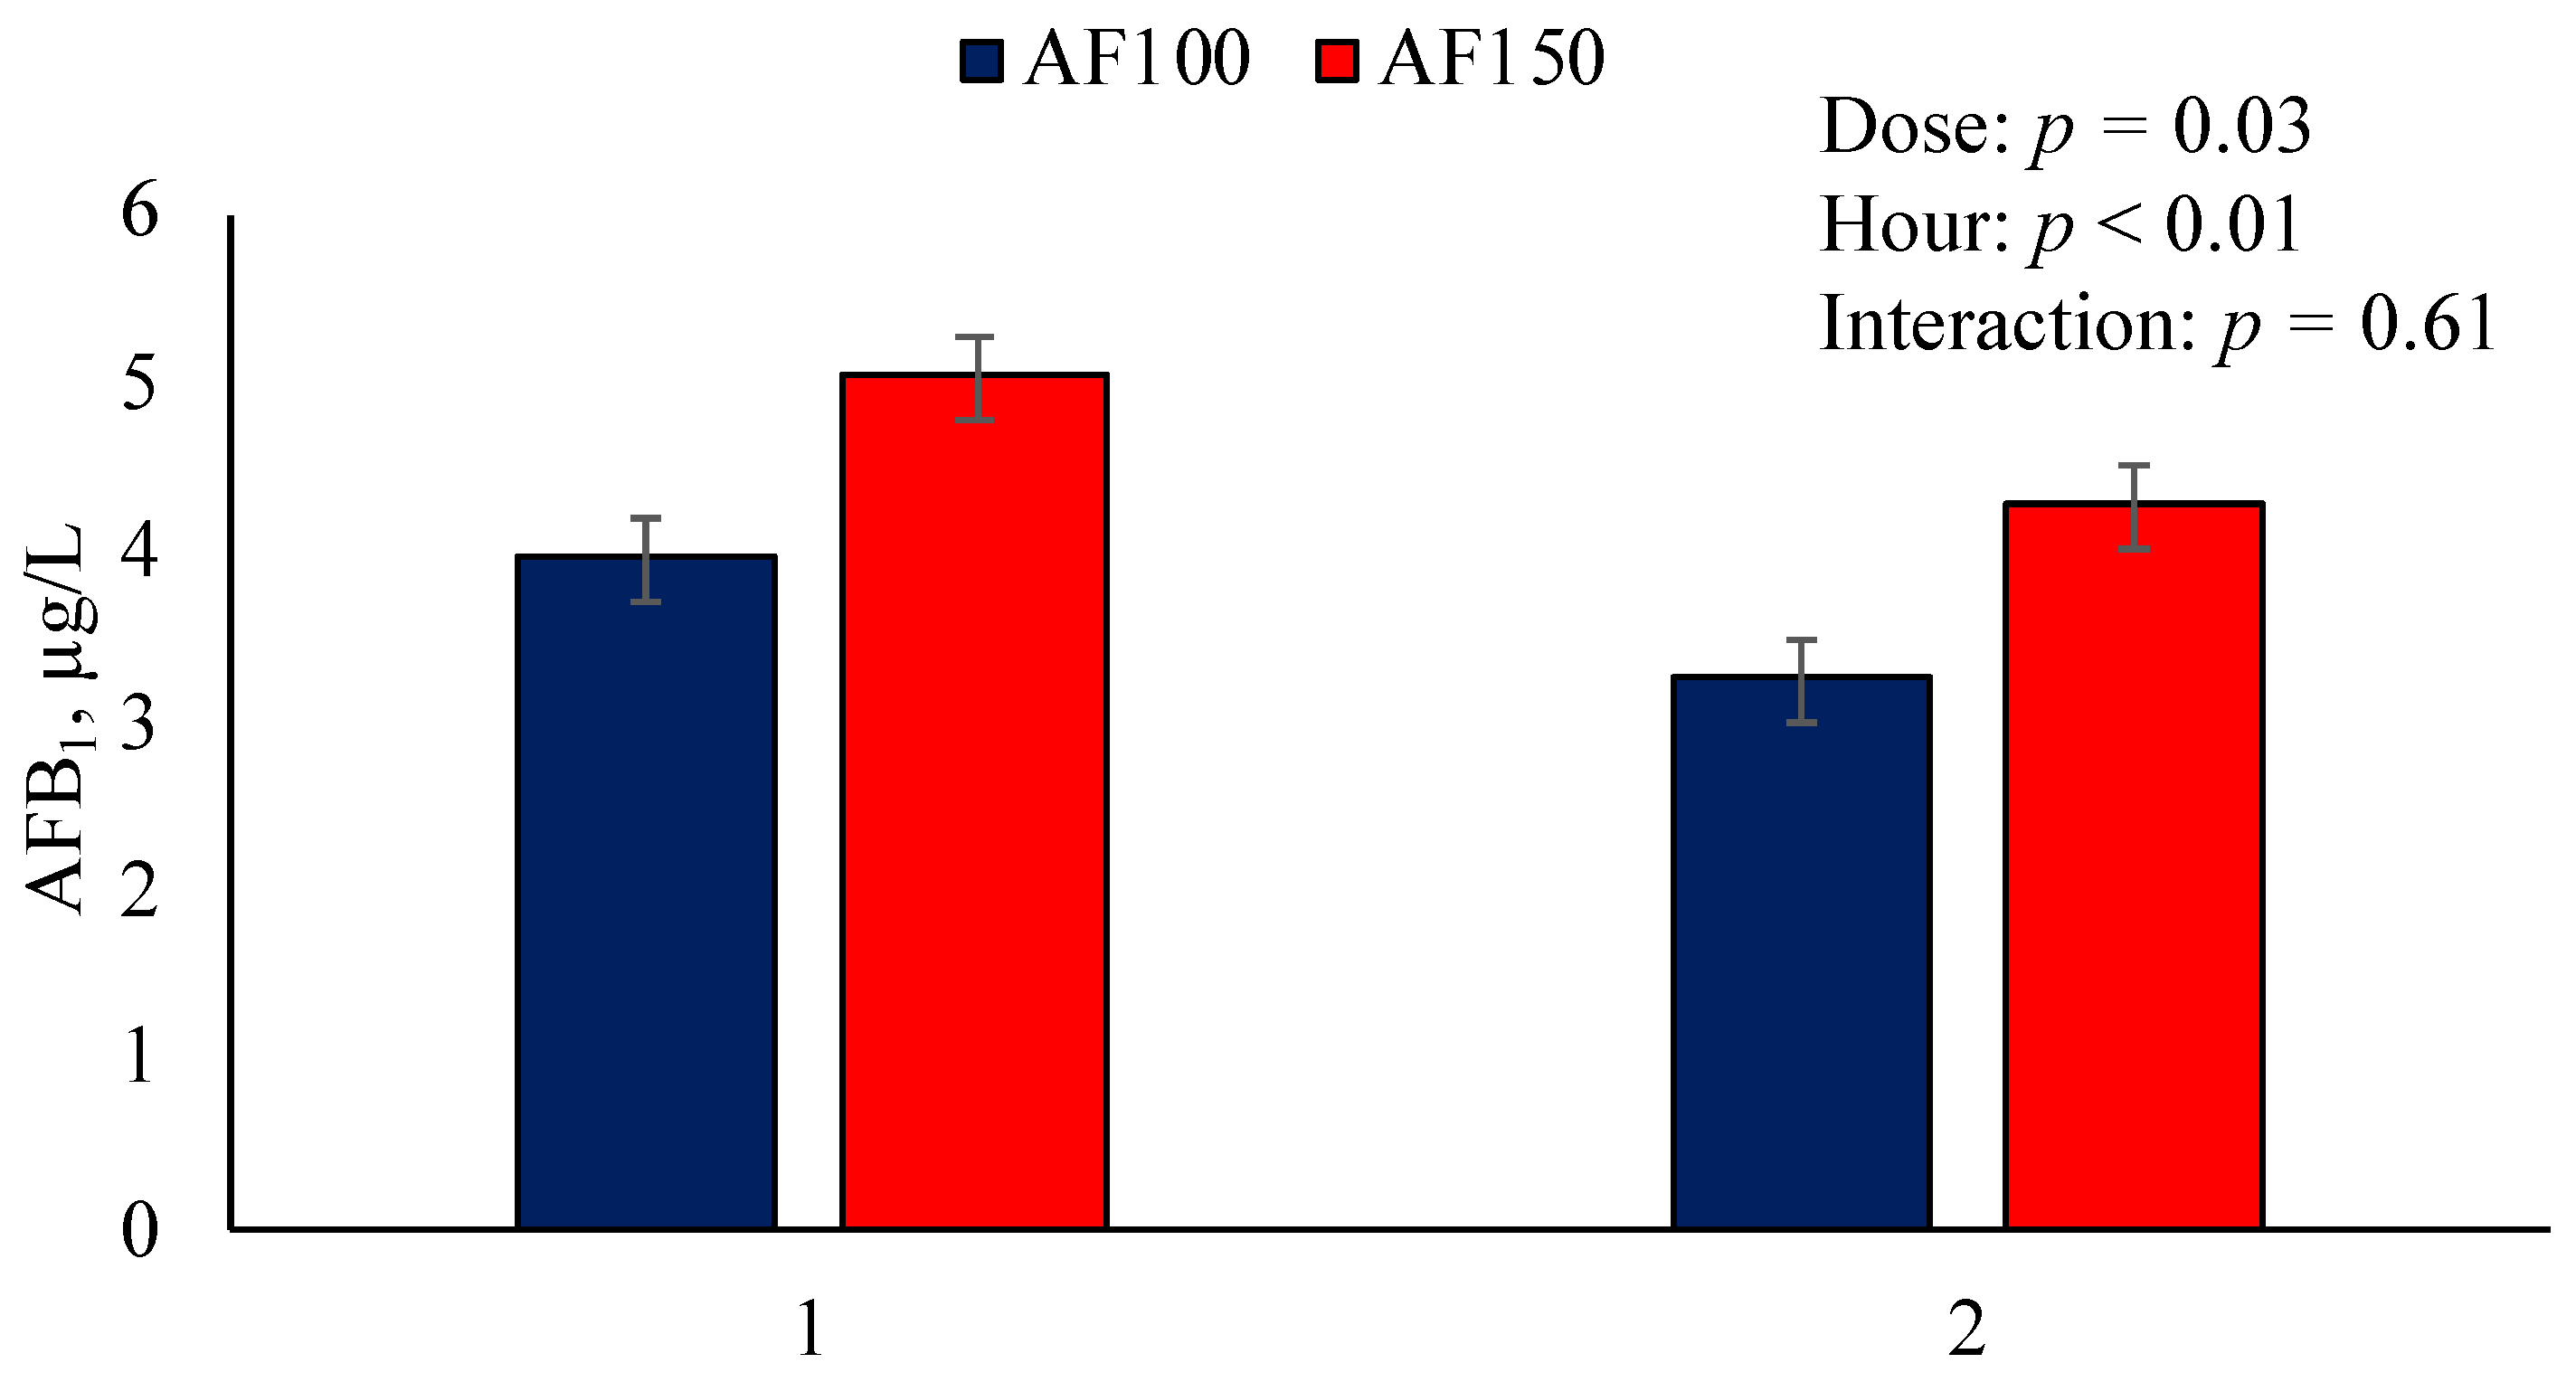
2. Results
3. Discussion
4. Conclusions
5. Materials and Methods
5.1. Experimental Design, Treatments, and Diet
5.2. Dual-Flow Continuous Culture System Operation and Experimental Period
5.3. Fermentation Profile
5.4. Nutrient Digestibility
5.5. Microbial Protein Synthesis and Ruminal N Metabolism
5.6. Aflatoxin B1 Ruminal Recovery
5.7. Statistical Analysis
Supplementary Materials
Author Contributions
Funding
Institutional Review Board Statement
Informed Consent Statement
Data Availability Statement
Acknowledgments
Conflicts of Interest
References
- Diener, U.L.; Cole, R.J.; Sanders, T.H.; Payne, G.A.; Lee, L.S.; Klich, M.A. Epidemiology of Aflatoxin Formation by Aspergillus Flavus. Ann. Rev. Phytopathol. 1987, 25, 249–270. [Google Scholar] [CrossRef]
- Hartley, R.D.; Nesbitt, B.F.; O’Kelly, J. Toxic Metabolites of Aspergillus Flavus. Nature 1963, 198, 1056–1058. [Google Scholar] [CrossRef]
- Allcroft, R.R.; Carnaghan, B.A. Groundnut toxicity: An examination for toxin in human food products from animals fed toxic groundnut meal. Vet. Rec. 1963, 75, 259–263. [Google Scholar]
- Ráduly, Z.; Szabó, L.; Madar, A.; Pócsi, I.; Csernoch, L. Toxicological and Medical Aspects of Aspergillus-Derived Mycotoxins Entering the Feed and Food Chain. Front. Microbiol. 2020, 10, 2908. [Google Scholar] [CrossRef]
- Peles, F.; Sipos, P.; Kovács, S.; Gyori, Z.; Pócsi, I.; Pusztahelyi, T. Biological Control and Mitigation of Aflatoxin Contamination in Commodities. Toxins. 2021, 13, 104. [Google Scholar] [CrossRef]
- FDA (Food and Drug Administration). Bad Bug Book: Food-Borne Pathogenic Microorganisms and Natural Toxins, 2nd ed.; FDA: Washington, DC, USA, 2012. Available online: https://www.fda.gov/media/83271/download (accessed on 30 May 2022).
- FDA (Food and Drug Administration), 2000; Guidance for Industry: Action Levels for Poisonous or Deleterious Substances in Human Food and Animal Feed. Available online: https://www.fda.gov/regulatory-information/search-fda-guidance-documents/guidance-industry-action-levels-poisonous-or-deleterious-substances-human-food-and-animal-feed (accessed on 9 June 2022).
- Richard, E.; Heutte, N.; Bouchart, V.; Garon, D. Evaluation of Fungal Contamination and Mycotoxin Production in Maize Silage. Anim. Feed Sci. Technol. 2009, 148, 309–320. [Google Scholar] [CrossRef]
- Ogunade, I.M.; Martinez-Tuppia, C.; Queiroz, O.C.M.; Jiang, Y.; Drouin, P.; Wu, F.; Vyas, D.; Adesogan, A.T. Silage Review: Mycotoxins in Silage: Occurrence, Effects, Prevention, and Mitigation. J. Dairy Sci. 2018, 101, 4034–4059. [Google Scholar] [CrossRef]
- Hell, K.; Cardwell, K.F.; Setamou, M.; Poehling, H.M. The Influence of Storage Practices on Aflatoxin Contamination in Maize in Four Agroecological Zones of Benin, West Africa. J. Stored Prod. Res. 2000, 36, 365–382. [Google Scholar] [CrossRef] [PubMed]
- Wu, F.; Bhatnagar, D.; Bui-Klimke, T.; Carbone, I.; Hellmich, R.; Munkvold, G.; Paul, P.; Payne, G.; Takle, E. Climate Change Impacts on Mycotoxin Risks in US Maize. World Mycotoxin J. 2010, 4, 79–93. [Google Scholar] [CrossRef]
- Jiang, Y.; Ogunade, I.M.; Vyas, D.; Adesogan, A.T. Aflatoxin in Dairy Cows: Toxicity, Occurrence in Feedstuffs and Milk and Dietary Mitigation Strategies. Toxins. 2021, 13, 283. [Google Scholar] [CrossRef] [PubMed]
- Westlake, K.; Mackie, R.I.; Dutton, M.F. In Vitro Metabolism of Mycotoxins by Bacterial, Protozoal and Ovine Ruminal Fluid Preparations. Anim. Feed Sci. Technol. 1989, 25, 169–178. [Google Scholar] [CrossRef]
- Jiang, Y.H.; Yang, H.J.; Lund, P. Effect of Aflatoxin B1 on in Vitro Ruminal Fermentation of Rations High in Alfalfa Hay or Ryegrass Hay. Anim. Feed Sci. Technol. 2012, 175, 85–89. [Google Scholar] [CrossRef]
- Rodrigues, I.; Naehrer, K. A Three-Year Survey on the Worldwide Occurrence of Mycotoxins in Feedstuffs and Feed. Toxins 2012, 4, 663–675. [Google Scholar] [CrossRef] [PubMed]
- Sulzberger, S.A.; Melnichenko, S.; Cardoso, F.C. Effects of Clay after an Aflatoxin Challenge on Aflatoxin Clearance, Milk Production, and Metabolism of Holstein Cows. J. Dairy Sci. 2017, 100, 1856–1869. [Google Scholar] [CrossRef]
- Wang, Y.; Liu, F.; Zhou, X.; Liu, M.; Zang, H.; Liu, X.; Shan, A.; Feng, X. Alleviation of Oral Exposure to Aflatoxin B1-Induced Renal Dysfunction, Oxidative Stress, and Cell Apoptosis in Mice Kidney by Curcumin. Antioxidants 2022, 11, 1082. [Google Scholar] [CrossRef]
- Wang, Y.; Wu, J.; Wang, L.; Yang, P.; Liu, Z.; Rajput, S.A.; Hassan, M.; Qi, D. Epigallocatechin Gallate and Glutathione Attenuate Aflatoxin B1-Induced Acute Liver Injury in Ducklings via Mitochondria-Mediated Apoptosis and the Nrf2 Signaling Pathway. Toxins. 2022, 14, 876. [Google Scholar] [CrossRef]
- Jiang, Y.; Ogunade, I.M.; Arriola, K.G.; Pech-Cervantes, A.A.; Kim, D.H.; Li, X.; Xue, Y.L.; Vyas, D.; Adesogan, A.T. Short Communication: Effects of a Physiologically Relevant Concentration of Aflatoxin B1 with or without Sequestering Agents on in Vitro Rumen Fermentation of a Dairy Cow Diet. J. Dairy Sci. 2020, 103, 1559–1565. [Google Scholar] [CrossRef]
- Ahlberg, S.; Randolph, D.; Okoth, S.; Lindahl, J. Aflatoxin Binders in Foods for Human Consumption-Can This Be Promoted Safely and Ethically? Toxins. 2019, 11, 410. [Google Scholar] [CrossRef]
- Edrington, T.S.; Harvey, R.B.; Kubena, L.F. Effect of Aflatoxin in Growing Lambs Fed Ruminally Degradable or Escape Protein Sources. J. Anim. Sci. 1994, 72, 1274–1281. [Google Scholar] [CrossRef]
- Clark, J.H.; Klusmeyer, T.H.; Cameron, M.R. Microbial Protein Synthesis and Flows of Nitrogen Fractions to the Duodenum of Dairy Cows. J. Dairy Sci. 1992, 75, 2304–2323. [Google Scholar] [CrossRef]
- Arce-Cordero, J.A.; Ravelo, A.; Vinyard, J.R.; Monteiro, H.F.; Agustinho, B.C.; Sarmikasoglou, E.; Bennet, S.L.; Faciola, A.P. Effects of Supplemental Source of Magnesium and Inclusion of Buffer on Ruminal Microbial Fermentation in Continuous Culture. J. Dairy Sci. 2021, 104, 7820–7829. [Google Scholar] [CrossRef]
- Ravelo, A.D.; Calvo Agustinho, B.; Arce-Cordero, J.; Monterio, H.F.; Bennet, S.L.; Sarmikasoglou, E.; Vinyard, J.; Vieira, E.R.Q.; Lobo, R.R.; Ferraretto, L.F.; et al. Effects of Partially Replacing Dietary Corn with Molasses, Condensed Whey Permeate, or Treated Condensed Whey Permeate on Ruminal Microbial Fermentation. J. Dairy Sci. 2022, 105, 2215–2227. [Google Scholar] [CrossRef] [PubMed]
- Wenner, B.A.; Wagner, B.K.; St-Pierre, N.R.; Yu, Z.T.; Firkins, J.L. Inhibition of Methanogenesis by Nitrate, with or without Defaunation, in Continuous Culture. J. Dairy Sci. 2020, 103, 7124–7140. [Google Scholar] [CrossRef]
- Roman-Garcia, Y.; Mitchell, K.E.; Denton, B.L.; Lee, C.; Socha, M.T.; Wenner, B.A.; Firkins, J.L. Conditions Stimulating Neutral Detergent Fiber Degradation by Dosing Branched-Chain Volatile Fatty Acids. II: Relation with Solid Passage Rate and PH on Neutral Detergent Fiber Degradation and Microbial Function in Continuous Culture. J. Dairy Sci. 2021, 104, 9853–9867. [Google Scholar] [CrossRef] [PubMed]
- Kiessling, K.H.; Pettersson, H.; Sandholm, K.; Olsen, M. Metabolism of Aflatoxin, Ochratoxin, Zearalenone, and Three Trichothecenes by Intact Rumen Fluid, Rumen Protozoa, and Rumen Bacteria. Appl. Environ. Microbiol. 1984, 47, 1070–1073. [Google Scholar] [CrossRef] [PubMed]
- Moschini, M.; Gallo, A.; Piva, G.; Masoero, F. The Effects of Rumen Fluid on the in Vitro Aflatoxin Binding Capacity of Different Sequestering Agents and in Vivo Release of the Sequestered Toxin. Anim. Feed Sci. Technol. 2008, 147, 292–309. [Google Scholar] [CrossRef]
- Notardonato, I.; Gianfagna, S.; Castoria, R.; Ianiri, G.; De Curtis, F.; Russo, M.V.; Avino, P. Critical review of the analytical methods for determining the mycotoxin patulin in food matrices. Rev. Anal. Chem. 2021, 40, 144–160. [Google Scholar] [CrossRef]
- Hoover, W.H.; Crooker, B.A.; Sniffen, C.J. Effects of differential solid-liquid removal rates on protozoa numbers in continuous cultures of rumen contents. J. Anim. Sci. 1976, 43, 528–534. [Google Scholar] [CrossRef]
- Weller, R.A.; Pilgrim, A.F. Passage of Protozoa and Volatile Fatty Acids from the Rumen of the Sheep and from a Continuous in Vitro Fermentation System. Br. J. Nutr. 1974, 32, 341–351. [Google Scholar] [CrossRef]
- Broderick, G.A.; Kang, J.H. Automated Simultaneous Determination of Ammonia and Total Amino Acids in Ruminal Fluid and In Vitro Media. J. Dairy Sci. 1980, 63, 64–75. [Google Scholar] [CrossRef]
- AOAC International. Official Methods of Analysis. Volume 1 and 2, 17th ed.; AOAC International: Rockville, MD, USA, 2000. [Google Scholar]
- AOAC International. Method 992.15. Official Methods of Analysis; AOAC International: Rockville, MD, USA, 1995. [Google Scholar]
- Van Soest, P.J.; Robertson, J.B.; Lewis, B.A. Methods for Dietary Fiber, Neutral Detergent Fiber, and Nonstarch Polysaccharides in Relation to Animal Nutrition. J. Dairy Sci. 1991, 74, 3583–3597. [Google Scholar] [CrossRef]
- Hall, M.B.; Arbaugh, J.; Binkerd, K.; Carlson, A.; Thi Doan, T.; Grant, T.; Heuer, C.; Inerowicz, H.D.; Jean-Louis, B.; Johnson, R.; et al. Determination of Dietary Starch in Animal Feeds and Pet Food by an Enzymatic-Colorimetric Method: Collaborative Study. J. AOAC Int. 2015, 98, 397–409. [Google Scholar] [CrossRef] [PubMed]
- Soder, K.J.; Brito, A.F.; Rubano, M.D. Effect of Supplementing Orchardgrass Herbage with a Total Mixed Ration or Flaxseed on Fermentation Profile and Bacterial Protein Synthesis in Continuous Culture. J. Dairy Sci. 2013, 96, 3228–3237. [Google Scholar] [CrossRef] [PubMed]
- Krizsan, S.J.; Ahvenjärvi, S.; Volden, H.; Broderick, G.A. Estimation of Rumen Outflow in Dairy Cows Fed Grass Silage-Based Diets by Use of Reticular Sampling as an Alternative to Sampling from the Omasal Canal. J. Dairy Sci. 2010, 93, 1138–1147. [Google Scholar] [CrossRef] [PubMed]
- Reynal, S.M.; Broderick, G.A.; Bearzi, C. Comparison of Four Markers for Quantifying Microbial Protein Flow from the Rumen of Lactating Dairy Cows. J. Dairy Sci. 2005, 88, 4065–4082. [Google Scholar] [CrossRef] [PubMed]
- Calsamiglia, S.; Stern, M.D.; Firkins, J.L. Comparison of Nitrogen-15 and Purines as Microbial Markers in Continuous Culture. J. Anim. Sci. 1996, 74, 1375–1381. [Google Scholar] [CrossRef]
- Bach, A.; Stern, M.D. Effects of Different Levels of Methionine and Ruminally Undegradable Protein on the Amino Acid Profile of Effluent from Continuous Culture Fermenters. J. Anim. Sci. 1999, 77, 3377–3384. [Google Scholar] [CrossRef]


| Item | Experimental Diet |
|---|---|
| Ingredient, % of DM | |
| Corn silage | 40.0 |
| Alfalfa hay | 20.0 |
| Corn grain, ground shelled | 20.0 |
| Soybean meal, 44% | 13.5 |
| Citrus pulp | 4.0 |
| Mineral premix 1 | 2.5 |
| Chemical composition, % of DM | |
| OM 2 | 93.3 |
| CP | 15.9 |
| RDP 2,3 | 9.8 |
| RUP 2,3 | 6.1 |
| Andf 2 | 26.4 |
| ADF 2 | 19.4 |
| NFC 2,3 | 49.5 |
| Starch | 30.3 |
| EE 2 | 2.6 |
| NEL 2,3, Mcal/kg of DM | 1.61 |
| Item | Treatment 1 | SEM | p-Value 2 | |||||
|---|---|---|---|---|---|---|---|---|
| Control | AF50 | AF100 | AF150 | L | Q | C | ||
| pH | 6.08 | 6.04 | 6.11 | 6.10 | 0.06 | 0.65 | 0.97 | 0.83 |
| NH3-N, mg/dL | 10.3 | 10.1 | 9.56 | 10.9 | 1.02 | 0.66 | 0.47 | 0.35 |
| Total VFA 3, mM | 137.5 | 141.8 | 142.9 | 134.4 | 8.23 | 0.78 | 0.76 | 0.38 |
| Molar proportion, mol/100 mol | ||||||||
| Acetate | 52.0 | 49.7 | 50.0 | 51.9 | 1.90 | 0.62 | 0.91 | 0.28 |
| Propionate | 27.4 | 28.9 | 28.7 | 27.5 | 1.34 | 0.67 | 0.90 | 0.39 |
| Butyrate | 12.8 | 12.3 | 13.6 | 13.2 | 0.55 | 0.18 | 0.39 | 0.37 |
| Iso-butyrate | 0.48 | 0.45 | 0.54 | 0.54 | 0.06 | 0.21 | 0.72 | 0.33 |
| Valerate | 4.51 | 5.38 | 4.73 | 4.38 | 1.10 | 0.86 | 0.55 | 0.12 |
| Iso-valerate | 2.78 | 2.95 | 2.51 | 2.42 | 0.39 | 0.33 | 0.90 | 0.33 |
| Lactate, mM | 0.23 | 0.24 | 0.27 | 0.17 | 0.07 | 0.86 | 0.45 | 0.39 |
| A:P 4 | 1.92 | 1.74 | 1.84 | 1.91 | 0.12 | 0.87 | 0.63 | 0.25 |
| Digestibility 3, % | Treatment 1 | SEM | p-Value 2 | |||||
|---|---|---|---|---|---|---|---|---|
| Control | AF50 | AF100 | AF150 | L | Q | C | ||
| DM | 55.0 | 54.5 | 55.4 | 56.0 | 0.73 | 0.38 | 0.92 | 0.19 |
| OM | 62.4 | 60.9 | 61.9 | 63.4 | 1.84 | 0.82 | 0.99 | 0.15 |
| CP | 59.7 | 59.1 | 60.7 | 61.0 | 2.35 | 0.57 | 0.94 | 0.59 |
| NDF | 59.1 | 57.5 | 54.8 | 55.3 | 2.42 | 0.12 | 0.51 | 0.97 |
| ADF | 41.6 | 37.2 | 42.2 | 43.2 | 2.85 | 0.57 | 0.57 | 0.20 |
| Starch | 93.3 | 92.7 | 92.8 | 93.3 | 0.35 | 0.48 | 0.91 | 0.12 |
| Item | Treatment 1 | SEM | p-Value 2 | |||||
|---|---|---|---|---|---|---|---|---|
| Control | AF50 | AF100 | AF150 | L | Q | C | ||
| N flow, g/d | ||||||||
| Total N | 2.30 | 2.32 | 2.34 | 2.38 | 0.07 | 0.41 | 0.58 | 0.56 |
| NH3-N 3 | 0.43 | 0.41 | 0.39 | 0.45 | 0.05 | 0.62 | 0.52 | 0.35 |
| NAN 4 | 1.87 | 1.90 | 1.95 | 1.93 | 0.09 | 0.32 | 0.88 | 0.98 |
| Microbial N 5 | 1.06 | 1.07 | 1.11 | 1.10 | 0.04 | 0.20 | 0.95 | 0.82 |
| Dietary N 6 | 1.27 | 1.27 | 1.23 | 1.25 | 0.07 | 0.55 | 0.78 | 0.85 |
| Microbial efficiency 7 | 18.8 | 18.9 | 19.2 | 19.0 | 0.69 | 0.59 | 0.81 | 0.99 |
| N efficiency 8 | 36.1 | 36.8 | 37.4 | 37.3 | 1.30 | 0.34 | 0.79 | 0.96 |
Disclaimer/Publisher’s Note: The statements, opinions and data contained in all publications are solely those of the individual author(s) and contributor(s) and not of MDPI and/or the editor(s). MDPI and/or the editor(s) disclaim responsibility for any injury to people or property resulting from any ideas, methods, instructions or products referred to in the content. |
© 2023 by the authors. Licensee MDPI, Basel, Switzerland. This article is an open access article distributed under the terms and conditions of the Creative Commons Attribution (CC BY) license (https://creativecommons.org/licenses/by/4.0/).
Share and Cite
Amaro, F.X.; Jiang, Y.; Arriola, K.; Pupo, M.R.; Agustinho, B.C.; Bennett, S.L.; Vinyard, J.R.; Tomaz, L.; Lobo, R.R.; Pech-Cervantes, A.; et al. The Effects of Incremental Doses of Aflatoxin B1 on In Vitro Ruminal Nutrient Digestibility and Fermentation Profile of a Lactating Dairy Cow Diet in a Dual-Flow Continuous Culture System. Toxins 2023, 15, 90. https://doi.org/10.3390/toxins15020090
Amaro FX, Jiang Y, Arriola K, Pupo MR, Agustinho BC, Bennett SL, Vinyard JR, Tomaz L, Lobo RR, Pech-Cervantes A, et al. The Effects of Incremental Doses of Aflatoxin B1 on In Vitro Ruminal Nutrient Digestibility and Fermentation Profile of a Lactating Dairy Cow Diet in a Dual-Flow Continuous Culture System. Toxins. 2023; 15(2):90. https://doi.org/10.3390/toxins15020090
Chicago/Turabian StyleAmaro, Felipe Xavier, Yun Jiang, Kathy Arriola, Matheus R. Pupo, Bruna C. Agustinho, Sarah L. Bennett, James R. Vinyard, Lais Tomaz, Richard R. Lobo, Andres Pech-Cervantes, and et al. 2023. "The Effects of Incremental Doses of Aflatoxin B1 on In Vitro Ruminal Nutrient Digestibility and Fermentation Profile of a Lactating Dairy Cow Diet in a Dual-Flow Continuous Culture System" Toxins 15, no. 2: 90. https://doi.org/10.3390/toxins15020090
APA StyleAmaro, F. X., Jiang, Y., Arriola, K., Pupo, M. R., Agustinho, B. C., Bennett, S. L., Vinyard, J. R., Tomaz, L., Lobo, R. R., Pech-Cervantes, A., Arce-Cordero, J. A., Faciola, A. P., Adesogan, A. T., & Vyas, D. (2023). The Effects of Incremental Doses of Aflatoxin B1 on In Vitro Ruminal Nutrient Digestibility and Fermentation Profile of a Lactating Dairy Cow Diet in a Dual-Flow Continuous Culture System. Toxins, 15(2), 90. https://doi.org/10.3390/toxins15020090