Differences in PLA2 Constitution Distinguish the Venom of Two Endemic Brazilian Mountain Lanceheads, Bothrops cotiara and Bothrops fonsecai

 , ,
, ,  , and
, and 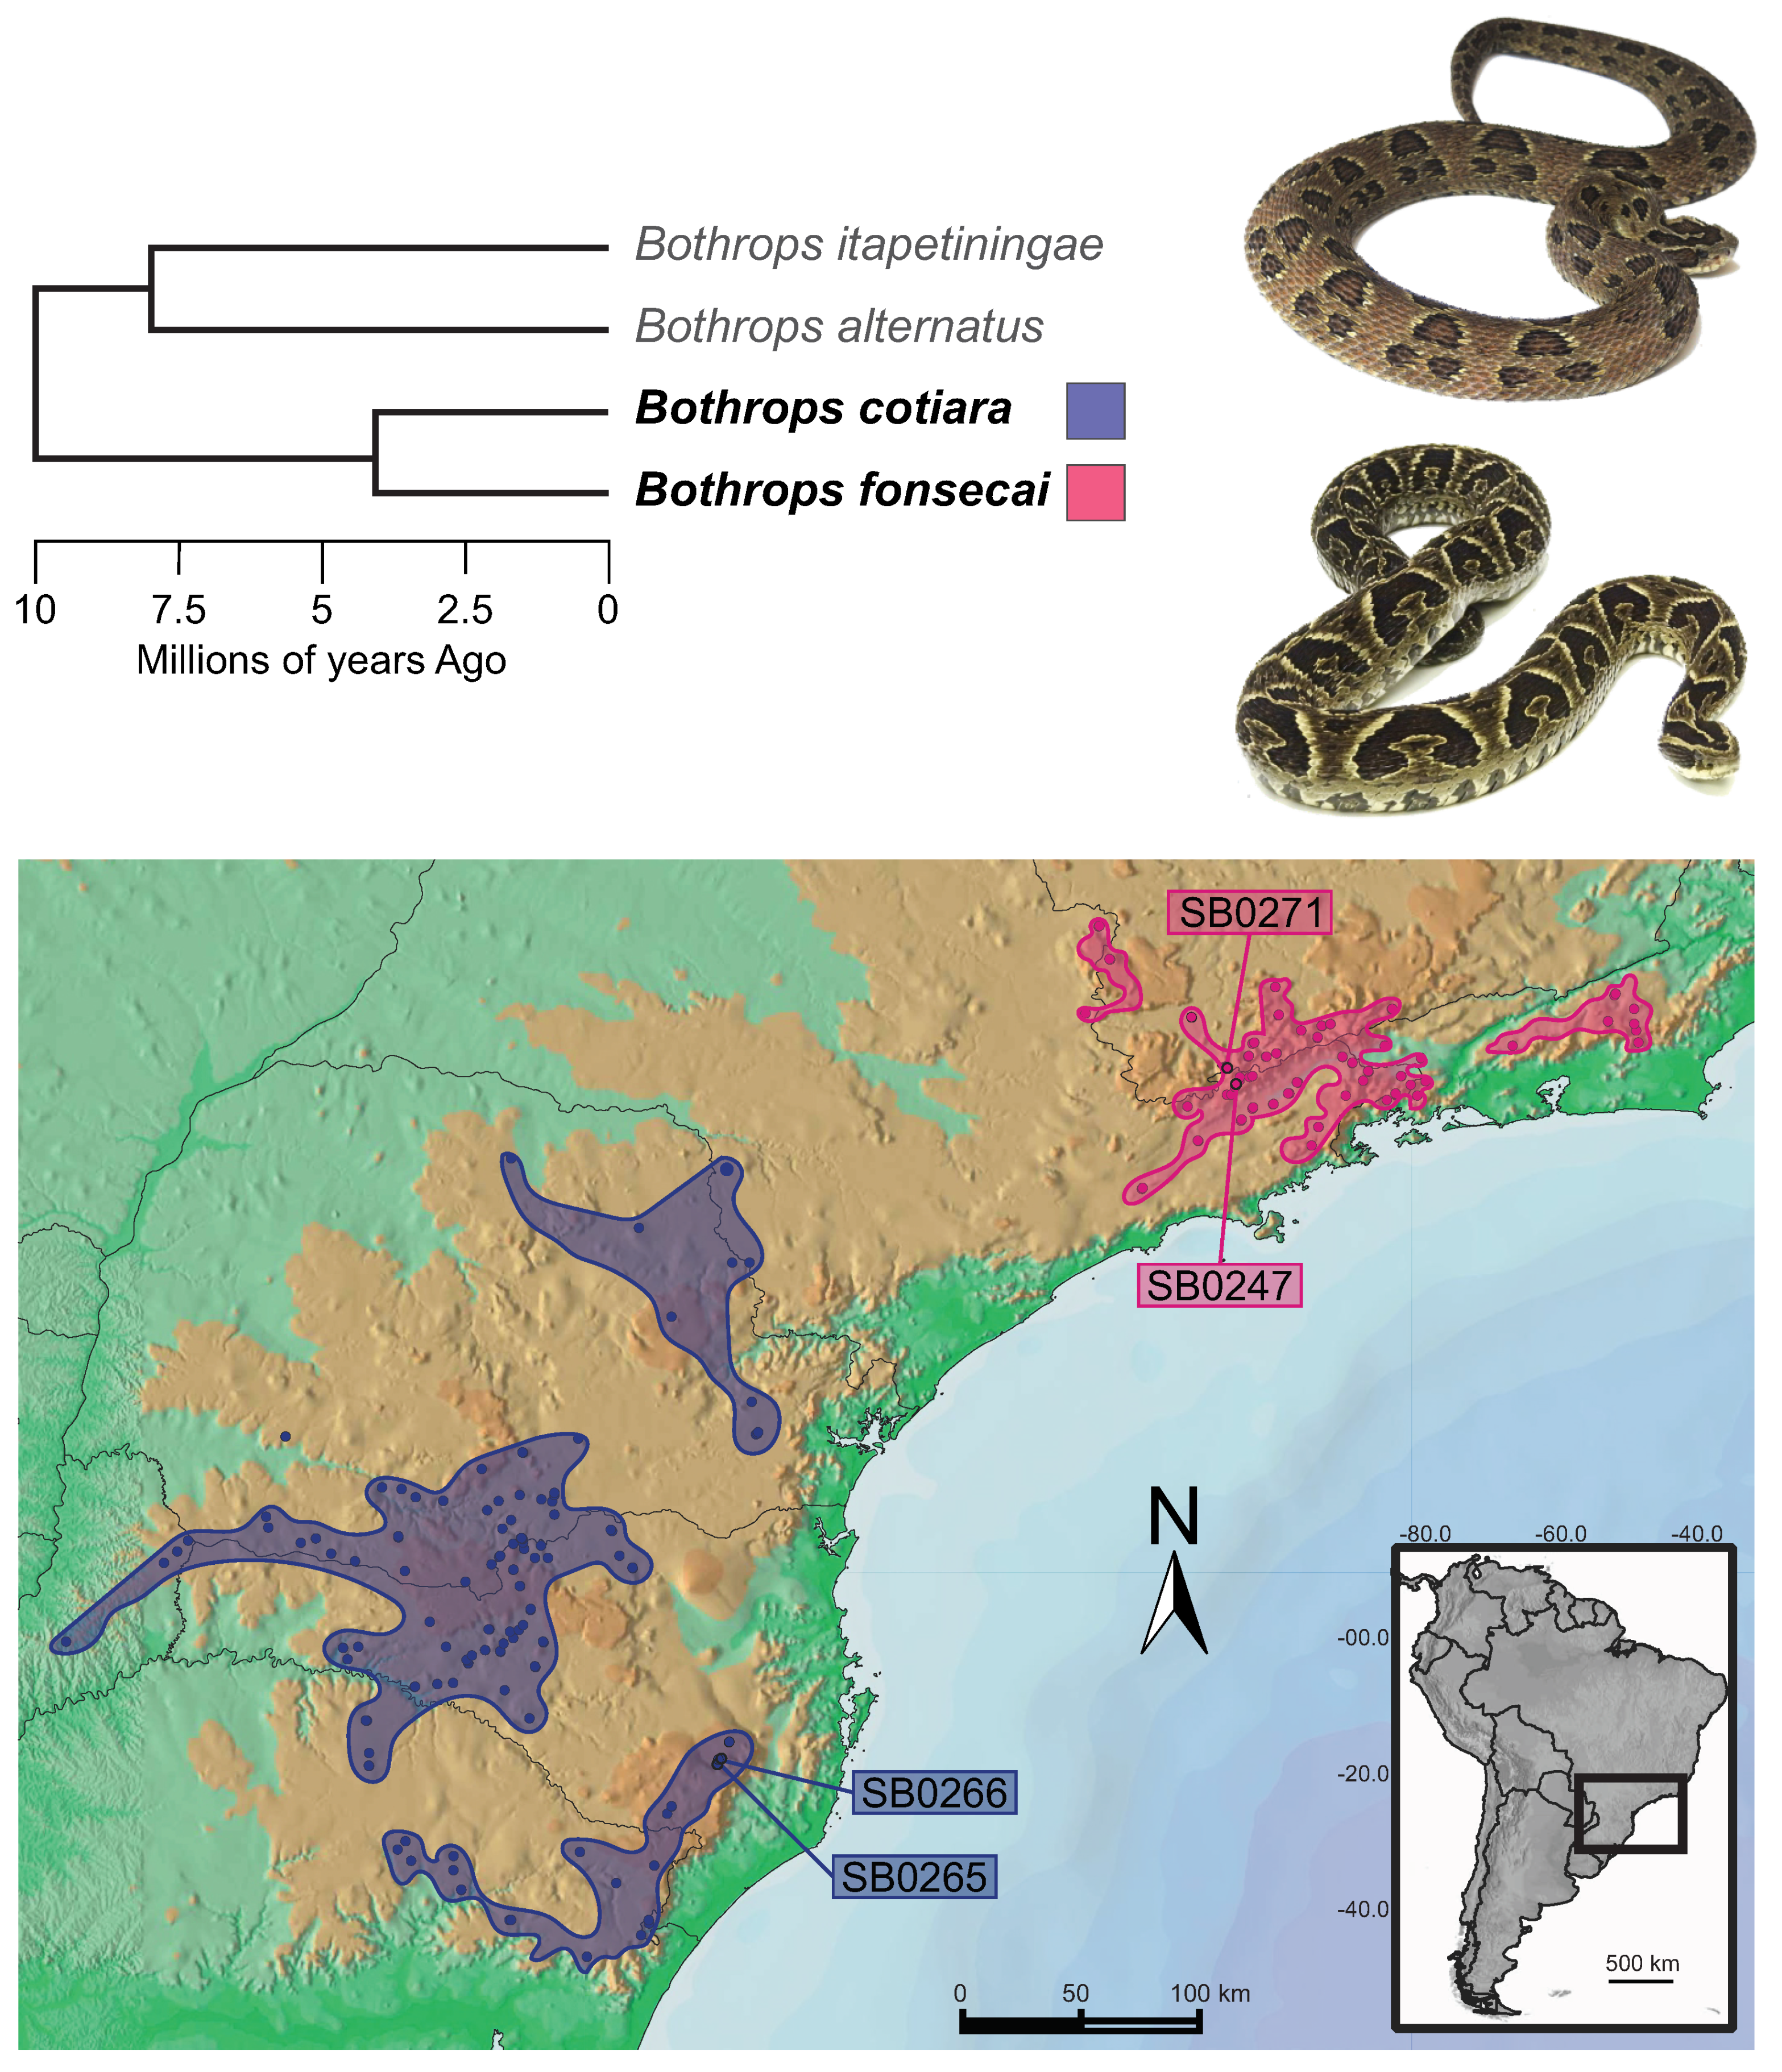
Abstract
1. Introduction
2. Results and Discussion
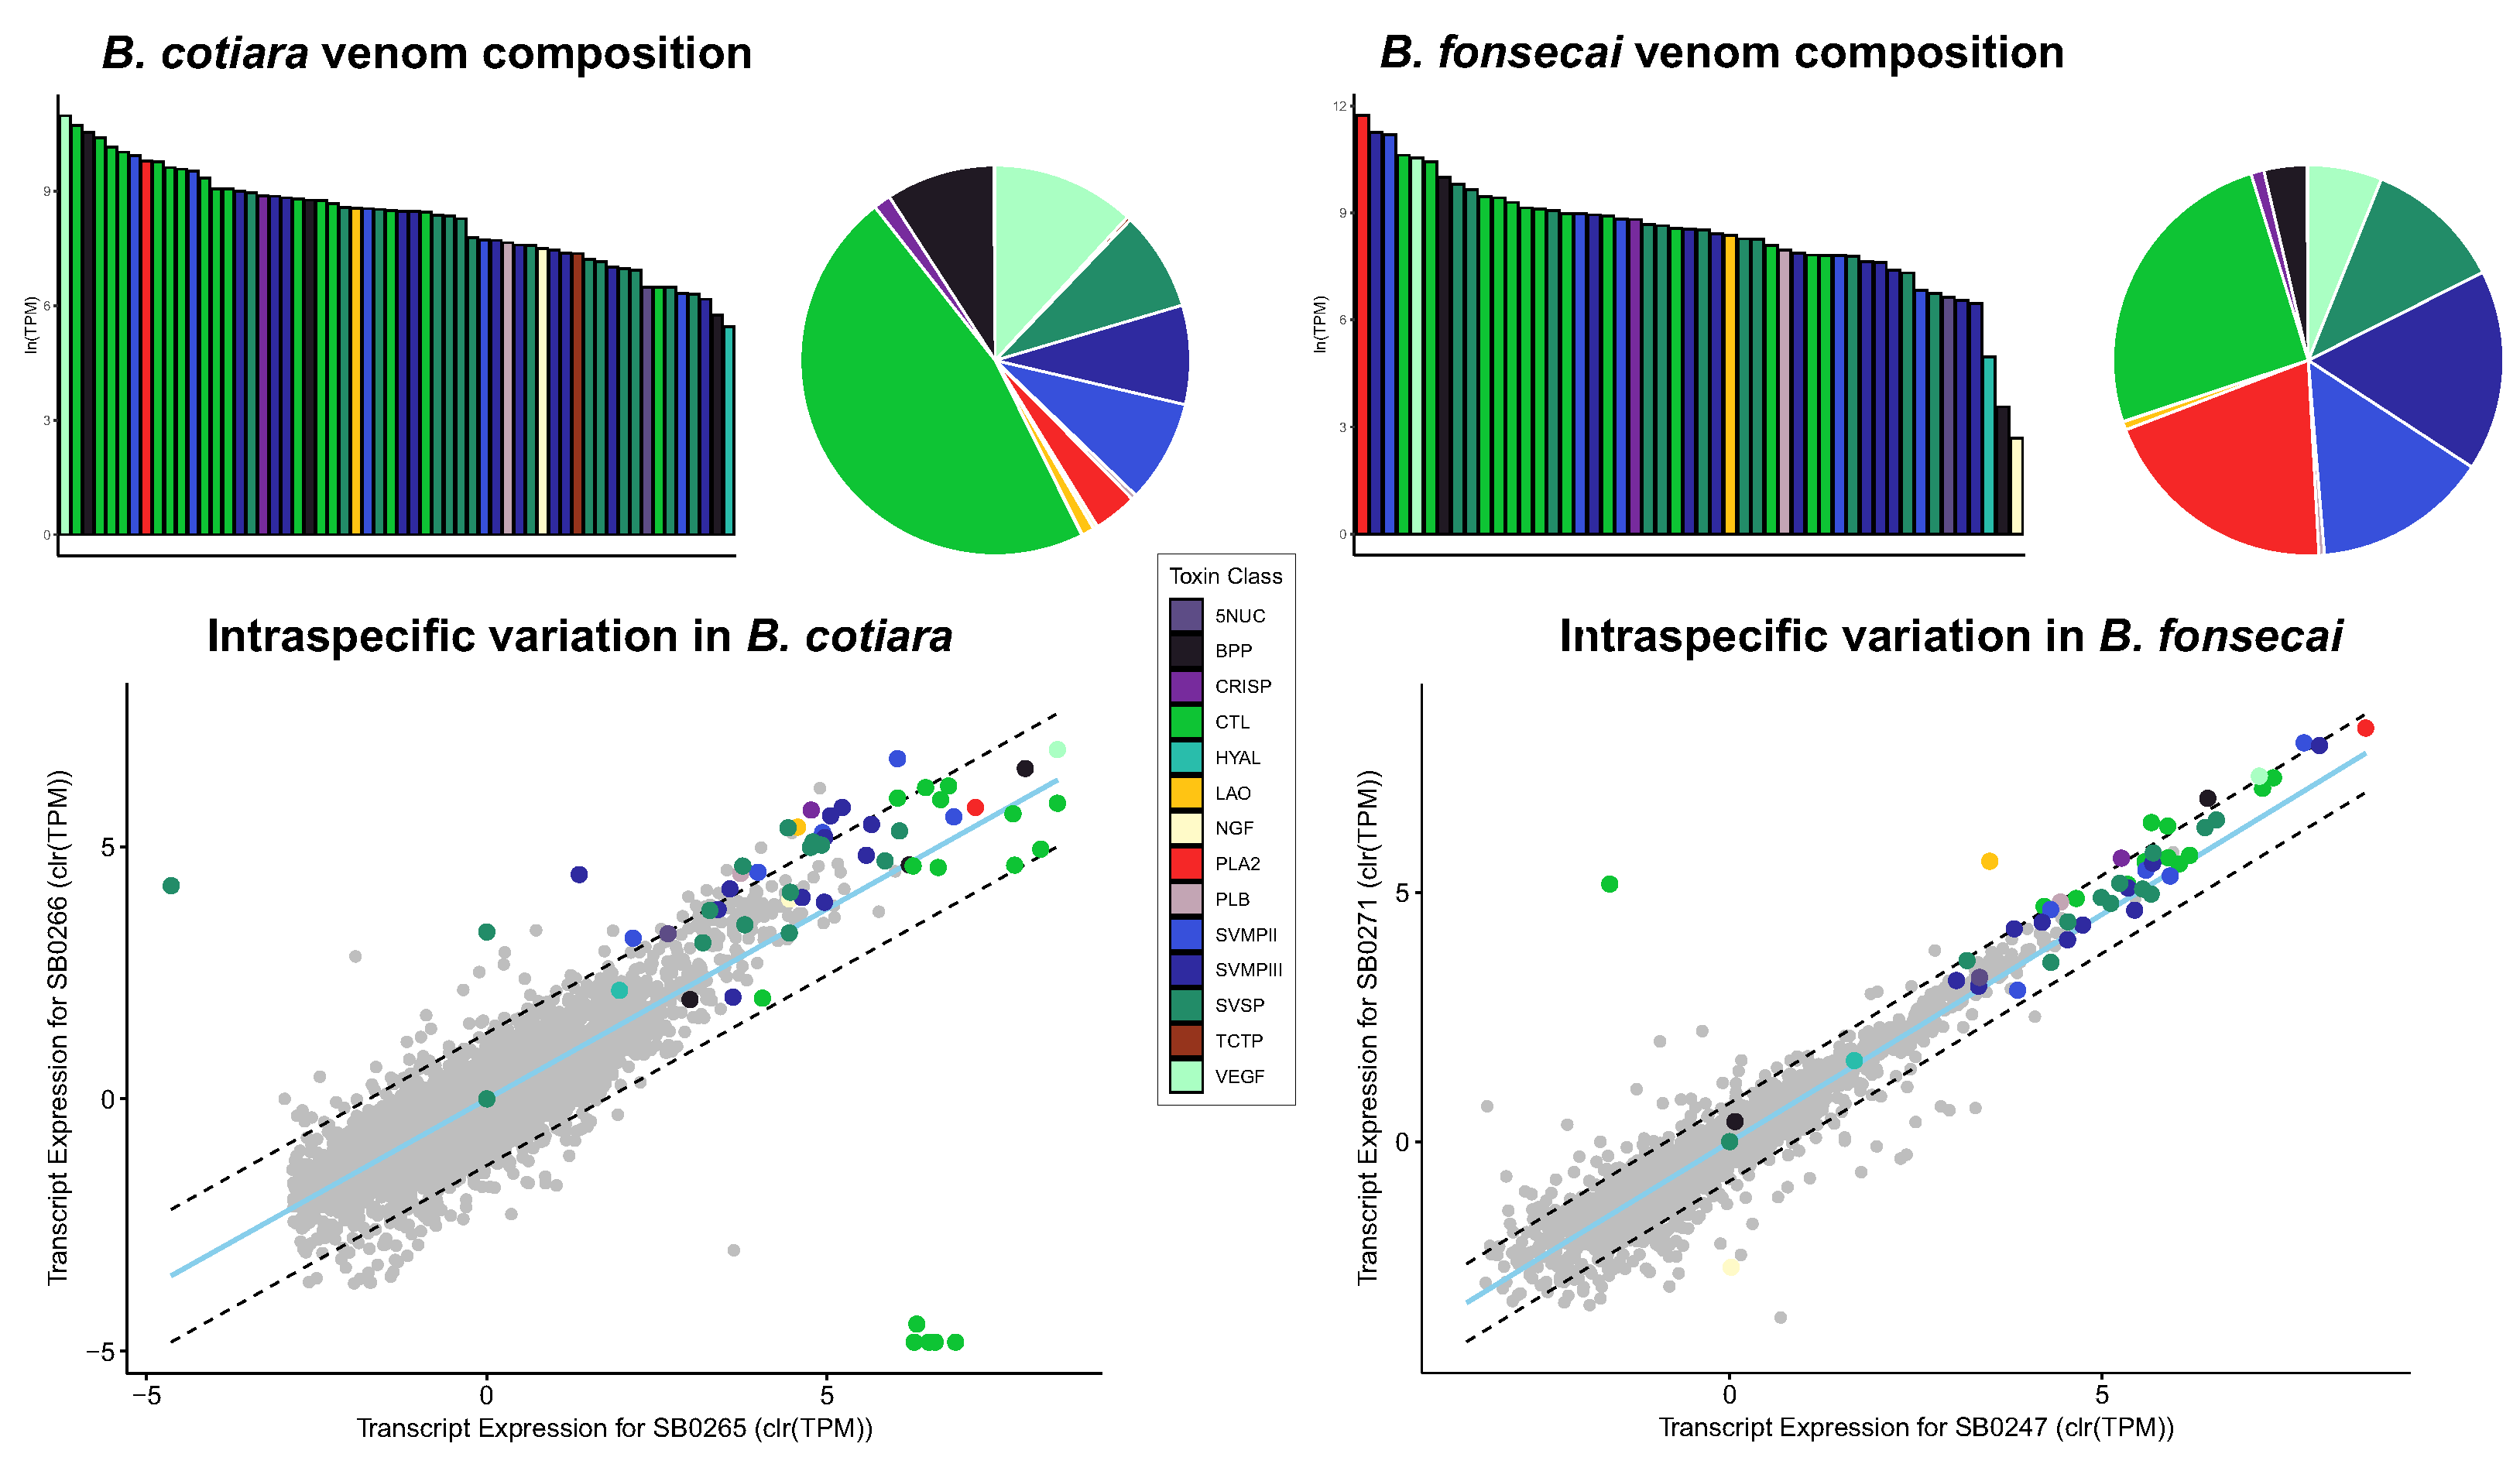
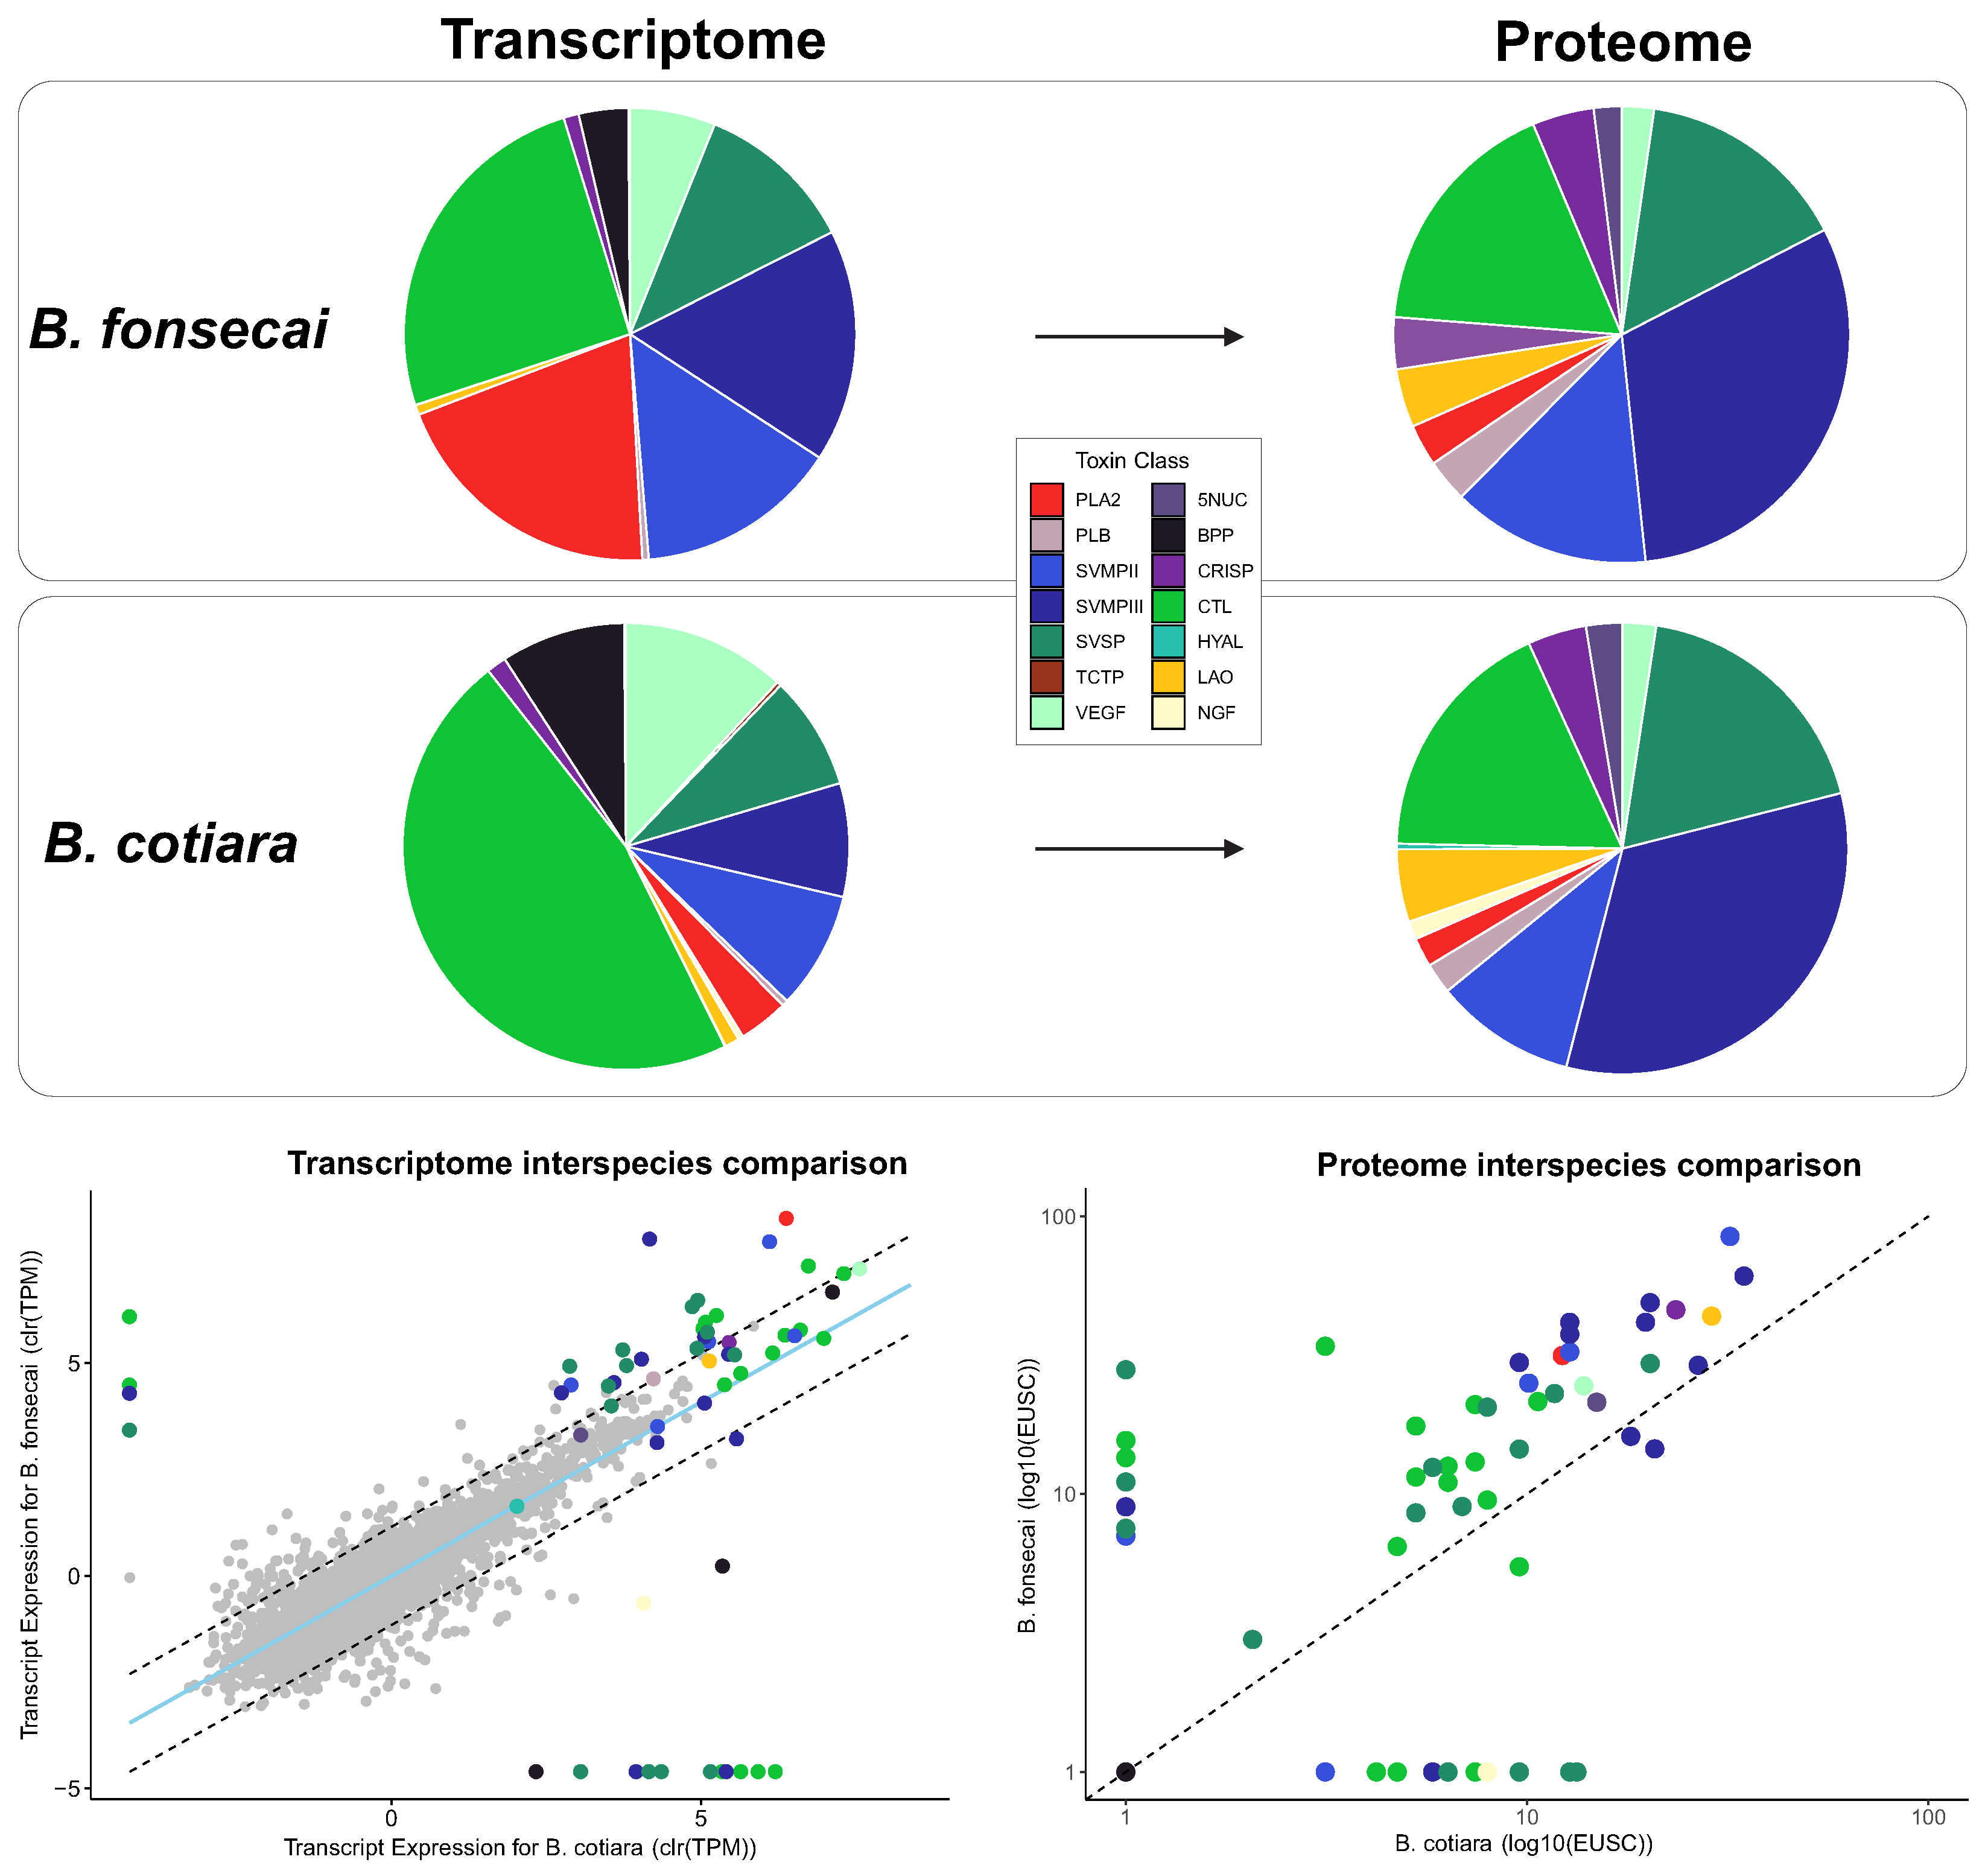
2.1. Venom Characterization and Comparative Analysis
2.2. Proteome Analysis
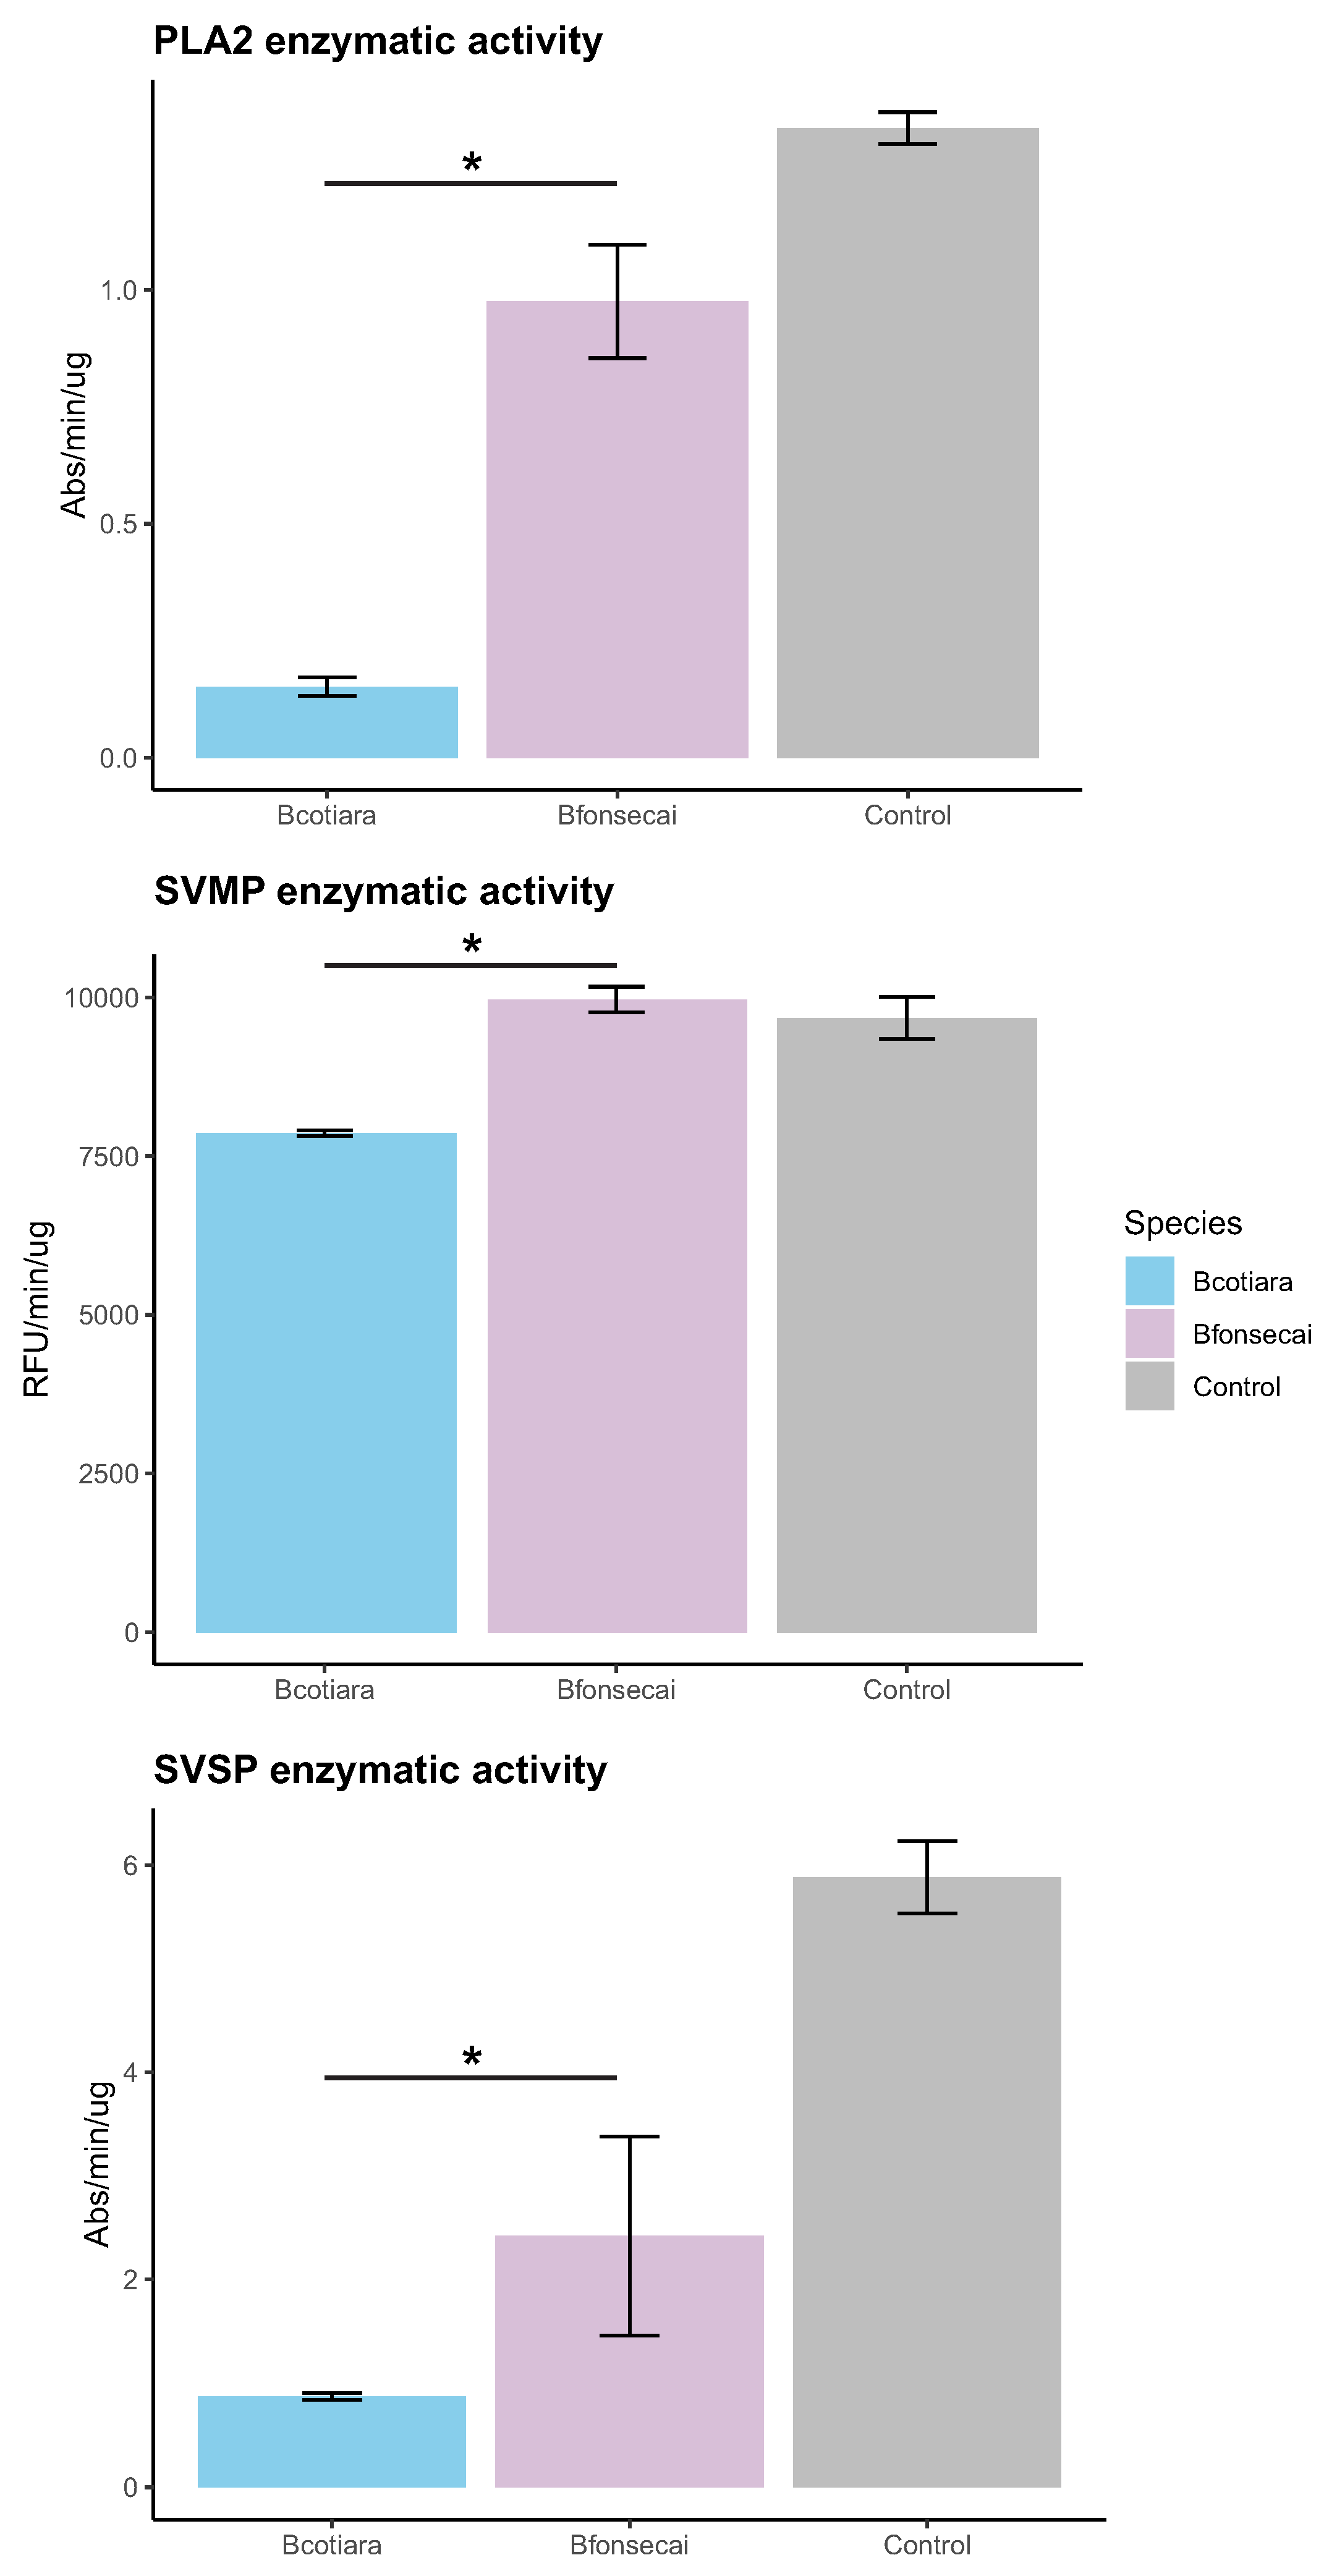
2.3. Functional Differences in the Toxic Activities of B. cotiara and B. fonsecai Venoms
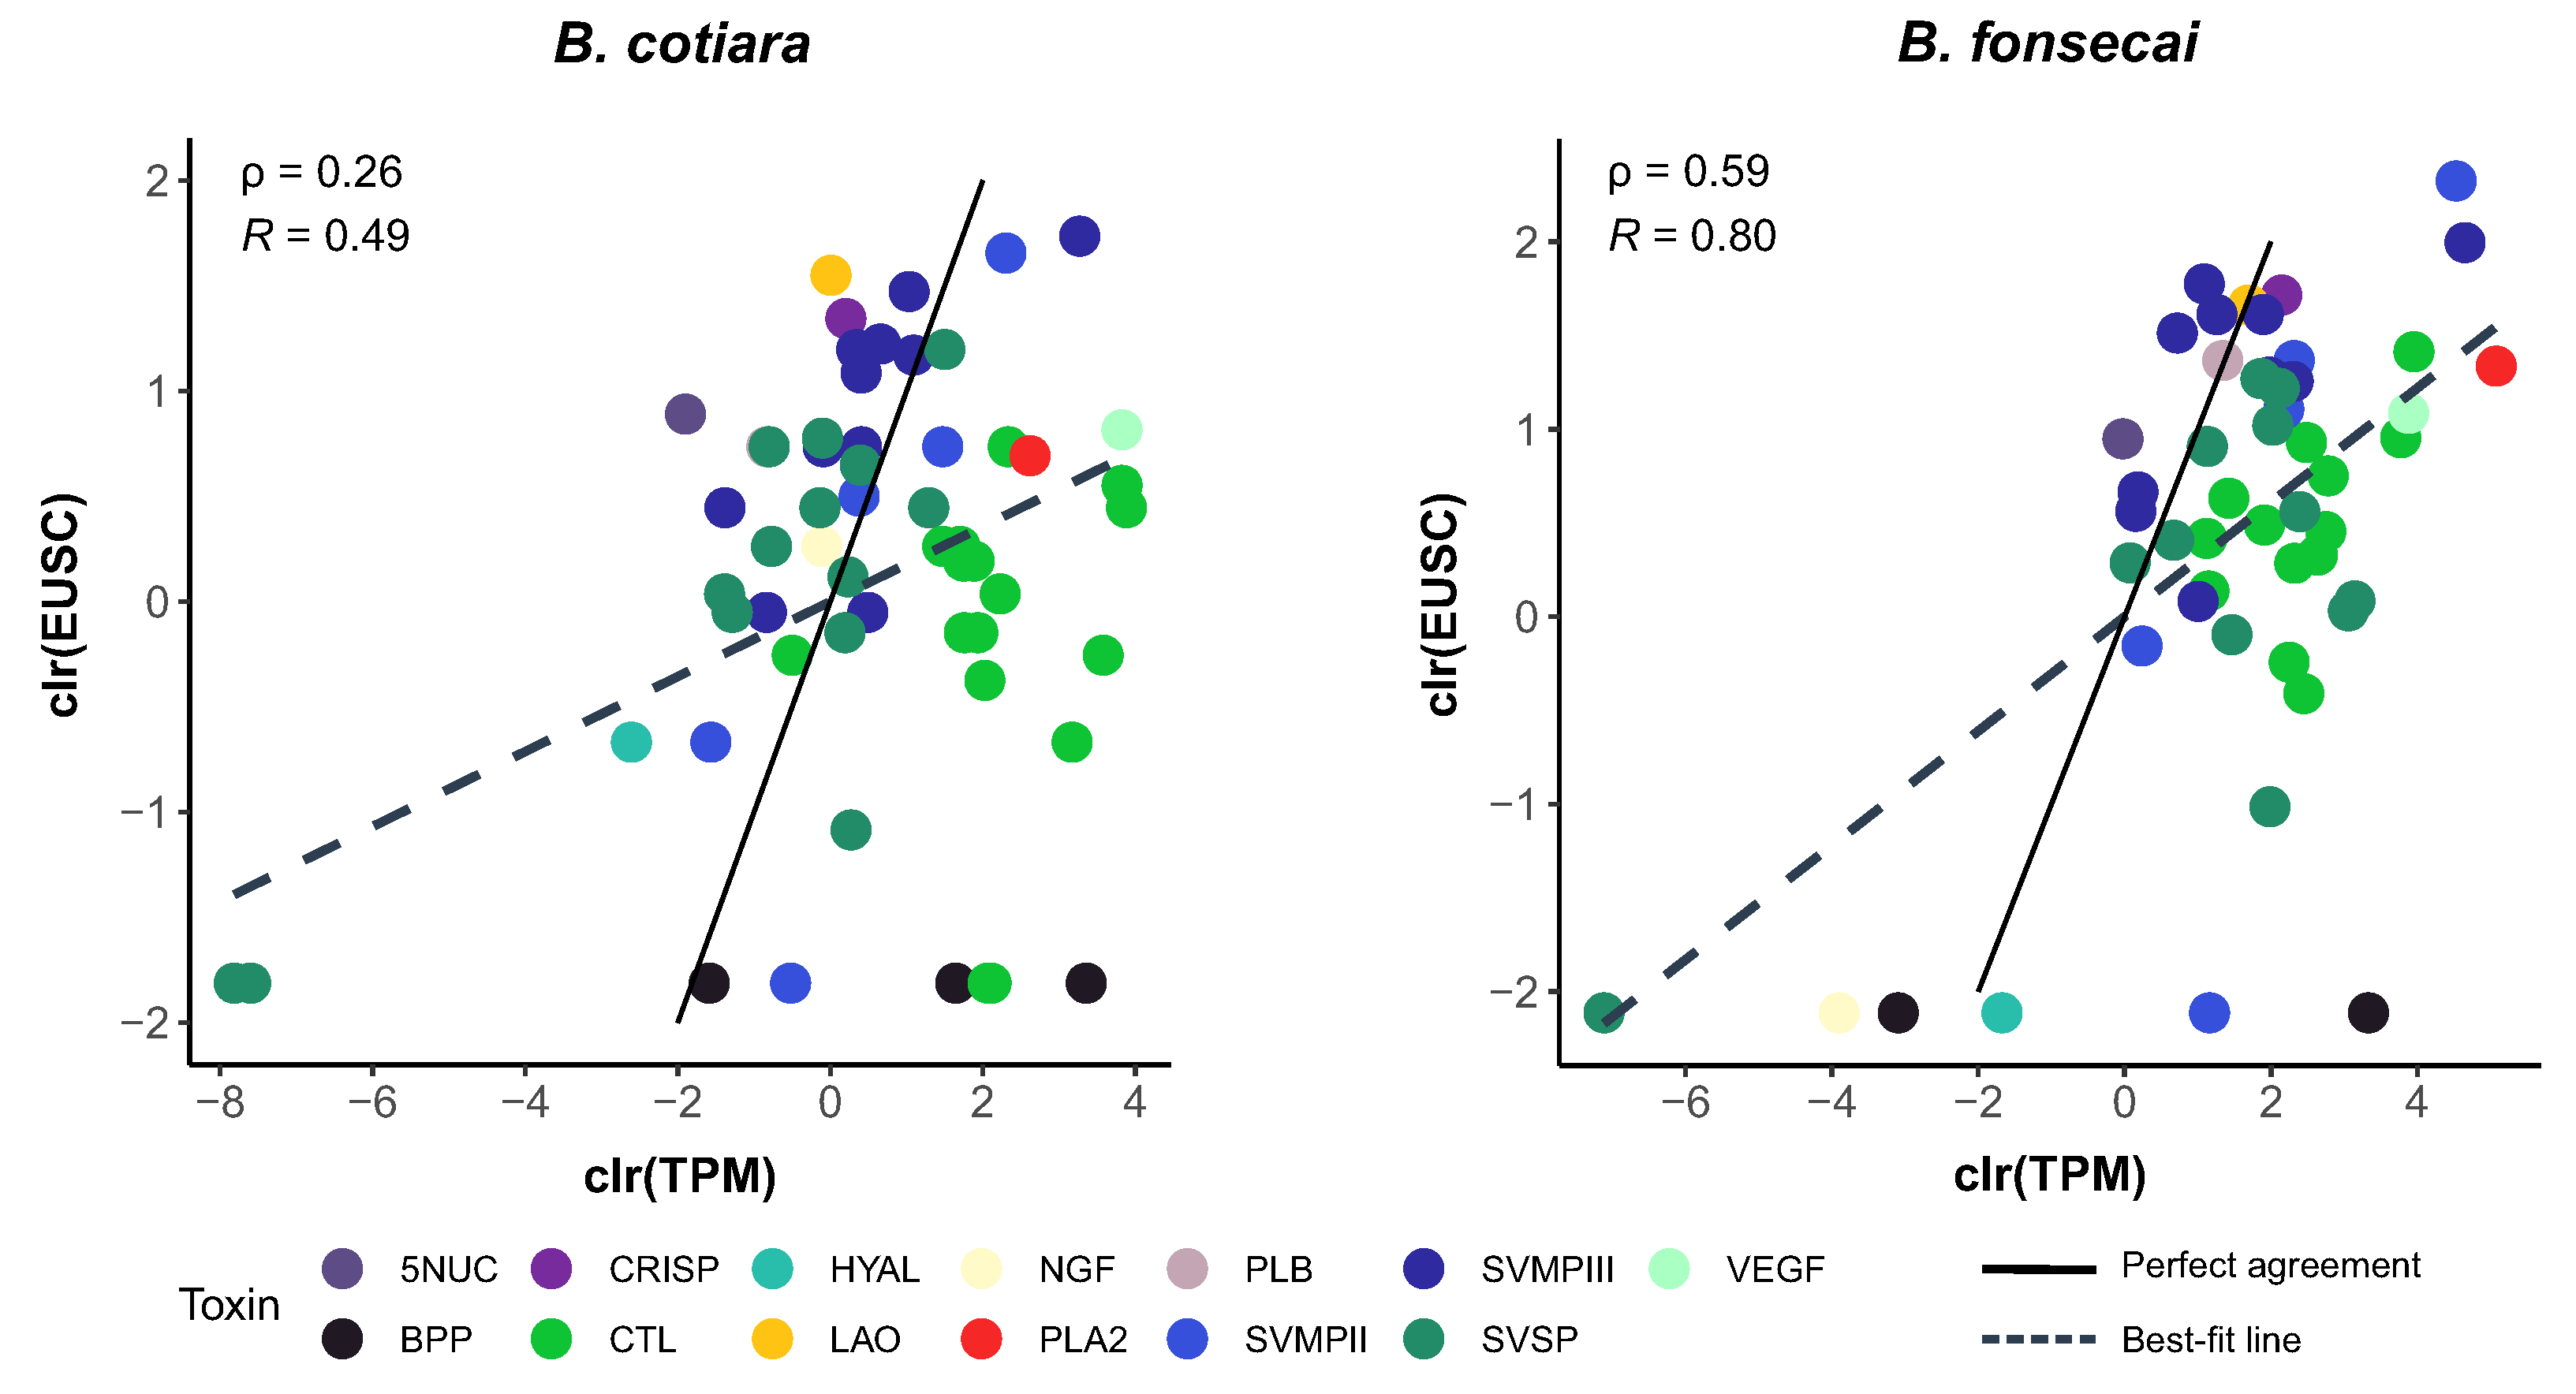
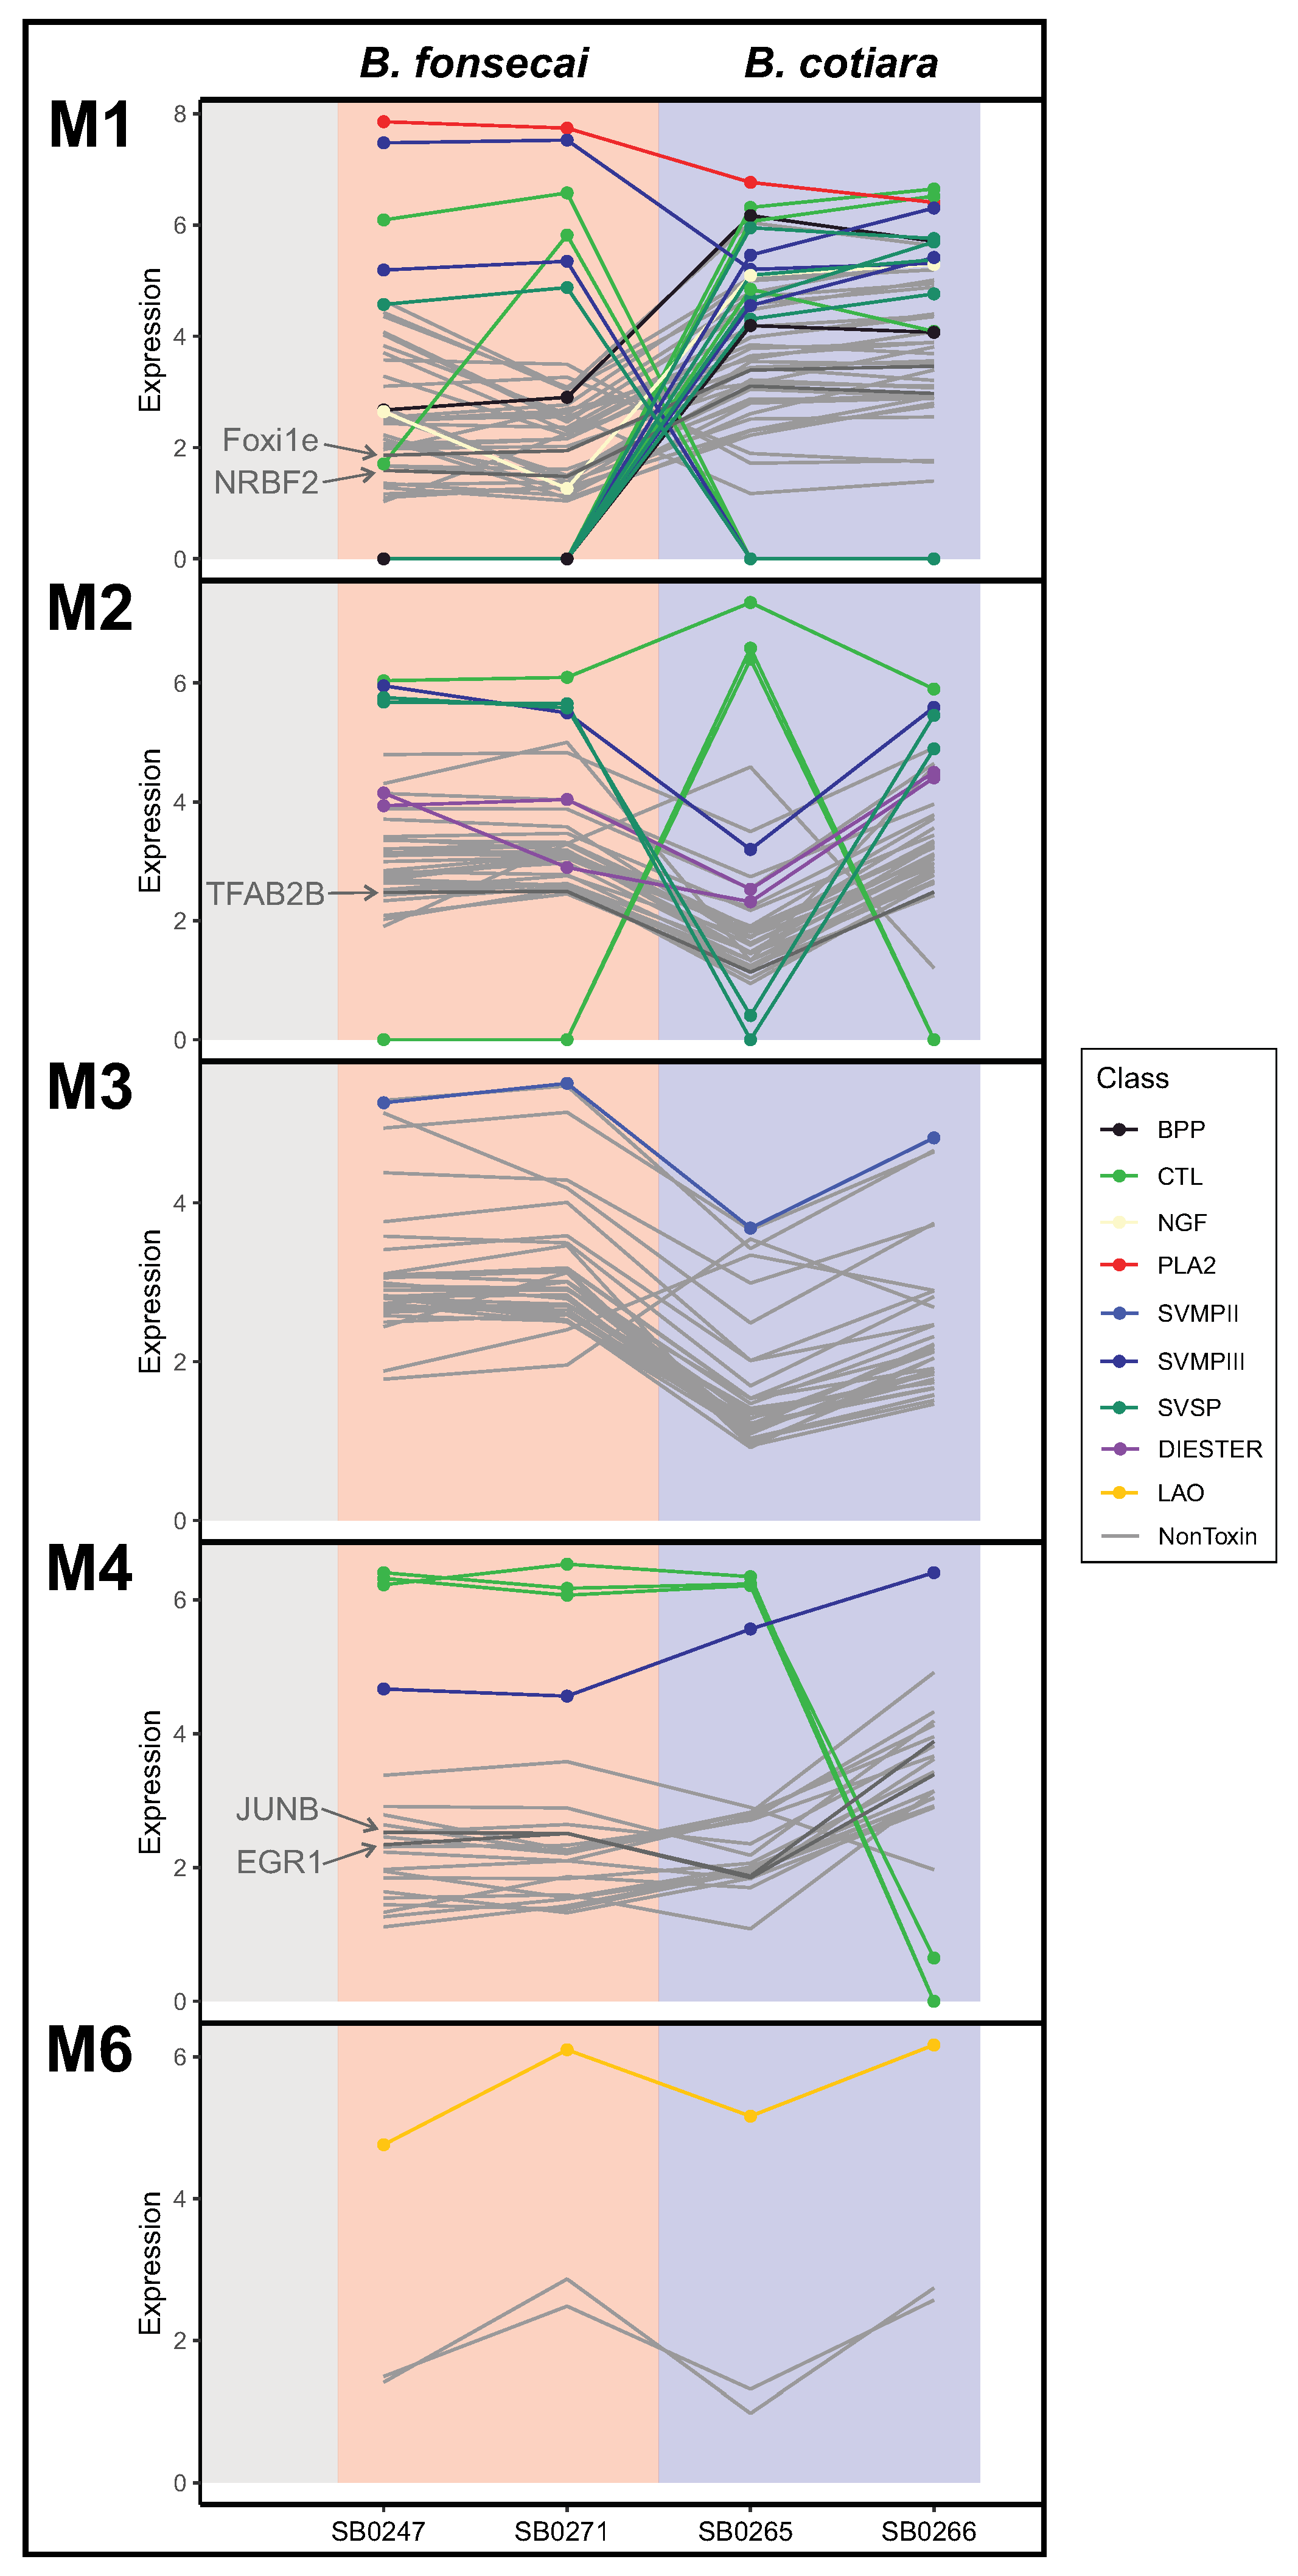
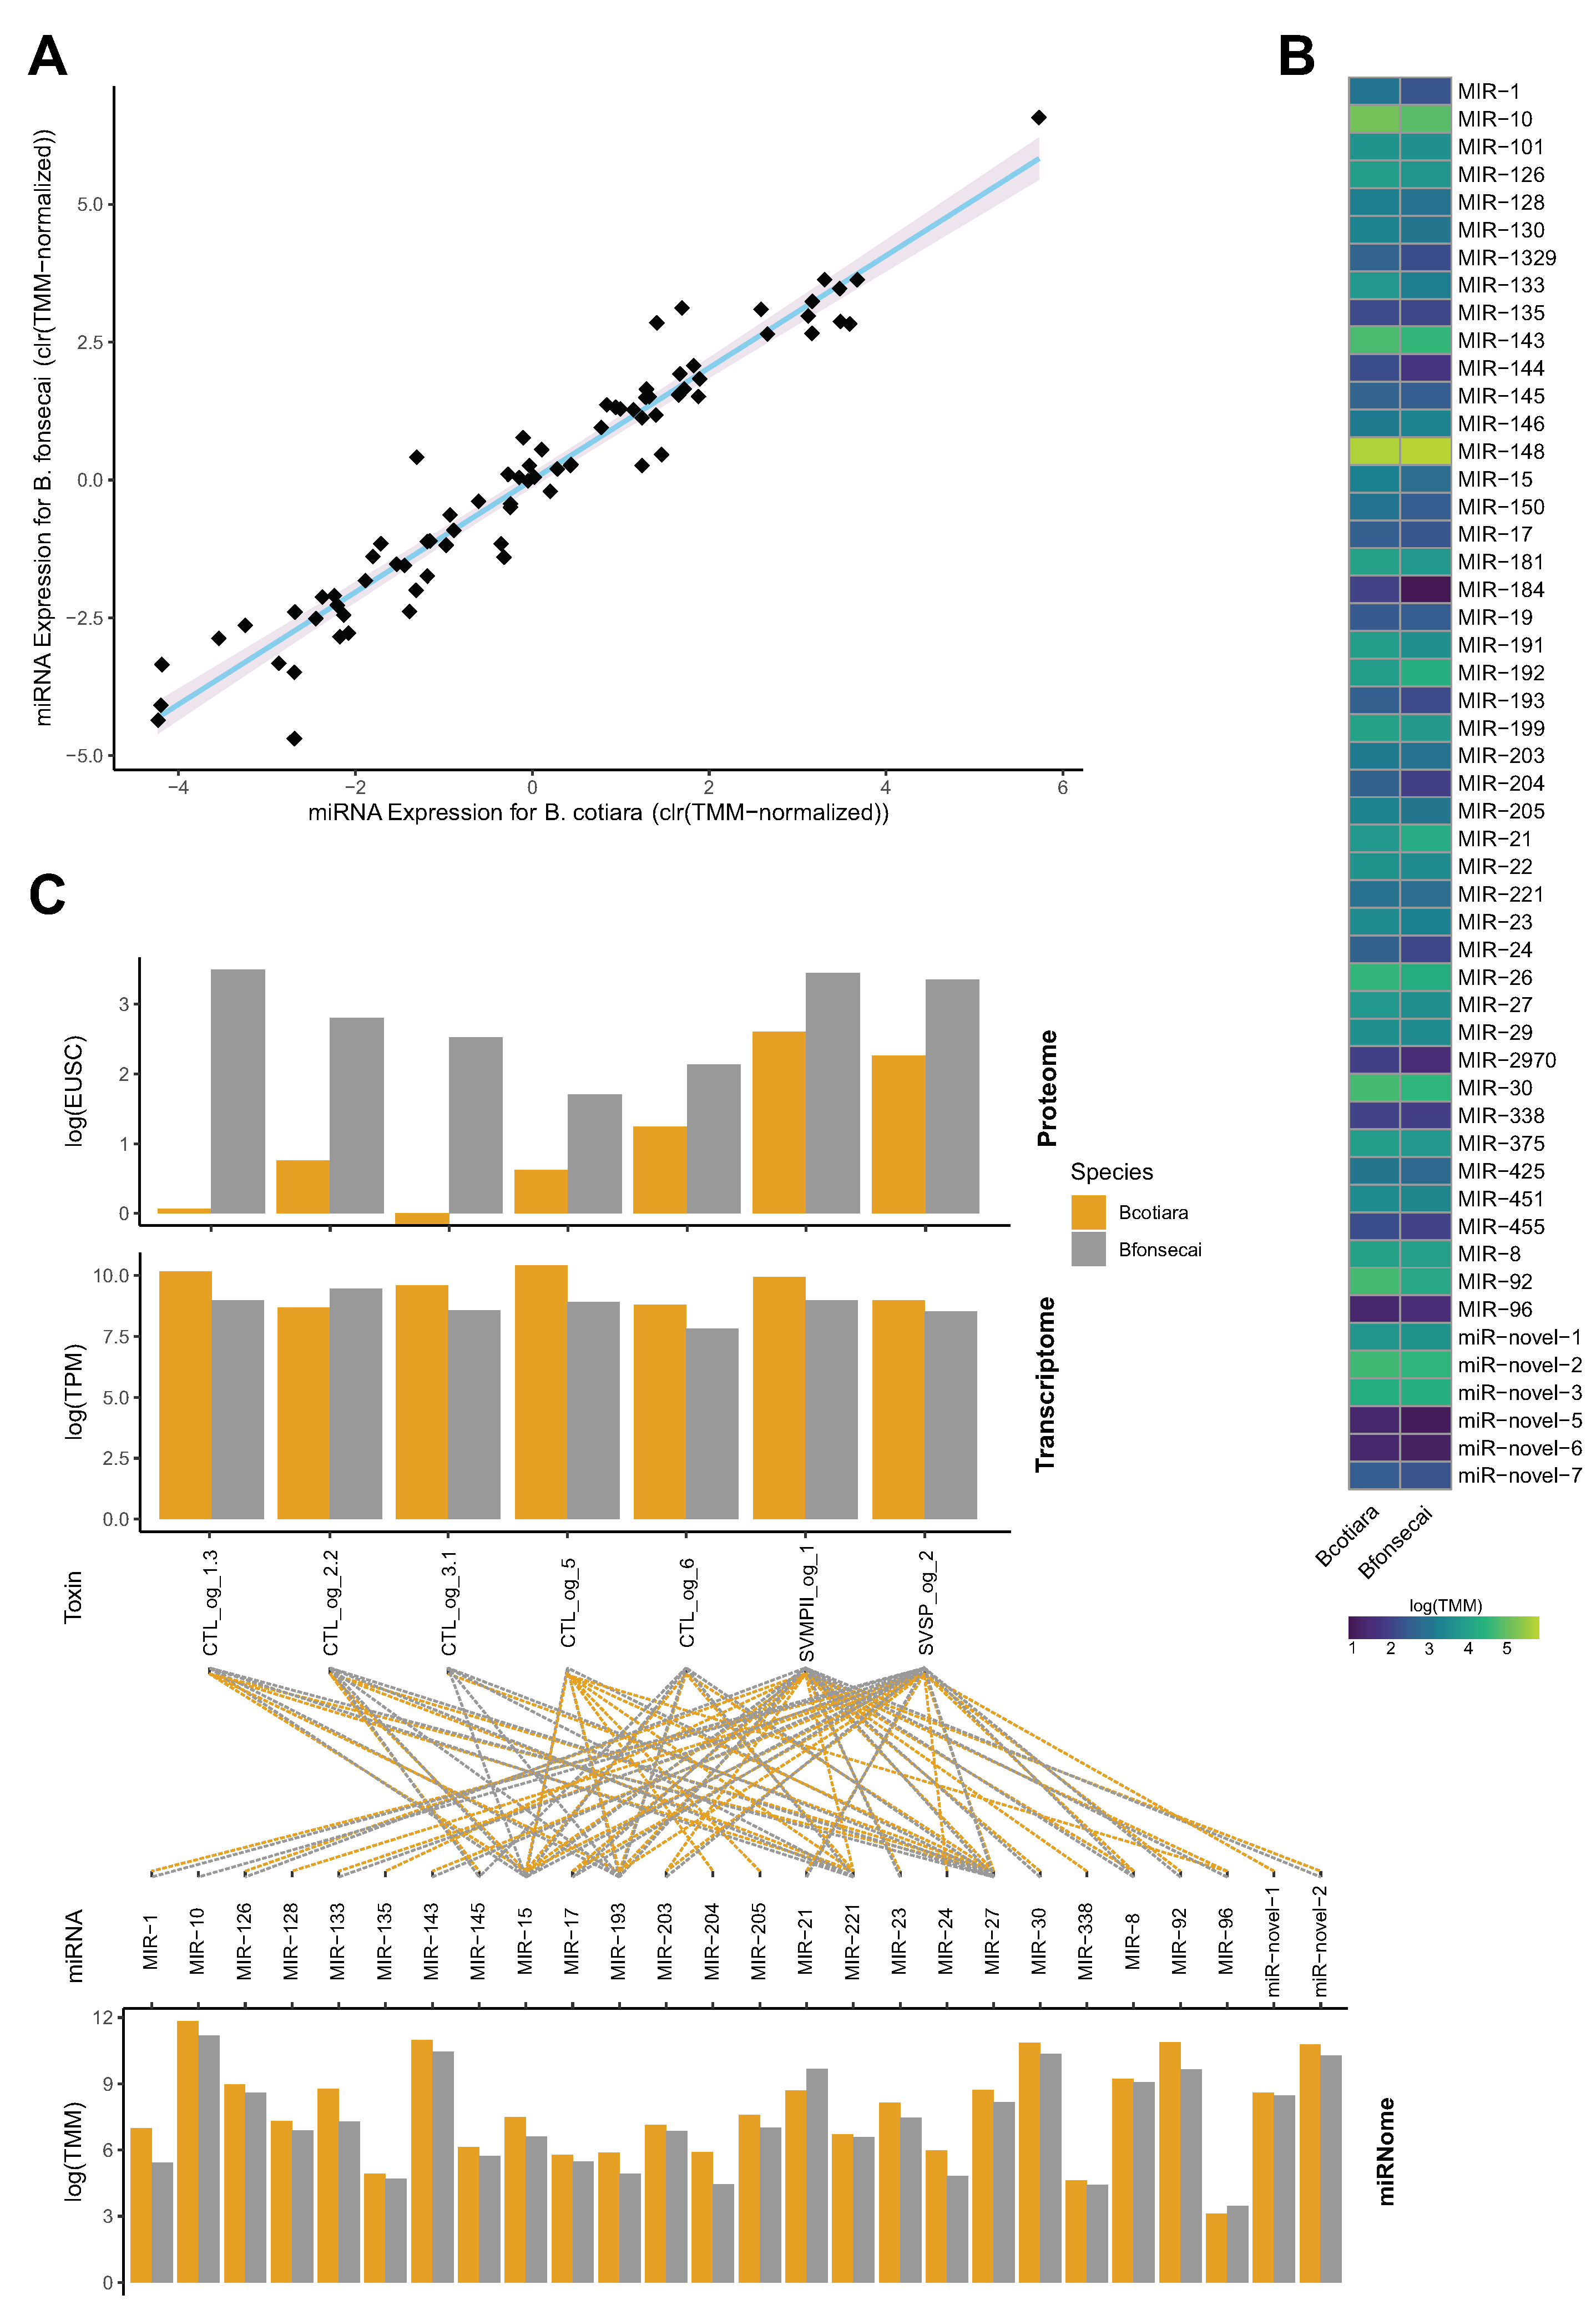
2.4. Evaluating Regulatory Mechanisms in the Venom Gland
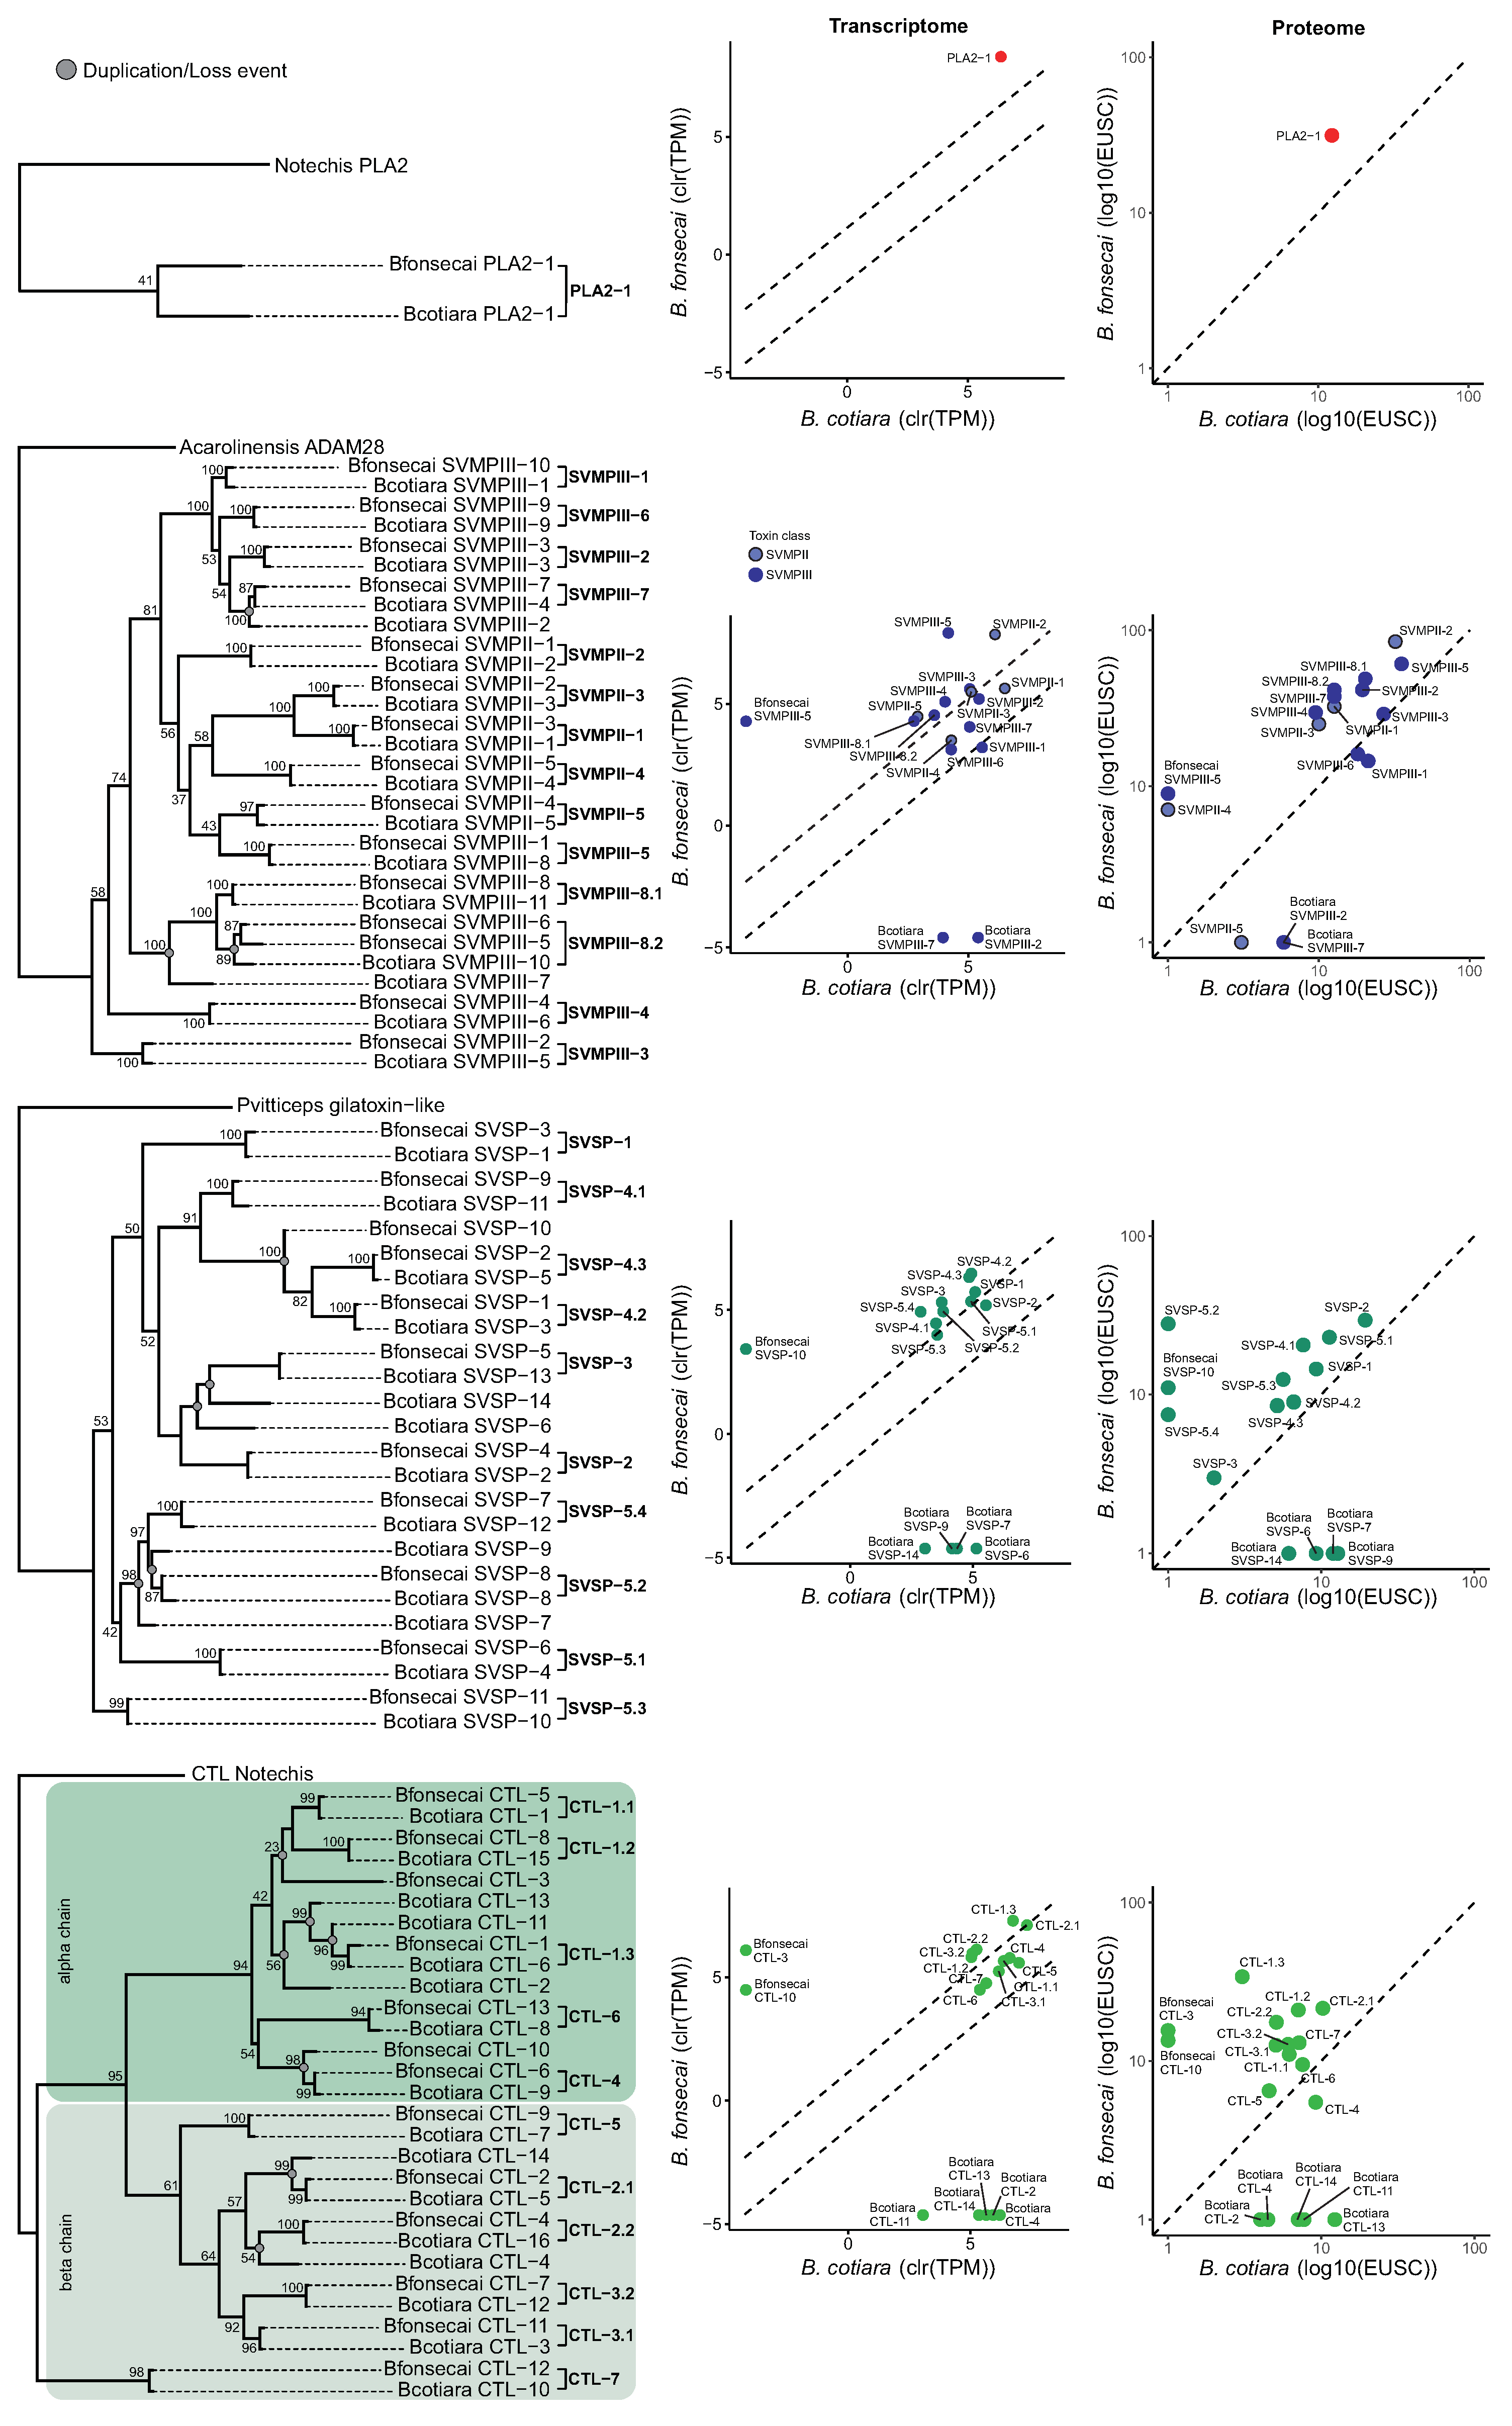
2.5. Toxin Gene Family Analysis
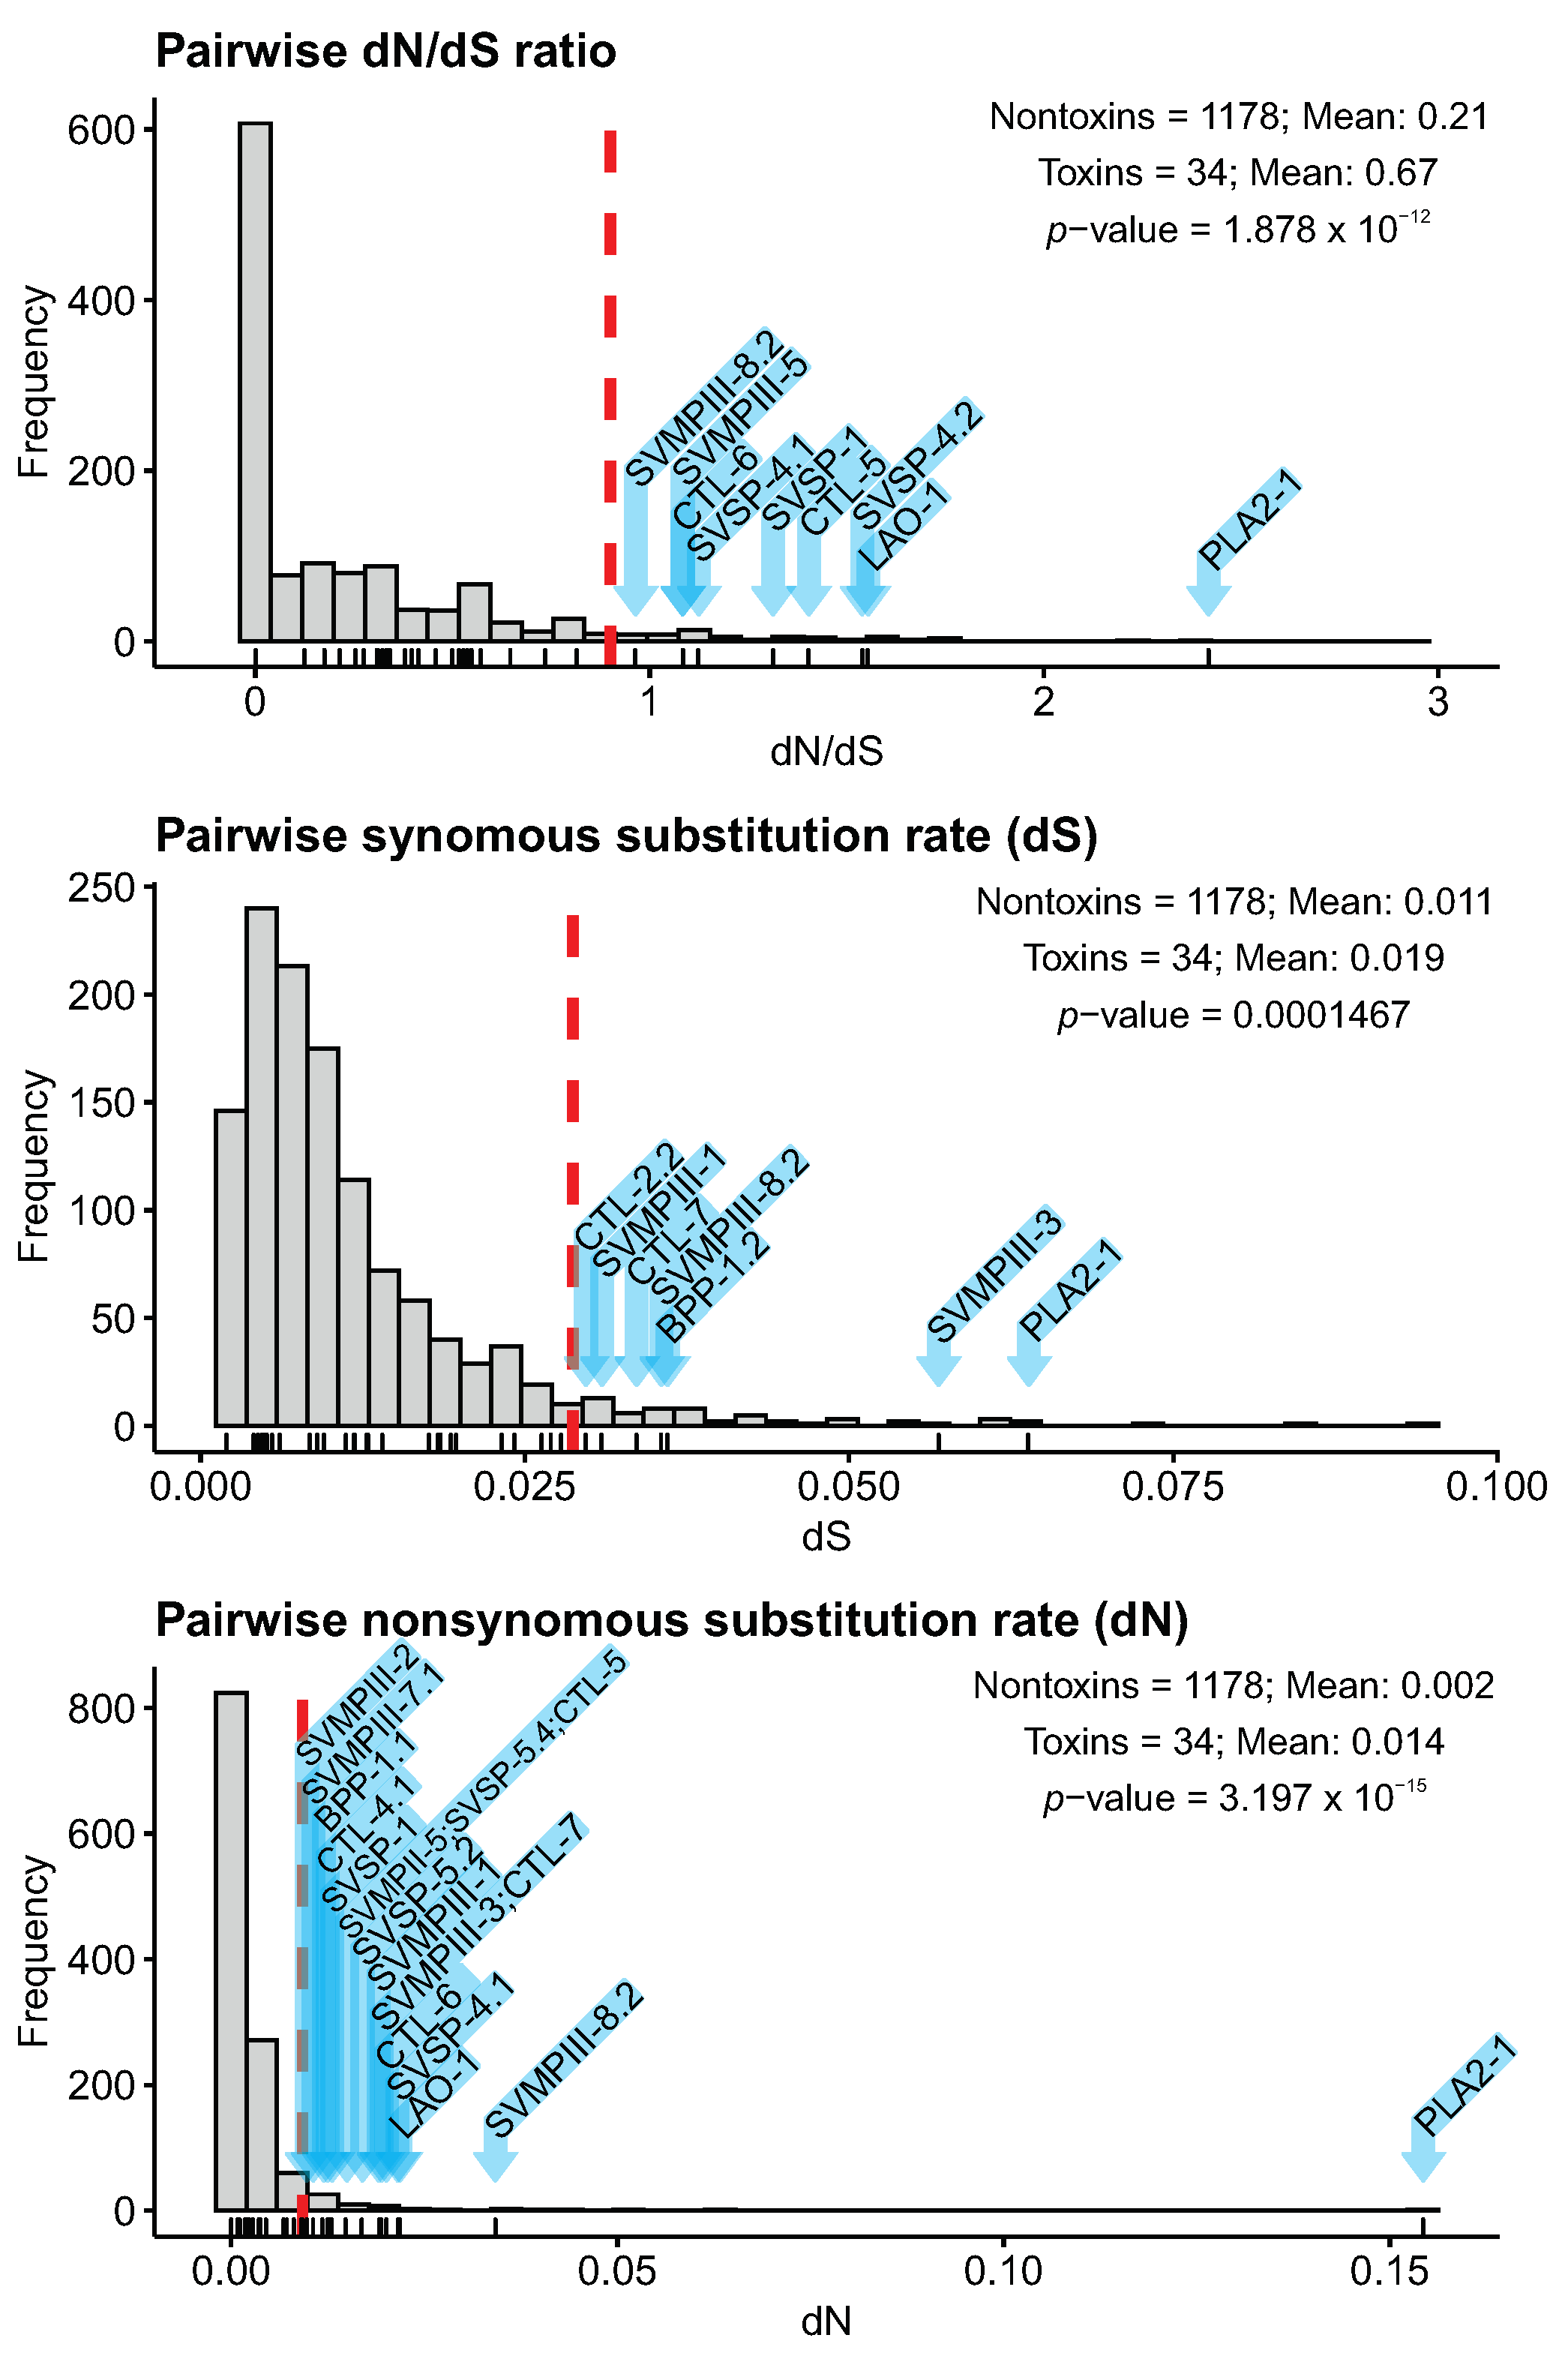
2.6. Toxin Sequence Diversification Analyses
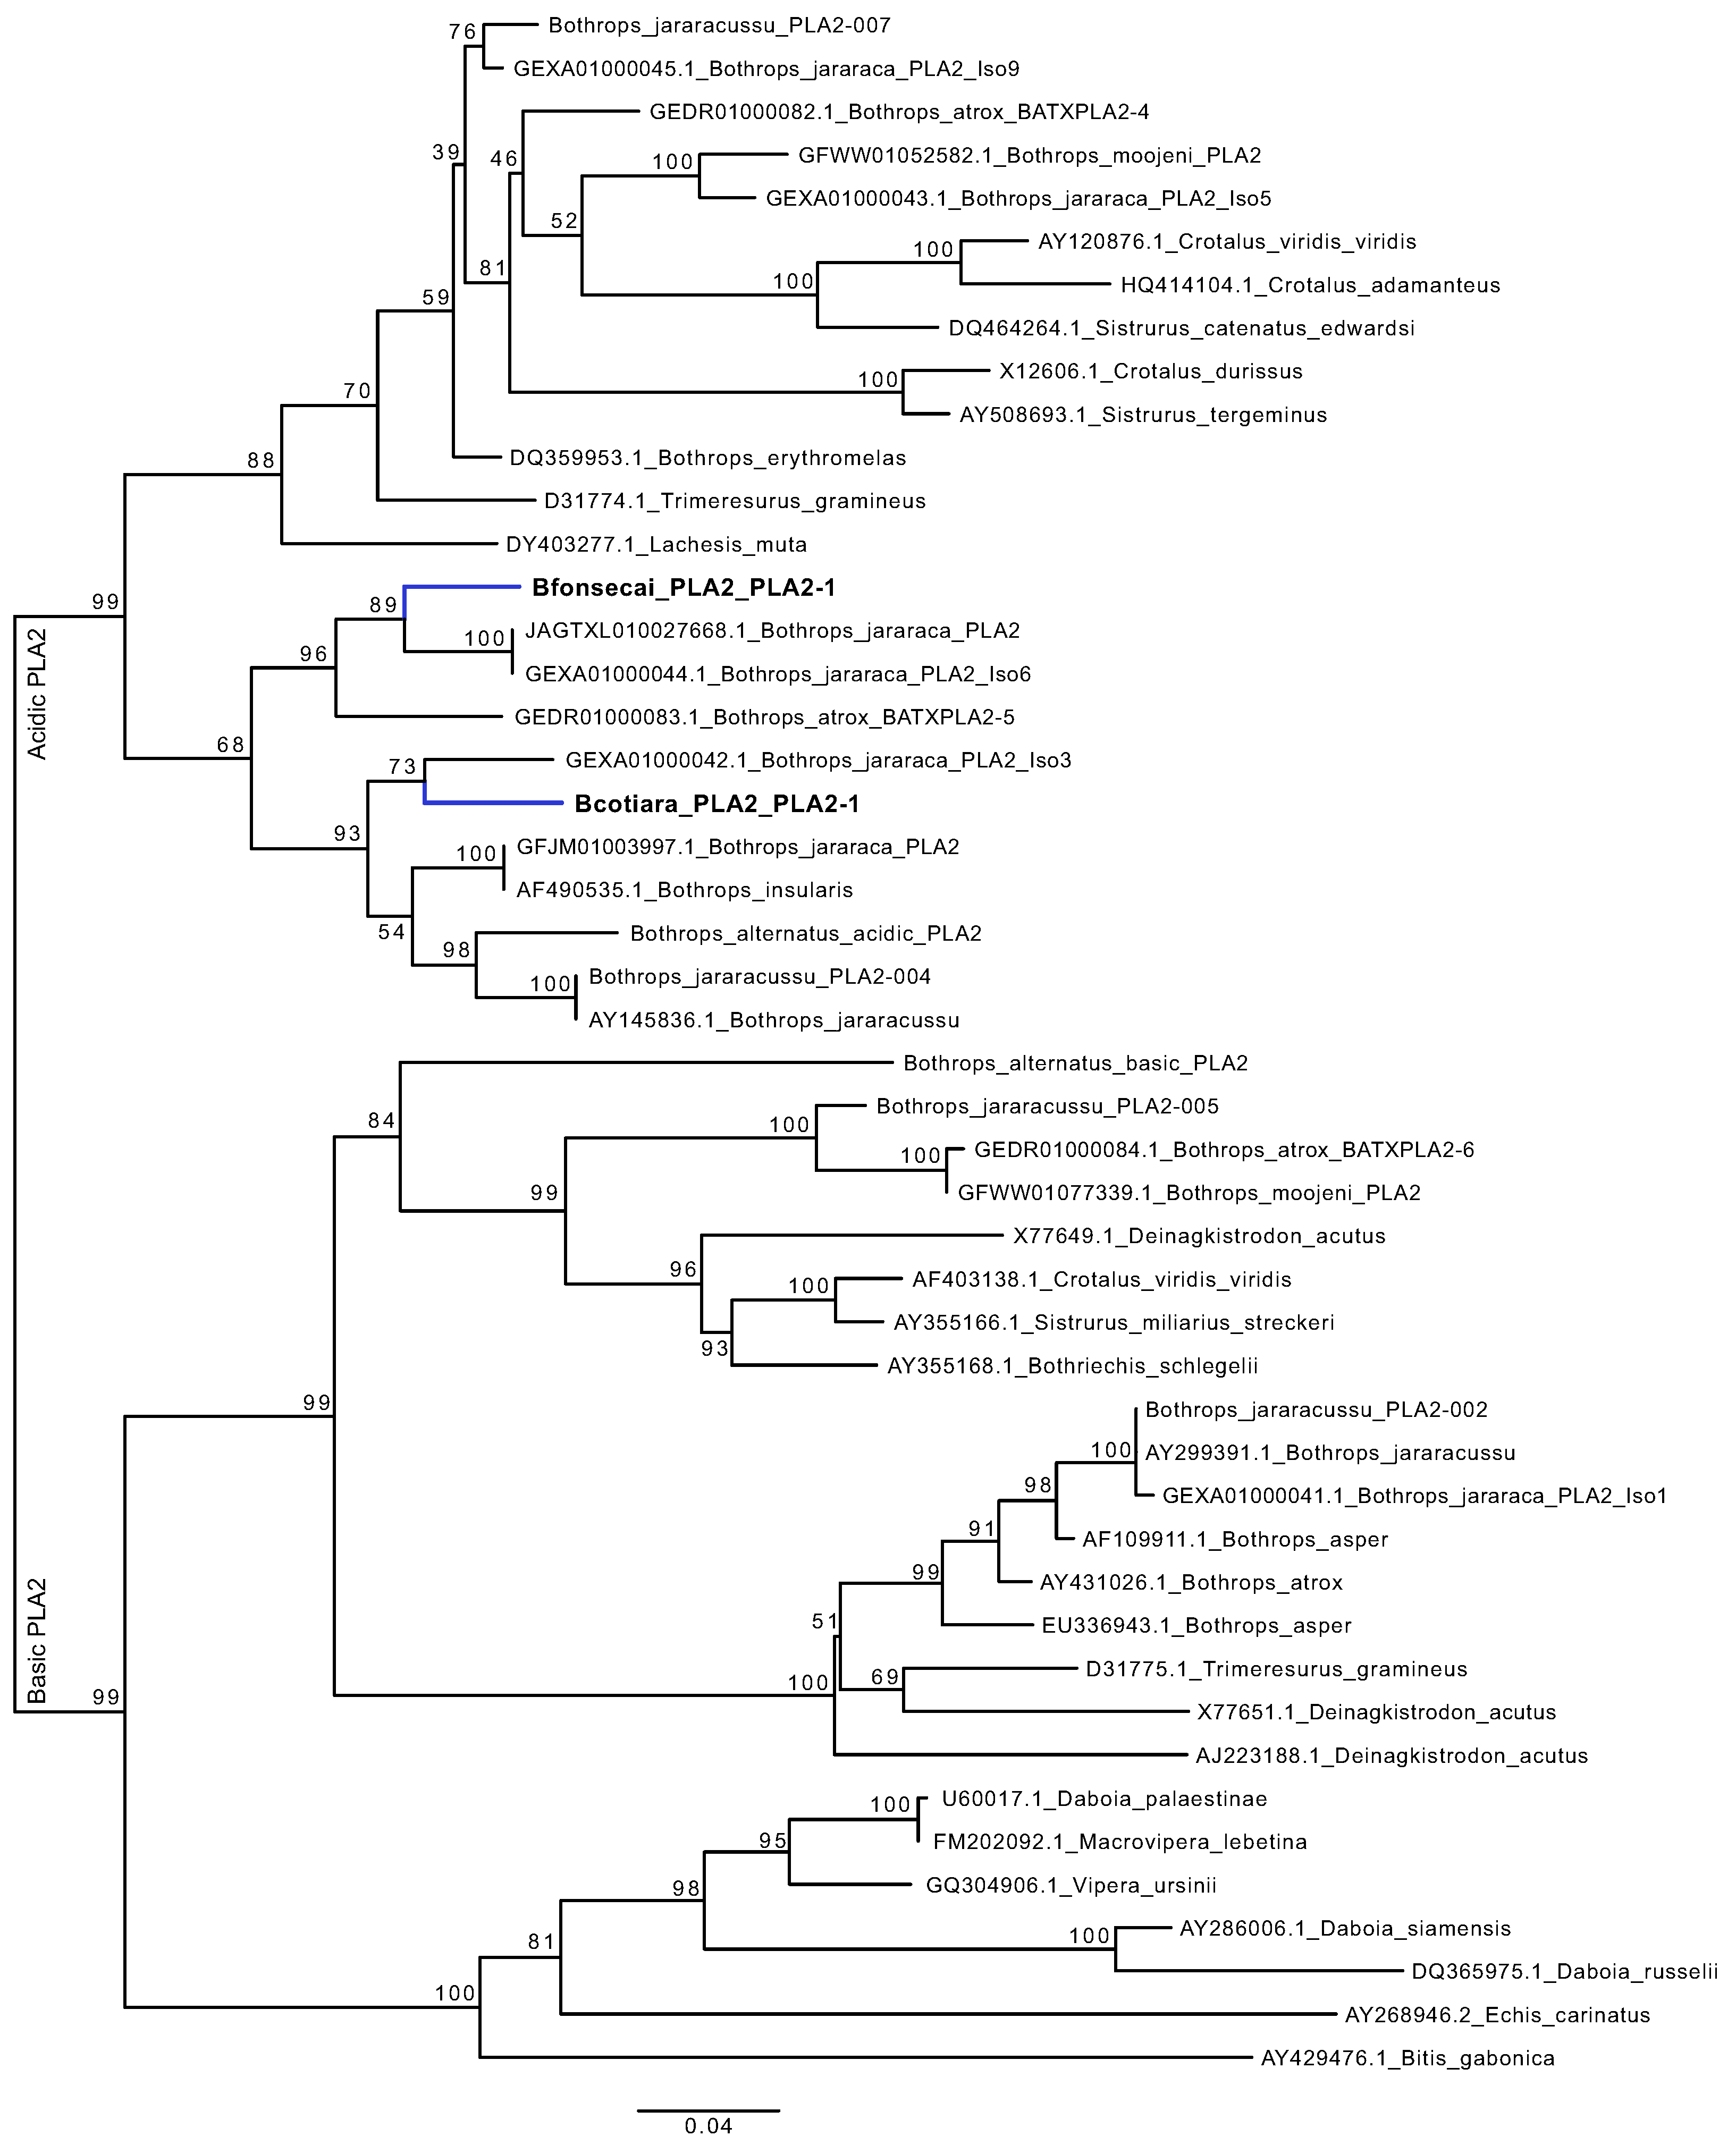
2.7. Are the PLA2 Genes of B. cotiara and B. fonsecai Direct Orthologs?
3. Conclusions
4. Materials and Methods
4.1. Sample Collection
4.2. RNA Extraction and Sequencing Protocol
4.3. Transcriptome Assembly, Annotation, and Quantification
4.4. Expression Analyses and Ortholog Identification
4.5. Modularity Analysis
4.6. Identification and Annotation of miRNAs
4.7. UTR Annotation and miRNA-Target Prediction
4.8. Venom Proteome
4.9. Enzymatic Activities of PLA2, SVMP, and SVSP
Supplementary Materials
Author Contributions
Funding
Institutional Review Board Statement
Informed Consent Statement
Data Availability Statement
Acknowledgments
Conflicts of Interest
Abbreviations
| PLA2 | Phospholipase A |
| SVMP | Snake venom metalloproteinase |
| SVSP | Snake venom serine proteinase |
| CTL | C-type lectin |
| BPP | Bradykinin potentiating peptide |
| VEGF-F | Snake venom vascular endothelial growth factor |
| LAO | L-amino Acid Oxidase |
| CRISP | Cysteine-rich secretory protein |
| HYAL | Hyaluronidase |
| NGF | Venom nerve growth factor |
| PLB | Phospholipase B |
| 5NUC | Snake venom 5 nucleotidase |
| DIESTER | Venom phosphodiesterase |
| TSS | Transcription Start Site |
| 3UTR | Three prime untranslated region |
| TPM | Transcripts per million |
| EUSC | Exclusive Unique Spectra Counts |
| TMM | Trimmed Mean of M-values |
| dS | Synonymous substitution rate |
| dN | Nonsynonymous substitution rate |
| dN/dS ratio | |
| Spearman’s rank correlation coefficient | |
| R | Pearson’s correlation coefficient |
| HMM | Hidden Markov Model |
References
- Greene, H.W. Snakes: The Evolution of Mystery in Nature; University of California Press: Berkeley, CA, USA, 1997. [Google Scholar]
- Grundler, M.C.; Rabosky, D.L. Rapid increase in snake dietary diversity and complexity following the end-Cretaceous mass extinction. PLoS Biol. 2021, 19, e3001414. [Google Scholar] [CrossRef] [PubMed]
- Uetz, P.; Koo, M.S.; Aguilar, R.; Brings, E.; Catenazzi, A.; Chang, A.; Wake, D. A quarter century of reptile and amphibian databases. Herpetol. Rev. 2021, 52, 246–255. [Google Scholar]
- Zaher, H.; Murphy, R.W.; Arredondo, J.C.; Graboski, R.; Machado-Filho, P.R.; Mahlow, K.; Montingelli, G.G.; Quadros, A.B.; Orlov, N.L.; Wilkinson, M.; et al. Large-scale molecular phylogeny, morphology, divergence-time estimation, and the fossil record of advanced caenophidian snakes (Squamata: Serpentes). PLoS ONE 2019, 14, e0216148. [Google Scholar]
- Cadle, J.; Greene, H. Phylogenetic patterns, biogeography, and the ecological structure of Neotropical snake assemblages. In Species Diversity in Ecological Communities: Historical and Geographical Perspectives; University of Chicago Press: Chicago, IL, USA, 1993; pp. 281–293. [Google Scholar]
- Campbell, J.; Lamar, W. The Venomous Reptiles of the Western Hemisfere. Volume II. Cornell University Press, New York. Winne, CT (2000). The global decline of reptiles, déjà vu amphibians. Bioscience 2004, 8, 653–666. [Google Scholar]
- Wüster, W.; Salomão, M.; Quijada-Mascareñas, J.A.; Thorpe, R.; Duckett, G.; Puorto, M.; Theakston, R.; Warrell, D. Origins and evolution of the South American pitviper fauna: Evidence from mitochondrial DNA sequence analysis. Biol. Vipers 2002, 111–128. [Google Scholar]
- Carrasco, P.A.; Mattoni, C.I.; Leynaud, G.C.; Scrocchi, G.J. Morphology, phylogeny and taxonomy of South American bothropoid pitvipers (Serpentes, Viperidae). Zool. Scr. 2012, 41, 109–124. [Google Scholar] [CrossRef]
- Martins, M.; Marques, O.A.; Sazima, I. Ecological and phylogenetic correlates of feeding habits in Neotropical pitvipers of the genus Bothrops. Biol. Vipers 2002, 307, 328. [Google Scholar]
- Nogueira, C.C.; Argôlo, A.J.; Arzamendia, V.; Azevedo, J.A.; Barbo, F.E.; Bérnils, R.S.; Bolochio, B.E.; Borges-Martins, M.; Brasil-Godinho, M.; Braz, H.; et al. Atlas of Brazilian snakes: Verified point-locality maps to mitigate the Wallacean shortfall in a megadiverse snake fauna. S. Am. J. Herpetol. 2019, 14, 1–274. [Google Scholar] [CrossRef]
- Alencar, L.R.; Quental, T.B.; Grazziotin, F.G.; Alfaro, M.L.; Martins, M.; Venzon, M.; Zaher, H. Diversification in vipers: Phylogenetic relationships, time of divergence and shifts in speciation rates. Mol. Phylogenet. Evol. 2016, 105, 50–62. [Google Scholar] [CrossRef]
- Almeida-Santos, S.M.; Salomao, M.d.G. Reproduction in neotropical pitvipers, with emphasis on species of the genus Bothrops. Biol. Vipers 2002, 1, 445–462. [Google Scholar]
- Tashima, A.K.; Sanz, L.; Camargo, A.C.; Serrano, S.M.; Calvete, J.J. Snake venomics of the Brazilian pitvipers Bothrops cotiara and Bothrops fonsecai. Identification of taxonomy markers. J. Proteom. 2008, 71, 473–485. [Google Scholar] [CrossRef] [PubMed]
- De Roodt, A.; Fernández, J.; Solano, D.; Lomonte, B. A myotoxic Lys49 phospholipase A2-homologue is the major component of the venom of Bothrops cotiara from Misiones, Argentina. Toxicon 2018, 148, 143–148. [Google Scholar] [CrossRef] [PubMed]
- Queiroz, G.P.; Pessoa, L.A.; Portaro, F.C.; Maria de Fátima, D.F.; Tambourgi, D.V. Interspecific variation in venom composition and toxicity of Brazilian snakes from Bothrops genus. Toxicon 2008, 52, 842–851. [Google Scholar] [CrossRef] [PubMed]
- Rokyta, D.R.; Wray, K.P.; Margres, M.J. The genesis of an exceptionally lethal venom in the timber rattlesnake (Crotalus horridus) revealed through comparative venom-gland transcriptomics. BMC Genom. 2013, 14, 394. [Google Scholar] [CrossRef] [PubMed]
- Amazonas, D.R.; Portes-Junior, J.A.; Nishiyama, M.Y., Jr.; Nicolau, C.A.; Chalkidis, H.M.; Mourão, R.H.; Grazziotin, F.G.; Rokyta, D.R.; Gibbs, H.L.; Valente, R.H.; et al. Molecular mechanisms underlying intraspecific variation in snake venom. J. Proteom. 2018, 181, 60–72. [Google Scholar] [CrossRef]
- Hofmann, E.P.; Rautsaw, R.M.; Strickland, J.L.; Holding, M.L.; Hogan, M.P.; Mason, A.J.; Rokyta, D.R.; Parkinson, C.L. Comparative venom-gland transcriptomics and venom proteomics of four Sidewinder Rattlesnake (Crotalus cerastes) lineages reveal little differential expression despite individual variation. Sci. Rep. 2018, 8, 15534. [Google Scholar] [CrossRef]
- Mason, A.J.; Margres, M.J.; Strickland, J.L.; Rokyta, D.R.; Sasa, M.; Parkinson, C.L. Trait differentiation and modular toxin expression in palm-pitvipers. BMC Genom. 2020, 21, 147. [Google Scholar] [CrossRef]
- Barua, A.; Mikheyev, A.S. An ancient, conserved gene regulatory network led to the rise of oral venom systems. Proc. Natl. Acad. Sci. USA 2021, 118, e2021311118. [Google Scholar] [CrossRef]
- Rokyta, D.R.; Margres, M.J.; Ward, M.J.; Sanchez, E.E. The genetics of venom ontogeny in the eastern diamondback rattlesnake (Crotalus adamanteus). PeerJ 2017, 5, e3249. [Google Scholar] [CrossRef]
- Freitas-de Sousa, L.A.; Nachtigall, P.G.; Portes-Junior, J.A.; Holding, M.L.; Nystrom, G.S.; Ellsworth, S.A.; Guimarães, N.C.; Tioyama, E.; Ortiz, F.; Silva, B.R.; et al. Size Matters: An Evaluation of the Molecular Basis of Ontogenetic Modifications in the Composition of Bothrops jararacussu Snake Venom. Toxins 2020, 12, 791. [Google Scholar] [CrossRef]
- Durban, J.; Pérez, A.; Sanz, L.; Gómez, A.; Bonilla, F.; Rodríguez, S.; Chacón, D.; Sasa, M.; Angulo, Y.; Gutiérrez, J.M.; et al. Integrated “omics” profiling indicates that miRNAs are modulators of the ontogenetic venom composition shift in the Central American rattlesnake, Crotalus simus simus. BMC Genom. 2013, 14, 234. [Google Scholar] [CrossRef] [PubMed]
- Durban, J.; Sanz, L.; Trevisan-Silva, D.; Neri-Castro, E.; Alagon, A.; Calvete, J.J. Integrated venomics and venom gland transcriptome analysis of juvenile and adult mexican rattlesnakes Crotalus simus, C. tzabcan, and C. culminatus revealed miRNA-modulated ontogenetic shifts. J. Proteome Res. 2017, 16, 3370–3390. [Google Scholar] [CrossRef] [PubMed]
- Durban, J.; Sasa, M.; Calvete, J.J. Venom gland transcriptomics and microRNA profiling of juvenile and adult yellow-bellied sea snake, Hydrophis platurus, from Playa del Coco (Guanacaste, Costa Rica). Toxicon 2018, 153, 96–105. [Google Scholar] [CrossRef] [PubMed]
- Junqueira-de Azevedo, I.L.; Bastos, C.M.V.; Ho, P.L.; Luna, M.S.; Yamanouye, N.; Casewell, N.R. Venom-related transcripts from Bothrops jararaca tissues provide novel molecular insights into the production and evolution of snake venom. Mol. Biol. Evol. 2015, 32, 754–766. [Google Scholar] [CrossRef] [PubMed]
- Amorim, F.G.; Morandi-Filho, R.; Fujimura, P.T.; Ueira-Vieira, C.; Sampaio, S.V. New findings from the first transcriptome of the Bothrops moojeni snake venom gland. Toxicon 2017, 140, 105–117. [Google Scholar] [CrossRef] [PubMed]
- Nachtigall, P.G.; Rautsaw, R.M.; Ellsworth, S.A.; Mason, A.J.; Rokyta, D.R.; Parkinson, C.L.; Junqueira-de Azevedo, I.L. ToxCodAn: A new toxin annotator and guide to venom gland transcriptomics. Briefings Bioinform. 2021, 22, bbab095. [Google Scholar] [CrossRef]
- Kumar, S.; Stecher, G.; Suleski, M.; Hedges, S.B. TimeTree: A resource for timelines, timetrees, and divergence times. Mol. Biol. Evol. 2017, 34, 1812–1819. [Google Scholar] [CrossRef] [PubMed]
- Kitano, E.S.; Garcia, T.C.; Menezes, M.C.; Tashima, A.K.; Zelanis, A.; Serrano, S.M. Cotiarinase is a novel prothrombin activator from the venom of Bothrops cotiara. Biochimie 2013, 95, 1655–1659. [Google Scholar] [CrossRef]
- Murayama, N.; Hayashi, M.A.; Ohi, H.; Ferreira, L.A.; Hermann, V.V.; Saito, H.; Fujita, Y.; Higuchi, S.; Fernandes, B.L.; Yamane, T.; et al. Cloning and sequence analysis of a Bothrops jararaca cDNA encoding a precursor of seven bradykinin-potentiating peptides and a C-type natriuretic peptide. Proc. Natl. Acad. Sci. USA 1997, 94, 1189–1193. [Google Scholar] [CrossRef]
- Von Dassow, G.; Munro, E. Modularity in animal development and evolution: Elements of a conceptual framework for EvoDevo. J. Exp. Zool. 1999, 285, 307–325. [Google Scholar] [CrossRef]
- Rokyta, D.R.; Margres, M.J.; Calvin, K. Post-transcriptional mechanisms contribute little to phenotypic variation in snake venoms. G3 Genes Genomes Genet. 2015, 5, 2375–2382. [Google Scholar] [CrossRef] [PubMed]
- Schezaro-Ramos, R.; Rita de Cássia, O.C.; Randazzo-Moura, P.; Rocha, T.; Cogo, J.C.; Rodrigues-Simioni, L. Influence of phospholipasic inhibition on neuromuscular activity of Bothrops fonsecai snake venom. Toxicon 2017, 130, 35–43. [Google Scholar] [CrossRef] [PubMed]
- Lomonte, B.; Angulo, Y.; Sasa, M.; Gutierrez, J.M. The phospholipase A2 homologues of snake venoms: Biological activities and their possible adaptive roles. Protein Pept. Lett. 2009, 16, 860–876. [Google Scholar] [CrossRef] [PubMed]
- Schield, D.R.; Card, D.C.; Hales, N.R.; Perry, B.W.; Pasquesi, G.M.; Blackmon, H.; Adams, R.H.; Corbin, A.B.; Smith, C.F.; Ramesh, B.; et al. The origins and evolution of chromosomes, dosage compensation, and mechanisms underlying venom regulation in snakes. Genome Res. 2019, 29, 590–601. [Google Scholar] [CrossRef] [PubMed]
- Margres, M.J.; Rautsaw, R.M.; Strickland, J.L.; Mason, A.J.; Schramer, T.D.; Hofmann, E.P.; Stiers, E.; Ellsworth, S.A.; Nystrom, G.S.; Hogan, M.P.; et al. The Tiger Rattlesnake genome reveals a complex genotype underlying a simple venom phenotype. Proc. Natl. Acad. Sci. USA 2021, 118, e2014634118. [Google Scholar] [CrossRef]
- Giorgianni, M.W.; Dowell, N.L.; Griffin, S.; Kassner, V.A.; Selegue, J.E.; Carroll, S.B. The origin and diversification of a novel protein family in venomous snakes. Proc. Natl. Acad. Sci. USA 2020, 117, 10911–10920. [Google Scholar] [CrossRef]
- Castro, H.; Fernandes, M.; Zingali, R. Identification of bothrojaracin-like proteins in snake venoms from Bothrops species and Lachesis muta. Toxicon 1999, 37, 1403–1416. [Google Scholar] [CrossRef]
- Almeida, D.D.; Viala, V.L.; Nachtigall, P.G.; Broe, M.; Gibbs, H.L.; Serrano, S.M.d.T.; Moura-da Silva, A.M.; Ho, P.L.; Nishiyama, M.Y., Jr.; Junqueira-de Azevedo, I.L.M. Tracking the Recruitment and Evolution of Snake Toxins Using the Evolutionary Context Provided by the Bothrops Jararaca Genome. Proc. Natl. Acad. Sci. USA 2021, 118, e2015159118. [Google Scholar] [CrossRef]
- Dowell, N.; Giorgianni, M.; Kassner, V.; Selegue, J.; Sanchez, E.; Carroll, S. The deep origin and recent loss of venom toxin genes in rattlesnakes. Curr. Biol. 2016, 26, 2434–2445. [Google Scholar] [CrossRef]
- Rotenberg, D.; Bamberger, E.; Kochva, E. Studies on ribonucleic acid synthesis in the venom glands of Vipera palaestinae (Ophidia, Reptilia). Biochem. J. 1971, 121, 609–612. [Google Scholar] [CrossRef][Green Version]
- Zhang, J.; Kobert, K.; Flouri, T.; Stamatakis, A. PEAR: A fast and accurate Illumina Paired-End reAd mergeR. Bioinformatics 2014, 30, 614–620. [Google Scholar] [CrossRef] [PubMed]
- Holding, M.L.; Margres, M.J.; Mason, A.J.; Parkinson, C.L.; Rokyta, D.R. Evaluating the performance of de novo assembly methods for venom-gland transcriptomics. Toxins 2018, 10, 249. [Google Scholar] [CrossRef] [PubMed]
- Hölzer, M.; Marz, M. De novo transcriptome assembly: A comprehensive cross-species comparison of short-read RNA-Seq assemblers. GigaScience 2019, 8, giz039. [Google Scholar] [CrossRef] [PubMed]
- Haas, B.J.; Papanicolaou, A.; Yassour, M.; Grabherr, M.; Blood, P.D.; Bowden, J.; Couger, M.B.; Eccles, D.; Li, B.; Lieber, M.; et al. De novo transcript sequence reconstruction from RNA-seq using the Trinity platform for reference generation and analysis. Nat. Protoc. 2013, 8, 1494–1512. [Google Scholar] [CrossRef]
- Rokyta, D.R.; Lemmon, A.R.; Margres, M.J.; Aronow, K. The venom-gland transcriptome of the eastern diamondback rattlesnake (Crotalus adamanteus). BMC Genom. 2012, 13, 312. [Google Scholar] [CrossRef]
- Chang, Z.; Li, G.; Liu, J.; Zhang, Y.; Ashby, C.; Liu, D.; Cramer, C.L.; Huang, X. Bridger: A new framework for de novo transcriptome assembly using RNA-seq data. Genome Biol. 2015, 16, 30. [Google Scholar] [CrossRef]
- Bushmanova, E.; Antipov, D.; Lapidus, A.; Prjibelski, A.D. rnaSPAdes: A de novo transcriptome assembler and its application to RNA-Seq data. GigaScience 2019, 8, giz100. [Google Scholar] [CrossRef]
- Fu, L.; Niu, B.; Zhu, Z.; Wu, S.; Li, W. CD-HIT: Accelerated for clustering the next-generation sequencing data. Bioinformatics 2012, 28, 3150–3152. [Google Scholar] [CrossRef]
- Nachtigall, P.G.; Kashiwabara, A.Y.; Durham, A.M. CodAn: Predictive models for precise identification of coding regions in eukaryotic transcripts. Briefings Bioinform. 2020, 22, bbaa045. [Google Scholar] [CrossRef]
- Waterhouse, R.M.; Seppey, M.; Simão, F.A.; Manni, M.; Ioannidis, P.; Klioutchnikov, G.; Kriventseva, E.V.; Zdobnov, E.M. BUSCO applications from quality assessments to gene prediction and phylogenomics. Mol. Biol. Evol. 2018, 35, 543–548. [Google Scholar] [CrossRef]
- Langmead, B.; Salzberg, S.L. Fast gapped-read alignment with Bowtie 2. Nat. Methods 2012, 9, 357. [Google Scholar] [CrossRef] [PubMed]
- Li, B.; Dewey, C.N. RSEM: Accurate transcript quantification from RNA-Seq data with or without a reference genome. BMC Bioinform. 2011, 12, 323. [Google Scholar] [CrossRef] [PubMed]
- Rokyta, D.R.; Ward, M.J. Venom-gland transcriptomics and venom proteomics of the black-back scorpion (Hadrurus spadix) reveal detectability challenges and an unexplored realm of animal toxin diversity. Toxicon 2017, 128, 23–37. [Google Scholar] [CrossRef] [PubMed]
- Emms, D.M.; Kelly, S. OrthoFinder: Phylogenetic orthology inference for comparative genomics. Genome Biol. 2019, 20, 238. [Google Scholar] [CrossRef] [PubMed]
- Rozewicki, J.; Li, S.; Amada, K.M.; Standley, D.M.; Katoh, K. MAFFT-DASH: Integrated protein sequence and structural alignment. Nucleic Acids Res. 2019, 47, W5–W10. [Google Scholar] [CrossRef]
- Nguyen, L.T.; Schmidt, H.A.; Von Haeseler, A.; Minh, B.Q. IQ-TREE: A fast and effective stochastic algorithm for estimating maximum-likelihood phylogenies. Mol. Biol. Evol. 2015, 32, 268–274. [Google Scholar] [CrossRef]
- Russo, P.S.; Ferreira, G.R.; Cardozo, L.E.; Bürger, M.C.; Arias-Carrasco, R.; Maruyama, S.R.; Hirata, T.D.; Lima, D.S.; Passos, F.M.; Fukutani, K.F.; et al. CEMiTool: A Bioconductor package for performing comprehensive modular co-expression analyses. BMC Bioinform. 2018, 19, 56. [Google Scholar] [CrossRef]
- Martin, M. Cutadapt removes adapter sequences from high-throughput sequencing reads. EMBnet J. 2011, 17, 10–12. [Google Scholar] [CrossRef]
- Nachtigall, P.G.; Bovolenta, L.A.; Patton, J.G.; Fromm, B.; Lemke, N.; Pinhal, D. A comparative analysis of heart microRNAs in vertebrates brings novel insights into the evolution of genetic regulatory networks. BMC Genom. 2021, 22, 153. [Google Scholar] [CrossRef]
- Vitsios, D.M.; Kentepozidou, E.; Quintais, L.; Benito-Gutiérrez, E.; van Dongen, S.; Davis, M.P.; Enright, A.J. Mirnovo: Genome-free prediction of microRNAs from small RNA sequencing data and single-cells using decision forests. Nucleic Acids Res. 2017, 45, e177. [Google Scholar] [CrossRef]
- Marco, A. SeedVicious: Analysis of microRNA target and near-target sites. PLoS ONE 2018, 13, e0195532. [Google Scholar] [CrossRef] [PubMed]
- Oliveira, A.C.; Bovolenta, L.A.; Nachtigall, P.G.; Herkenhoff, M.E.; Lemke, N.; Pinhal, D. Combining results from distinct microRNA target prediction tools enhances the performance of analyses. Front. Genet. 2017, 8, 59. [Google Scholar] [CrossRef] [PubMed]
- Aitchison, J. The statistical analysis of compositional data. J. R. Stat. Soc. Ser. (Methodol.) 1982, 44, 139–160. [Google Scholar] [CrossRef]
- Knittel, P.S.; Long, P.F.; Brammall, L.; Marques, A.C.; Almeida, M.T.; Padilla, G.; Moura-da Silva, A.M. Characterising the enzymatic profile of crude tentacle extracts from the South Atlantic jellyfish Olindias sambaquiensis (Cnidaria: Hydrozoa). Toxicon 2016, 119, 1–7. [Google Scholar] [CrossRef]


Publisher’s Note: MDPI stays neutral with regard to jurisdictional claims in published maps and institutional affiliations. |
© 2022 by the authors. Licensee MDPI, Basel, Switzerland. This article is an open access article distributed under the terms and conditions of the Creative Commons Attribution (CC BY) license (https://creativecommons.org/licenses/by/4.0/).
Share and Cite
Nachtigall, P.G.; Freitas-de-Sousa, L.A.; Mason, A.J.; Moura-da-Silva, A.M.; Grazziotin, F.G.; Junqueira-de-Azevedo, I.L.M. Differences in PLA2 Constitution Distinguish the Venom of Two Endemic Brazilian Mountain Lanceheads, Bothrops cotiara and Bothrops fonsecai. Toxins 2022, 14, 237. https://doi.org/10.3390/toxins14040237
Nachtigall PG, Freitas-de-Sousa LA, Mason AJ, Moura-da-Silva AM, Grazziotin FG, Junqueira-de-Azevedo ILM. Differences in PLA2 Constitution Distinguish the Venom of Two Endemic Brazilian Mountain Lanceheads, Bothrops cotiara and Bothrops fonsecai. Toxins. 2022; 14(4):237. https://doi.org/10.3390/toxins14040237
Chicago/Turabian StyleNachtigall, Pedro G., Luciana A. Freitas-de-Sousa, Andrew J. Mason, Ana M. Moura-da-Silva, Felipe G. Grazziotin, and Inácio L. M. Junqueira-de-Azevedo. 2022. "Differences in PLA2 Constitution Distinguish the Venom of Two Endemic Brazilian Mountain Lanceheads, Bothrops cotiara and Bothrops fonsecai" Toxins 14, no. 4: 237. https://doi.org/10.3390/toxins14040237
APA StyleNachtigall, P. G., Freitas-de-Sousa, L. A., Mason, A. J., Moura-da-Silva, A. M., Grazziotin, F. G., & Junqueira-de-Azevedo, I. L. M. (2022). Differences in PLA2 Constitution Distinguish the Venom of Two Endemic Brazilian Mountain Lanceheads, Bothrops cotiara and Bothrops fonsecai. Toxins, 14(4), 237. https://doi.org/10.3390/toxins14040237