Regular Fat and Reduced Fat Dairy Products Show Similar Associations with Markers of Adolescent Cardiometabolic Health


 ,
,
Abstract
:1. Introduction
2. Subjects and Methods
2.1. Subjects
2.2. Dietary Intake Assessment

| Mean ± SD or n (%) | Girls (n = 461) | p | Boys (n = 399) | p | ||
|---|---|---|---|---|---|---|
| Follow-up Year | Follow-up Year | |||||
| 14 | 17 | 14 | 17 | |||
| Age (yr) | 14.0 ± 0.2 | 17.0 ± 0.2 | <0.001 | 14.0 ± 0.2 | 16.9 ± 0.2 | <0.001 |
| Height (m) | 1.62 ± 0.10 | 1.66 ± 0.06 | <0.001 | 1.67 ± 0.09 | 1.79 ± 0.07 | <0.001 |
| Weight (kg) | 56.3 ± 11.6 | 63.0 ± 13.0 | <0.001 | 57.8 ± 13.8 | 71.9 ± 14.4 | <0.001 |
| Waist to height ratio | 0.45 ± 0.06 | 0.46 ± 0.06 | <0.001 | 0.453 ± 0.062 | 0.448 ± 0.057 | 0.005 |
| BMI (kg/m2) | 21.3 ± 4.00 | 22.9 ± 4.31 | <0.001 | 20.6 ± 3.87 | 22.4 ± 3.92 | <0.001 |
| Aerobic fitness a | 98.6 ± 19.5 | 102.3 ± 25.5 | 0.002 | 126.4 ± 31.3 | 158.3 ± 40.7 | <0.001 |
| Family’s characteristics | ||||||
| Maternal age (yr) | 29.4 ± 5.7 | NA | 30.0 ± 5.1 | NA | ||
| Single parent family | 83 (18.0) | 98 (21.3) | <0.001 | 51 (12.8) | 72 (18.0) | <0.001 |
| Annual family income ($AUD) | ||||||
| Up to 35,000 | 100 (21.7) | 60 (13.0) | <0.001 | 71 (17.8) | 46 (11.5) | <0.001 |
| 35,001–70,000 | 165 (35.8) | 107 (23.2) | 138 (34.6) | 90 (22.6) | ||
| 70,001 and over | 189 (41.0) | 253 (54.9) | 183 (45.9) | 247 (61.9) | ||
| Dietary variables | ||||||
| Ever breastfed (yes) | 410 (88.9) | NA | 353 (88.5) | NA | ||
| Energy (MJ/day) | 8.75 ± 2.77 | 8.00 ± 2.64 | <0.001 | 10.18 ± 2.84 | 10.90 ± 3.46 | <0.001 |
| Total dairy (g/day) | 439 ± 279 (median 394) | 350 ± 247 (median 303) | <0.001 | 621 ± 350 (median 567) | 570 ± 372 (median 495) | 0.009 |
| Regular fat dairy (g/day) | 228 ± 228 (median 132) | 153 ± 194 (median 70) | <0.001 | 358 ± 373 (median 205) | 314 ± 337 (median 160) | 0.007 |
| Reduced fat dairy b (g/day) | 211 ± 266 (median 104) | 197 ± 218 (median 125) | 0.24 | 263 ± 301 (median 130) | 257 ± 321 (median 130) | 0.70 |
| Total dairy serves (calcium eq serves/day) | 2.18 ± 1.24 (median 1.99) | 1.85 ± 1.24 (median 1.63) | <0.001 | 2.92 ± 1.53 (median 2.67) | 2.80 ± 1.71 (median 2.45) | 0.18 |
| Regular fat dairy serves (calcium eq serves/day) | 1.14 ± 1.05 (median 0.78) | 0.84 ± 1.04 (median 0.42) | <0.001 | 1.69 ± 1.70 (median 1.06) | 1.55 ± 1.58 (median 1.00) | 0.06 |
| Reduced fat dairy serves (calcium eq serves/day) | 1.04 ± 1.24 (median 0.54) | 1.01 ± 1.06 (median 0.73) | 0.56 | 1.23 ± 1.35 (median 0.65) | 1.25 ± 1.49 (median 0.63) | 0.70 |
| Calcium (mg/day) | 1033 ± 480 (median 938) | 913 ± 465 (median 855) | <0.001 | 1295 ± 541 (median 1226) | 1291 ± 656 (median 1174) | 0.90 |
| Protein (g/day) | 85.5 ± 27.3 | 79.2 ± 28.8 | <0.001 | 101 ± 28.6 | 107 ± 38.0 | 0.002 |
| Carbohydrate (g/day) | 253 ± 87 | 228 ± 76 | <0.001 | 292 ± 86 | 305 ± 102 | 0.02 |
| Total fat (g/day) | 82.7 ± 29.6 | 70.8 ± 28.7 | <0.001 | 96.3 ± 32.8 | 99.4 ± 38.5 | 0.12 |
| Polyunsat fat (g/day) | 12.9 ± 6.12 | 10.4 ± 5.67 | <0.001 | 14.2 ± 6.89 | 13.3 ± 7.07 | 0.04 |
| Monounsat fat (g/day) | 28.5 ± 10.3 | 24.1 ± 9.74 | <0.001 | 33.3 ± 11.7 | 34.0 ± 13.2 | 0.31 |
| Saturated fat (g/day) | 35.8 ± 14.5 | 30.7 ± 14.4 | <0.001 | 42.7 ± 16.6 | 44.6 ± 19.6 | 0.05 |
| Healthy diet pattern score c | 0.05 ± 0.85 (median −0.10) | 0.06 ± 0.88 (median −0.08) | 0.76 | −0.01 ± 0.88 (median −0.38) | −0.07 ± 0.89 (median −0.41) | 0.14 |
| Western diet pattern score c | −0.21 ± 0.83 (median −0.07) | −0.32 ± 0.68 (median −0.21) | 0.005 | 0.07 ± 0.81 (median −0.09) | 0.35 ± 0.90 (median 0.23) | <0.001 |
| Reporting status | ||||||
| Under-reporter | 161 (34.9) | 221 (47.9) | <0.001 | 46 (11.5) | 65 (18.5) | 0.03 |
| Plausible-reporter | 237 (51.4) | 171 (37.1) | 256 (64.2) | 228 (65.0) | ||
| Over-reporter | 14 (3.0) | 7 (1.5) | 60 (15.0) | 58 (16.5) | ||
| Cardiometabolic factors | ||||||
| Diastolic blood pressure (mmHg) | 59 ± 7 | 60 ± 6 | 0.10 | 59 ± 7 | 59 ± 7 | 0.33 |
| Systolic blood pressure (mmHg) | 109 ± 9 | 110 ± 10 | 0.14 | 114 ± 11 | 119 ± 10 | <0.001 |
| HDL-cholesterol (mmol/L) | 1.44 ± 0.32 | 1.42 ± 0.31 | 0.19 | 1.37 ± 0.29 | 1.22 ± 0.24 | <0.001 |
| LDL-cholesterol (mmol/L) | 2.36 ± 0.59 | 2.39 ± 0.61 | 0.36 | 2.26 ± 0.67 | 2.22 ± 0.67 | 0.15 |
| Total cholesterol (mmol/L) | 4.27 ± 0.63 | 4.26 ± 0.71 | 0.85 | 4.05 ± 0.73 | 3.91 ± 0.74 | <0.001 |
| Total:HDL-cholesterol ratio | 3.11 ± 0.81 | 3.12 ± 0.71 | 0.80 | 3.05 ± 0.74 | 3.32 ± 0.84 | <0.001 |
| Triglycerides (mmol/L) | 1.02 ± 0.41 | 1.00 ± 0.42 | 0.36 | 0.91 ± 0.45 | 1.03 ± 0.57 | 0.001 |
| Glucose (mmol/L) | 4.68 ± 0.39 | 4.62 ± 0.92 | 0.011 | 4.86 ± 0.38 | 4.78 ± 0.49 | 0.002 |
| Insulin (mU/L) | 11.9 ± 6.66 (median 10.5) | 9.77 ± 14.4 (median 8.34) | 0.003 | 11.1 ± 8.12 (median 9.50) | 8.57 ± 6.62 (median 7.16) | <0.001 |
| HOMA-IR d | 2.50 ± 1.57 (median 2.18) | 2.07 ± 3.60 (median 1.69) | 0.025 | 2.45 ± 2.15 (median 2.01) | 1.85 ± 1.53 (median 1.51) | <0.001 |
| CRP (mg/L) | 1.68 ± 5.27 (median 0.48) | 2.39 ± 4.48 (median 0.66) | 0.12 | 1.24 ± 1.99 (median 0.52) | 1.31 ± 1.96 (median 0.40) | 0.72 |
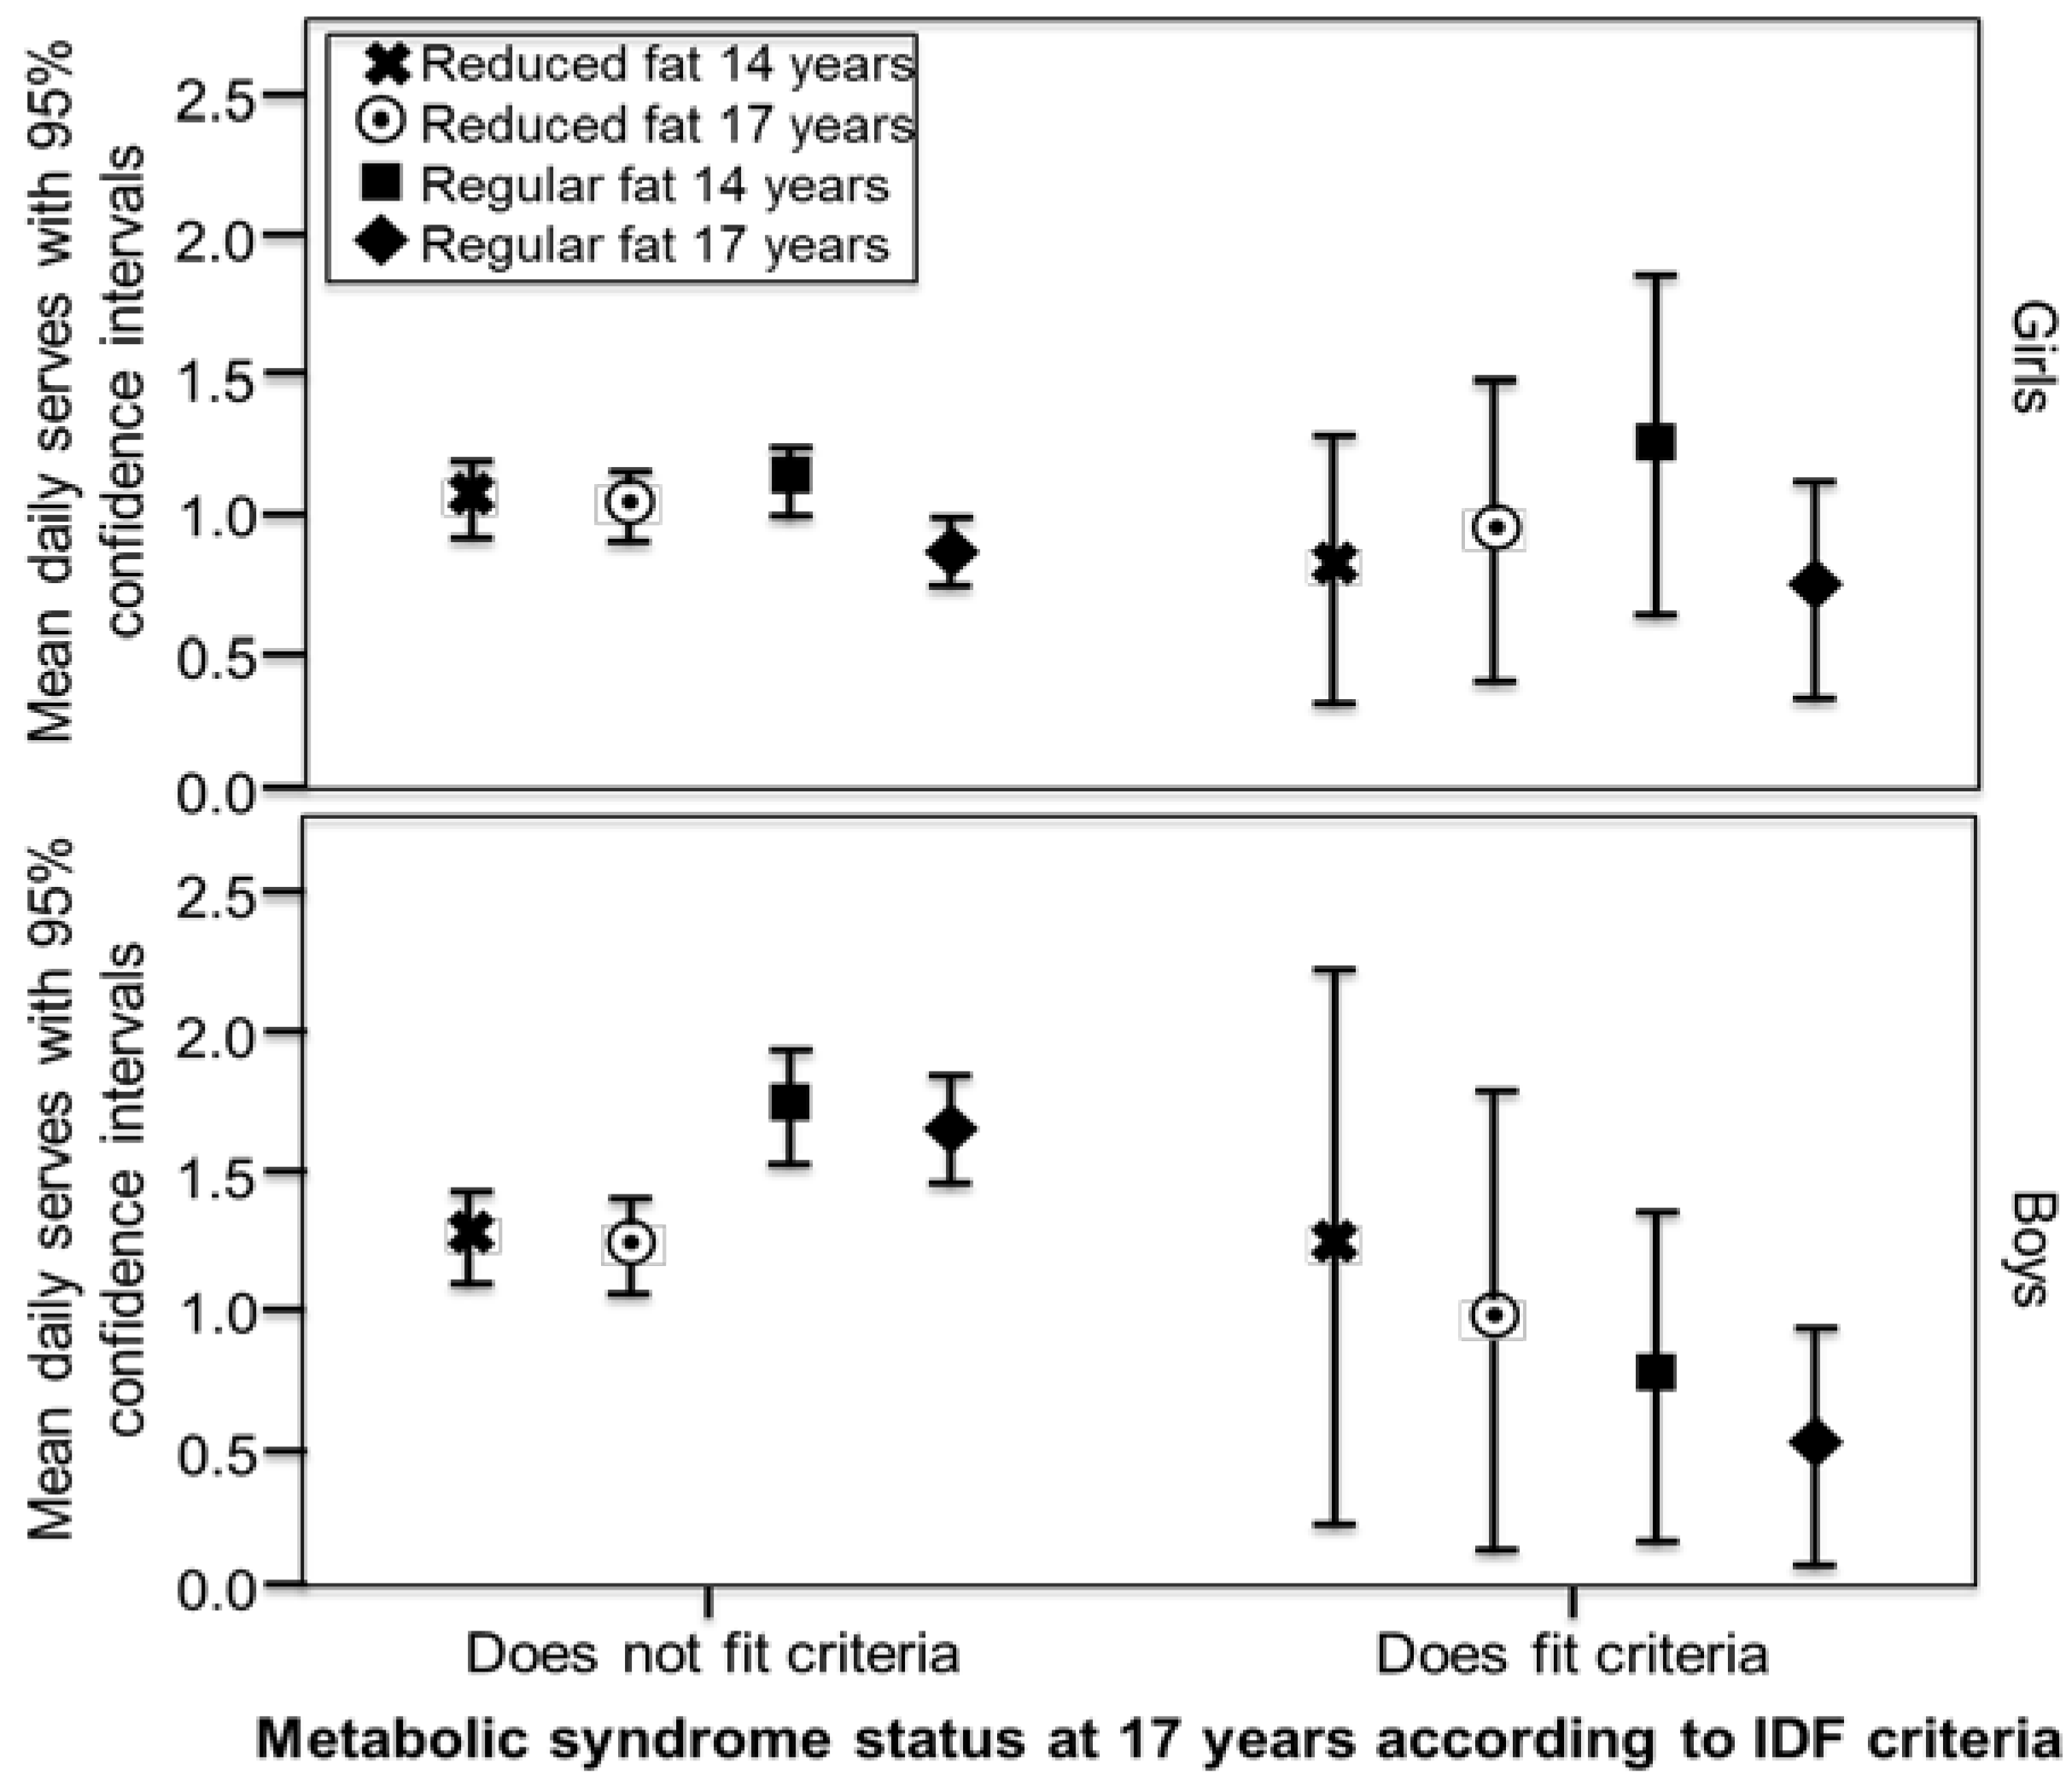
| MetS IDF e (yes) | 20 (4.3) | 15 (3.3) | >0.99 | 11 (2.8) | 9 (2.3) | >0.99 |
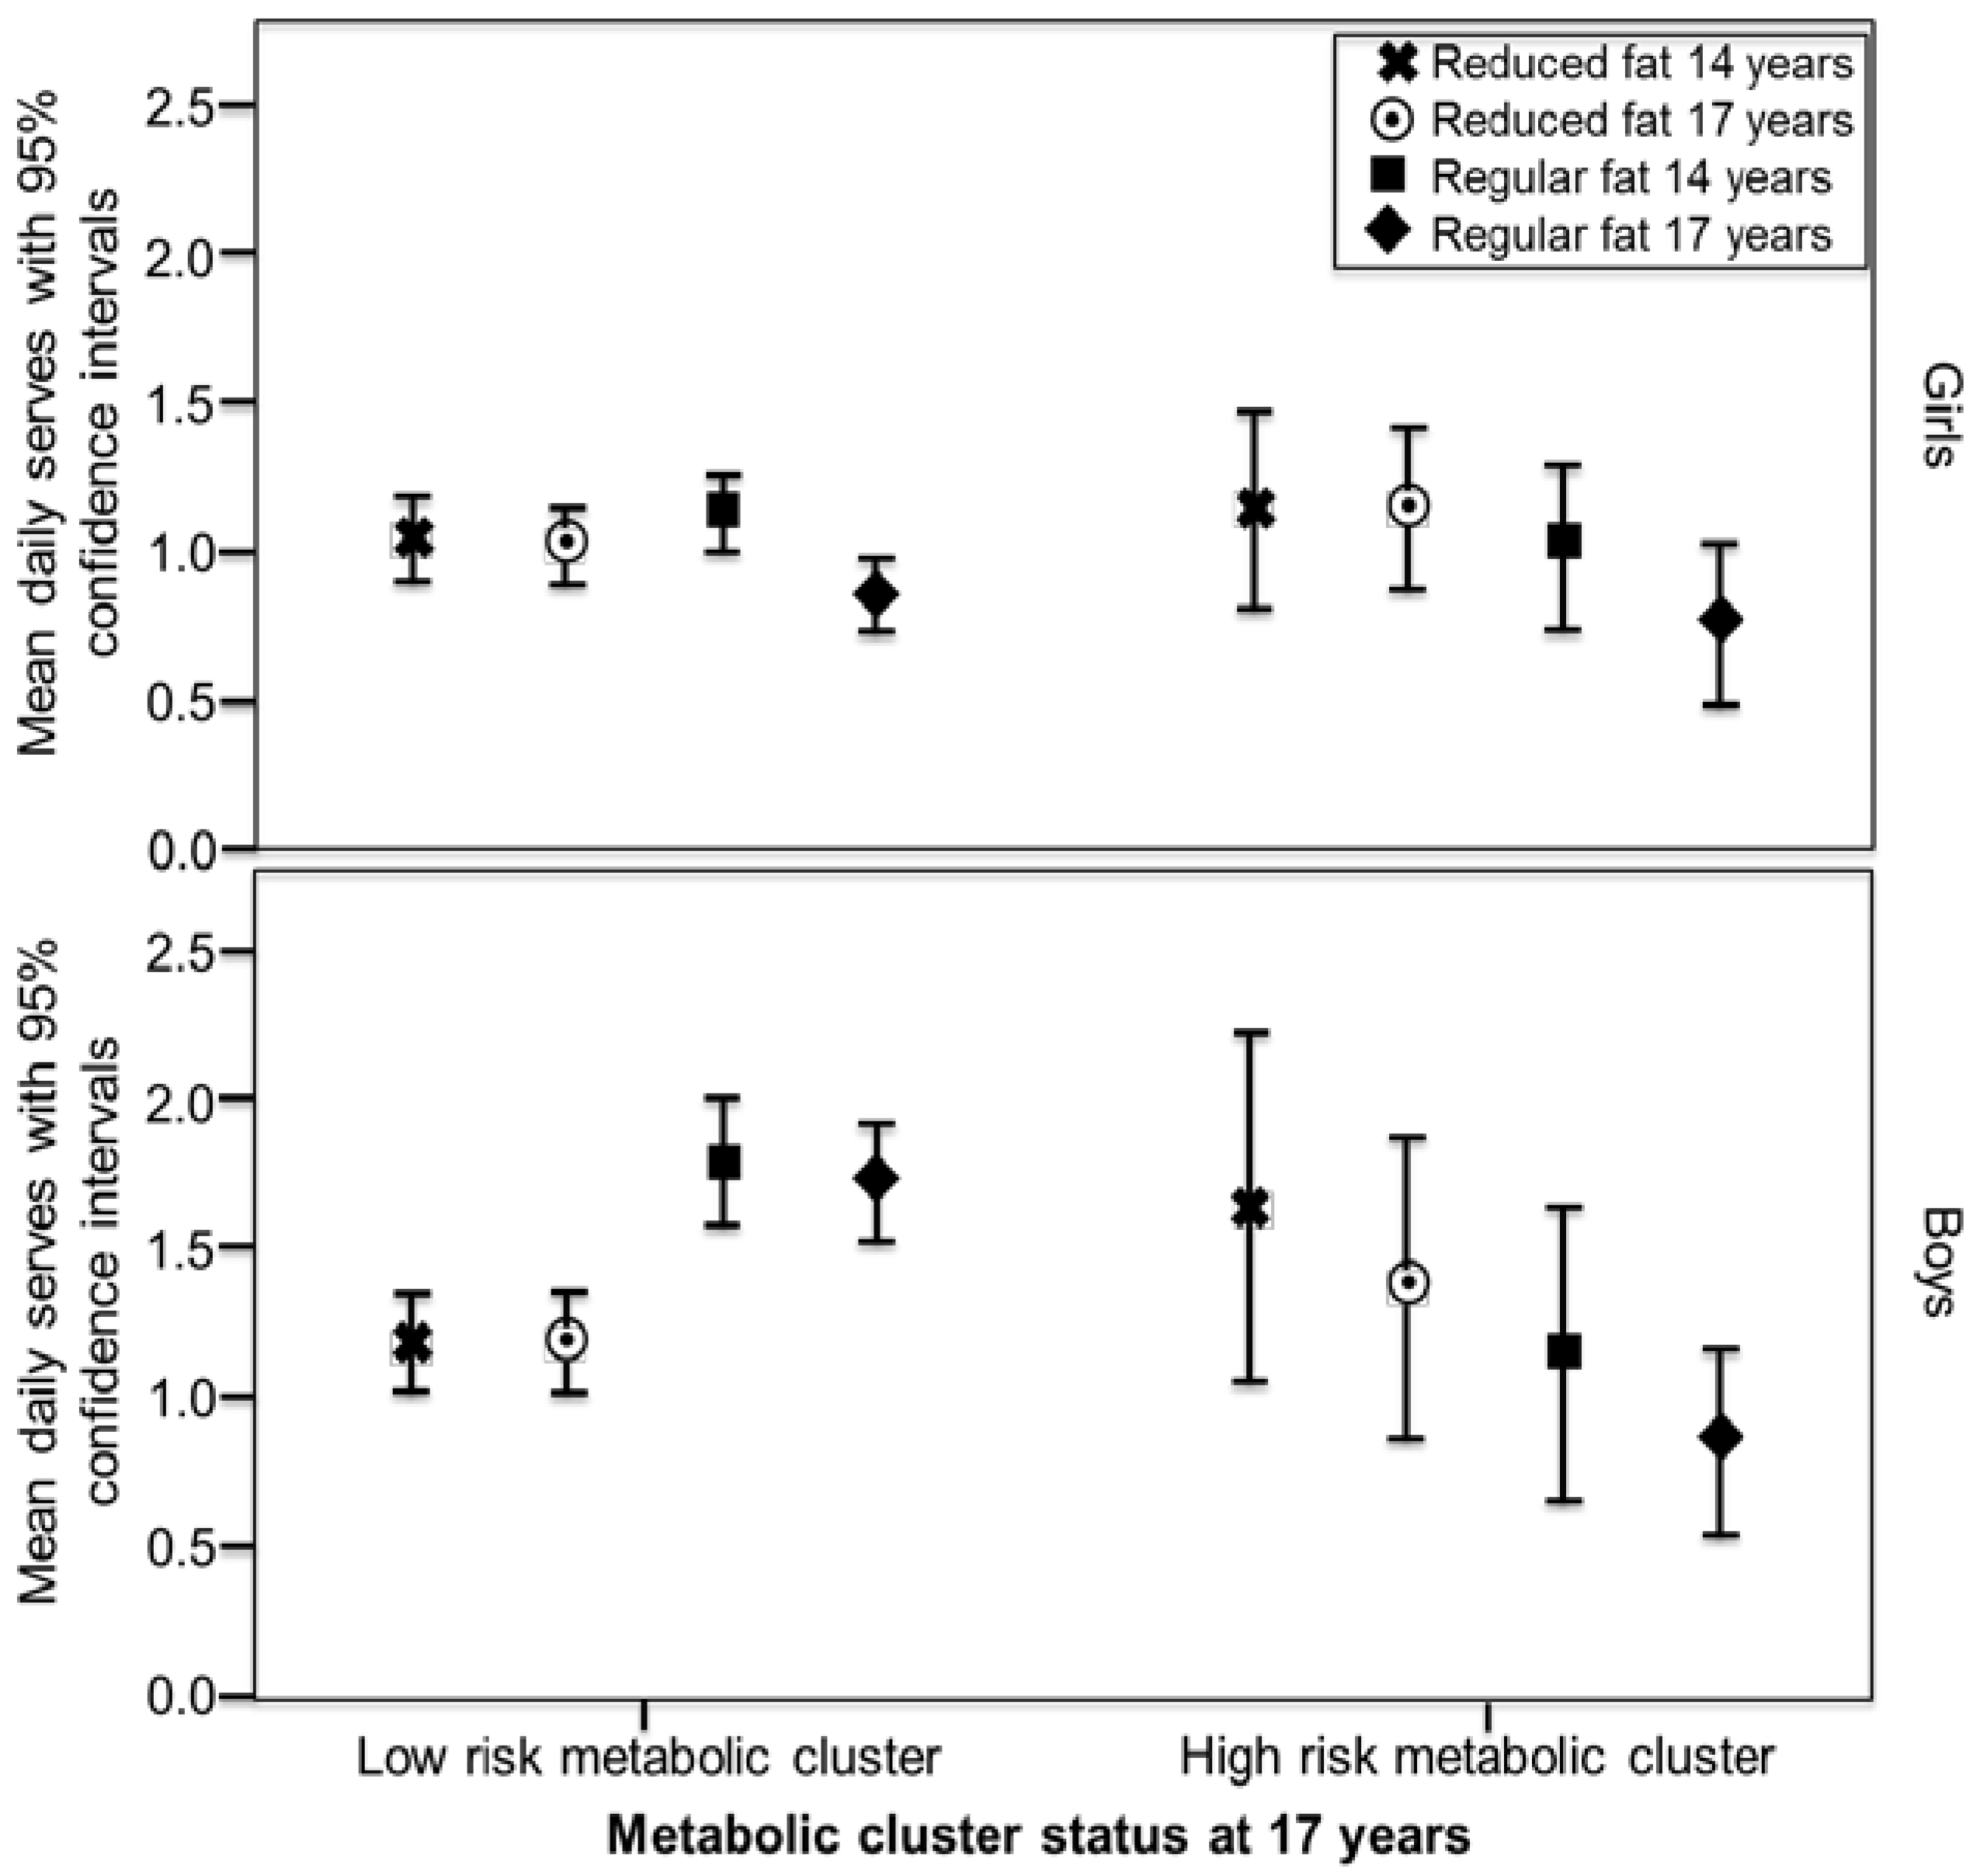
| Cohort MetS cluster f (high risk) | 103 (22.3) | 59 (12.8) | <0.001 | 64 (16.0) | 39 (9.8) | 0.004 |
2.3. Metabolic Syndrome and Cardiometabolic Risk Factor Assessments
2.4. Additional Assessments
2.5. Statistical Analysis
3. Results
| Outcomes | Girls Model 1 a | Girls Model 2 b | Boys Model 1 | Boys Model 2 |
|---|---|---|---|---|
| OR c or B d (95% CI) | OR or B (95% CI) | OR or B (95% CI) | OR or B (95% CI) | |
| IDF met | 0.72 (0.48, 1.08) | 0.74 (0.48, 1.13) | 0.88 (0.58, 1.35) | 0.98 (0.61, 1.58) |
| Cluster met | 0.98 (0.83, 1.15) | 0.87 (0.71, 1.07) | 1.13 (0.94, 1.35) | 1.09 (0.90, 1.33) |
| Waist: height | 1.00 (0.99, 1.00) | 1.00 (0.99, 1.01) | 1.00 (0.99, 1.00) | 1.00 (0.99, 1.01) |
| CRP | 1.00 (0.90, 1.12) | 1.05 (0.94, 1.18) | 0.99 (0.93, 1.07) | 1.02 (0.95, 1.10) |
| HOMA-IR | 0.97 (0.93, 1.02) | 1.03 (0.98, 1.08) | 0.97 (0.94, 1.01) | 0.99 (0.95, 1.03) |
| HDL | 1.01 (0.99, 1.03) | 1.01 (0.99, 1.03) | 0.99 (0.98, 1.001) | 0.99 (0.98, 0.998) * |
| LDL | 0.99 (0.97, 1.00) | 0.99 (0.97, 1.01) | 1.00 (0.99, 1.02) | 1.00 (0.98, 1.01) |
| Total: HDL | 0.98 (0.97, 0.999) * | 0.99 (0.97, 1.01) | 1.01 (0.99, 1.02) | 1.01 (1.00, 1.02 |
| SBP | 0.40 (−0.33, 1.14) | 0.56 (−0.25, 1.36) | −0.25 (−0.84, 0.35) | −0.45 (−1.04, 0.13) |
| DBP | −0.13 (−0.76, 0.29) | −0.12 (−0.65, 0.40) | −0.51 (−0.84, −0.19) * | −0.54 (−0.92, −0.17) * |
| Outcome | Model | Reduced Fat | Regular Fat | |
|---|---|---|---|---|
| OR c or B d (95% CI) | OR e or B f (95% CI) | |||
| Girls | IDF met | 1 a | 0.75 (0.49, 1.14) | 0.67 (0.39, 1.13) |
| 2 b | 0.79 (0.50, 1.25) | 0.66 (0.38, 1.15) | ||
| Cluster met | 1 | 0.97 (0.81, 1.15) | 1.00 (0.79, 1.26) | |
| 2 | 0.84 (0.68, 1.04) | 0.95 (0.72, 1.24) | ||
| Waist: height | 1 | 1.00 (0.99, 1.01) | 0.99 (0.986, 1.00) | |
| 2 | 1.00 (0.99, 1.01) | 1.00 (0.99, 1.01) | ||
| CRP | 1 | 1.01 (0.91, 1.13) | 0.97 (0.84, 1.12) | |
| 2 | 1.08 (0.96, 1.21) | 0.98 (0.84, 1.14) | ||
| HOMA-IR | 1 | 0.97 (0.92, 1.02) | 0.98 (0.92, 1.03) | |
| 2 | 1.02 (0.97, 1.07) | 1.04 (0.99, 1.10) | ||
| HDL | 1 | 1.01 (0.99, 1.03) | 1.02 (0.99, 1.05) | |
| 2 | 1.00 (0.98, 1.02) | 1.01 (0.99, 1.04) | ||
| LDL | 1 | 0.98 (0.96, 1.00) | 0.99 (0.97, 1.02) | |
| 2 | 0.99 (0.97, 1.01) | 0.99 (0.97, 1.02) | ||
| Total: HDL | 1 | 0.98 (0.97, 0.99) * | 0.98 (0.96, 1.00) | |
| 2 | 0.99 (0.97, 1.01) | 0.98 (0.96, 1.01) | ||
| SBP | 1 | 0.61 (−0.17, 1.38) | −0.09 (−0.99, 0.81) | |
| 2 | 0.73 (−0.13, 1.59) | 0.20 (−0.77, 1.18) | ||
| DBP | 1 | −0.14 (−0.61, 0.33) | −0.11 (−0.72, 0.51) | |
| 2 | −0.13 (−0.67, 0.41) | −0.11 (−0.79, 0.58) | ||
| Boys | IDF met | 1 | 1.01 (0.65, 1.57) | 0.62 (0.25, 1.51) |
| 2 | 1.22 (0.67, 2.21) | 0.73 (0.31, 1.67) | ||
| Cluster met | 1 | 1.03 (0.84, 1.25) | 1.24 (1.00, 1.55) | |
| 2 | 0.97 (0.77, 1.22) | 1.19 (0.93, 1.51) | ||
| Waist: height | 1 | 1.00 (0.99, 1.01) | 0.993 (0.988, 0.999) * | |
| 2 | 1.01 (1.00, 1.01) | 0.996 (0.99, 1.00) | ||
| CRP | 1 | 1.01 (0.94, 1.10) | 0.98 (0.91, 1.06) | |
| 2 | 1.04 (0.96, 1.13) | 1.01 (0.94, 1.10) | ||
| HOMA-IR | 1 | 0.97 (0.93, 1.02) | 0.97 (0.93, 1.01) | |
| 2 | 0.98 (0.93, 1.02) | 0.99 (0.95, 1.04) | ||
| HDL | 1 | 0.99 (0.98, 0.999) * | 1.00 (0.99, 1.01) | |
| 2 | 0.98 (0.97, 0.995) * | 0.99 (0.98, 1.00) | ||
| LDL | 1 | 1.00 (0.98, 1.01) | 1.00 (0.99, 1.02) | |
| 2 | 1.00 (0.98, 1.02) | 1.00 (0.98, 1.02) | ||
| Total: HDL | 1 | 1.01 (1.00, 1.02) | 1.00 (0.99, 1.01) | |
| 2 | 1.02 (1.002, 1.03) * | 1.01 (1.00, 1.02) | ||
| SBP | 1 | 0.01 (−0.71, 0.74) | −0.43 (−1.07, 1.78) | |
| 2 | −0.52 (−1.24, 0.20) | −0.41 (−1.04, 0.22) | ||
| DBP | 1 | −0.56 (−0.96, −0.17) * | −0.47 (−0.84, −0.10) * | |
| 2 | −0.66 (−1.09, −0.23) * | −0.47 (−0.90, −0.04) * |
4. Discussion
Acknowledgments
Author Contributions
Conflicts of Interest
Abbreviations
References
- National Health and Medical Research Council. Australian Dietary Guidelines: Summary; Commonwealth of Australia: Canberra, Australia, 2013.
- Health Canada. Canada’s Food Guide; Minister of Health Canada: Ottawa, ON, Canada, 2011. [Google Scholar]
- U.S. Department of Agriculture; U.S. Department of Health and Human Services. Dietary Guidelines for Americans; U.S. Government Printing Office: Washington, DC, USA, 2010.
- Ludwig, D.S.; Willett, W. Three daily servings of reduced-fat milk: An evidence-based recommendation? JAMA Pediatr. 2013, 167, 788–789. [Google Scholar] [CrossRef] [PubMed]
- Louie, J.C.Y.; Flood, V.M.; Hector, D.J.; Rangan, A.M.; Gill, T.P. Dairy consumption and overweight and obesity: A systematic review of prospective cohort studies. Obes. Rev. 2011, 12. [Google Scholar] [CrossRef] [PubMed]
- Holmberg, S.; Thelin, A. High dairy fat intake related to less central obesity: A male cohort study with 12 years’ follow-up. Scand J Prim Hlth Care 2013, 31, 89–94. [Google Scholar] [CrossRef] [PubMed]
- Eriksson, S.; Strandvik, B. Food choice is reflected in serum markers and anthropometric measures in healthy 8-year-olds. Eur. e-J. Clin. Nutr. Metab. 2010, 5, e117–e124. [Google Scholar] [CrossRef]
- Noel, S.E.; Ness, A.R.; Northstone, K.; Emmett, P.; Newby, P.K. Milk intakes are not associated with percent body fat in children from ages 10 to 13 years. J. Nutr. 2011, 141, 2035–2041. [Google Scholar] [CrossRef] [PubMed]
- O’Sullivan, T.A.; Hafekost, K.; Mitrou, F.; Lawrence, D. Food sources of saturated fat and the association with mortality: A meta-analysis. Am. J. Public Health 2013, 103, e31–e42. [Google Scholar] [CrossRef] [PubMed]
- Soedamah-Muthu, S.S.; Ding, E.L.; Al-Delaimy, W.K.; Hu, F.B.; Engberink, M.F.; Willett, W.C.; Geleijnse, J.M. Milk and dairy consumption and incidence of cardiovascular diseases and all-cause mortality: Dose-response meta-analysis of prospective cohort studies. Am. J. Clin. Nutr. 2011, 93, 158–171. [Google Scholar] [CrossRef] [PubMed]
- Goldbohm, R.A.; Chorus, A.M.J.; Garre, F.G.; Schouten, L.J.; van den Brandt, P.A. Dairy consumption and 10-y total and cardiovascular mortality: A prospective cohort study in the Netherlands. Am. J. Clin. Nutr. 2011, 93, 615–627. [Google Scholar] [CrossRef] [PubMed]
- Azadbakht, L.; Mirmiran, P.; Esmaillzadeh, A.; Azizi, F. Dairy consumption is inversely associated with the prevalence of the metabolic syndrome in Tehranian adults. Am. J. Clin. Nutr. 2005, 82, 523–530. [Google Scholar] [PubMed]
- Kratz, M.; Baars, T.; Guyenet, S. The relationship between high-fat dairy consumption and obesity, cardiovascular, and metabolic disease. Eur. J. Nutr. 2013, 52, 1–24. [Google Scholar] [CrossRef] [PubMed]
- Huang, T.T.K.; McCrory, M.A. Dairy intake, obesity, and metabolic health in children and adolescents: Knowledge and gaps. Nutr. Rev. 2005, 63, 71–80. [Google Scholar] [CrossRef] [PubMed]
- Parker, C.; Vivian, W.; Oddy, W.; Beilin, L.; Mori, T.; O’Sullivan, T.A. Changes in dairy food and nutrient intakes in Australian adolescents. Nutrients 2012, 4, 1794–1811. [Google Scholar] [CrossRef] [PubMed]
- Baird, D.L.; Syrette, J.; Hendrie, G.A.; Riley, M.D.; Bowen, J.; Noakes, M. Dairy food intake of Australian children and adolescents 2–16 years of age: 2007 Australian National Children’s Nutrition and Physical Activity Survey. Public Health Nutr. 2012, 15, 2060–2073. [Google Scholar] [CrossRef] [PubMed]
- Newnham, J.P.; Evans, S.F.; Michael, C.A.; Stanley, F.J.; Landau, L.I. Effects of frequent ultrasound during pregnancy: A randomised controlled trial. Lancet 1993, 342, 887–891. [Google Scholar] [CrossRef]
- Baghurst, K.I.; Record, S.J. A computerised dietary analysis system for use with diet diaries or food frequency questionnaires. Community Health Stud. 1984, 8, 11–18. [Google Scholar] [CrossRef] [PubMed]
- Ambrosini, G.L.; Oddy, W.H.; Robinson, M.; O’Sullivan, T.A.; Hands, B.P.; de Klerk, N.H.; Silburn, S.R.; Zubrick, S.R.; Kendall, G.E.; Stanley, F.J.; et al. Adolescent dietary patterns are associated with lifestyle and family psycho-social factors. Public Health Nutr. 2009, 12, 1807–1815. [Google Scholar] [CrossRef] [PubMed]
- Food Standards Australia New Zealand. Nutrient Tables for Use in Australia. Available online: http://www.foodstandards.gov.au/monitoringandsurveillance/nuttab2006/onlineversionintroduction/onlineversion.cfm (accessed on 22 December 2015).
- Ambrosini, G.L.; de Klerk, N.H.; O’Sullivan, T.A.; Beilin, L.J.; Oddy, W.H. The reliability of a food frequency questionnaire for use among adolescents. Eur. J. Clin. Nutr. 2009, 63, 1251–1259. [Google Scholar] [CrossRef] [PubMed]
- National Health and Medical Research Council. Australian Dietary Guidelines; National Health and Medical Research Council: Canberra, Australia, 2013.
- The Trustees of the Home Economics Teachers Group; Baldwin, E.M.; Barrowman, E.M.; Cameron, S.; McDonnell, E.D.; Russel, S.M.; Williams, W.I. Cookery—The Australian Way; McMillan of Australia: South Melbourne, Australia, 1967. [Google Scholar]
- Taste Australia. Available online: http://www.taste.com.au (accessed on 22 December 2015).
- Bonora, E.; Targher, G.; Alberiche, M.; Bonadonna, R.; Saggiani, F.; Zenere, M.; Monauni, T.; Muggeo, M. Homeostasis model assessment closely mirrors the glucose clamp technique in the assessment of insulin sensitivity: Studies in subjects with various degrees of glucose tolerance and insulin sensitivity. Diabetes Care 2000, 23, 57–63. [Google Scholar] [CrossRef] [PubMed]
- Matthews, D.; Hosker, J.; Rudenski, A.; Naylor, B.; Treacher, D.; Turner, R.C. Homeostasis model assessment: Insulin resistance and beta cell function from fasting plasma glucose and insulin concentrations in man. Diabetologia 1985, 28, 412–419. [Google Scholar] [CrossRef] [PubMed]
- Jolliffe, C.J.; Janssen, I. Development of age-specific adolescent metabolic syndrome criteria that are linked to the Adult Treatment Panel III and International Diabetes Federation criteria. J. Am. Coll. Cardiol. 2007, 49, 891–898. [Google Scholar] [CrossRef] [PubMed]
- Huang, R.-C.; Mori, T.A.; Burke, V.; Newnham, J.; Stanley, F.J.; Landau, L.I.; Kendall, G.E.; Oddy, W.H.; Beilin, L.J. Synergy between adiposity, insulin resistance, metabolic risk factors, and inflammation in adolescents. Diabetes Care 2009, 32, 695–701. [Google Scholar]
- Ambrosini, G.L.; Oddy, W.H.; Huang, R.C.; Mori, T.A.; Beilin, L.J.; Jebb, S.A. Prospective associations between sugar-sweetened beverage intakes and cardiometabolic risk factors in adolescents. Am. J. Clin. Nutr. 2013, 98, 327–334. [Google Scholar] [CrossRef] [PubMed]
- Appannah, G.; Pot, G.K.; Huang, R.C.; Oddy, W.H.; Beilin, L.J.; Mori, T.A.; Jebb, S.A.; Ambrosini, G.L. Identification of a dietary pattern associated with greater cardiometabolic risk in adolescence. Nutr. Metab. Cardiovasc. Dis. 2015, 25, 643–650. [Google Scholar] [CrossRef] [PubMed]
- Steinberger, J.; Daniels, S.R.; Eckel, R.H.; Hayman, L.; Lustig, R.H.; McCrindle, B.; Mietus-Snyder, M.L. American Heart Association Atherosclerosis, Hypertension, and Obesity in the Young Committee of the Council on Cardiovascular Disease in the Young; Council on Cardiovascular Nursing; and Council on Nutrition, Physical Activity, and Metabolism. Progress and Challenges in Metabolic Syndrome in Children and Adolescents: A Scientific Statement From the American Heart Association. Circulation 2009, 119, 628–647. [Google Scholar] [PubMed]
- Huang, R.-C.; Mori, T.A.; Burrows, S.; Le Ha, C.; Oddy, W.H.; Herbison, C.; Hands, B.H.; Beilin, L.J. Sex dimorphism in the relation between early adiposity and cardiometabolic risk in adolescents. J. Clin. Endocrinol. Metab. 2012, 97, E1014–E1022. [Google Scholar] [CrossRef] [PubMed]
- Savva, S.C.; Tornaritis, M.; Savva, M.E.; Kourides, Y.; Panagi, A.; Silikiotou, N.; Georgiou, C.; Kafatos, A. Waist circumference and waist-to-height ratio are better predictors of cardiovascular disease risk factors in children than body mass index. Int. J. Obes. Relat. Metab. Disord. 2000, 24, 1453–1458. [Google Scholar] [CrossRef] [PubMed]
- Boreham, C.A.; Paliczka, V.J.; Nichols, A.K. A comparison of the PWC170 and 20-MST tests of aerobic fitness in adolescent schoolchildren. J. Sports Med. Phys. Fit. 1990, 30, 19–23. [Google Scholar]
- Rockett, H.R.H.; Breitenbach, M.; Frazier, A.L.; Witschi, J.; Wolf, A.M.; Field, A.E.; Colditz, G.A. Validation of a youth/adolescent food frequency questionnaire. Prev. Med. 1997, 26, 808–816. [Google Scholar] [CrossRef] [PubMed]
- Hanley, J.A.; Negassa, A.; Edwardes, M.D.; Forrester, J.E. Statistical analysis of correlated data using generalized estimating equations: An orientation. Am. J. Epidemiol. 2003, 157, 364–375. [Google Scholar] [CrossRef] [PubMed]
- IBM Corp. IBM SPSS Statistics for Windows; IBM Corp: Armonk, NY, USA, 2012. [Google Scholar]
- O’Sullivan, T.A.; Ambrosini, G.L.; Beilin, L.J.; Mori, T.A.; Oddy, W.H. Dietary intake and food sources of fatty acids in Australian adolescents. Nutrition 2011, 27, 153–159. [Google Scholar] [CrossRef] [PubMed]
- O’Sullivan, T.A.; Lyons-Wall, P.; Bremner, A.P.; Ambrosini, G.L.; Huang, R.C.; Beilin, L.J.; Mori, T.A.; Blair, E.; Oddy, W.H. Dietary glycaemic carbohydrate in relation to the metabolic syndrome in adolescents: Comparison of different metabolic syndrome definitions. Diabet. Med. 2010, 27, 770–778. [Google Scholar] [CrossRef] [PubMed]
- Yuan, W.L.; Kakinami, L.; Gray-Donald, K.; Czernichow, S.; Lambert, M.; Paradis, G. Influence of dairy product consumption on children’s blood pressure: Results from the quality cohort. J. Acad. Nutr. Diet 2013, 113, 936–941. [Google Scholar] [CrossRef] [PubMed]
- Moore, L.L.; Singer, M.R.; Bradlee, M.L.; Djousse, L.; Proctor, M.H.; Cupples, L.A.; Ellison, R.C. Intake of fruits, vegetables, and dairy products in early childhood and subsequent blood pressure change. Epidemiology 2005, 16, 4–11. [Google Scholar] [CrossRef] [PubMed]
- Rangan, A.M.; Flood, V.L.; Denyer, G.; Ayer, J.G.; Webb, K.L.; Marks, G.B.; Celermajer, D.S.; Gill, T.P. The effect of dairy consumption on blood pressure in mid-childhood: CAPS cohort study. Eur. J. Clin. Nutr. 2012, 66, 652–657. [Google Scholar] [CrossRef] [PubMed]
- Gopinath, B.; Flood, V.M.; Burlutsky, G.; Louie, J.C.Y.; Baur, L.A.; Mitchell, P. Dairy food consumption, blood pressure and retinal microcirculation in adolescents. Nutr. Metab. Cardiovasc. Dis. 2014, 24, 1221–1227. [Google Scholar] [CrossRef] [PubMed]
- McGrane, M.M.; Essery, E.; Obbagy, J.; Lyon, J.; MacNeil, P.; Spahn, J.; van Horn, L. Dairy consumption, blood pressure, and risk of hypertension: An evidence-based review of recent literature. Curr. Cardiovasc. Risk Rep. 2011, 5, 287–298. [Google Scholar] [CrossRef] [PubMed]
- Park, K.M.; Cifelli, C.J. Dairy and blood pressure: A fresh look at the evidence. Nutr. Rev. 2013, 71, 149–157. [Google Scholar] [CrossRef] [PubMed]
- Te Velde, S.J.; Snijder, M.B.; van Dijk, A.E.; Brug, J.; Koppes, L.L.; van Mechelen, W.; Twisk, J.W. Dairy intake from adolescence into adulthood is not associated with being overweight and metabolic syndrome in adulthood: The Amsterdam Growth and Health Longitudinal Study. J. Hum. Nutr. Diet 2011, 24, 233–244. [Google Scholar] [CrossRef] [PubMed]
- Malik, V.S.; Sun, Q.; van Dam, R.M.; Rimm, E.B.; Willett, W.C.; Rosner, B.; Hu, F.B. Adolescent dairy product consumption and risk of type 2 diabetes in middle-aged women. Am. J. Clin. Nutr. 2011, 94, 854–861. [Google Scholar] [CrossRef] [PubMed]
- Ghotboddin Mohammadi, S.; Mirmiran, P.; Bahadoran, Z.; Mehrabi, Y.; Azizi, F. The Association of Dairy Intake With Metabolic Syndrome and Its Components in Adolescents: Tehran Lipid and Glucose Study. Int. J. Endocrinol. Metab. 2015, 13, e25201. [Google Scholar] [CrossRef] [PubMed]
- Chen, M.; Sun, Q.; Giovannucci, E.; Mozaffarian, D.; Manson, J.; Willett, W.C.; Hu, F.B. Dairy consumption and risk of type 2 diabetes: 3 cohorts of US adults and an updated meta-analysis. BMC Med. 2014, 12, 215. [Google Scholar] [CrossRef] [PubMed]
- Aune, D.; Norat, T.; Romundstad, P.; Vatten, L.J. Dairy products and the risk of type 2 diabetes: A systematic review and dose-response meta-analysis of cohort studies. Am. J. Clin. Nutr. 2013, 98, 1066–1083. [Google Scholar] [CrossRef] [PubMed]
- Soedamah-Muthu, S.S.; Verberne, L.D.M.; Ding, E.L.; Engberink, M.F.; Geleijnse, J.M. Dairy Consumption and Incidence of Hypertension: A Dose-Response Meta-Analysis of Prospective Cohort Studies. Hypertension 2012, 60, 1131–1137. [Google Scholar] [CrossRef] [PubMed]
- Ralston, R.A.; Lee, J.H.; Truby, H.; Palermo, C.E.; Walker, K.Z. A systematic review and meta-analysis of elevated blood pressure and consumption of dairy foods. J. Hum. Hypertens. 2012, 26, 3–13. [Google Scholar] [CrossRef] [PubMed]
- Qin, L.-Q.; Xu, J.-Y.; Han, S.-F.; Zhang, Z.-L.; Zhao, Y.-Y.; Szeto, I.M. Dairy consumption and risk of cardiovascular disease: An updated meta-analysis of prospective cohort studies. Asia Pac. J. Clin. Nutr. 2015, 24, 90–100. [Google Scholar] [PubMed]
- Benatar, J.R.; Sidhu, K.; Stewart, R.A. Effects of high and low fat dairy food on cardio-metabolic risk factors: A meta-analysis of randomized studies. PLoS ONE 2013, 8, e76480. [Google Scholar] [CrossRef] [PubMed]
- Boden, W.E. High-density lipoprotein cholesterol as an independent risk factor in cardiovascular disease: Assessing the data from Framingham to the Veterans Affairs High--Density Lipoprotein Intervention Trial. Am. J. Cardiol. 2000, 86, 19L–22L. [Google Scholar] [CrossRef]
- Micha, R.; Mozaffarian, D. Saturated fat and cardiometabolic risk factors, coronary heart disease, stroke, and diabetes: A fresh look at the evidence. Lipids 2010, 45, 893–905. [Google Scholar] [CrossRef] [PubMed]
- Huth, P.J.; Park, K.M. Influence of dairy product and milk fat consumption on cardiovascular disease risk: A review of the evidence. Adv. Nutr. Int. Rev. J. 2012, 3, 266–285. [Google Scholar] [CrossRef] [PubMed]
- Scharf, R.J.; Demmer, R.T.; DeBoer, M.D. Longitudinal evaluation of milk type consumed and weight status in preschoolers. Arch. Dis. Child. 2013, 98, 335–340. [Google Scholar] [CrossRef] [PubMed]
- Hendrie, G.A.; Golley, R.K. Changing from regular-fat to low-fat dairy foods reduces saturated fat intake but not energy intake in 4–13-year-old children. Am. J. Clin. Nutr. 2011, 93, 1117–1127. [Google Scholar] [CrossRef] [PubMed]
- Jakobsen, M.U.; O’Reilly, E.J.; Heitmann, B.L.; Pereira, M.A.; Bälter, K.; Fraser, G.E.; Goldbourt, U.; Hallmans, G.; Knekt, P.; Liu, S.; et al. Major types of dietary fat and risk of coronary heart disease: A pooled analysis of 11 cohort studies. Am. J. Clin. Nutr. 2009, 89, 1425–1432. [Google Scholar] [CrossRef] [PubMed]
- Golley, R.K.; Hendrie, G.A. The impact of replacing regular- with reduced-fat dairy foods on children’s wider food intake: Secondary analysis of a cluster RCT. Eur. J. Clin. Nutr. 2012, 66, 1130–1134. [Google Scholar] [CrossRef] [PubMed]
- Chowdhury, R.; Warnakula, S.; Kunutsor, S.; Crowe, F.; Ward, H.A.; Johnson, L.; Franco, O.H.; Butterworth, A.S.; Forouhi, N.G.; Thompson, S.G.; et al. Association of dietary, circulating, and supplement fatty acids with coronary risk: A systematic review and meta-analysis. Ann. Int. Med. 2014, 160, 398–406. [Google Scholar] [CrossRef] [PubMed]
- Rothman, K.J. No adjustments are needed for multiple comparisons. Epidemiology 1990, 1, 43–46. [Google Scholar] [CrossRef]
- Saville, D.J. Multiple comparison procedures: the practical solution. Am Stat 1990, 44, 174–180. [Google Scholar]
- Netea, R.; Smits, P.; Lenders, J.; Thien, T. Does it matter whether blood pressure measurements are taken with subjects sitting or supine? J. Hypertens. 1998, 16, 263–268. [Google Scholar] [CrossRef] [PubMed]
- Weaver, C.M. How sound is the science behind the dietary recommendations for dairy? Am. J. Clin. Nutr. 2014, 99 (Suppl. S5), 1217S–1222S. [Google Scholar] [CrossRef] [PubMed]
© 2016 by the authors; licensee MDPI, Basel, Switzerland. This article is an open access article distributed under the terms and conditions of the Creative Commons by Attribution (CC-BY) license (http://creativecommons.org/licenses/by/4.0/).
Share and Cite
O’Sullivan, T.A.; Bremner, A.P.; Mori, T.A.; Beilin, L.J.; Wilson, C.; Hafekost, K.; Ambrosini, G.L.; Huang, R.C.; Oddy, W.H. Regular Fat and Reduced Fat Dairy Products Show Similar Associations with Markers of Adolescent Cardiometabolic Health. Nutrients 2016, 8, 22. https://doi.org/10.3390/nu8010022
O’Sullivan TA, Bremner AP, Mori TA, Beilin LJ, Wilson C, Hafekost K, Ambrosini GL, Huang RC, Oddy WH. Regular Fat and Reduced Fat Dairy Products Show Similar Associations with Markers of Adolescent Cardiometabolic Health. Nutrients. 2016; 8(1):22. https://doi.org/10.3390/nu8010022
Chicago/Turabian StyleO’Sullivan, Therese A., Alexandra P. Bremner, Trevor A. Mori, Lawrence J. Beilin, Charlotte Wilson, Katherine Hafekost, Gina L. Ambrosini, Rae Chi Huang, and Wendy H. Oddy. 2016. "Regular Fat and Reduced Fat Dairy Products Show Similar Associations with Markers of Adolescent Cardiometabolic Health" Nutrients 8, no. 1: 22. https://doi.org/10.3390/nu8010022
APA StyleO’Sullivan, T. A., Bremner, A. P., Mori, T. A., Beilin, L. J., Wilson, C., Hafekost, K., Ambrosini, G. L., Huang, R. C., & Oddy, W. H. (2016). Regular Fat and Reduced Fat Dairy Products Show Similar Associations with Markers of Adolescent Cardiometabolic Health. Nutrients, 8(1), 22. https://doi.org/10.3390/nu8010022