3.1. Concentration Dependence of the Lipase Inhibition
In the first experiments, the hypothesis of an inhibitory action of the
pinhão coat extract on pancreatic lipase was investigated by measuring the enzyme activity at a fixed substrate concentration (530 μM
p-nitrophenylpalmitate) and varying concentrations of the extract (up to 500 μg/mL). Parallel experiments were run with the
A. mearnsii tannin (up to 500 μg/mL), as there is previous evidence that an
A. mearnsii polyphenol preparation inhibits pancreatic lipase activity [
7]. In
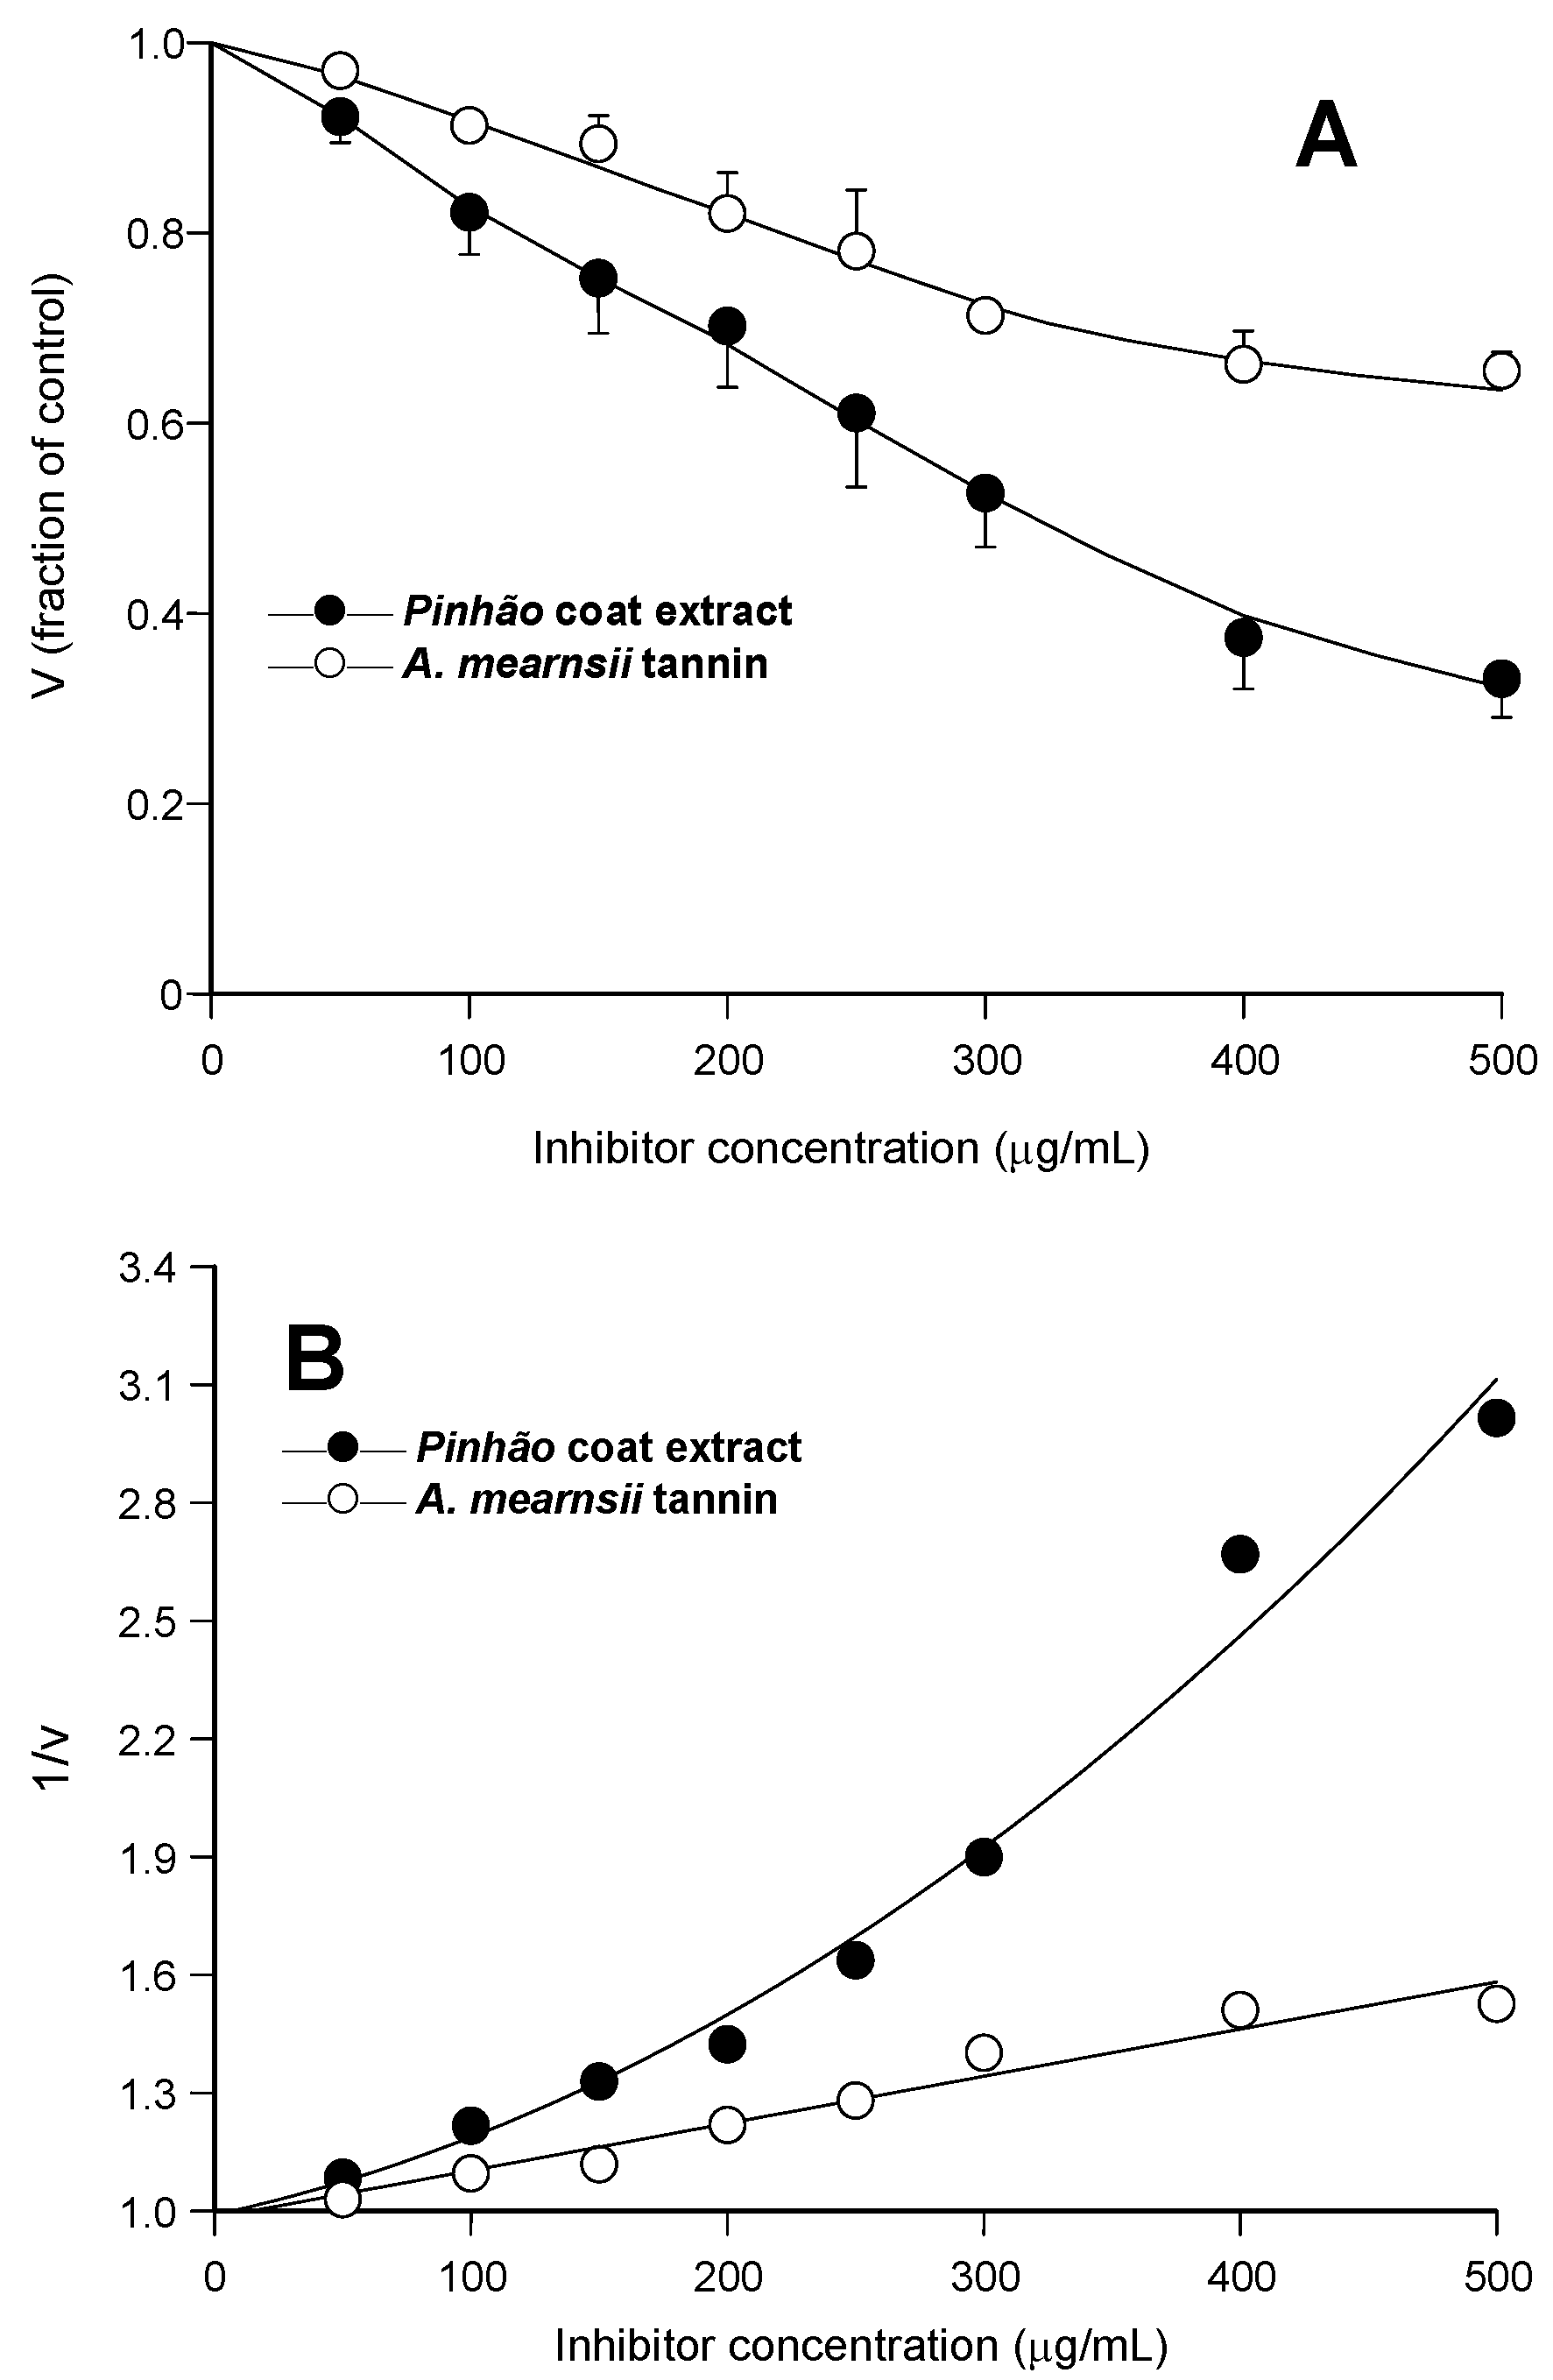
Figure 1A, the relative rates were represented against the inhibitor concentration. It is apparent that the
pinhão coat extract inhibited the enzyme with a clear concentration dependence, reaching 68% inhibition at the concentration of 500 μg/mL. The inhibition by the
A. mearnsii tannin was reproduced in our experiments, with 35% inhibition at the concentration of 500 μg/mL. This is very close to the inhibition degree reported previously [
7], but clearly less pronounced than that observed with the
pinhão coat extract. Another difference between the actions of the
pinhão coat extract and the
A. mearnsii tannin is revealed by
Figure 1B, in which the reciprocals of the reaction rates were represented against the respective concentrations. Whereas the inhibition caused by the
A. mearnsii tannin was of the linear type, that caused by the
pinhão coat extract was clearly parabolic. This has mechanistic implications and must be taken into account when further analyzing the inhibition caused by the
pinhão coat extract in kinetic terms [
13,
14].
Figure 1.
Inhibition of pancreatic lipase by pinhão coat extract and A. mearnsii tannin: concentration dependences. Initial reaction rates were measured as described in the Experimental Section. Each datum point represents the mean of three independent determinations: (A) relative reaction rates (v); (B) inverse reaction rates (1/v). The continuous lines in (B) represent the regression curves that were calculated after parabolic (A) and linear (B) regression analysis. The optimized equation for the pinhão coat extract was: y = 0.989 + 0.00141·x + 0.00000567·x2 (r = 0.992); for the A. mearnsii tannin: y = 0.982 + 0.00119·x (r = 0.981).
3.2. Kinetics of Pancreatic Lipase Inhibition
In order to characterize further the inhibition of pancreatic lipase by the
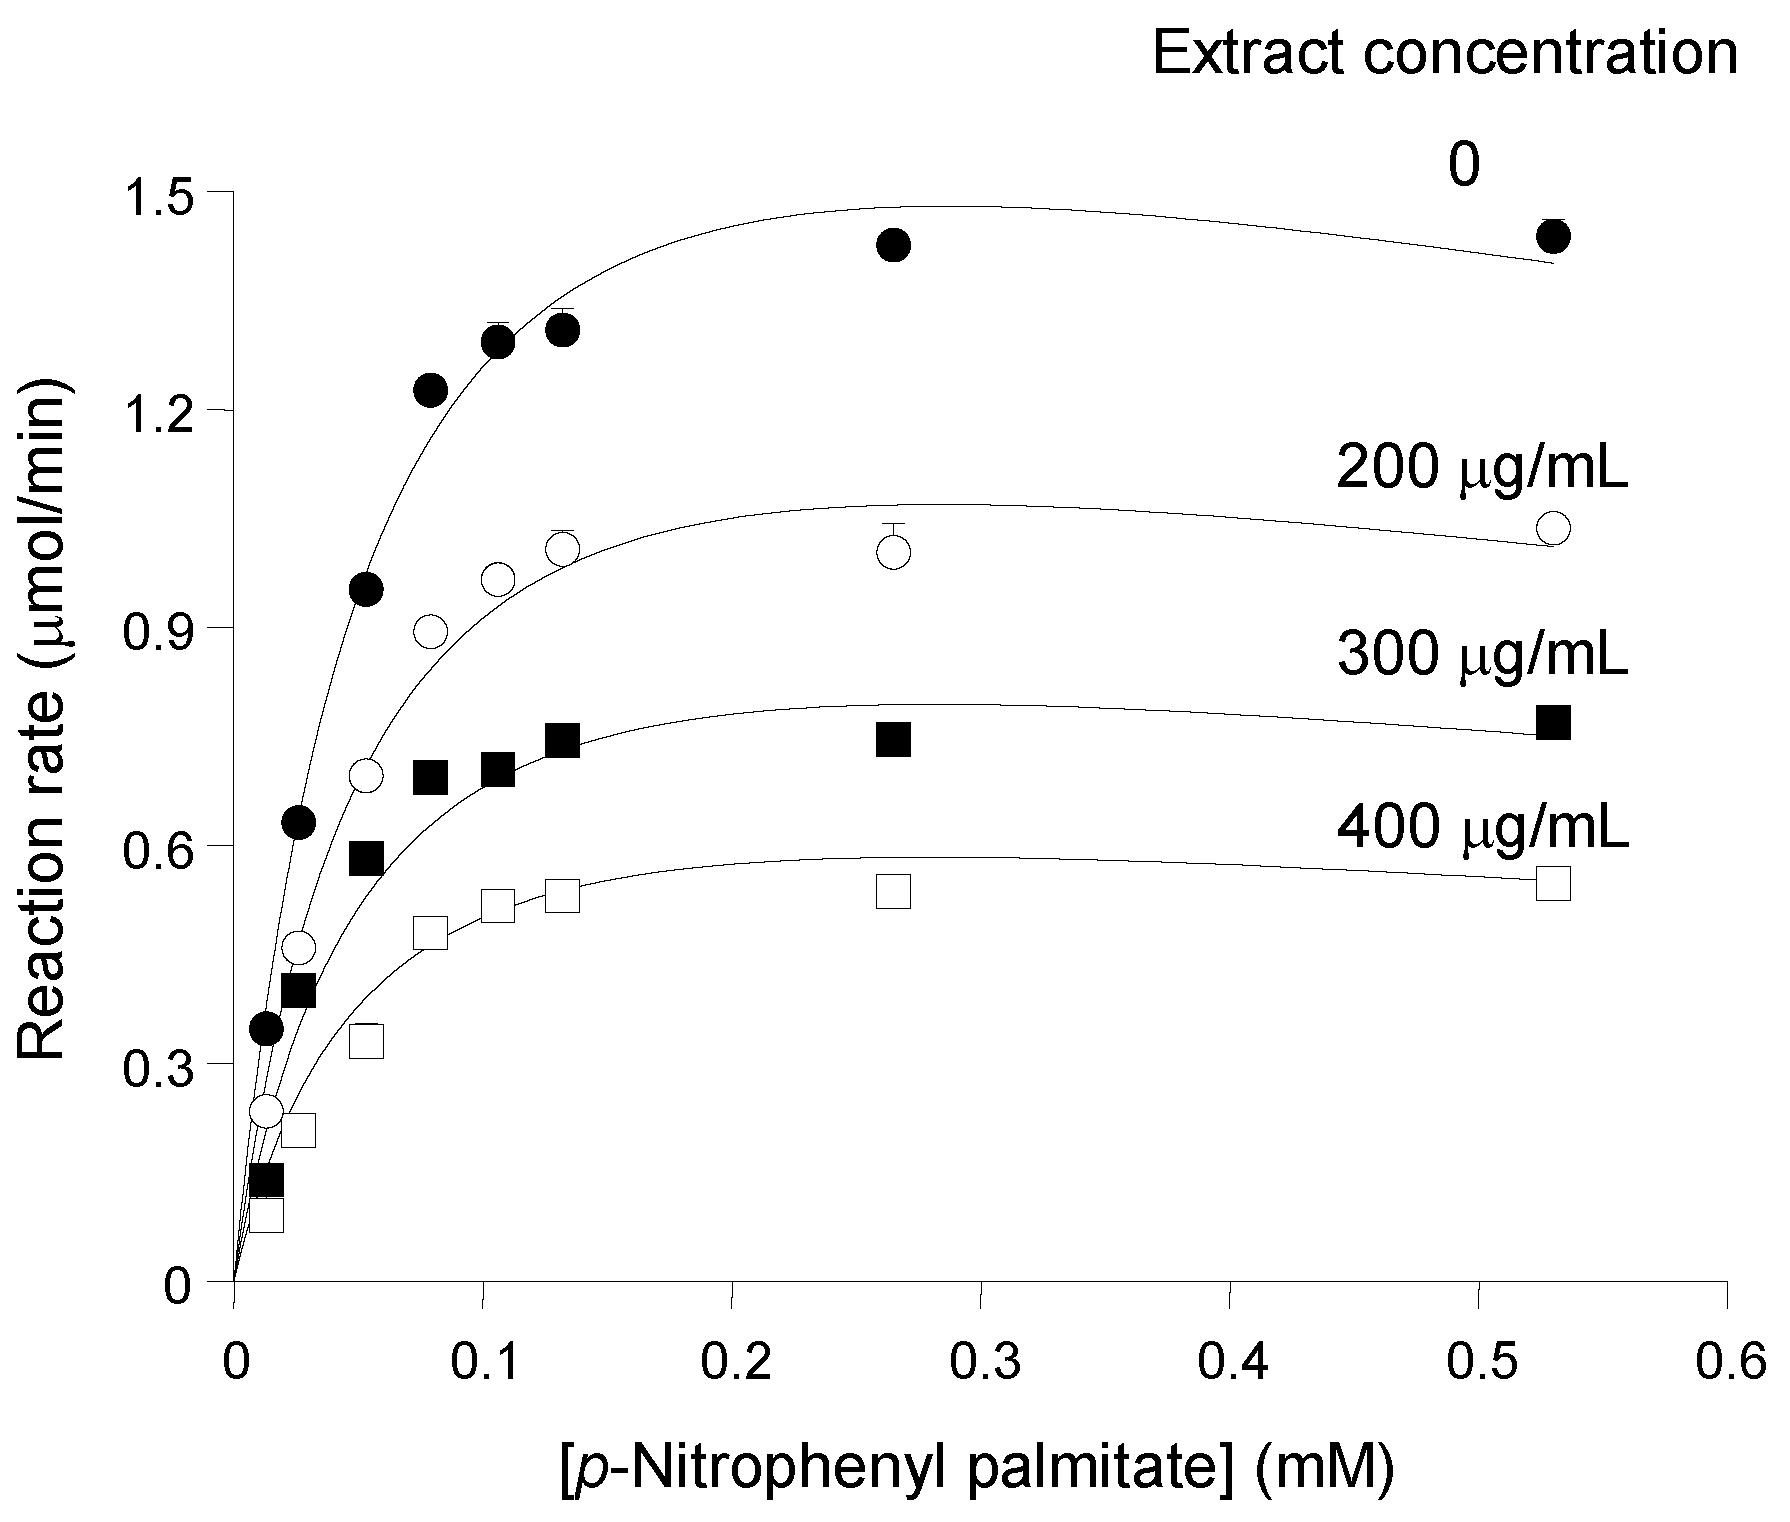
pinhão coat extract, the activity of the enzyme was measured at different substrate and inhibitor concentrations. The results are summarized in
Figure 2, which shows saturation curves that were progressively lowered as the
pinhão coat extract was added at progressively increased concentrations. The saturation curves do not show any tendency of convergence at high substrate concentrations, which excludes the possibility of competitive inhibition. On the other hand, the saturation curve of pancreatic lipase in the absence of the inhibitor does not obey the simple Michaelis—Menten equation. This is revealed by the fact that the reaction rate ceased to increase when the substrate concentration was increased from 130 μM to 530 μM (
Figure 1), revealing an apparent premature saturation. This particularity results in non-linear Lineweaver—Burk plots (not shown) with a concave up curve near the 1/v axis [
13,
14]. The latter phenomenon has been generally interpreted as substrate inhibition. Although it is not very pronounced in the concentration range investigated in the present work, it must be taken into account when analyzing the kinetics of the inhibition. Furthermore, consideration must also be given to the fact that the inhibition caused by the
pinhão coat tannin was parabolic. This kind of relationship means that more than one inhibitor molecule binds to a single site in the enzyme, enhancing inhibition at higher concentrations to degrees that are above those expected when a single molecule binds to the site [
13,
14]. In principle, one may assume that the following complexes are formed in the presence of enzyme (E), substrate (S) and inhibitor (I): ES, ES
2, EI, ESI, ES
2I, EI
2, ESI
2 and ES
2I
2. If one assumes that (1) only the complex ES leads to product formation (
i.e., all other complexes are inhibitory), (2) binding of the second substrate molecule to the enzyme does not change its affinity to the inhibitor, (3) steady-state conditions hold for the substrate to enzyme interactions and that the (4) enzyme to inhibitor interactions are in equilibrium, the following equation can be derived for the reaction rate (v) dependence from both substrate ([S]) and inhibitor ([I]) concentrations [
13,
14]:
V
max is the maximal reaction rate, K
M the Michaelis constant and K
iS the substrate inhibition constant; K
i1 and K’
i1 are the inhibition constants for the EI andEI
2 complexes, respectively; K
i2 the inhibition constants for the ESI and ES
2I complexes; and K’
i2 the inhibition constant for the ESI
2 and ES
2I
2 complexes. These inhibition constants may be true dissociation constants under certain limiting conditions, but especially if more than one inhibitor is present in the
pinhão coat extract, they are complex functions of several individual dissociation constants, but are still a measure of the potency of the inhibition [
13,
14]. It should be noted that the presence of more than one inhibitor does not invalidate Equation (2), provided that their concentrations are kept at constant ratios, as occurs when different amounts of the same extract are added [
13,
14]. Equation (2) was fitted to the whole experimental data set shown in
Figure 2. Fitting was successful in that convergence between experimental and calculated data was reached quickly and positive values were obtained for all parameters.
Table 1 lists the parameters obtained, which reveal consistent values for K
M, V
max and K
iS with relatively low standard deviations. The optimized values of the inhibition constants, however, indicate that Equation (2) might not be a good description of the data. Firstly, the standard deviations of the four inhibition constants greatly exceed their optimized values, meaning that they cannot be determined with an acceptable precision. Moreover, the value of K
i1 is exceptionally high, and the standard deviation exceeds it by orders of magnitude. Clearly, K
i1 cannot be determined. This happens if the concentration of the complex EI is too low to be detected, which renders the [I]/K
i1 term in Equation (2) non-significant. The same applies to the K
i2 value, which greatly reduces the significance of the [I]/K
i1 term in Equation (2) and also suggests that the concentrations of the ESI and ES
2I complexes are low. An alternative to Equation (2) would be Equation (3) in which binding of at least two molecules of the inhibitor is considered to occur practically at a single step, so that only binary complexes of the inhibitor with the various enzyme forms are considered, namely EI
2, ESI
2 and ES
2I
2 [
15]:
In Equation (3),
and
are composite dissociation constants for the combination of at leasttwo inhibitor molecules with free enzyme or with substrate-complex enzyme, respectively. Fitting of Equation (3) produced more realistic parameters as revealed by the second column in
Table 1.
Figure 2, in turn, allows a graphical comparison of the experimental and calculated points, as the continuous lines were calculated according to Equation (3) using the optimized parameters. The K
M, V
max and K
iS values were close to those found when fitting Equation (2), but with smaller standard deviations. Equation (3) is no doubt a better description of the experimental data, as revealed by the smaller sum of squared deviations and greater model selection criterion, which are also given in the last two lines of
Table 1. The
and
values, finally, are very close to each other, their values being within the range of the concentrations that were employed in the present experiments and their standard deviations being acceptable if one considers the complexity of the underlying phenomena. It should be noted that the similarity of the
and
values (they differ by only 3.4%) allows classification of the inhibition caused by the condensed tannin of the
pinhão coat tannins as of the simple parabolic non-competitive type [
13,
14]. In this case, the value of the inhibition constants becomes also the approximate concentration of the condensed tannin that produces 50% inhibition at a fixed substrate concentration,
i.e., [I]
50 ≈
≈
. This postulate can be easily tested by examining the reaction rate
versus inhibitor concentration curve in
Figure 1A. Numerical interpolation yielded 316.3 μg/mL as the concentration producing 50% inhibition, a value that is very close to that predicted by the optimized inhibition constants.
The substrate inhibition caused by
p-nitrophenyl palmitate was not very pronounced, as revealed by comparison of the K
M and K
iS values, the latter exceeding the former by a factor of 24.4 (see
Table 1). However, it was consistently present in the four experimental curves that were measured in the present work, and if neglected, it would have interfered significantly with the interpretation of the results. It must be mentioned, however, that substrate inhibition is a frequently-reported phenomenon with pancreatic lipase [
16], as well as with other lipases [
17]. It should be noted, on the other hand, that the general kinetics and K
M values of lipases can be expected to vary considerably depending on the way in which the lipophilic substrate is solubilized and the general conditions of the assay. A K
M of 2.7 μM has been reported, for example, for pancreatic lipase hydrolyzing the same substrate used in the present work, but in a medium containing 5 mM sodium deoxycholate in addition to 10% isopropanol and 50 mM phosphate buffer at pH 8.0 [
18].
Figure 2.
Substrate and inhibitor concentration dependences of the reaction rates of pancreatic lipase. Initial reaction rates, measured as described in the Experimental Section, were represented against the substrate concentration. The
pinhão coat extract concentration in the assay medium is given on each curve. Each datum point represents the mean of at least three measurements. The error parameters are mean standard errors, which are not visible when smaller than the symbol size. The continuous lines represent the theoretical curves calculated according to Equation (3) with the optimized parameters listed in
Table 1.
Table 1.
Kinetic parameters of porcine pancreatic lipase obtained by fitting Equations (2) and (3) to the experimental data. Both equations were fitted simultaneously to the four substrate saturation curves obtained with the different
pinhão coat extract concentrations shown in
Figure 2. A non-linear least-squares procedure was used. The error terms correspond to standard deviations of the optimized parameters. The model selection criterion was 4.448, the correlation coefficient 0.995 and the sum of squared deviations 0.0541.
Table 1.
Kinetic parameters of porcine pancreatic lipase obtained by fitting Equations (2) and (3) to the experimental data. Both equations were fitted simultaneously to the four substrate saturation curves obtained with the different pinhão coat extract concentrations shown in Figure 2. A non-linear least-squares procedure was used. The error terms correspond to standard deviations of the optimized parameters. The model selection criterion was 4.448, the correlation coefficient 0.995 and the sum of squared deviations 0.0541.
| Parameters | Optimized Values |
|---|
| Equation (2) | Equation (3) |
|---|
| KM (mM) | 0.0583 ± 0.0077 | 0.0581 ± 0.0068 |
| Vmax (μmol·min−1) | 2.094 ± 0.126 | 2.079 ± 0.112 |
| KiS (mM) | 1.401 ± 0.337 | 1.418 ± 0.311 |
| Ki1 (μg·mL−1) | 97,620 ± 15,080,211 | — |
| (μg·mL−1)
| 1.090 ± 168.991 | — |
| Ki2 (μg·mL−1) | 1604.5 ± 1887.5 | — |
| (μg·mL−1)
| 82.19 ± 121.9 | — |
| (μg·mL−1)
| — | 332.7 ± 146.1 |
| (μg·mL−1)
| — | 321.2 ± 93.0 |
| Sum of squared deviations | 0.0614 | 0.0541 |
| Model selection criterion | 4.210 | 4.448 |
3.3. Effects on Triglyceride Absorption
The ability of the
pinhão coat extract rich in tannins as an inhibitor of pancreatic lipase seems to be well demonstrated by the
in vitro experiments. Confirmation of its effectiveness on the triglyceride hydrolysis
in vivo can be obtained by means of experiments in which the blood levels of triglycerides are measured after an oral administration of these lipids. This test is based on the well-established notion that triglyceride hydrolysis is essential for its effective intestinal absorption along a mechanism that involves hydrolysis and re-esterification [
8].
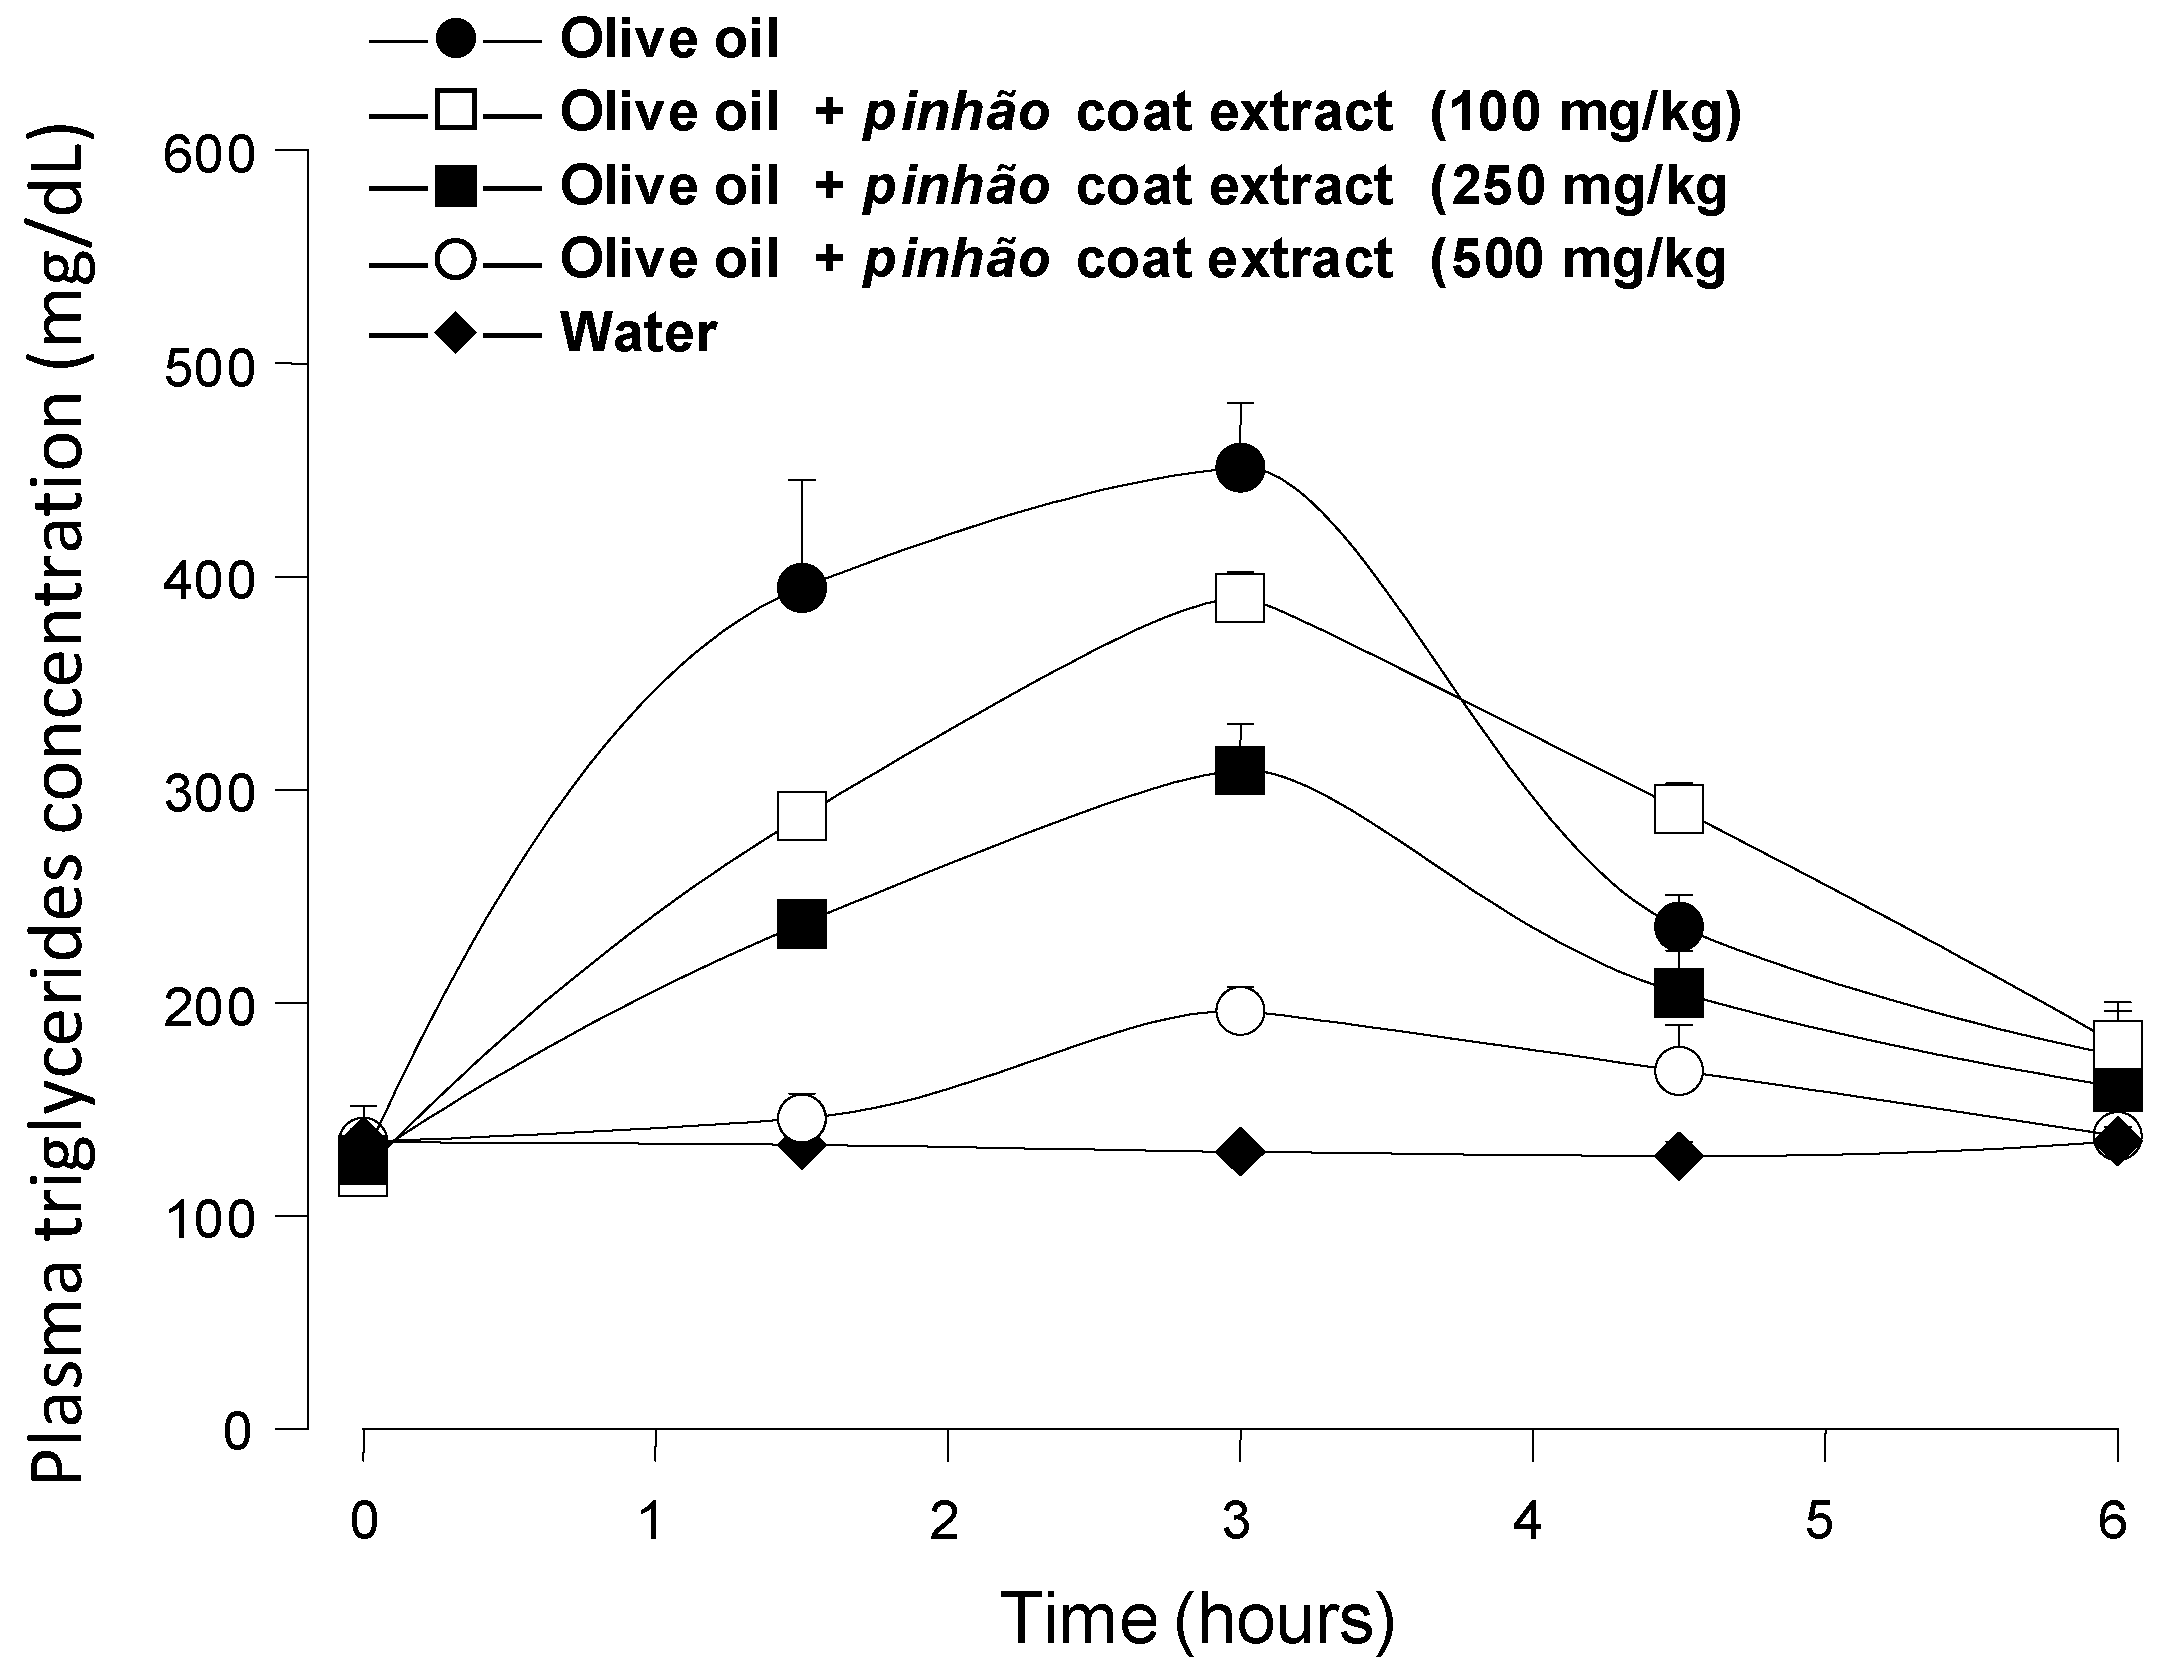
Figure 3 shows the results of the experiments in which an oral load of olive oil was applied to mice alone or in combination with three different doses of the
pinhão coat extract, namely 100 mg/kg, 250 mg/kg and 500 mg/kg. The triglyceride levels were monitored during 6 h after administration. When water was given, the triglyceride levels remained more or less constant at around 115 mg/dL, providing a convenient base line for the 6-h period. Administration of olive oil alone caused a substantial rise in the plasma triglyceride levels, which reached values slightly above 400 mg/dL after 3 h. After six hours, they had almost declined to the basal levels. The triglyceride levels were reduced upon the
pinhão coat extract administration, the effect being a function of the dose that was administered. This effect
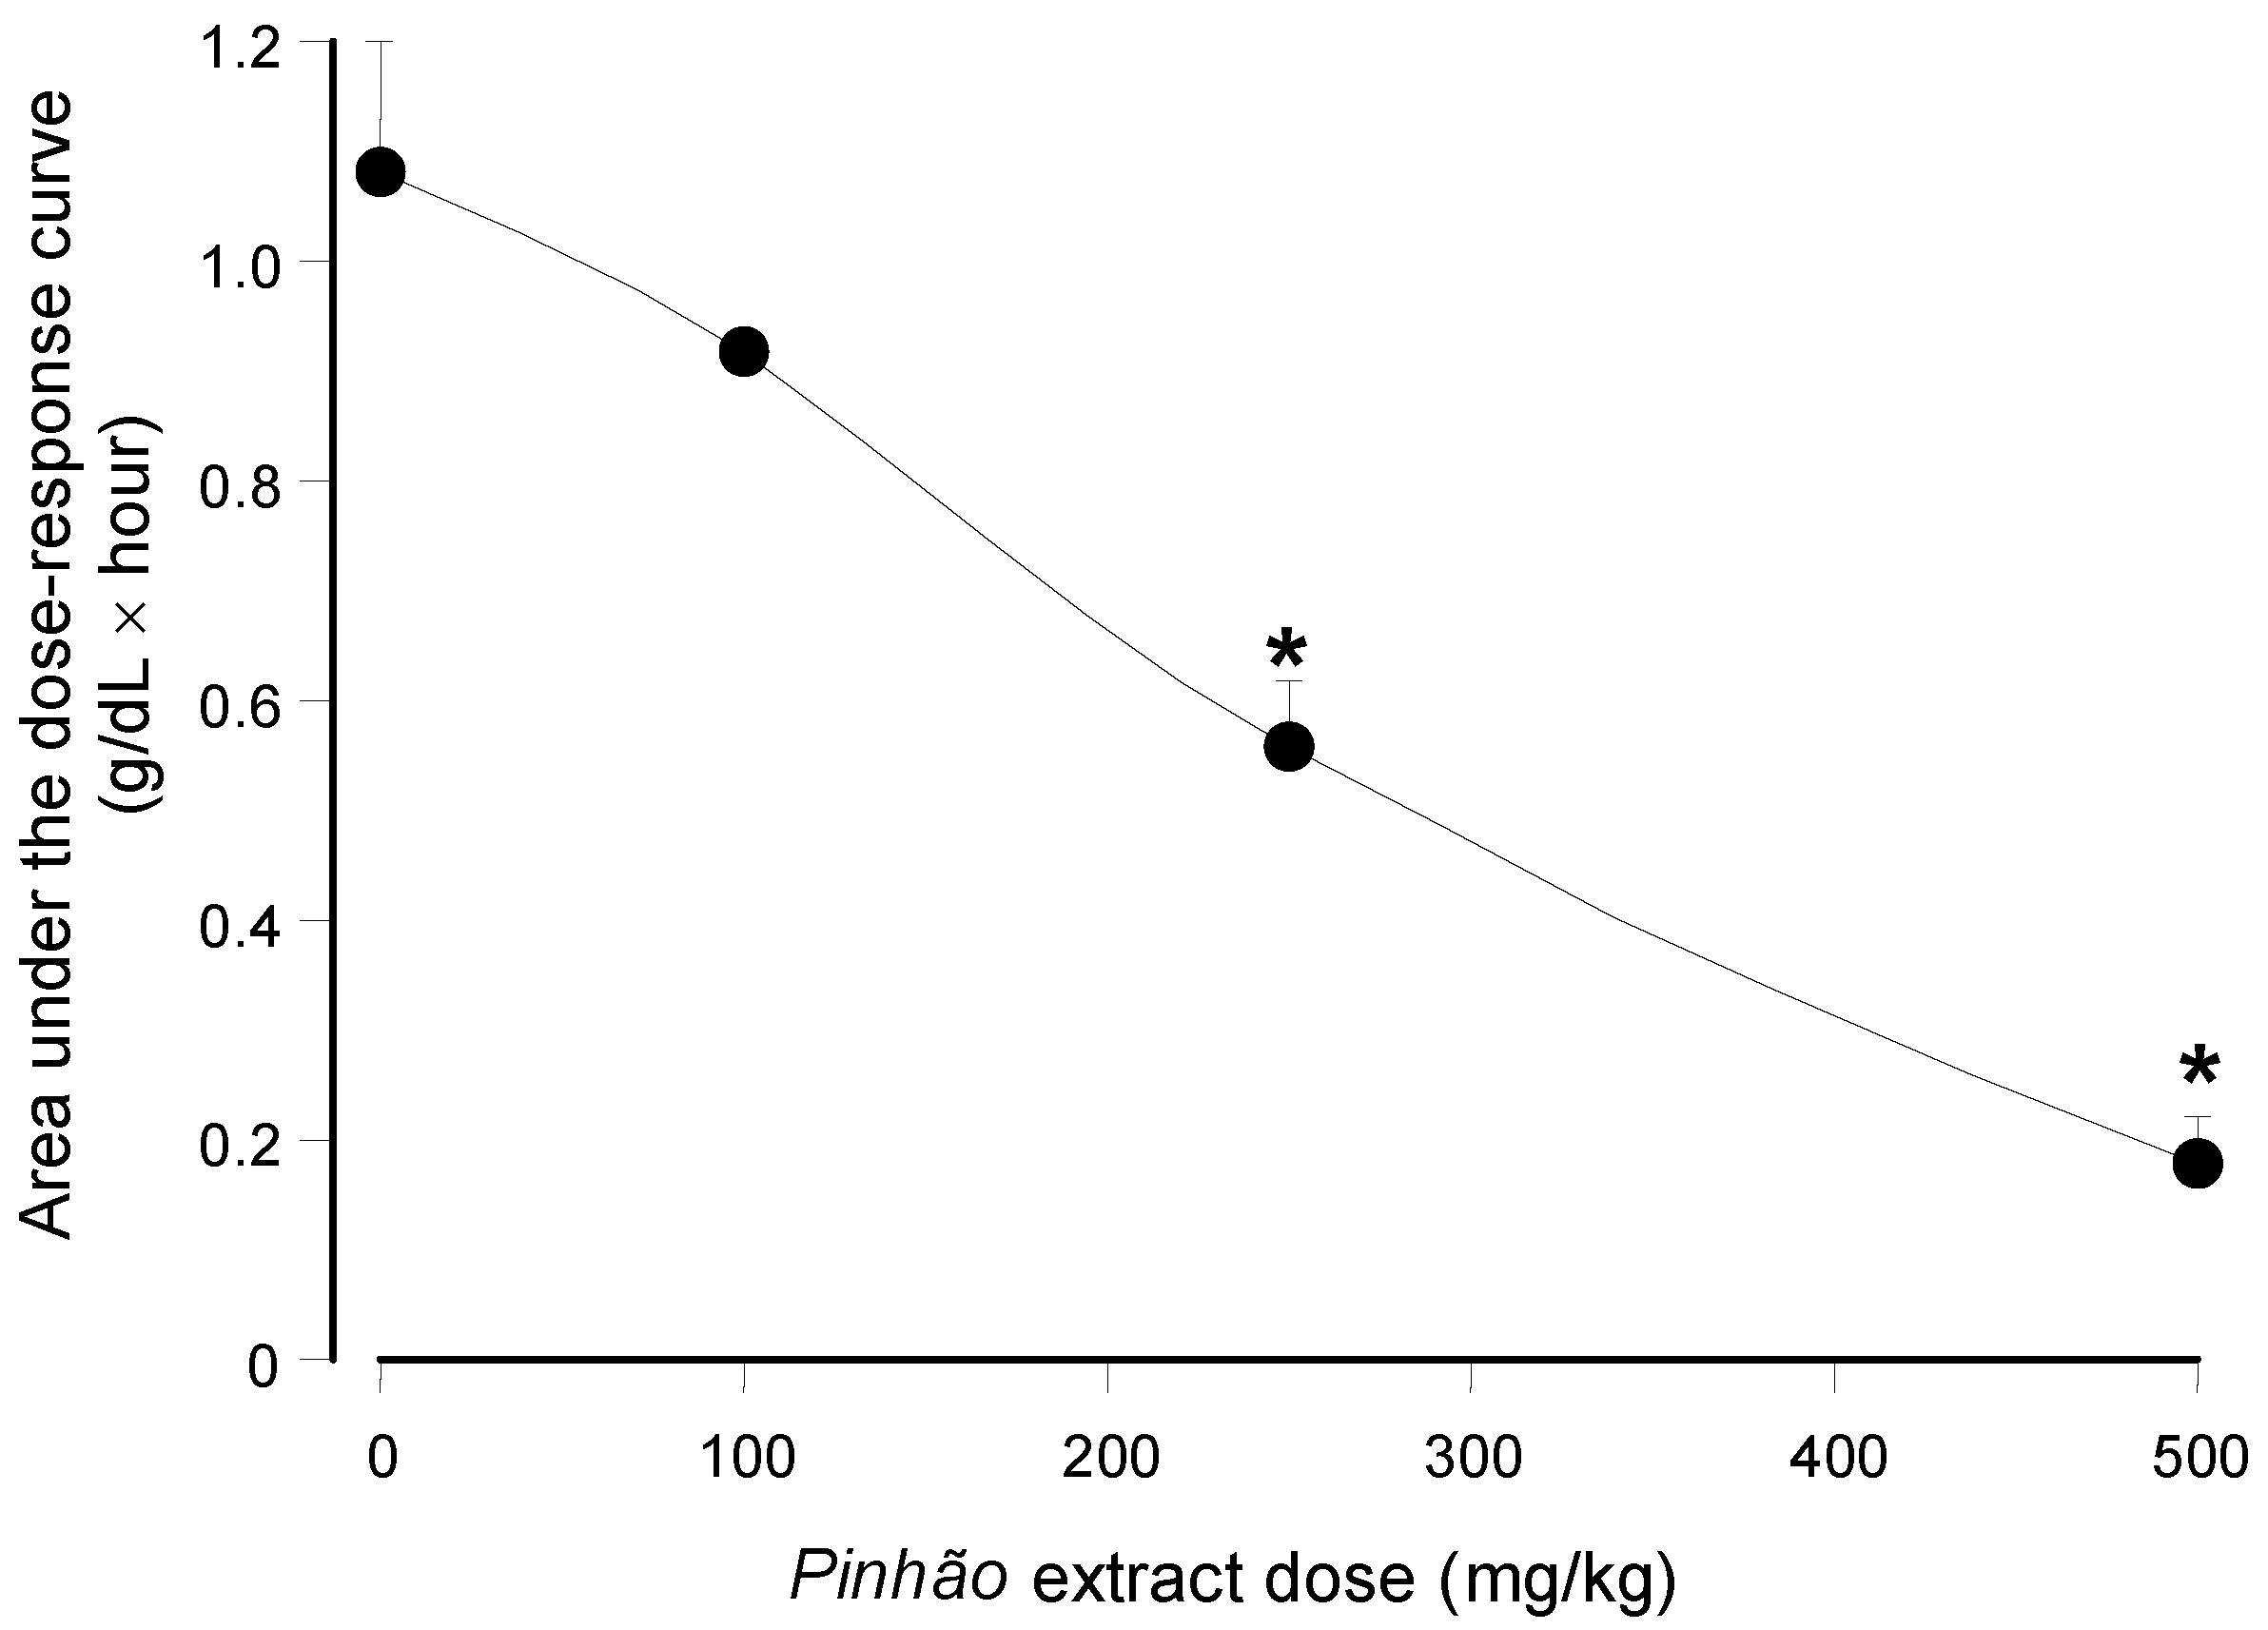
versus dose relationship can be seen in
Figure 4 in which the areas under the dose-response curves were plotted against the
pinhão extract doses. The base-line for calculating the areas under the curves in
Figure 4 was provided by the plasma triglyceride levels measured after water administration (
Figure 3). These areas have the dimensions of (g/dL × h), and they are a function of the lipid load that was effectively absorbed by the intestine.
Figure 4 shows that the areas under the curves declined almost linearly with the extract dose that was administered. At the highest dose (500 mg/kg), it was diminished by 84% relative to the control (no extract administration); a 50% reduction can be expected at a dose around 258.9 mg/kg.
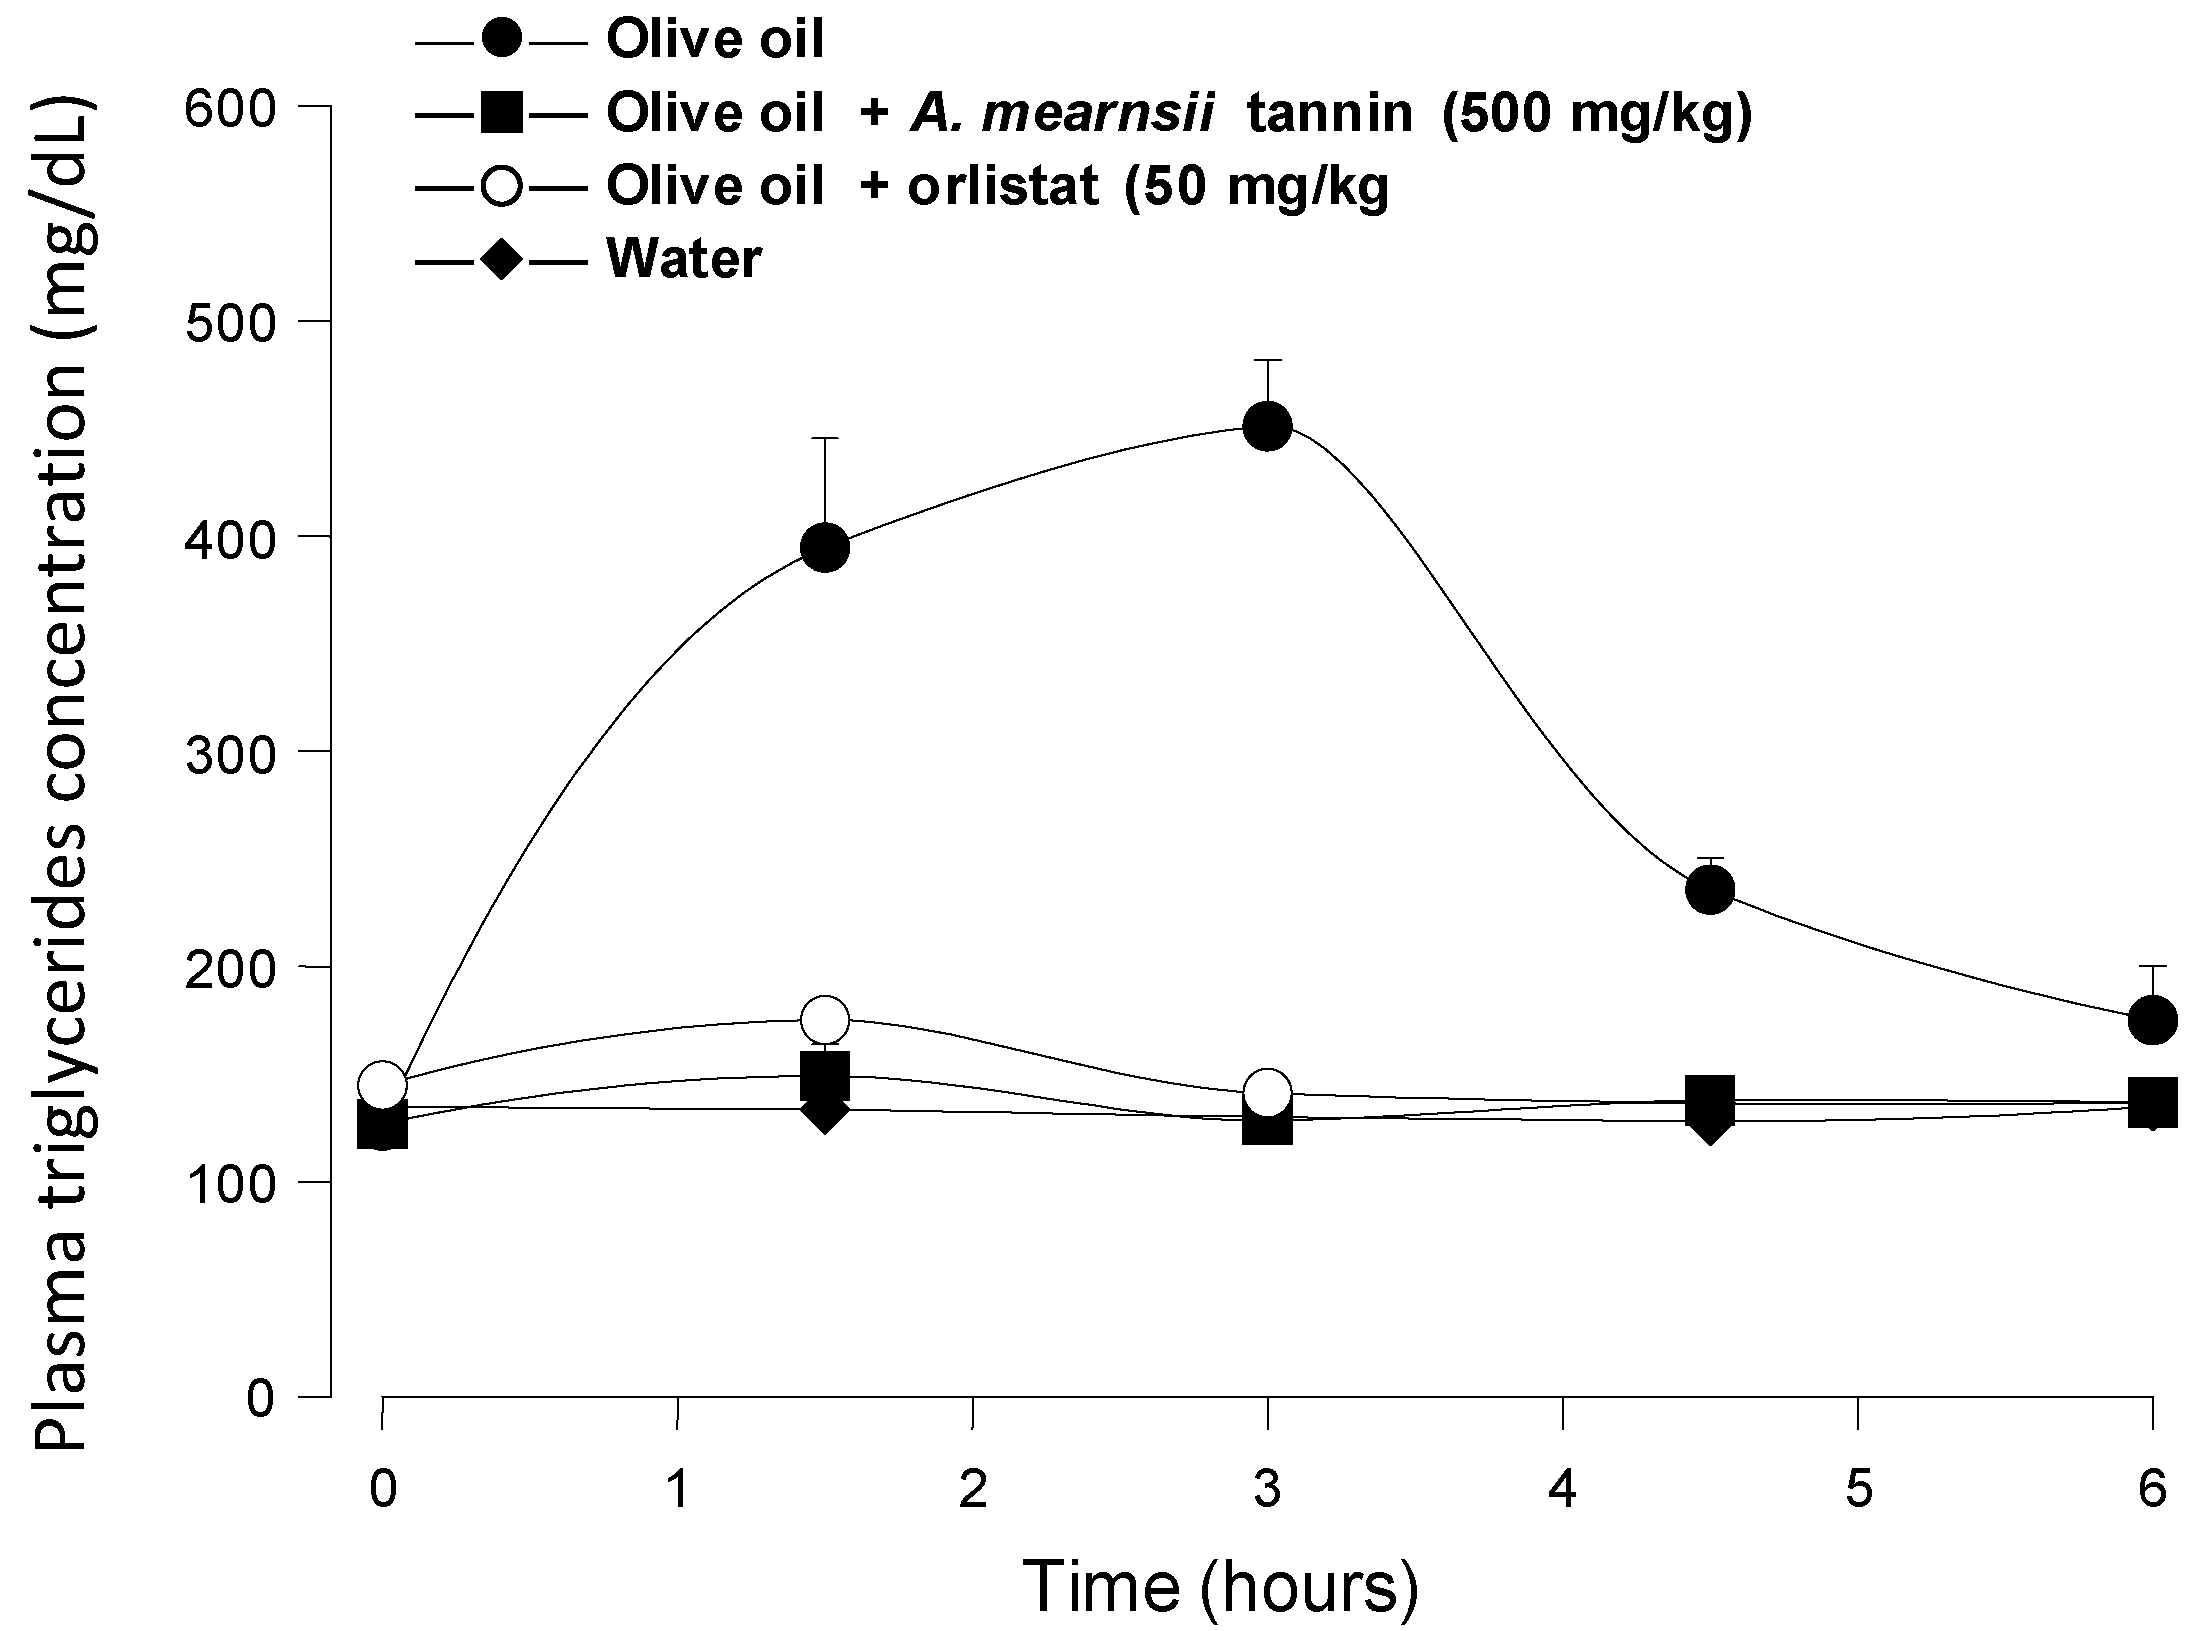
Figure 5 shows the results of positive control experiments in which orlistat (50 mg/kg) and
A. mearnsii tannin (500 mg/kg) were administered to mice in the same manner as the
pinhão coat extract. It is apparent that both orlistat (a classical lipase inhibitor) and the
A. mearnsii tannin were quite effective at diminishing triglyceride absorption, the area under the corresponding curves representing less than 5% of the area under the control curve. This is not surprising for orlistat, which is a covalent inhibitor of pancreatic lipase [
7], but is not necessarily expected from the
A. mearnsii tannin, which is a much weaker lipase inhibitor than the
pinhão coat tannin (see
Figure 1). It should be mentioned that in this respect, the commercial
A. mearnsii tannin preparation used in the present work was even more effective than the
A. mearnsii polyphenol preparation used in previous studies [
7], which diminished by 65% the area under the curve when a 500-mg/kg dose was administered in experiments similar to those of the present work. The difference between the
pinhão coat tannin and the
A. mearnsii tannin preparation in affecting triglyceride absorption may have several causes. The
pinhão coat extract is certainly a better inhibitor of the
p-nitrophenyl palmitate hydrolysis than the
A. mearnsii tannin under the conditions of our assay. The latter, however, was done in the presence of isopropanol and with a non-natural substrate (
p-nitrophenyl-palmitate). One cannot exclude that, under physiologic conditions, with the natural substrates (long-chain triglycerides)) and in the presence of bile acids and colipase, the
A. mearnsii tannin reveals itself to be a better inhibitor than the
pinhão coat extract. It should also be considered that the enzyme used in the
in vitro assays was obtained from pig pancreas, and the
in vivo experiments were done with mice. The actions of both the
A. mearnsii tannin and the
pinhão coat extract on both enzymes can be different. Finally, it is possible that the mouse responds differently to both preparations. This includes different gastric movements, but also the possibility that the
A. mearnsii tannin site of action is not restricted to pancreatic lipase. Irrespective of the real reason for the discrepancy, a definitive explanation depends on additional conclusive evidence.
Figure 3.
Blood triglyceride concentration profiles after intragastric olive oil loads in mice: the effect of the pinhão coat extract. The oral administration of olive oil was done immediately after the oral administration of three different doses of the pinhão coat extract. The doses that were administered are given on the graphs. Plasma triglycerides were measured as described in the Experimental Section. Each value represents the mean ± SD of three mice.
Figure 4.
Dependence of the area under the plasma triglyceride concentration
versus time on the administered
pinhão coat extract dose. The areas were obtained from the results shown in
Figure 3. Each value represents the mean ± SD of three mice. Asterisks indicate statistical significance relative to the control (
p ≤ 0.05 according to the Student–Newman–Keuls test).
Figure 5.
Blood triglyceride concentration profiles after intragastric olive oil loads in mice: The effects of orlistat and A. mearnsii tannin. The oral administration of olive oil was done immediately after the oral administration of orlistat and A. mearnsii tannin.The doses that were administered are given in the graphs. Plasma triglycerides were measured as described in the Experimental Section. Each value represents the mean ± SD of three mice.
A mechanism for the anti-obesity actions of an
A. mearnsii polyphenol preparation has been proposed as consisting of a combination of lipase inhibition and maltase and sucrase inhibition [
7]. The first action reduces triglyceride absorption and the second sugar absorption. A similar anti-obesity action can be proposed for the
pinhão coat tannin based on the results obtained in the present work and on the inhibitory actions of the same preparation on both salivary and pancreatic α-amylases and on starch absorption that have been demonstrated in a previous work [
5]. It remains to be investigated if absorbable constituents of the
pinhão coat extract are able to alter the expression of obesity and diabetes-related genes in the adipose tissue, muscle and liver, as demonstrated to occur when mice are treated with an
A. mearnsii polyphenol preparation [
19]. On the other hand, it is important to emphasize that the actions demonstrated in the present work for the
pinhão coat extract are similar not only to those proposed for the
A. mearnsii polyphenols [
7,
19], but also for analogous constituents of other plants, such as apples [
6] and several types of tea [
20,
21].
Inhibition of pancreatic lipase, as well as of α-amylases by the
pinhão coat tannin requires binding to these enzymes, a phenomenon that was clearly demonstrated to exist for several combinations of tannins and proteins, including enzymes [
22,
23,
24]. Binding of tannins to proteins involves both hydrophilic and hydrophobic interactions. It is non-specific in some cases and specific with a certain degree of cooperativity in others [
22]. In the case of the
pinhão coat condensed tannin, where procyanidins predominate [
5], binding is a complex phenomenon, as indicated by the parabolic inhibition kinetics and probably facilitated by the numerous hydroxyl groups. These groups are probably responsible for the most important interactions at low concentrations [
24]. At high concentrations, however, random hydrophobic stacking of the planar rings may occur between tannin and protein, as deduced for the wine tannins binding to saliva proteins based on nuclear magnetic resonance and molecular modeling [
24].


