Frequent Canned Food Use is Positively Associated with Nutrient-Dense Food Group Consumption and Higher Nutrient Intakes in US Children and Adults


Abstract
:
1. Introduction
2. Experimental Section
2.1. Sampling and Data Collection
2.2. Analysis
3. Results
3.1. Study Demographics and Sample Sizes

| (ICU, n = 2732; FCU, n = 2584) | |||
|---|---|---|---|
| Demographics | % Infrequent Can Users (ICU) | % Frequent Can Users (FCU) | p-Value |
| Age (years) | |||
| 2–17 | 20.5 | 23.4 | NS |
| 18–65 | 65.6 | 59.6 | NS |
| 65+ | 13.9 | 17.0 | NS |
| BMI | |||
| Underweight | 4.2 | 3.8 | NS |
| Optimal | 38.2 | 36.6 | NS |
| Overweight | 28.7 | 32.1 | NS |
| Obese | 28.8 | 27.4 | NS |
| Household Income | |||
| Under $10,000 | 6.1 | 10.0 | NS |
| $10,000–$19,999 | 7.8 | 11.8 | NS |
| $20,000–$29,999 | 11.8 | 17.3 | NS |
| $30,000–$39,999 | 13.9 | 14.3 | NS |
| $40,000–$49,999 | 10.5 | 12.2 | NS |
| $50,000–$59,999 | 9.0 | 5.7 | NS |
| $60,000–$69,999 | 9.6 | 5.5 | NS |
| $70,000 and Over | 31.2 | 23.2 | <0.01 |
| Assistance Programs | |||
| SNAP participant | 11.9 | 23.5 | <0.01 |
| WIC participant | 6.3 | 11.8 | NS |
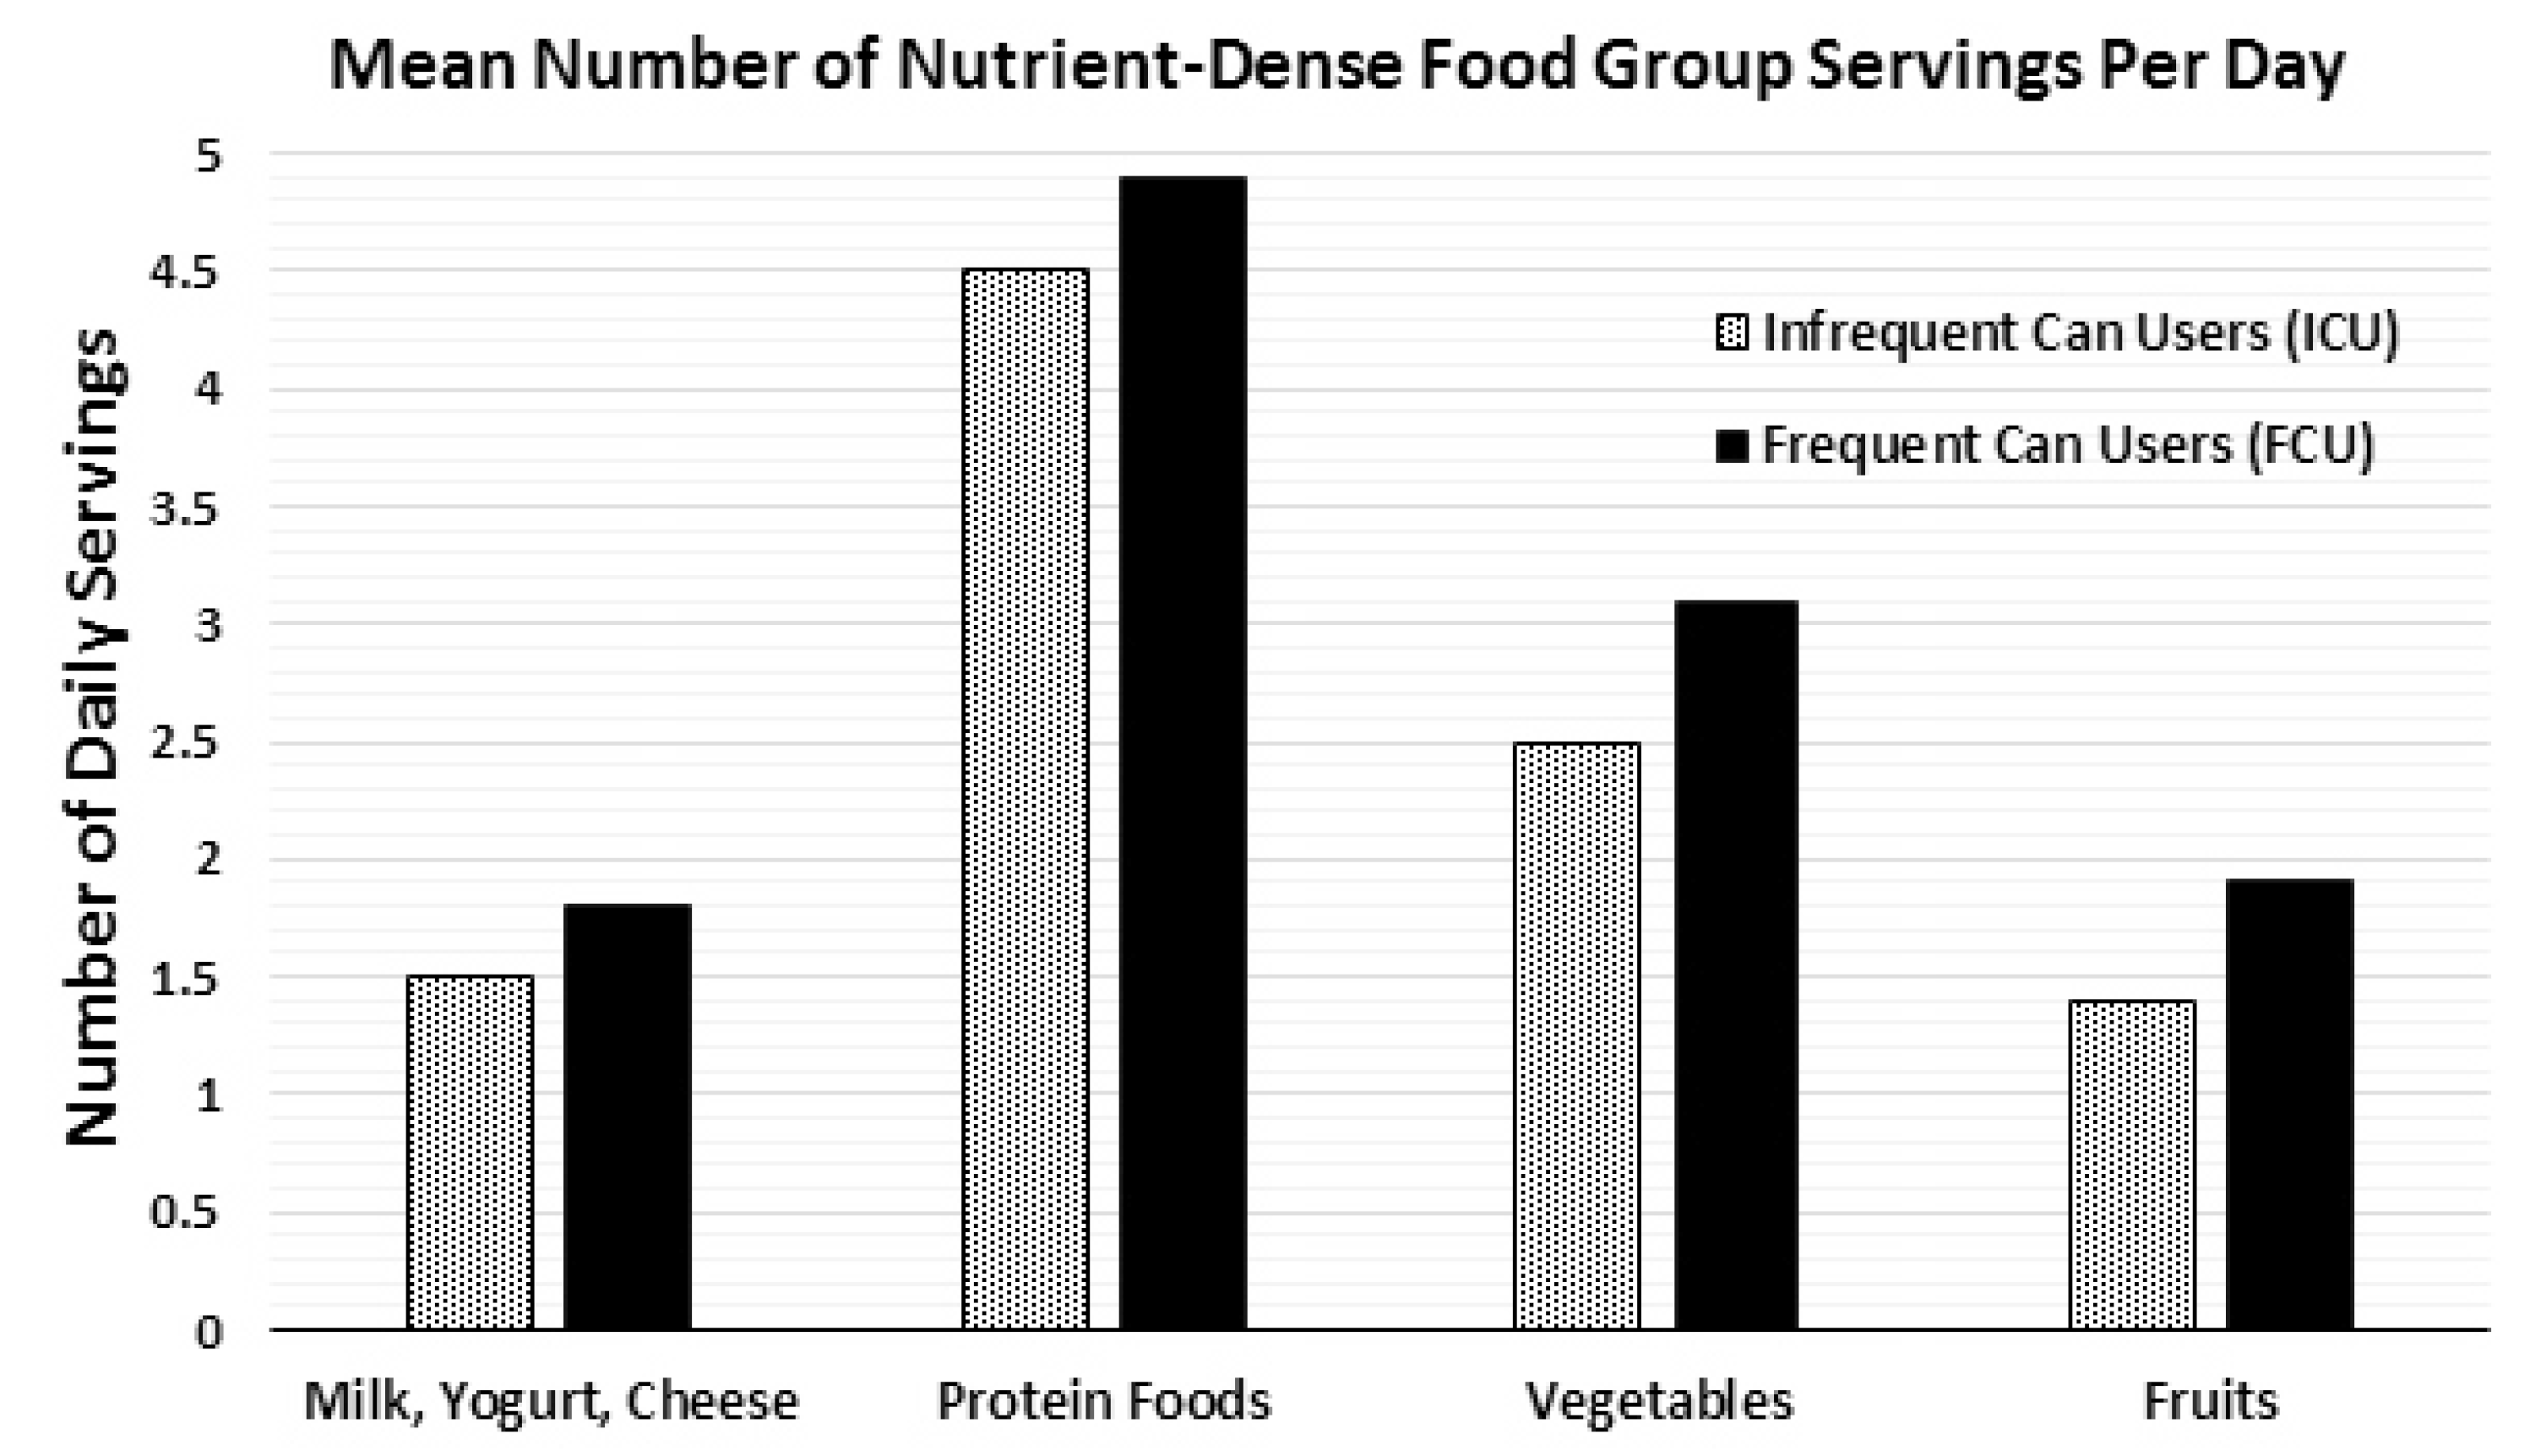
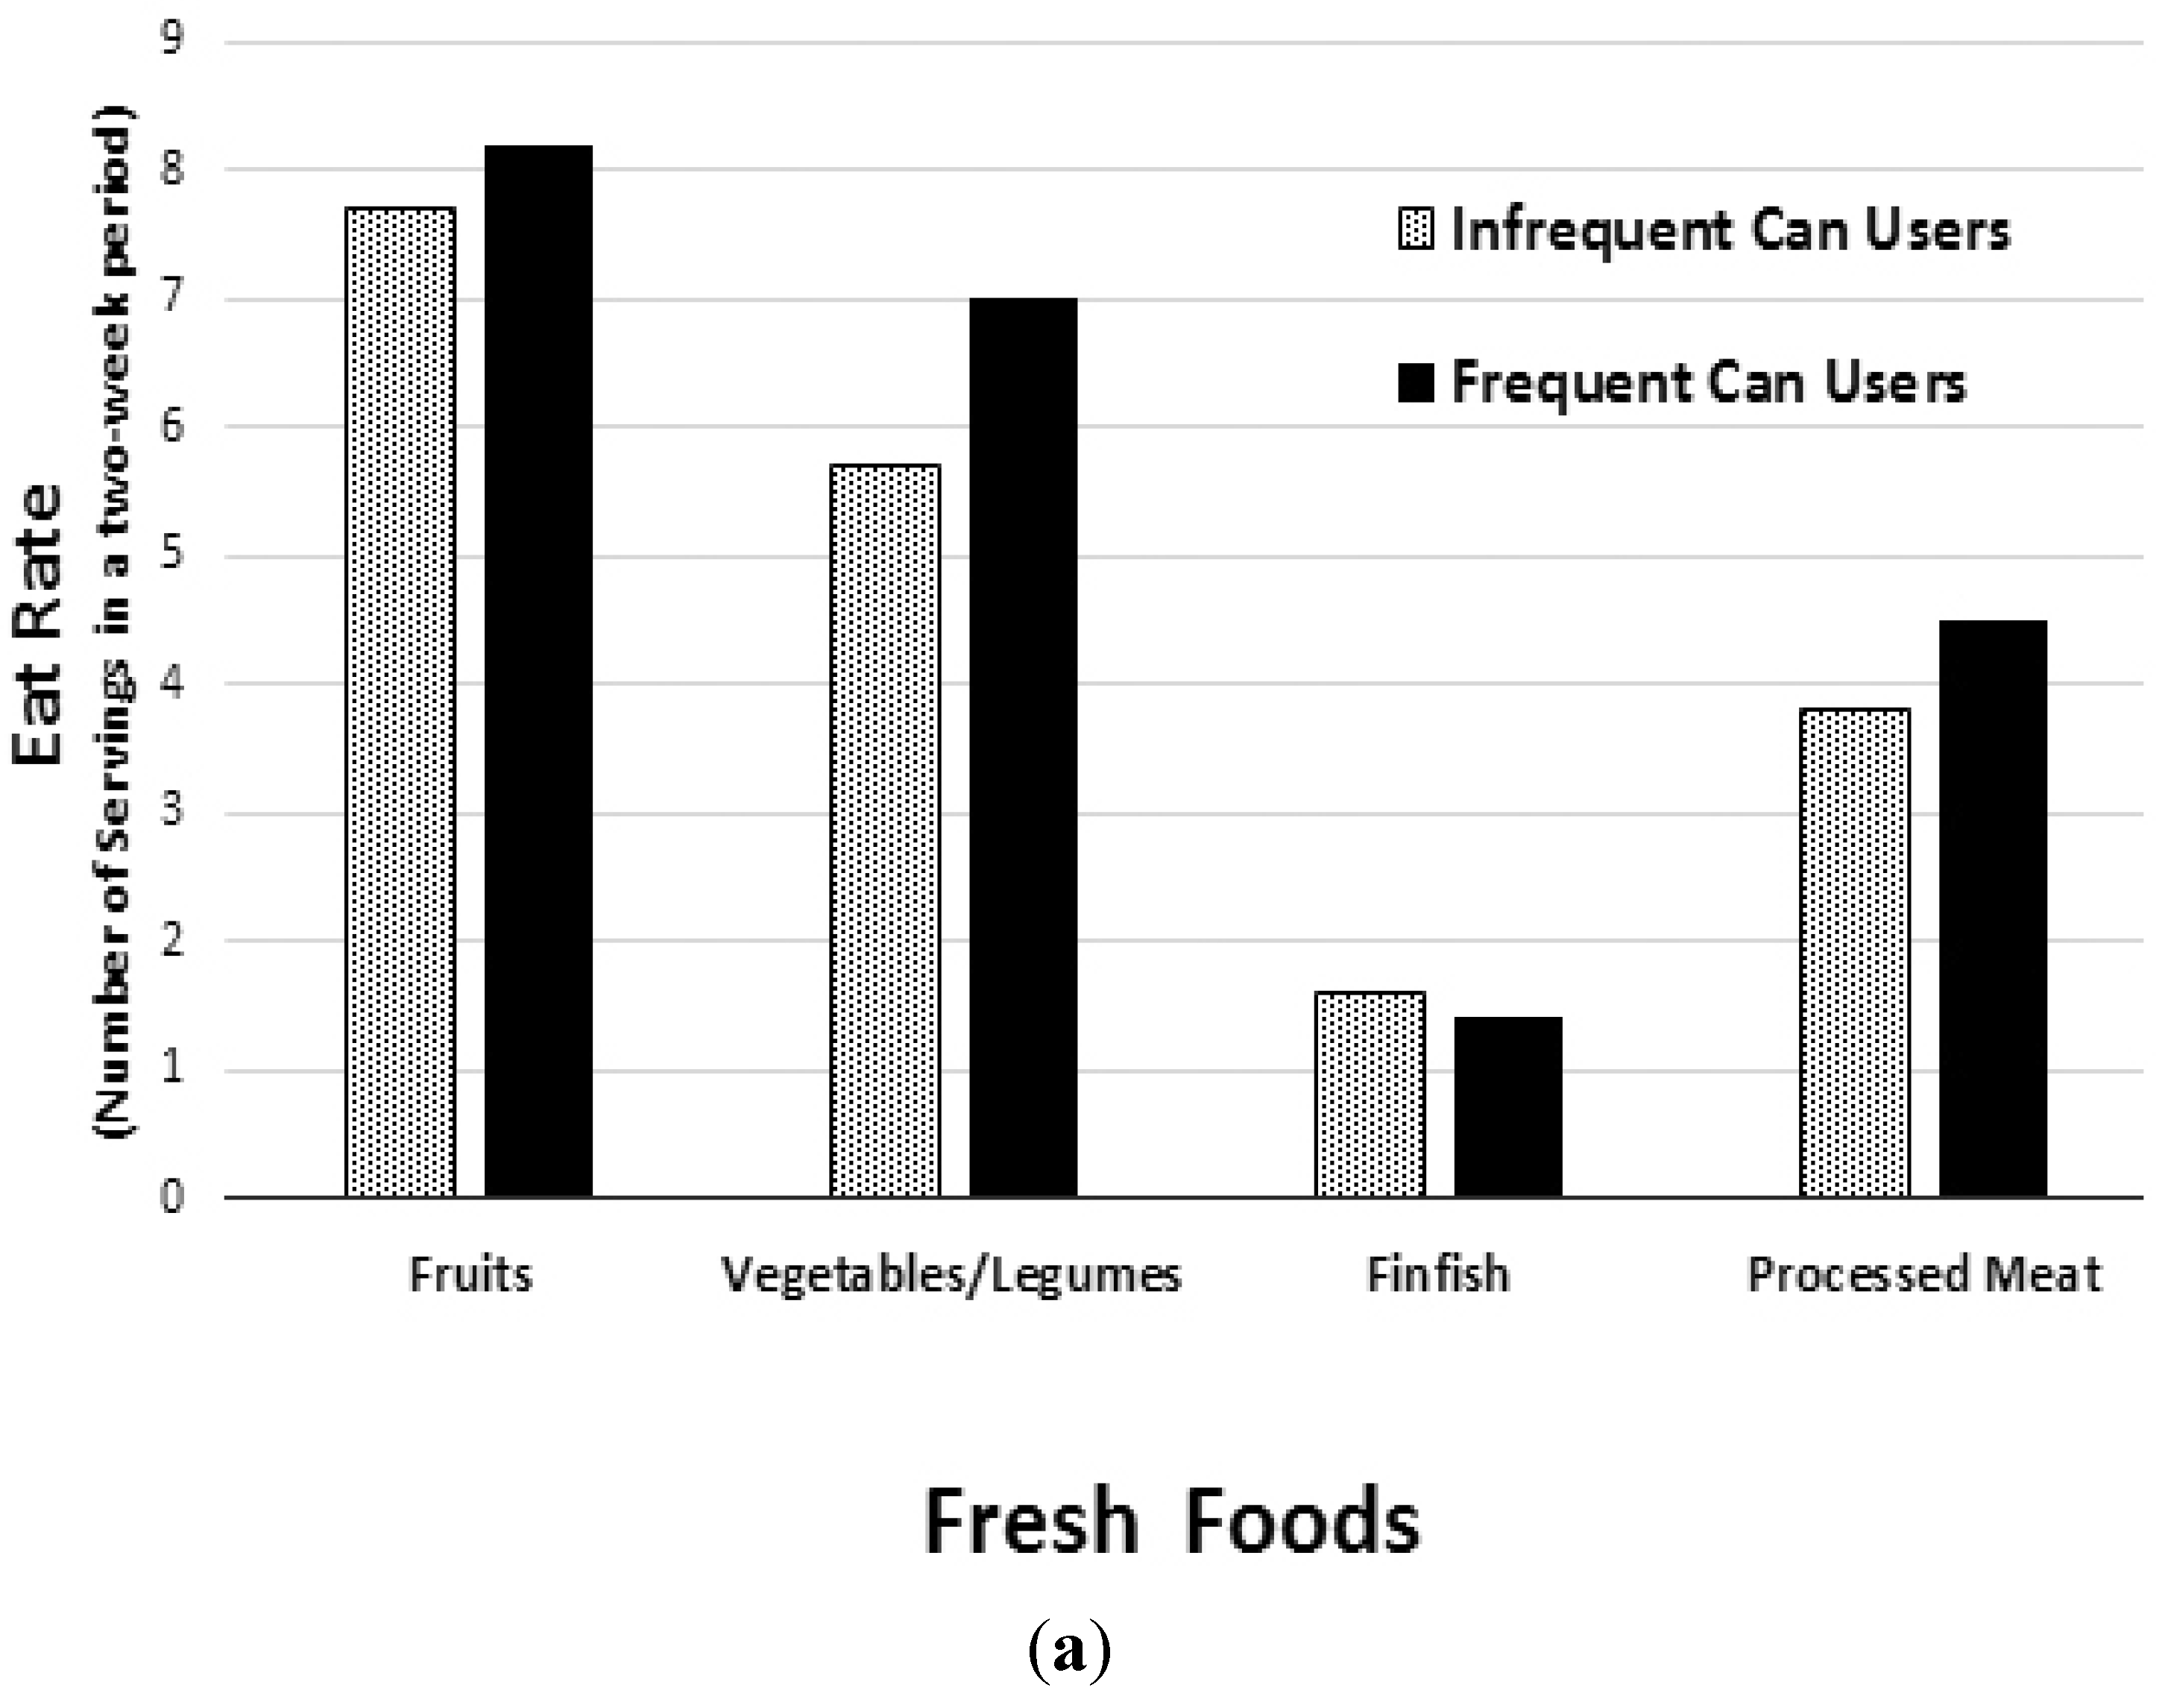
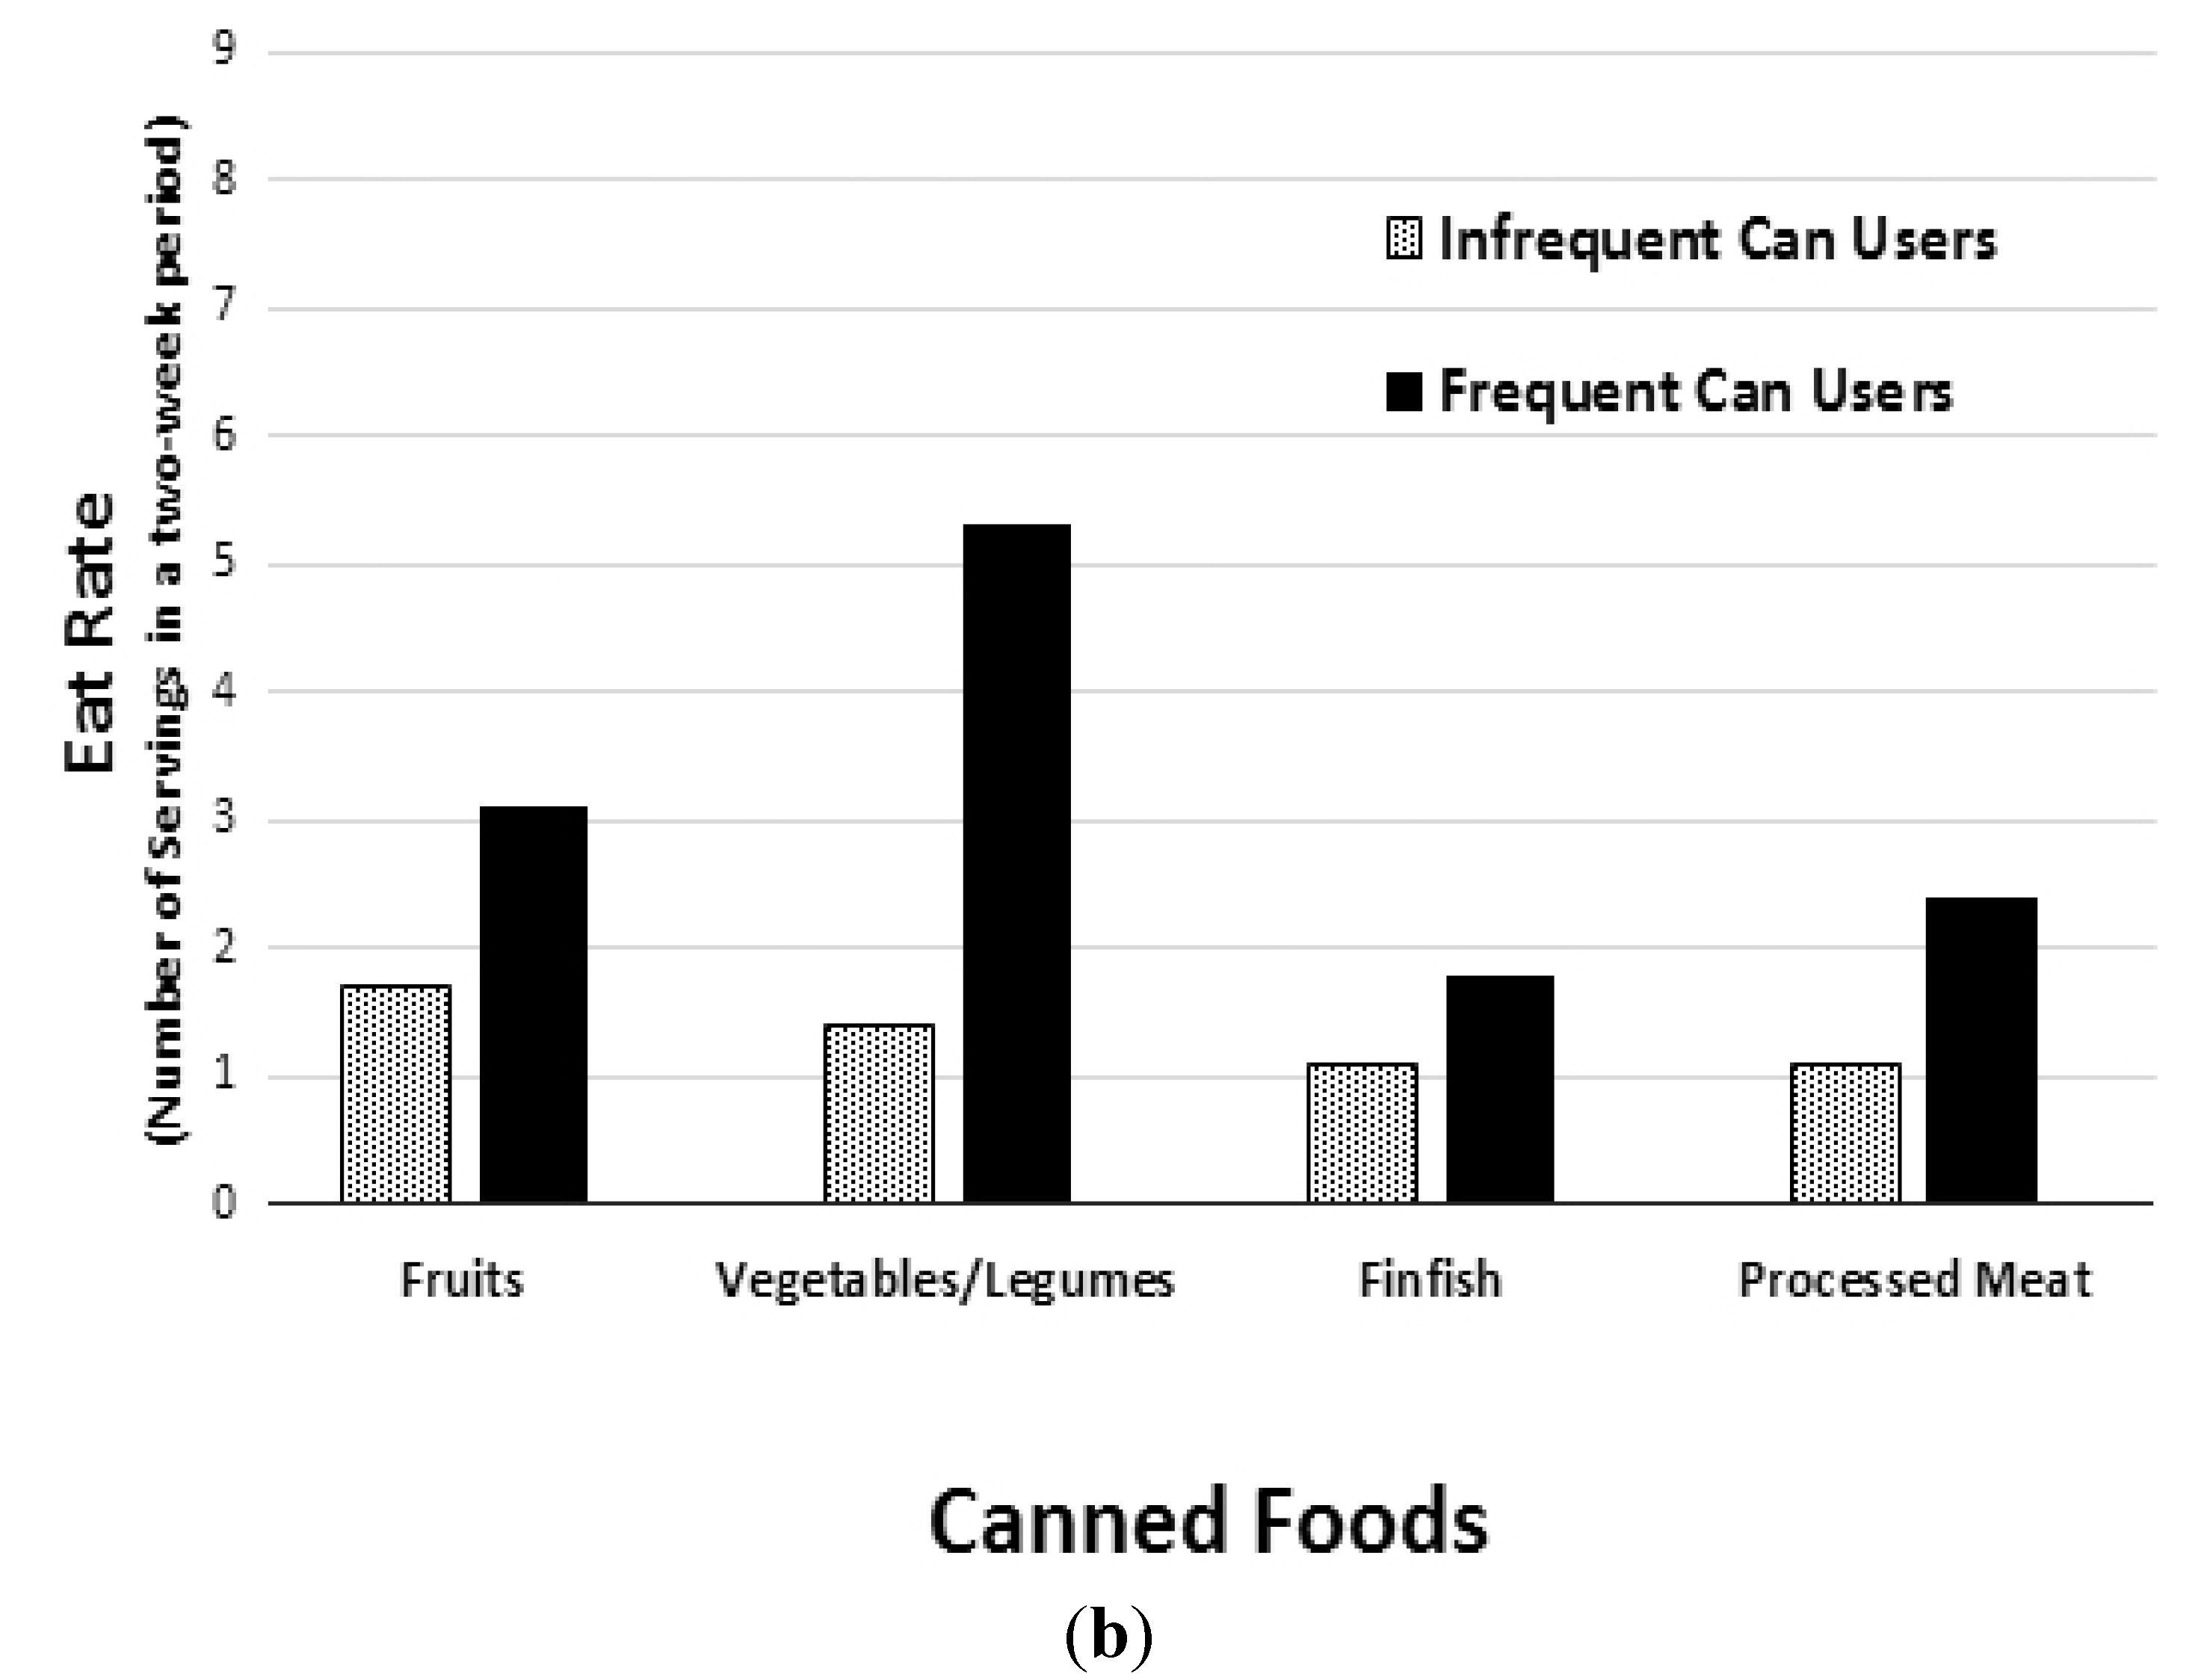
3.2. Food Group Intake and Eat Rate


3.3. Nutrient Intake
| Frequent Can Users: (ICU, n = 2732; FCU, n = 2584) | |||
|---|---|---|---|
| Nutrient | ICU | FCU | p-Value |
| Fiber (g) | 13.1 ± 6.2 | 16.0 ± 7.4 | <0.01 |
| Protein (g) | 69.7 ± 26.7 | 76.3 ± 29.9 | <0.01 |
| Vitamin A (RAE) (µg) | 585 ± 417 | 732 ± 417 | <0.01 |
| Vitamin E (mg) | 6.1 ± 3.5 | 7.1 ± 4.0 | <0.01 |
| Vitamin C (mg) | 65.9 ± 64.6 | 89.7 ± 68.9 | <0.01 |
| Thiamin (mg) | 1.6 ± 0.7 | 1.8 ± 0.8 | <0.01 |
| Riboflavin (mg) | 1.9 ± 0.8 | 2.2 ± 0.9 | <0.01 |
| Niacin (mg) | 20.9 ± 8.9 | 23.2 ± 9.7 | <0.01 |
| Vitamin B6 (mg) | 1.6 ± 0.8 | 1.9 ± 0.9 | <0.01 |
| Folate/Folic Acid (µg) | 370 ± 188 | 419 ± 200 | <0.01 |
| Vitamin B12 (µg) | 4.8 ± 4.2 | 5.7 ± 5.2 | <0.01 |
| Calcium (mg) | 873 ± 417 | 1027 ± 493 | <0.01 |
| Magnesium (mg) | 219 ± 87 | 257 ± 101 | <0.01 |
| Phosphorus (mg) | 1178 ± 437 | 1331 ± 522 | <0.01 |
| Iron (mg) | 14.3 ± 7.1 | 16.4 ± 7.8 | <0.01 |
| Zinc (mg) | 10.4 ± 5.4 | 11.6 ± 5.8 | <0.01 |
| Selenium (µg) | 101 ± 44 | 108 ± 47 | <0.01 |
| Sodium (mg) | 3168 ± 1283 | 3588 ± 1482 | <0.01 |
| Potassium (mg) | 2132 ± 827 | 2586 ± 988 | <0.01 |
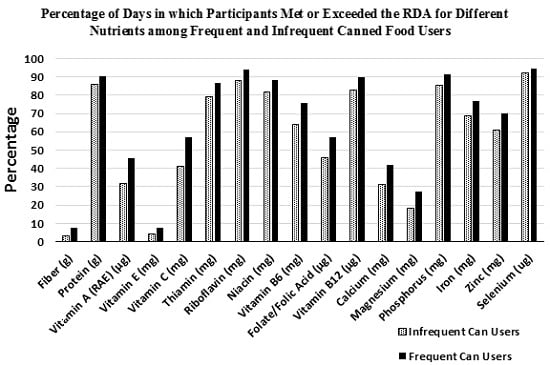
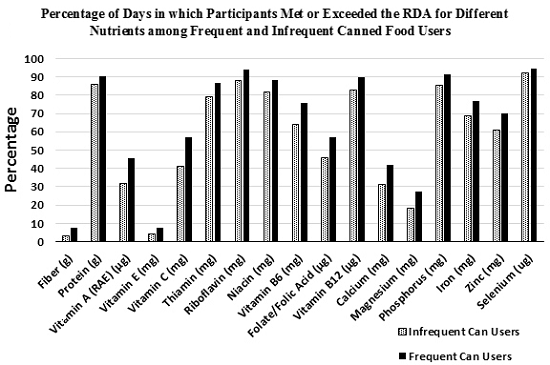
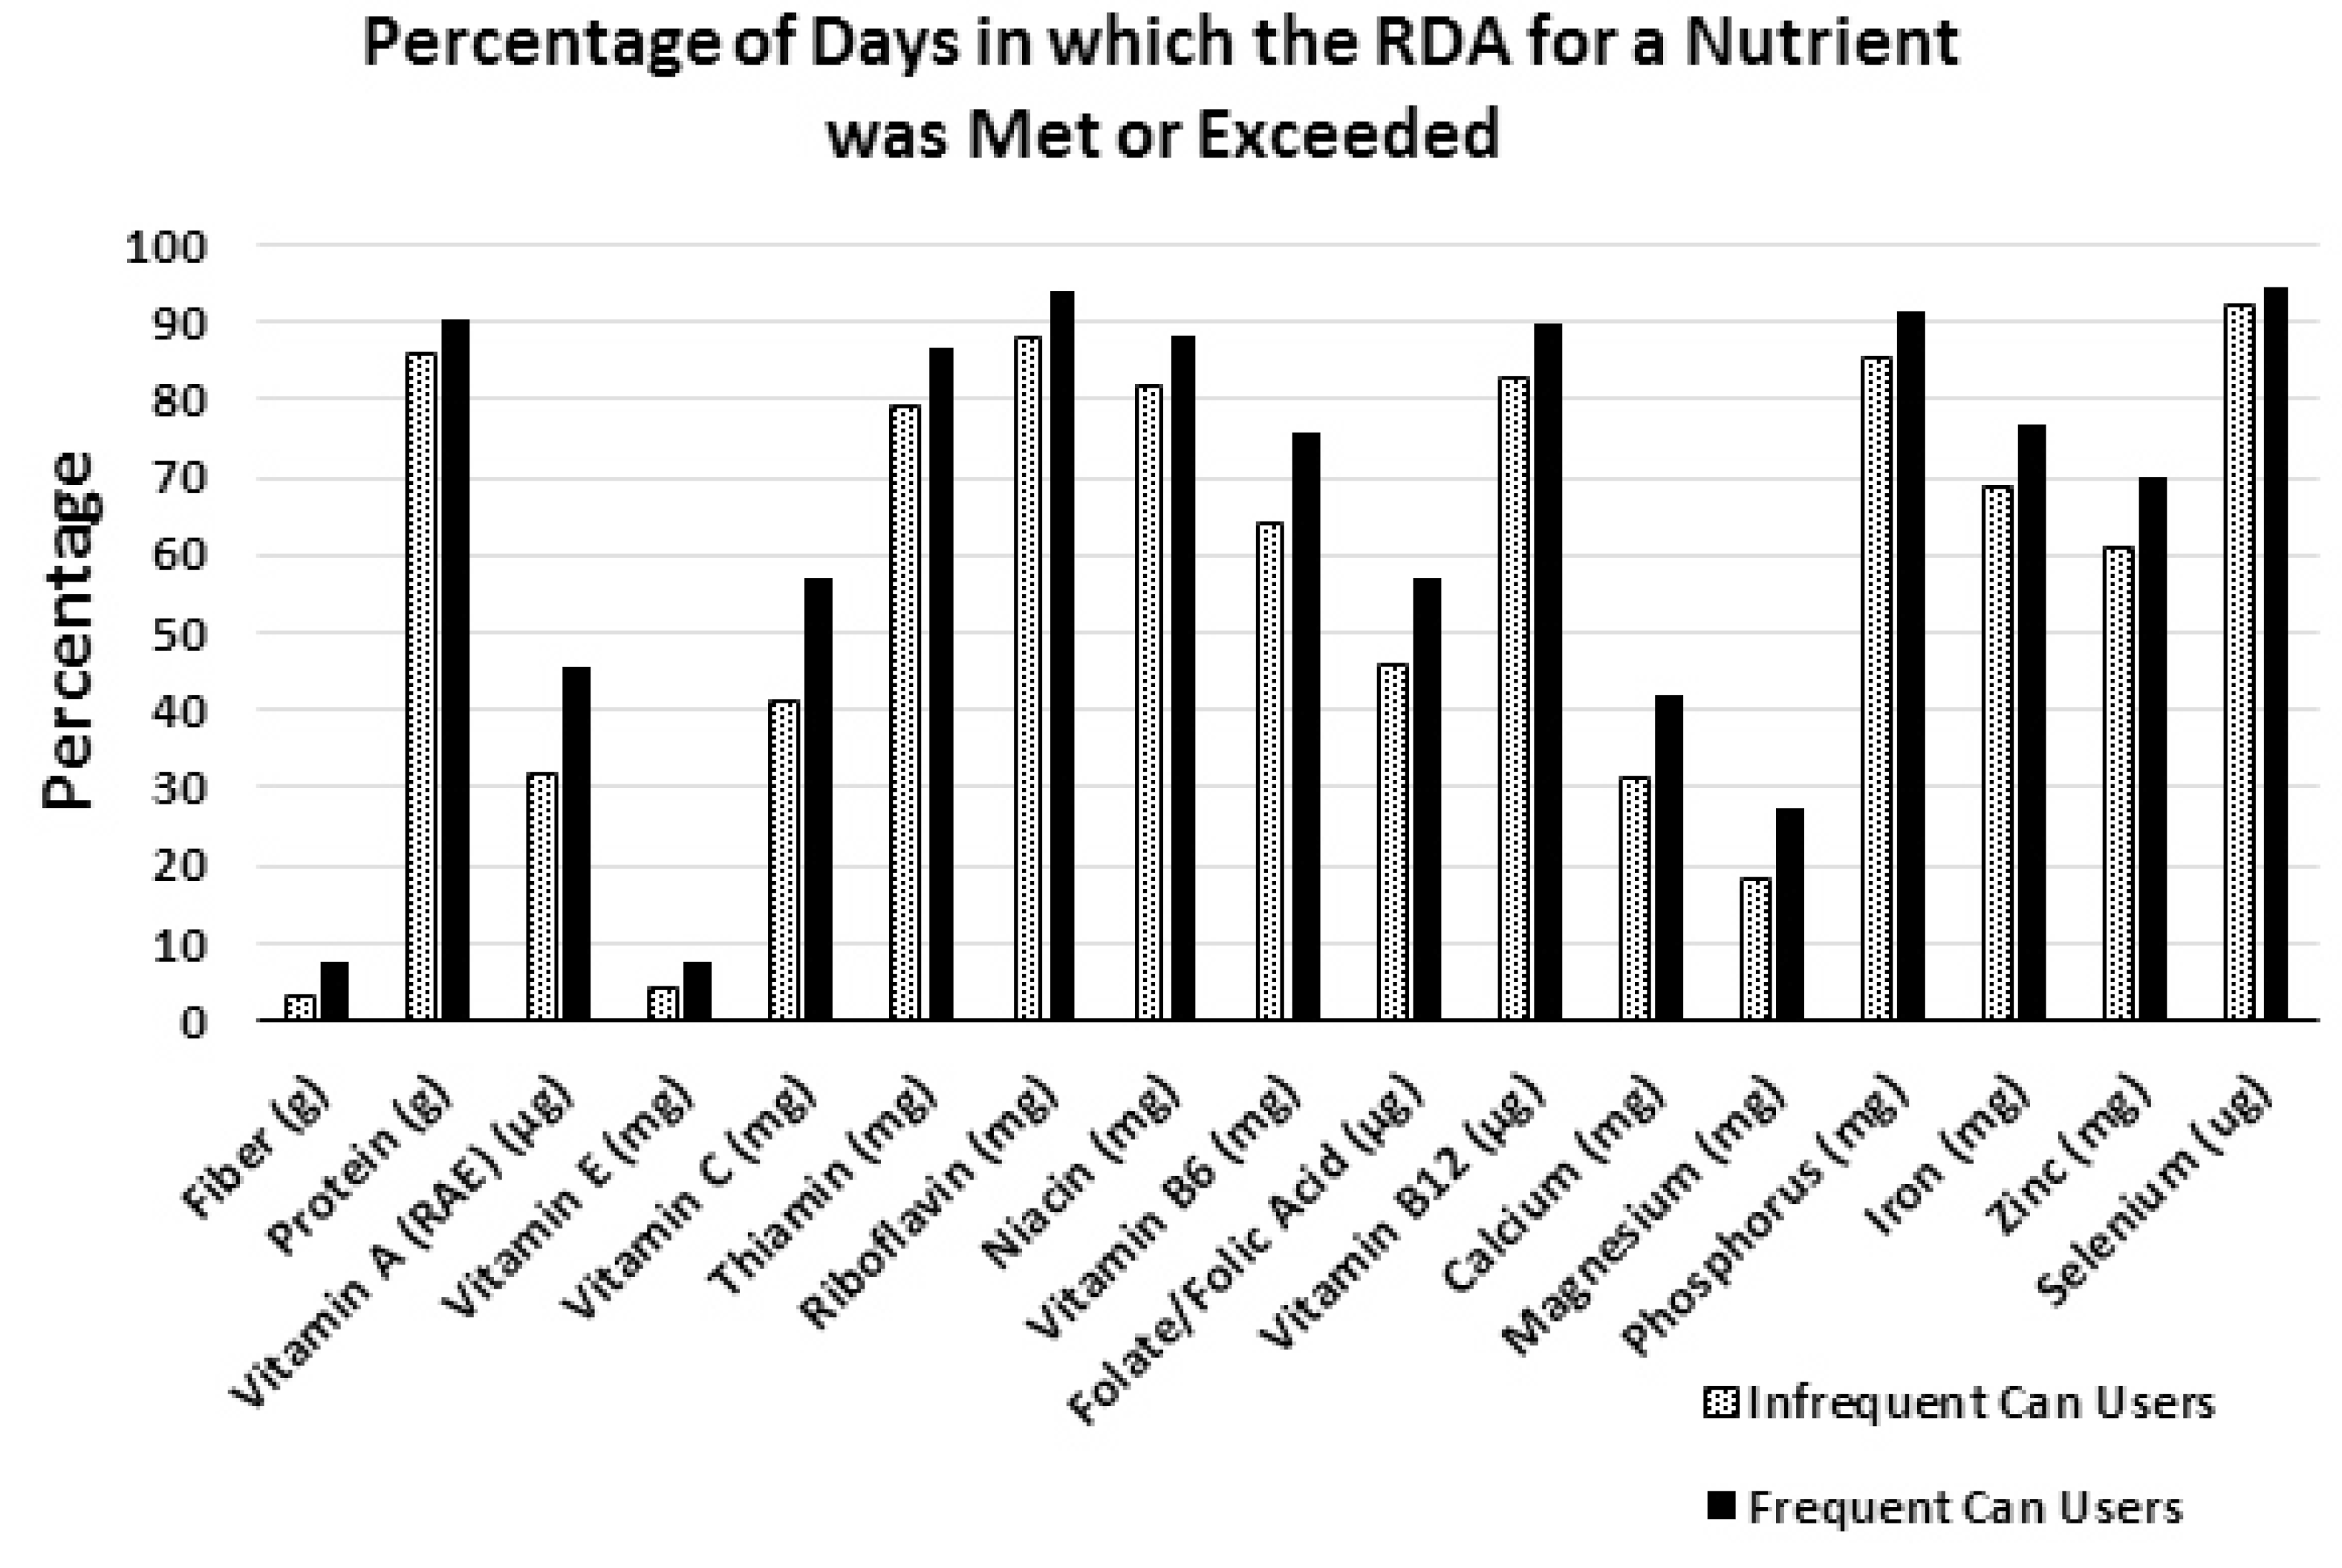
3.4. Canned Food Days vs. Non-Canned Food Days

| (ICU, n = 2732; FCU, n = 2584) | ||||||
|---|---|---|---|---|---|---|
| Variable | % Canned Days that the RDA Was Met or Exceeded | % Non-Canned Days that the RDA Was Met or Exceeded | ||||
| IFU | FCU | p-Value | IFU | FCU | p-Value | |
| Fiber | 3.9 | 9.4 | =0.04 | 3.0 | 5.5 | =0.15 |
| Protein | 86.1 | 91.6 | <0.01 | 85.8 | 89.1 | <0.01 |
| Vitamin A | 31.7 | 48.7 | <0.01 | 31.9 | 41.9 | <0.01 |
| Vitamin E | 3.5 | 7.5 | =0.13 | 4.2 | 7.7 | =0.04 |
| Vitamin C | 41.0 | 58.0 | <0.01 | 41.0 | 56.0 | <0.01 |
| Thiamin | 76.3 | 87.2 | <0.01 | 79.3 | 86.5 | <0.01 |
| Riboflavin | 87.5 | 94.1 | <0.01 | 88.2 | 93.4 | <0.01 |
| Niacin | 80.5 | 89.5 | <0.01 | 82.0 | 87.1 | <0.01 |
| Vitamin B6 | 64.2 | 78.0 | <0.01 | 63.7 | 72.5 | <0.01 |
| Folate | 42.1 | 57.5 | <0.01 | 46.3 | 56.2 | <0.01 |
| Vitamin B12 | 82.5 | 90.2 | <0.01 | 82.7 | 89.1 | <0.01 |
| Calcium | 30.3 | 43.1 | <0.01 | 31.7 | 40.2 | <0.01 |
| Magnesium | 17.6 | 29.3 | <0.01 | 18.2 | 25.4 | <0.01 |
| Phosphorus | 85.7 | 92.0 | <0.01 | 85.5 | 90.1 | <0.01 |
| Iron | 71.0 | 78.4 | <0.01 | 68.5 | 74.7 | <0.01 |
| Zinc | 64.2 | 72.4 | <0.01 | 60.3 | 66.6 | <0.01 |
| Selenium | 91.7 | 94.5 | <0.01 | 92.2 | 94.7 | <0.01 |
4. Discussion
5. Conclusions
Acknowledgments
Conflicts of Interest
References
- Ohlhorst, S.D.; Russell, R.; Bier, D.; Klurfeld, D.M.; Li, Z.; Mein, J.R.; Milner, J.; Ross, A.C.; Stover, P.; Konopka, E. Nutrition research to affect food and a healthy lifespan. Adv. Nutr. 2013, 4, 579–584. [Google Scholar] [CrossRef] [PubMed]
- U.S. Department of Agriculture and U.S. Department of Health and Human Services. Dietary Guidelines for Americans 2010, 7th ed.U.S. Government Printing Office: Washington, DC, USA, 2010.
- Canned Food Alliance. Telephone Survey (Landline and Mobile Numbers) of 1007 American Adults by Caravan(r) Survey, April 4–7 2013. Margin of Error +/− 3.1%; Canned Food Alliance: Pittsburgh, PA, USA, 2013. [Google Scholar]
- Miller, S.R.; Knudson, W.A. Nutrition and cost comparisons of select canned, frozen, and fresh fruits and vegetables. Am. J. Lifestyle Med. 2014. [Google Scholar] [CrossRef]
- Kapica, C.; Weiss, W. Canned fruits, vegetables, beans and fish provide nutrients at a lower cost compared to fresh, frozen or dried. J. Nutr. Food Sci. 2012, 26. [Google Scholar] [CrossRef]
- Rickman, J.C.; Bruhn, C.M.; Barrett, D.M. Nutritional comparison of fresh, frozen, and canned fruits and vegetables—II. Vitamin A and carotenoids, vitamin E, minerals and fiber. J. Sci. Food Agric. 2007, 87, 1185–1196. [Google Scholar] [CrossRef]
- Rickman, J.C.; Barrett, D.M.; Bruhn, C.M. Nutritional comparison of fresh, frozen and canned fruits and vegetables. Part 1. Vitamins C and B and phenolic compounds. J. Sci. Food Agric. 2007, 87, 930–944. [Google Scholar] [CrossRef]
- The NPD Group. National Eating Trends® (NET®) Database, in-Home Individual Database. Available online: http://tools.nccor.org/css/system/69/ (accessed on 26 October 2014).
- Krebs-Smith, S.M.; Guenther, P.M.; Subar, A.F.; Kirkpatrick, S.I.; Dodd, K.W. Americans do not meet federal dietary recommendations. J. Nutr. 2010, 140, 1832–1838. [Google Scholar] [CrossRef] [PubMed]
- NCI Applied Research. Cancer Control and Population Sciences. Usual Dietary Intakes: Food Intakes, US Population, 2001–04. Available online: http://appliedresearch.cancer.gov/diet/usualintakes/pop/2001-04/index.html (accessed on 26 October 2014).
- U.S. Department of Agriculture (USDA) Food and Nutrition Service, Office of Research and Analysis. Building a Healthy America: A Profile of the Supplemental Nutrition Assistance Program; U.S. Department of Agriculture: Washington, DC, USA, 2014. [Google Scholar]
- Nguyen, B.T.; Shuval, K.; Njike, V.Y.; Katz, D.L. The supplemental nutrition assistance program and dietary quality among us adults: Findings from a nationally representative survey. Mayo Clin. Proc. 2014, 89, 1211–1219. [Google Scholar] [CrossRef] [PubMed]
- USDA. Agricultural marketing service: Food deserts. Available online: http://apps.ams.usda.gov/fooddeserts/fooddeserts.aspx (accessed on 26 October 2014).
- USDA Women, infants and children (WIC). WIC food packages—Regulatory requirements for WIC-eligible foods. Available online: http://www.fns.usda.gov/wic/wic-food-packages-regulatory-requirements-wic-eligible-foods (accessed on 6 October 2014).
- Wolfe, D.; Pipes, D.; Lucas, B. I’m ready! Feeding family foods to your baby. Availale online: http://www.nal.usda.gov/wicworks/Sharing_Center/WA/intro_foods.pdf (accessed on 6 October 2014).
- Center of Disease Control and Prevention (CDC). Top 10 Sources of Sodium. Available online: http://www.cdc.gov/salt/sources.htm (accessed on 6 October 2014).
- Duyff, R.L.; Mout, J.R.; Jones, J.B. Sodium reduction in canned beans after draining, rinsing. J. Culin. Sci. Technol. 2011, 9, 106–112. [Google Scholar] [CrossRef]
- Zhang, Z.; Cogswell, M.E.; Gillespie, C.; Fang, J.; Loustalot, F.; Dai, S.; Carriquiry, A.L.; Kuklina, E.V.; Hong, Y.; Merritt, R.; et al. Association between usual sodium and potassium intake and blood pressure and hypertension among U.S. adults: NHANES 2005–2010. PLoS ONE 2013, 8, e75289. [Google Scholar] [CrossRef] [PubMed]
- Cook, N.R.; Obarzanek, E.; Cutler, J.A.; Buring, J.E.; Rexrode, K.M.; Kumanyika, S.K.; Appel, L.J.; Whelton, P.K. Trials of Hypertension Prevention Collaborative Research Group. Joint effects of sodium and potassium intake on subsequent cardiovascular disease: The Trials of Hypertension Prevention follow-up study. Arch. Intern. Med. 2009, 169, 32–40. [Google Scholar] [CrossRef] [PubMed]
- Rodrigues, S.L.; Baldo, M.P.; Machado, R.C.; Forechi, L.; Molina Mdel, C.; Mill, J.G. High potassium intake blunts the effect of elevated sodium intake on blood pressure levels. J. Am. Soc. Hypertens. JASH 2014, 8, 232–238. [Google Scholar] [CrossRef] [PubMed]
- Durst, R.W.; Weaver, G.W. Nutritional content of fresh and canned peaches. J. Sci. Food Agric. 2013, 93, 593–603. [Google Scholar] [CrossRef] [PubMed]
- Pedrosa, M.M.; Cuadrado, C.; Burbano, C.; Muzquiz, M.; Cabellos, B.; Olmedilla-Alonso, B.; Asensio-Vegas, C. Effects of industrial canning on the proximate composition, bioactive compounds contents and nutritional profile of two Spanish common dry beans (phaseolus vulgaris L.). Food Chem. 2015, 166, 68–75. [Google Scholar] [CrossRef] [PubMed]
- Dewanto, V.; Wu, X.; Adom, K.K.; Liu, R.H. Thermal processing enhances the nutritional value of tomatoes by increasing total antioxidant activity. J. Agric. Food Chem. 2002, 50, 3010–3014. [Google Scholar] [CrossRef] [PubMed]
- Hunter, K.J.; Fletcher, J.M. The antioxidant activity and composition of fresh, frozen, jarred and canned vegetables. Innov. Food Sci. Emerg. Technol. 2002, 3, 399–406. [Google Scholar] [CrossRef]
- Lessin, W.J.; Catigani, G.L.; Schwartz, S.J. Quantification of cis-trans isomers of provitamin A carotenoids in fresh and processed fruits and vegetables. J. Agric. Food Chem. 1997, 45, 3728–3732. [Google Scholar] [CrossRef]
© 2015 by the authors; licensee MDPI, Basel, Switzerland. This article is an open access article distributed under the terms and conditions of the Creative Commons Attribution license (http://creativecommons.org/licenses/by/4.0/).
Share and Cite
Comerford, K.B. Frequent Canned Food Use is Positively Associated with Nutrient-Dense Food Group Consumption and Higher Nutrient Intakes in US Children and Adults. Nutrients 2015, 7, 5586-5600. https://doi.org/10.3390/nu7075240
Comerford KB. Frequent Canned Food Use is Positively Associated with Nutrient-Dense Food Group Consumption and Higher Nutrient Intakes in US Children and Adults. Nutrients. 2015; 7(7):5586-5600. https://doi.org/10.3390/nu7075240
Chicago/Turabian StyleComerford, Kevin B. 2015. "Frequent Canned Food Use is Positively Associated with Nutrient-Dense Food Group Consumption and Higher Nutrient Intakes in US Children and Adults" Nutrients 7, no. 7: 5586-5600. https://doi.org/10.3390/nu7075240
APA StyleComerford, K. B. (2015). Frequent Canned Food Use is Positively Associated with Nutrient-Dense Food Group Consumption and Higher Nutrient Intakes in US Children and Adults. Nutrients, 7(7), 5586-5600. https://doi.org/10.3390/nu7075240