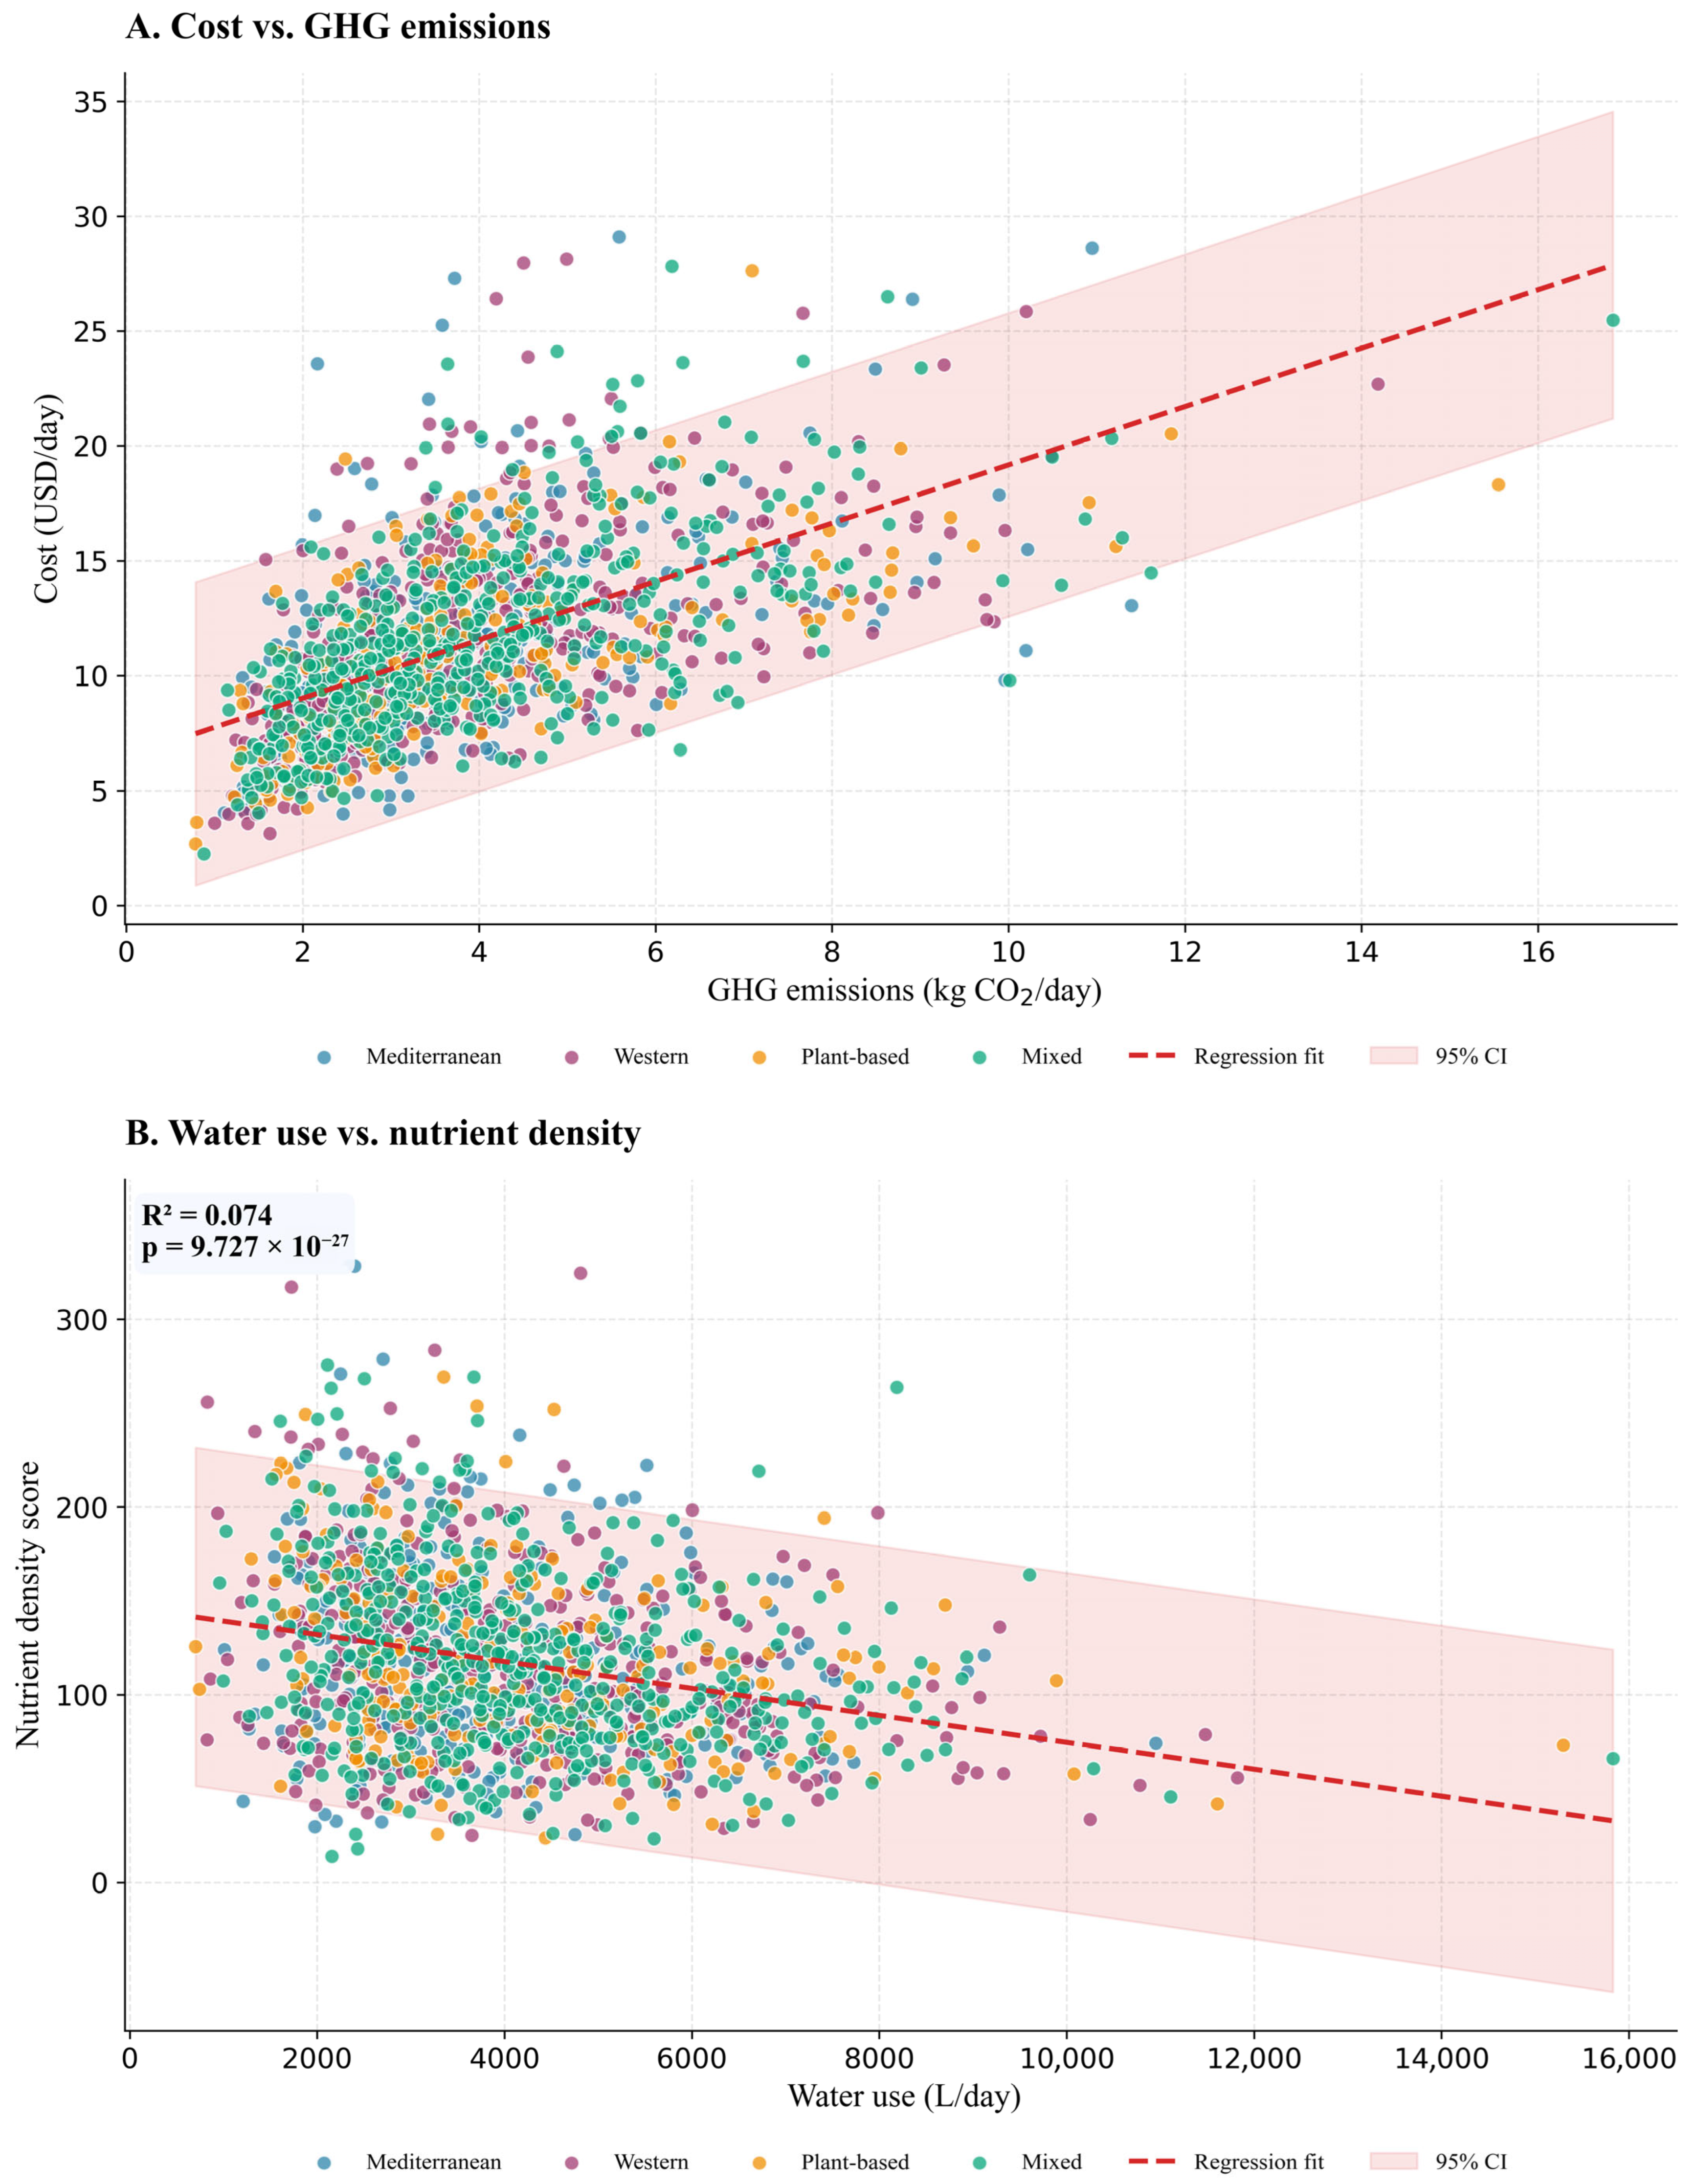
3.1. Simulated Dietary Pattern Characterization and Baseline Assessment
Four dietary patterns emerged from random forest classification: Mediterranean (
n = 375), Western (
n = 375), Plant-based (
n = 375), and Mixed (
n = 375). Baseline characterization reveals substantial heterogeneity across sociodemographic profiles (
Table 2) and multi-dimensional sustainability metrics (
Figure 2 and
Figure 3), establishing the foundational dataset for subsequent machine learning analysis.
Sociodemographic and anthropometric profiles stratified by dietary pattern reveal pronounced heterogeneity underscoring complex interplay between individual characteristics and food choice architectures (
Table 2). Age distributions exhibit statistically significant variation (
), with Plant-based adherents averaging 45.8
11.6 years compared to Western pattern followers at 38.7
14.2 years, constituting a 7.1-year differential that may reflect cohort-specific health consciousness or environmental awareness emerging in older age brackets. Mediterranean and Mixed patterns occupy intermediate positions (42.5 and 40.2 years respectively), suggesting traditional dietary architectures attract middle-aged demographics. Sex composition demonstrates remarkable homogeneity (
), ranging narrowly from 48.9% female (Western) to 56.2% (Plant-based), indicating dietary pattern selection operates largely independently of biological sex.
Body mass index disparities prove substantial and statistically robust (). Western patterns associate with mean BMI of 27.3 4.8 kg/m2 approaching overweight classification threshold, while Plant-based consumers register mean BMI of 23.1 3.2 kg/m2, representing 4.2 kg/m2 lower value. For an individual measuring 1.70 m, this translates to approximately 12 kg body weight differential. Mediterranean (24.8 kg/m2) and Mixed (25.6 kg/m2) patterns occupy intermediate positions, aligning with epidemiological evidence linking plant-forward dietary compositions with favorable adiposity profiles.
Socioeconomic indicators reveal systematic gradients: income quintiles span 2.8 1.3 (Western) to 3.5 1.3 (Plant-based), while tertiary education prevalence ranges 32.7% (Western) to 58.4% (Plant-based), representing 78% relative increase (). This educational disparity suggests nutrition literacy, environmental awareness, and economic capacity for premium food purchases jointly enable adoption of plant-centric dietary architectures, consistent with social ecological models positioning dietary behavior at the nexus of individual agency and structural determinants. The convergence of elevated age, education, and income among Plant-based adherents, coupled with reduced BMI, indicates this dietary pattern concentrates among health-conscious, socioeconomically advantaged demographics. Conversely, Western dietary patterns predominate among younger, lower-educated populations with higher adiposity, illuminating sociodemographic fault lines structuring contemporary dietary landscapes and emphasizing imperatives for equitable nutrition policy interventions.
Baseline dietary pattern characterization establishes descriptive statistics across nutritional and environmental dimensions (
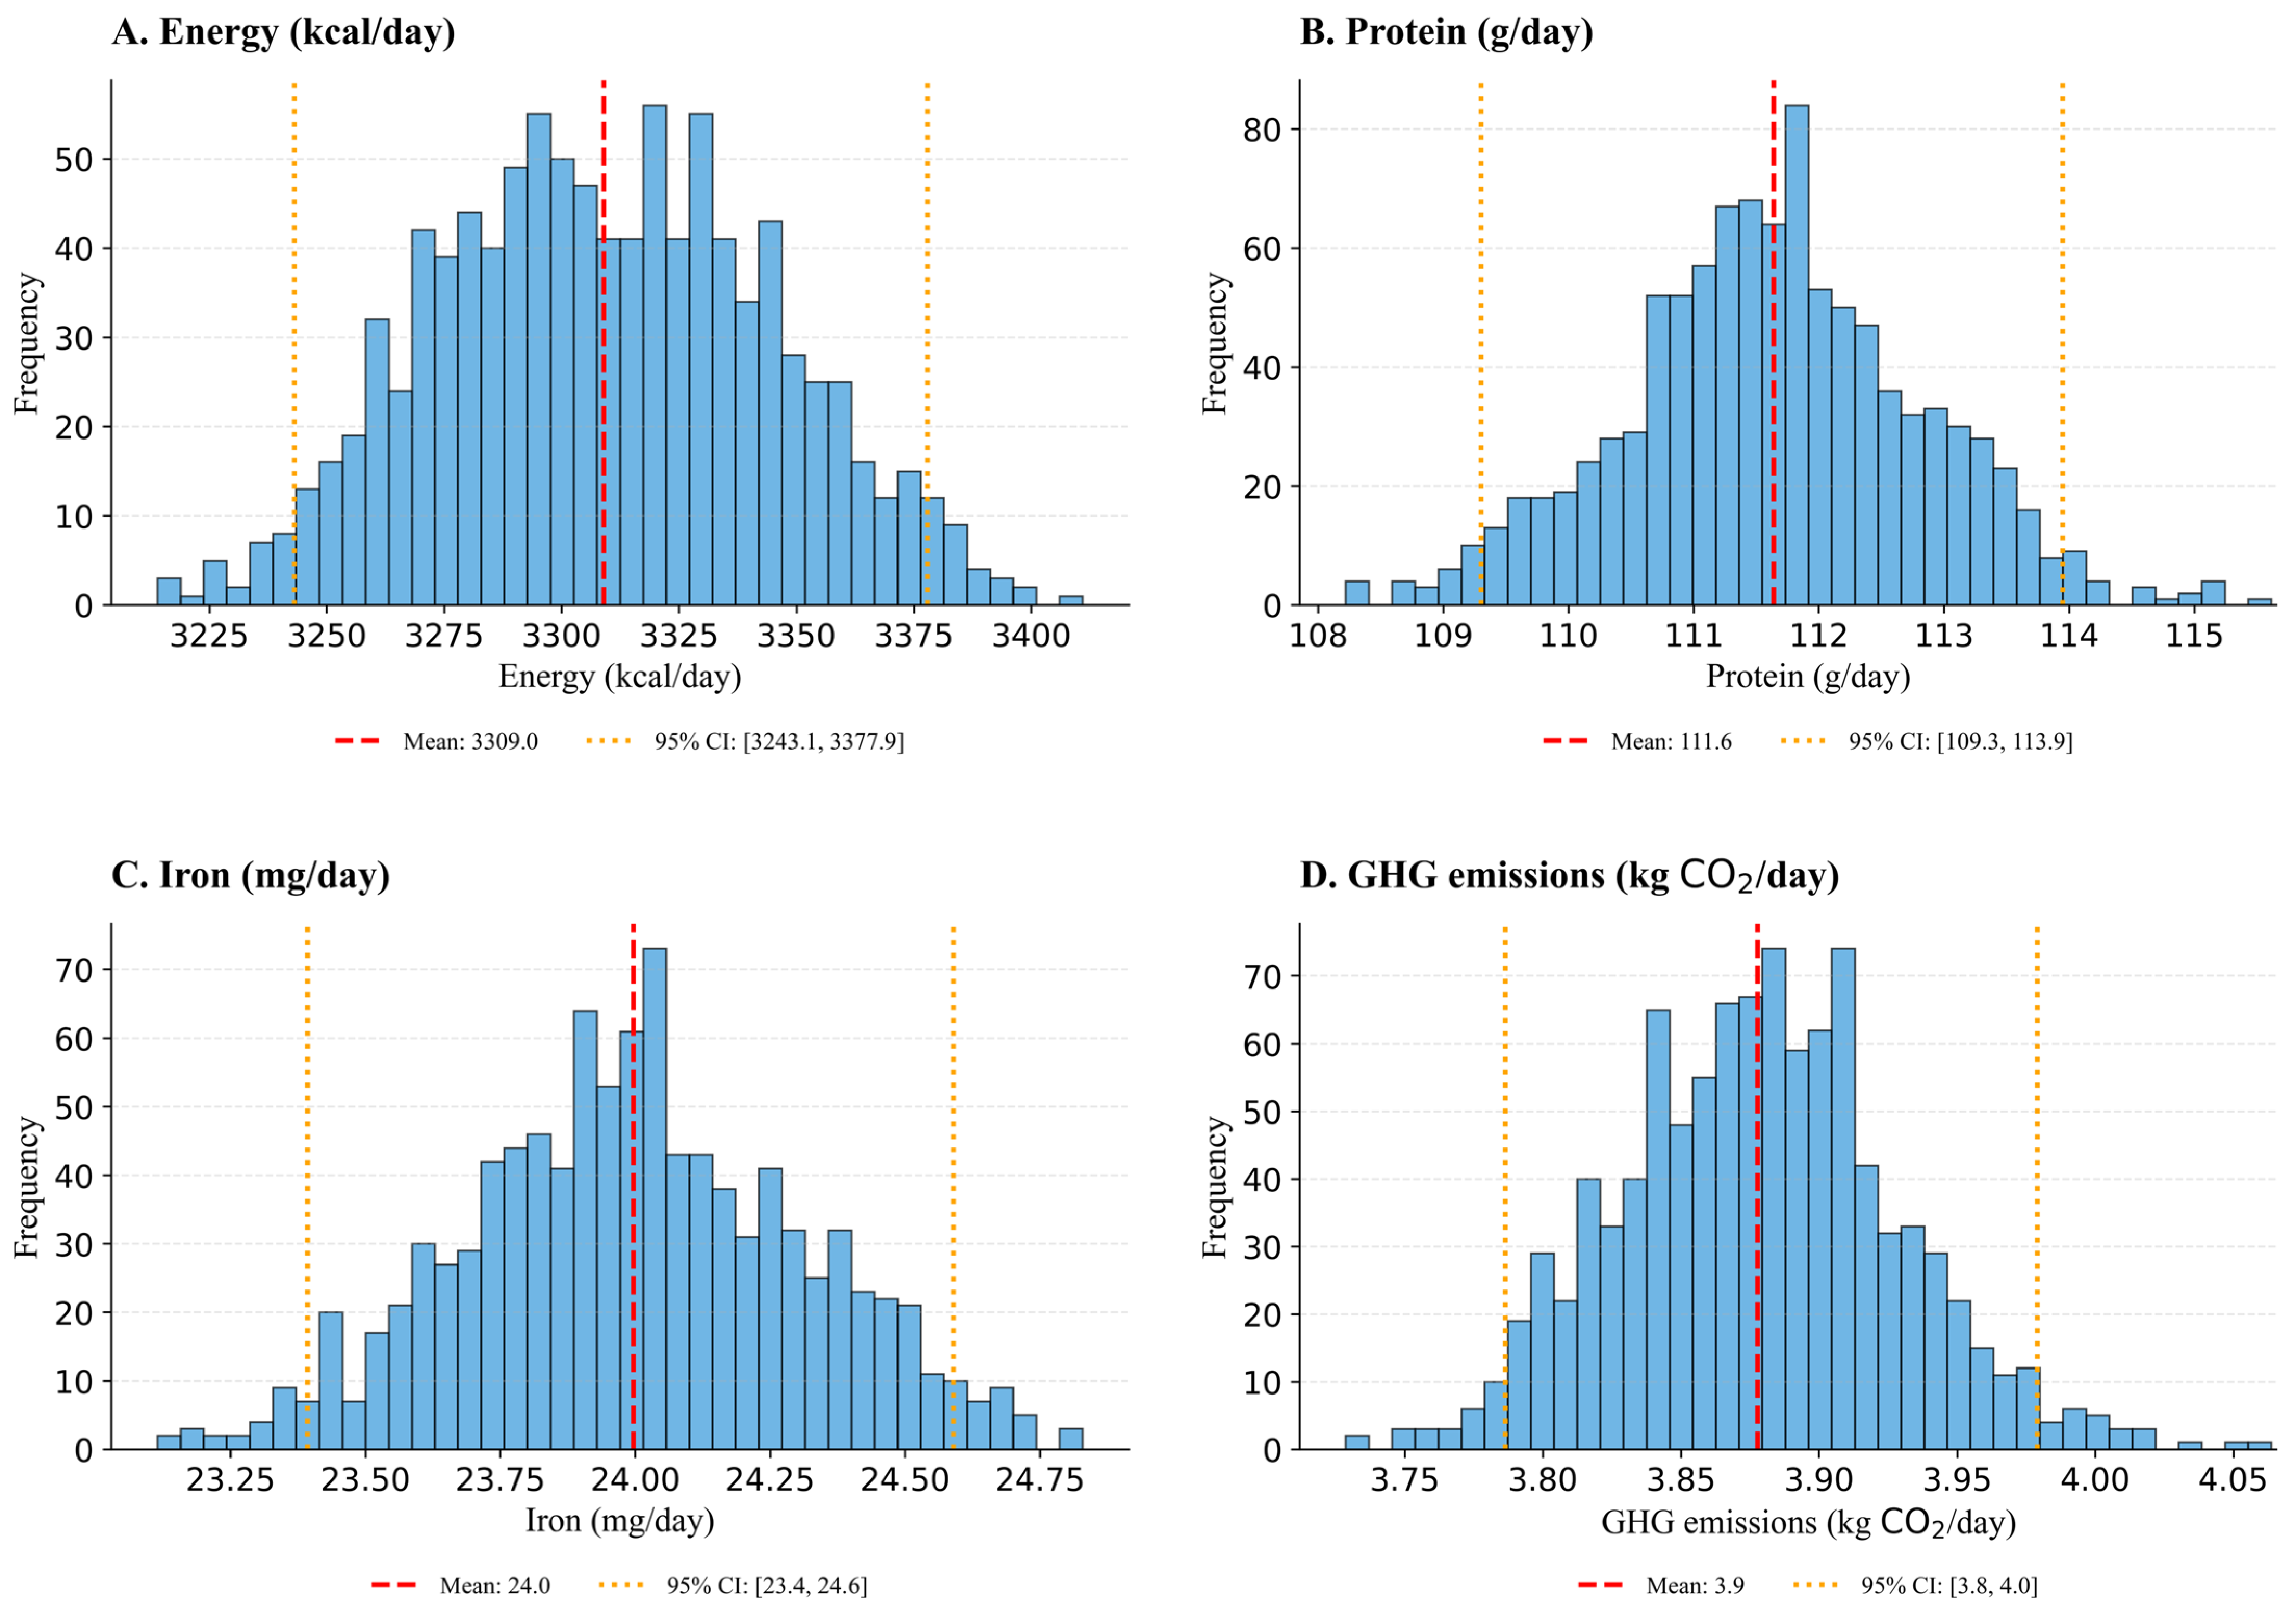
Table 2), yet point estimates alone inadequately convey estimation uncertainty inherent in simulation-based methodologies. Bootstrap resampling with 1000 iterations quantifies precision and stability of population-level dietary intake and environmental footprint estimates (
Table 3).
Bootstrap uncertainty quantification reveals narrow confidence intervals across all metrics, validating simulation precision. Energy intake spans 3244 to 3379 kcal/day (coefficient of variation 1.1%), while protein ranges 109.2 to 114.1 g/day (coefficient of variation 1.2%). Micronutrient estimates demonstrate comparable precision: iron spans 23.4 to 24.6 mg/day and calcium spans 876.3 to 936.5 mg/day. Environmental footprints exhibit particularly low uncertainty, with greenhouse gas emissions spanning 3.78 to 3.98 kg CO2e/day (2.6% of mean) and water consumption spanning 4011 to 4197 L/day (4.5% of mean). These narrow bootstrap confidence intervals establish reliability of population-level inferences derived from the simulation framework, with coefficients of variation below 2 percent for all metrics confirming adequate sample size and estimation stability.
Bootstrap confidence intervals (
Table 3) confirm stable population-level estimates with narrow uncertainty ranges, establishing confidence in simulation precision. Building upon this foundation,
Table 4 examines nutritional composition, environmental footprints, and dietary quality indicators stratified by dietary pattern to evaluate macronutrient convergence and micronutrient adequacy profiles.
The nutritional composition, environmental sustainability, and economic accessibility profiles stratified by dietary pattern reveal remarkable convergence across macronutrient and resource metrics despite categorical differences in food group emphasis. Energy intake demonstrates minimal inter-pattern variability, spanning a narrow 191 kcal/day range from Mediterranean (3168 ± 1303 kcal/day) to Mixed patterns (3359 ± 1356 kcal/day), representing merely 6% differential and indicating that caloric adequacy remains stable irrespective of dietary architecture. Protein provisioning exhibits analogous homogeneity, with values clustering between 108.8 g/day (Mediterranean) and 112.8 g/day (Western), constituting less than 4% variation and substantially exceeding the 0.8 g/kg/day recommended dietary allowance for adults. Iron intake converges tightly across patterns (23.8–24.2 mg/day), surpassing the 8–18 mg/day Estimated Average Requirement thresholds, though this aggregate adequacy masks critical bioavailability distinctions between heme and non-heme iron sources that merit granular investigation.
Calcium intake reveals systematic inadequacy, with Mediterranean patterns achieving the highest provisioning (915.4 ± 635.0 mg/day) yet remaining 8.5% below the 1000 mg/day adult requirement, while Western patterns exhibit the most pronounced deficiency (867.0 ± 578.9 mg/day), representing a 13% shortfall that portends skeletal health risks. Zinc adequacy approximates recommended intakes (16.3–17.0 mg/day), though elevated standard deviations (6.9–7.4 mg/day) signal substantial within-pattern heterogeneity. Micronutrient deficiencies prove most alarming for vitamin D (4.2–5.1 μg/day) and B12 (3.3–3.7 μg/day), with all patterns achieving merely 21–26% and 55–61% of respective 20 μg/day and 6 μg/day recommendations, underscoring pervasive insufficiencies transcending dietary classification.
Environmental footprints demonstrate unexpected homogeneity, with greenhouse gas emissions spanning a mere 6% range (3.73–3.96 kg CO
2e/day) and water consumption varying by 8% (3849–4175 L/day), challenging assumptions that plant-centric patterns universally deliver superior sustainability outcomes. Economic costs converge tightly (11.10–11.54 USD/day), while dietary diversity scores exhibit near-identical values (11.0–11.2), indicating that food variety remains stable across patterns. Bootstrap uncertainty quantification (
Figure A1,
Appendix A) demonstrates robust estimation stability via 1000 resampling iterations (Equations (22) and (23)). These convergent profiles suggest that contemporary dietary patterns, despite categorical distinctions, operate within constrained nutritional and sustainability envelopes shaped by industrial food systems, necessitating AI-guided optimization to achieve differentiated health and environmental outcomes.
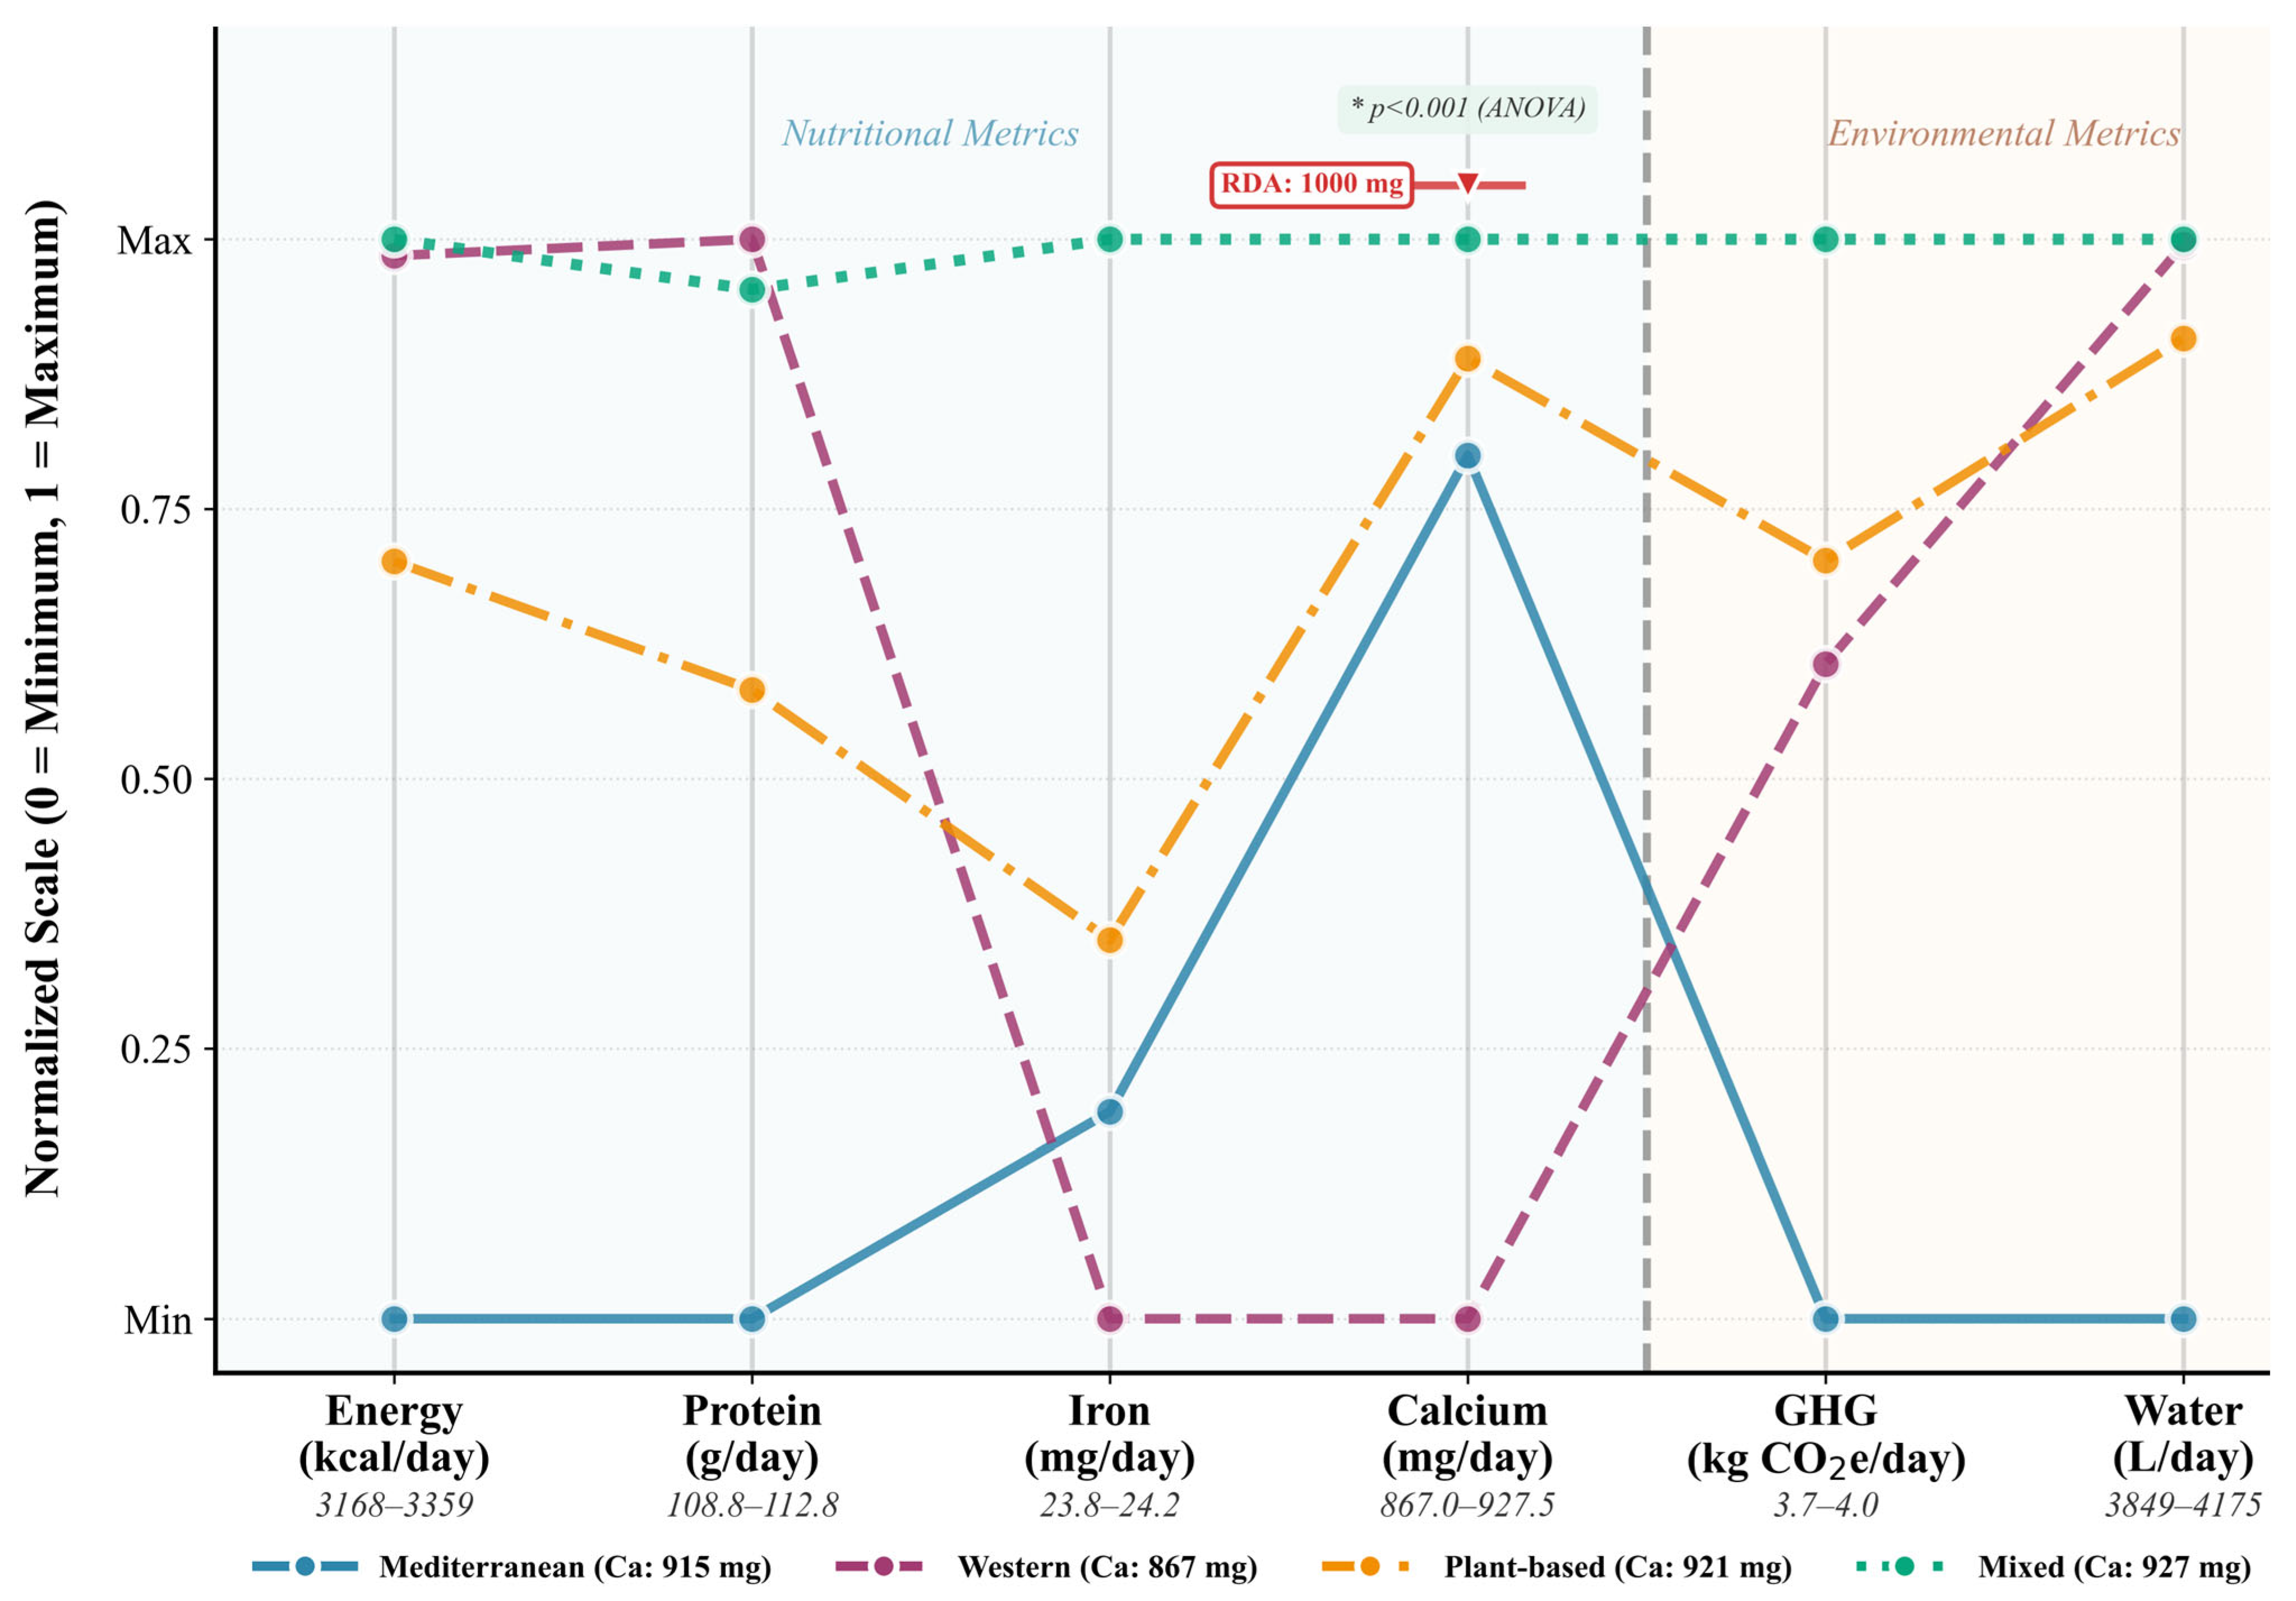
To visualize these multi-dimensional trade-offs across dietary patterns (
Figure 2), nutritional and environmental metrics were normalized using the scaling procedures defined in Equations (18) and (19), enabling direct comparison of disparate indicators on a common zero-to-one scale.
The multi-dimensional visualization in
Figure 2 delineates normalized profiles of four dietary patterns. These are Mediterranean, Western, Plant-based, and Mixed. The profiles are across six critical metrics. These metrics span nutritional composition and environmental re-source intensity. Each vertical axis represents a distinct dimension scaled from 0 (minimum) to 1 (maximum), with connecting lines tracing pattern-specific trajectories through feature space. A dashed vertical separator demarcates the transition between nutritional metrics (left panel: light blue semi-transparent background) and environmental metrics (right panel: warm beige semi-transparent background). The nutritional domain encompasses energy intake (3168–3359 kcal/day), protein provisioning (108.8–112.8 g/day), iron density (23.8–24.2 mg/day), and calcium availability (867–927.5 mg/day). The environmental domain captures greenhouse gas emissions (3.7–4.0 kg CO
2e/day) and water consumption (3849–4175 L/day).
Macronutrient convergence emerges as the predominant pattern, with energy and protein trajectories clustering tightly near maximum normalized values across all dietary architectures. Inter-pattern variance remains below 6% for energy and 4% for protein despite categorical distinctions in food group composition, demonstrating that diverse dietary configurations achieve comparable caloric and protein sufficiency when appropriately structured. This homogeneity challenges assumptions that plant-centric patterns necessarily compromise macronutrient adequacy. Iron intake exhibits tight clustering within 23.8–24.2 mg/day (<2% variation), generating near-overlapping normalized trajectories that reflect either uniform fortification practices or compensatory dietary behaviors, though this aggregate adequacy masks critical bioavailability differentials between heme and non-heme sources requiring disaggregated analysis.
Calcium provisioning reveals the most noticeable nutritional divergence, with one-way ANOVA confirming statistically significant differences across patterns (p < 0.001). The red horizontal reference line with downward triangle marker denotes the 1000 mg/day Recommended Dietary Allowance (RDA) for adults, positioned above all observed pattern trajectories to emphasize universal inadequacy. Mediterranean demonstrates highest calcium adequacy (normalized value 0.80, corresponding to 915 mg/day or 91.5% of RDA), while Western exhibits the most pronounced deficiency (normalized value near minimum, representing 867 mg/day or 86.7% of RDA). Plant-based (921 mg, 92.1% of RDA) and Mixed (927 mg, 92.8% of RDA) occupy intermediate positions yet remain 7–13% below the adult requirement. A systemic calcium shortfall is evident across all patterns; despite only a 60 mg difference separating them, none meet the RDA threshold. Addressing this provisioning deficit necessitates targeted fortification or supplementation strategies regardless of dietary classification.
Environmental metrics demonstrate unexpected homogeneity, with greenhouse gas emissions ranging from 3.7 to 4.0 kg CO2e/day (8% relative variation) and water consumption varying by 326 L/day (8% range: 3849–4175 L/day). This constrained environmental differentiation challenges simplistic narratives equating plant-based diets with uniformly higher sustainability outcomes. The Mediterranean pattern’s lowest emissions (3.7 kg CO2e/day) and Mixed pattern’s highest (4.0 kg CO2e/day) span merely 0.3 kg CO2e/day absolute difference, suggesting that within high-consumption populations, dietary pattern classifications exert less influence on resource intensity than absolute consumption levels or within-pattern food selection. Water consumption trajectories exhibit parallel convergence, with all patterns clustering within 8% of the mean (4012 L/day), reinforcing the assumption that contemporary dietary architectures operate within constrained sustainability envelopes shaped by industrialized food systems. This visualization demonstrates a critical gap that necessitates AI-guided optimization algorithms. This gap is the ability to navigate complex multi-objective trade-off surfaces. These algorithms are essential for finding solutions that jointly optimize nutritional adequacy, environmental sustainability, and economic accessibility, a task beyond the collective capability of conventional dietary pattern classifications.
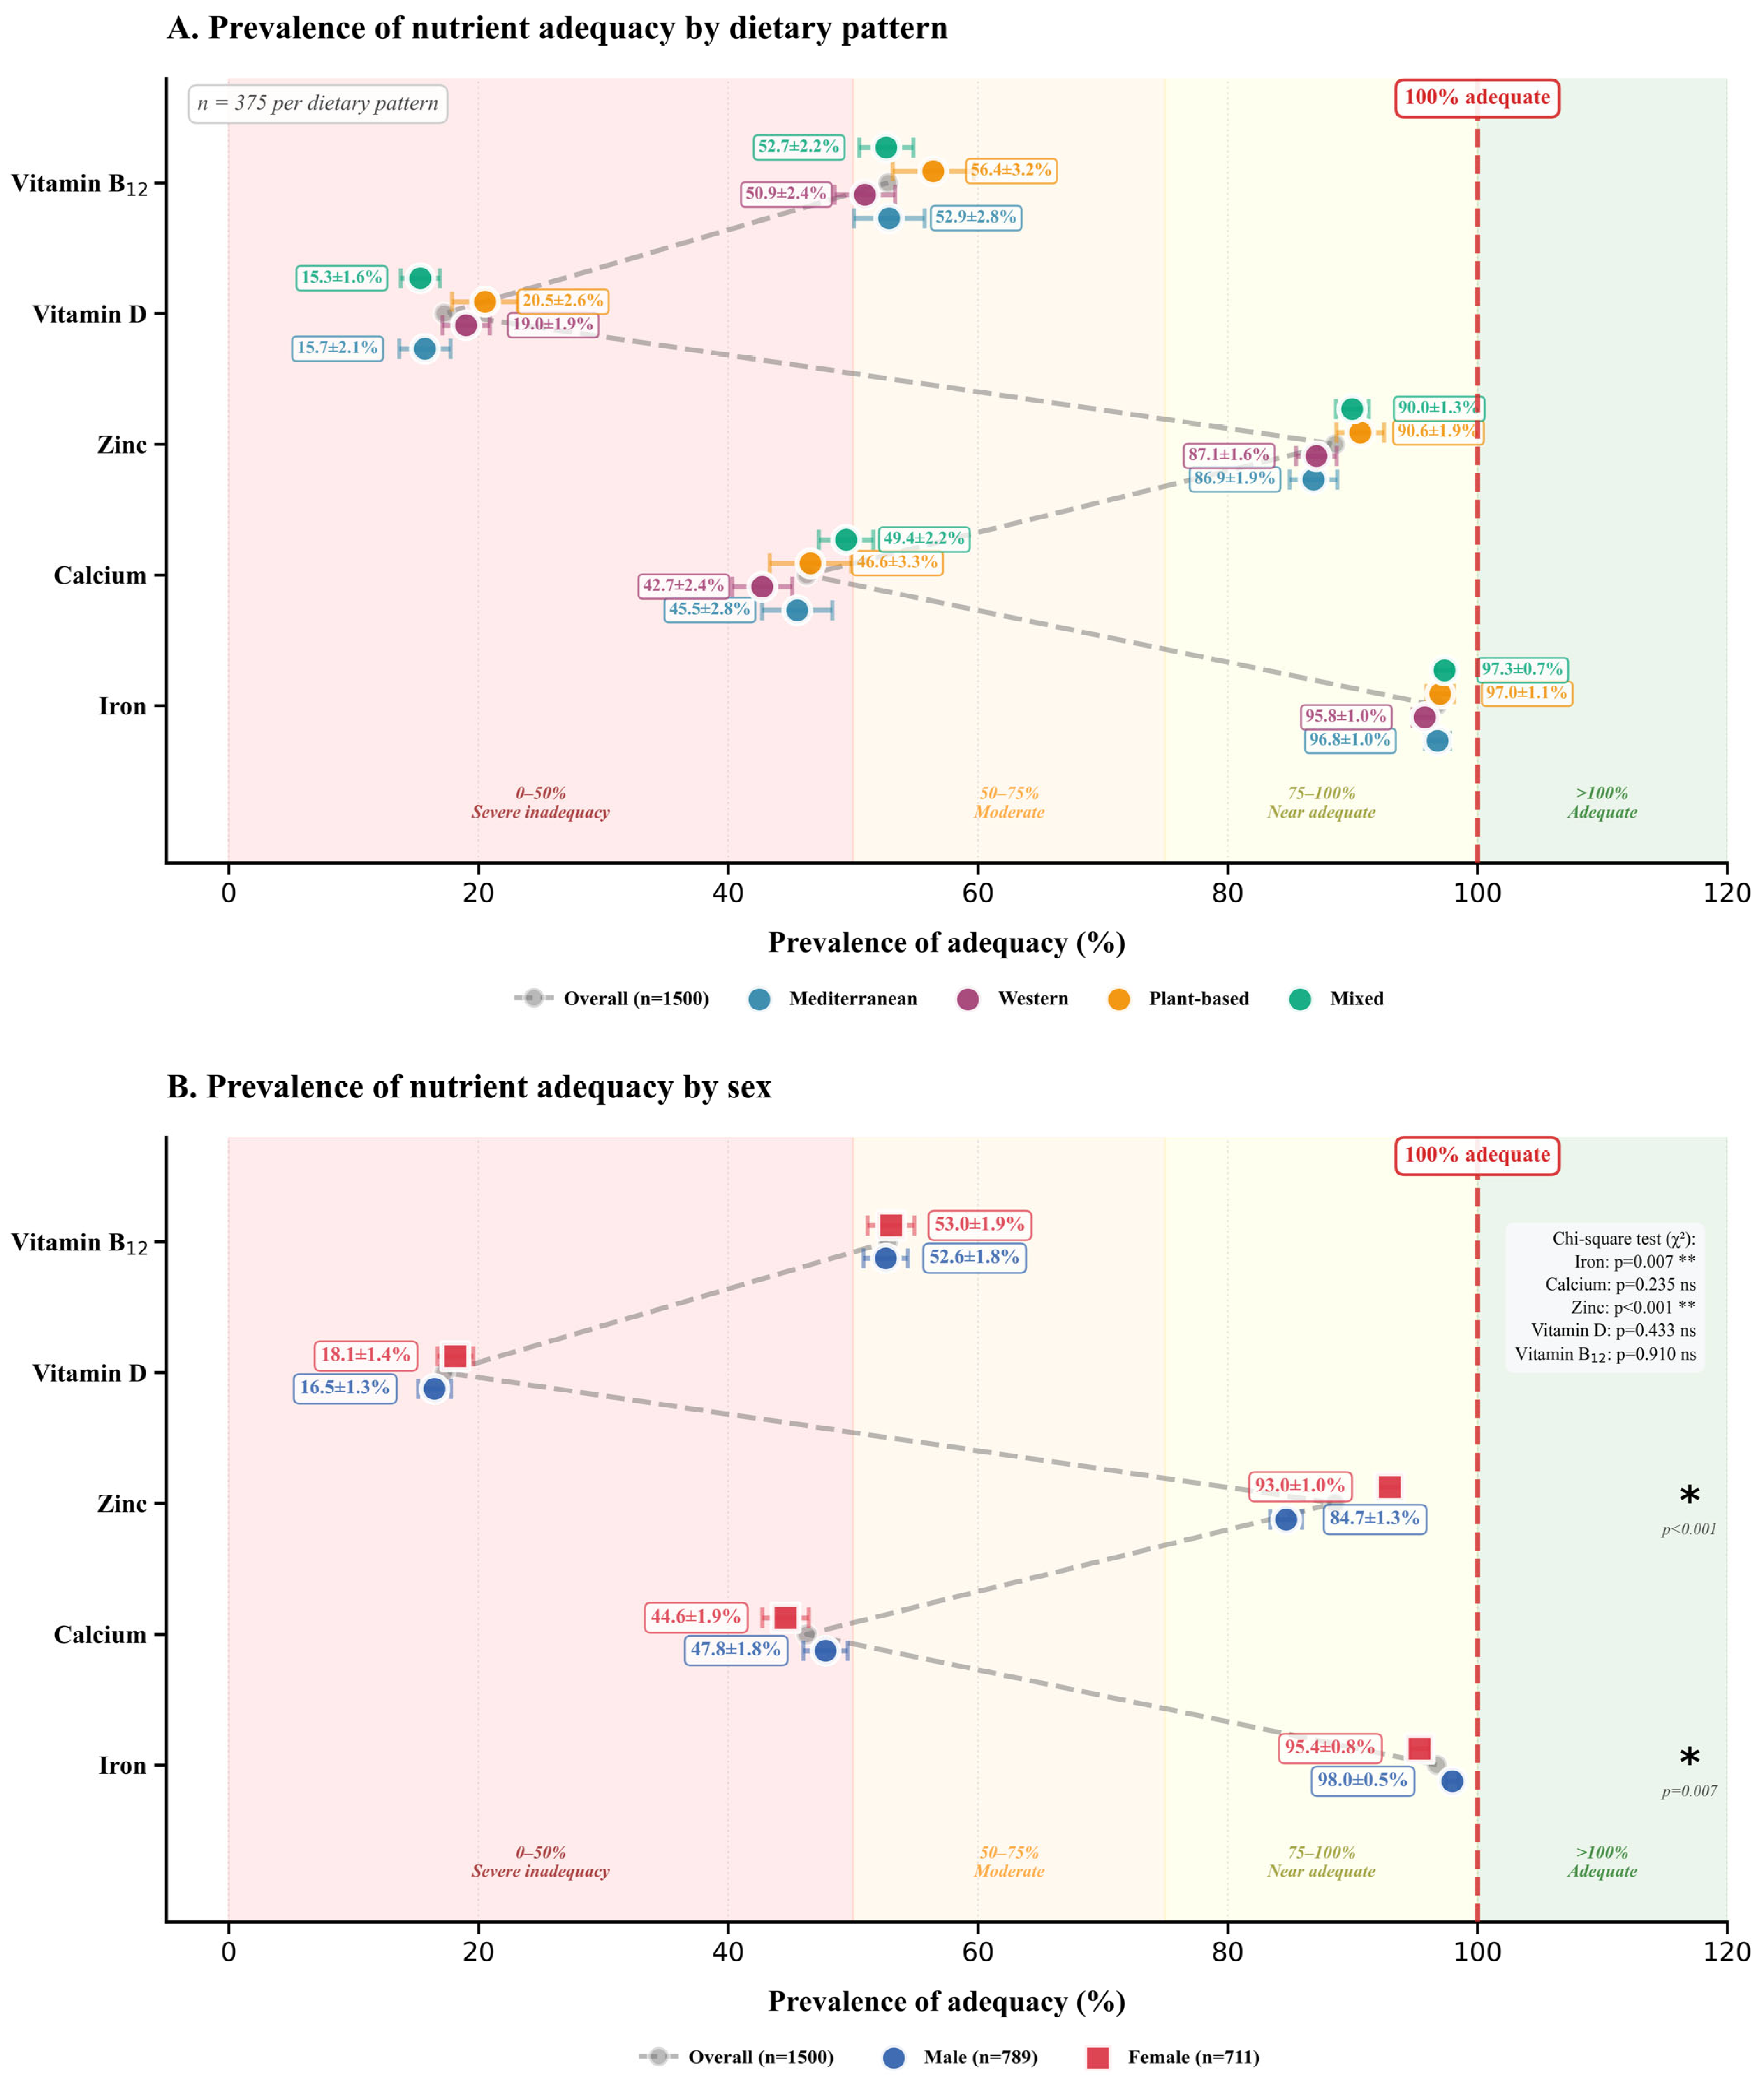
Beyond aggregate intake values, population-level micronutrient adequacy (
Figure 3) requires binary classification against dietary reference standards, with prevalence rates calculated via Equation (20) to quantify the proportion of individuals meeting or exceeding nutritional requirements.
Figure 3 elucidates micronutrient adequacy prevalence across stratified dietary patterns and biological sex, revealing profound disparities in population-level nutritional sufficiency. To facilitate rapid visual assessment of nutrient provisioning gaps, adequacy thresholds are stratified by soft color-coded background zones: pale rose (0–50%) indicating severe inadequacy, peach/beige (50–75%) moderate insufficiency, pale yellow (75–100%) near adequacy, and pale mint green (>100%) optimal sufficiency. All zones use semi-transparent shading to maintain data point visibility while providing intuitive adequacy classification. Panel A disaggregates adequacy rates for five critical micronutrients (iron, calcium, zinc, vitamin D, and vitamin B
12) across Mediterranean, Western, Plant-based, and Mixed dietary architectures, while Panel B delineates sex-specific adequacy differentials reflecting divergent metabolic demands and absorption efficiencies. The gray dashed reference line represents overall population adequacy (
n = 1500), providing a benchmark against which pattern-specific and sex-specific deviations can be assessed.
Iron adequacy demonstrates near-universal sufficiency, with prevalence rates exceeding 95% across all patterns: Mediterranean (96.8 ± 1.0%), Western (95.8 ± 1.0%), Plant-based (97.0 ± 1.1%), and Mixed (97.3 ± 0.7%). These convergent outcomes suggest that total iron intake remains adequate across diverse food matrices, although distinctions between heme and non-heme iron bioavailability warrant granular investigation beyond prevalence metrics alone. Conversely, calcium adequacy exposes systematic deficiencies, with prevalence ranging from 42.7% to 49.4%. The dietary patterns are categorized as follows: Mediterranean (45.5 ± 2.8%), Western (42.7 ± 2.4%), Plant-based (46.6 ± 3.3%), and Mixed (49.4 ± 2.2%). This pervasive insufficiency transcends dietary classification, implicating structural inadequacies in contemporary food systems that necessitate fortification interventions or dietary modification strategies targeting calcium-dense food groups.
Zinc adequacy exhibits intermediate prevalence, ranging from 86.9 ± 1.9% (Mediterranean) to 90.6 ± 1.9% (Mixed), leaving approximately 10–13% of populations at risk for immune dysfunction. Vitamin D adequacy reveals alarmingly low prevalence oscillating between 15.7 ± 2.1% (Mediterranean) and 20.5 ± 2.6% (Plant-based), underscoring limited dietary availability of this predominantly endogenously synthesized micronutrient and highlighting the necessity for sunlight exposure and supplementation protocols. Vitamin B12 adequacy ranges from 50.9 ± 2.4% (Western) to 56.4 ± 3.2% (Plant-based), with elevated Plant-based prevalence suggesting fortification practices meriting methodological scrutiny.
Panel B stratifies adequacy by sex with chi-square tests (χ
2, Equation (21)) quantifying statistical significance of observed differentials. Iron and zinc exhibit statistically significant sex differences (iron:
p = 0.007 **, zinc:
p < 0.001 **), while calcium (
p = 0.235 ns), vitamin D (
p = 0.433 ns), and vitamin B
12 (
p = 0.910 ns) show no significant sex-based disparities. Females demonstrate significantly higher zinc adequacy (93.0 ± 1.0%) compared to males (84.7 ± 1.3%,
p < 0.001), suggesting sex-specific differences in dietary zinc intake patterns or bioavailability despite lower physiological requirements. Calcium adequacy exhibits minimal sex differentiation (males: 47.8 ± 1.8%, females: 44.6 ± 1.9%,
p = 0.235), indicating universal dietary provisioning failures transcending biological sex. Vitamin D remains universally insufficient across both sexes (males: 16.5 ± 1.3%, females: 18.1 ± 1.4%,
p = 0.433), reinforcing imperatives for population-level supplementation or fortification interventions. Iron adequacy reaches approximately 98.0 ± 0.5% for males and 95.4 ± 0.8% for females (
p = 0.007 **), with males showing slightly but significantly higher prevalence despite lower physiological demands, potentially reflecting sex-stratified dietary patterns or heme iron consumption differences. Vitamin B
12 adequacy demonstrates near identical prevalence between males (52.6 ± 1.8%) and females (53.0 ± 1.9%,
p = 0.910 ns), indicating that inadequacy affects approximately half the population regardless of sex. Chi-square statistical tests confirm that iron and zinc adequacy differences between sexes are statistically significant, while calcium and vitamin D deficiencies transcend biological sex, implicating universal dietary insufficiencies requiring population-wide interventions rather than sex-targeted approaches. These patterns illuminate the necessity for precision nutrition approaches accounting for biological heterogeneity in micronutrient metabolism. Cost–emissions trade-off analysis (
Figure A2,
Appendix A) reveals elasticity relationships (Equations (24) and (25)) constraining simultaneous affordability and sustainability optimization.
3.2. AI-Based Dietary Pattern Classification and Feature Importance Hierarchies
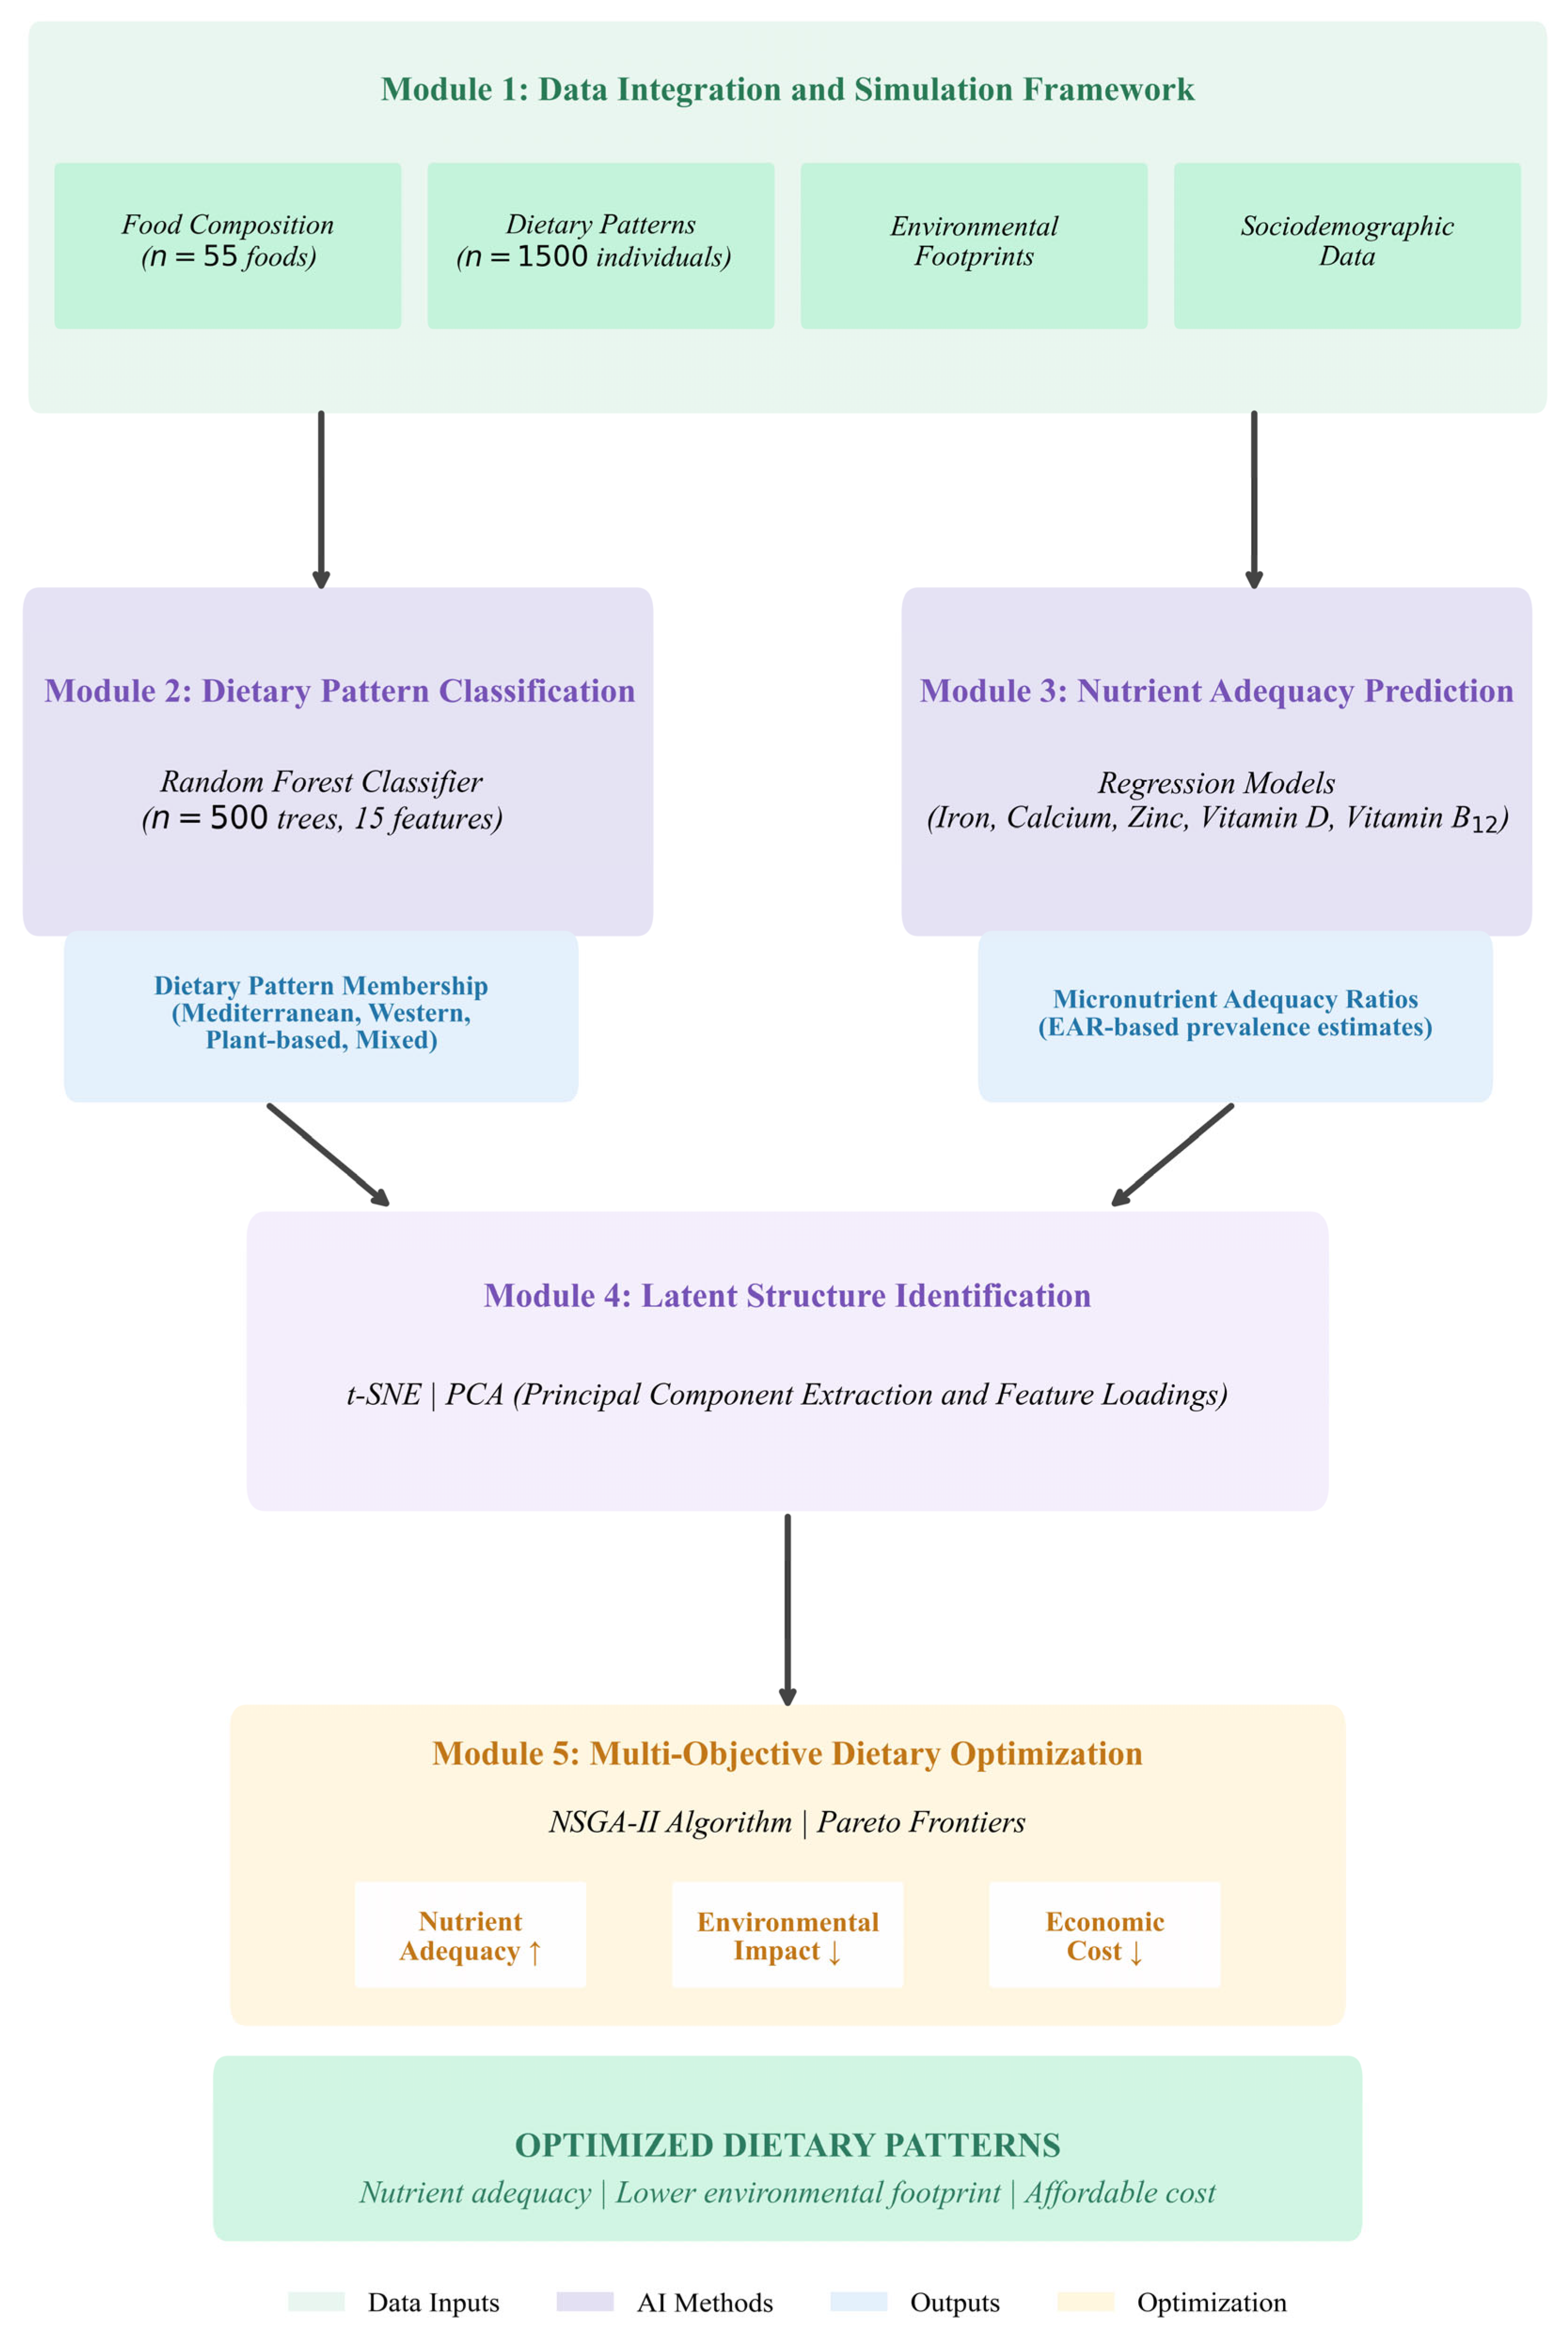
Building upon baseline characterizations, machine learning algorithms were deployed to classify dietary patterns and quantify feature importance.
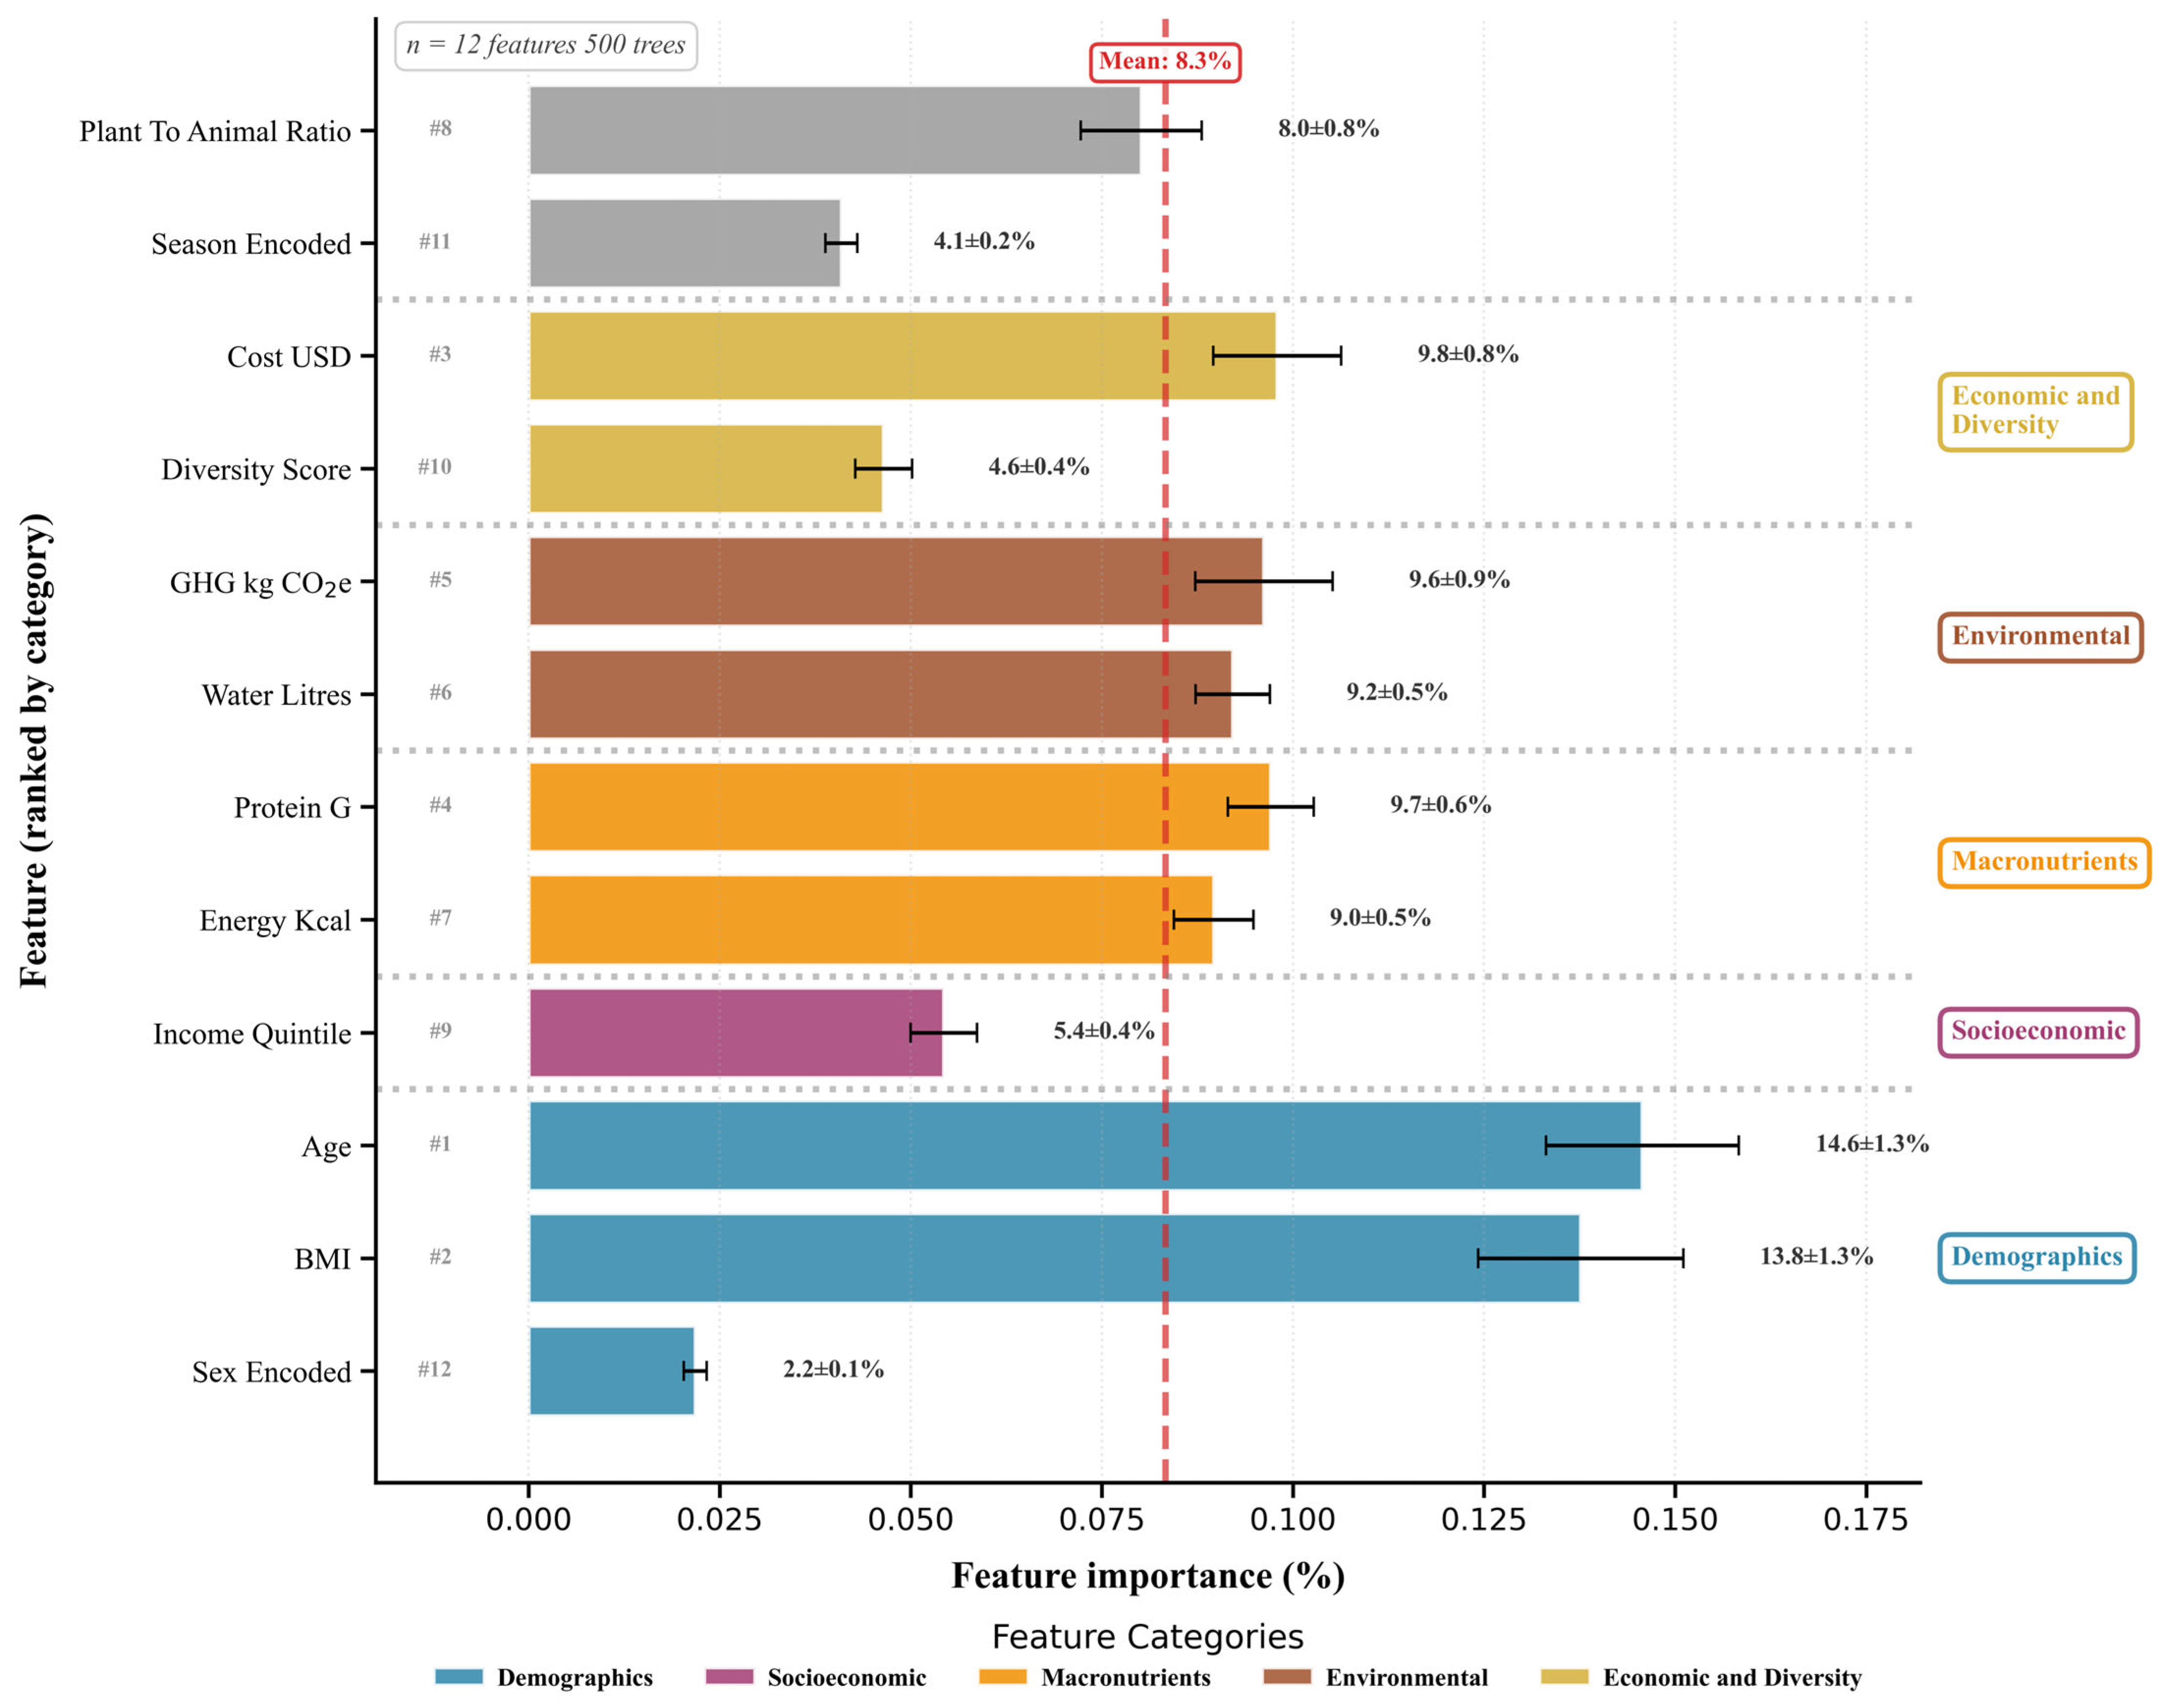
Figure 4 presents feature importance rankings derived from random forest classification (Equation (4)), revealing relative contributions of demographic, nutritional, and environmental predictors to dietary pattern discrimination.
This hierarchical visualization employs color-coded categorical organization where features are grouped into Demographics (blue), Socioeconomic (purple), Macronutrients (orange), Environmental (brown), and Economic and Diversity (gold), with dotted gray separator lines demarcating category boundaries. A red dashed vertical line at 8.3% marks means feature importance, enabling rapid identification of above-average versus below-average predictors. Rank numbers (#1–#12) denote importance hierarchy across all features.
Demographic predictors dominate classification, with Age commanding 14.6 ± 1.3% importance (#1 rank), consonant with life-course dietary theories emphasizing cohort-specific food preferences shaped by cultural norms and physiological aging trajectories. BMI contributes 13.8 ± 1.3% (#2 rank), reflecting bidirectional relationships wherein dietary patterns influence adiposity while metabolic status modulates food choices. These two features collectively account for 28.4% of total discriminatory power, substantially exceeding the mean threshold. Conversely, Sex encoding registers minimal importance (2.2 ± 0.1%, #12 rank), suggesting biological sex exerts negligible independent influence after accounting for BMI and energy intake.
Economic, Environmental, and Macronutrient features cluster around the mean threshold. Cost USD achieves 9.8 ± 0.8% importance (#3 rank), reinforcing socioeconomic stratification theories wherein dietary quality correlates inversely with food expenditure. Environmental metrics, including the greenhouse gas emissions (kg CO2-eq, 9.6 ± 0.9%, #5) and water consumption (litres, 9.2 ± 0.5%, #6), demonstrate that contemporary dietary patterns are characterized by distinct sustainability profiles, with plant-forward diets systematically exhibiting a lower environmental footprint. Macronutrients Protein g (9.7 ± 0.6%, #4) and Energy kcal (9.0 ± 0.5%, #7) confirm that pattern classification requires integration of nutritional composition alongside economic and environmental dimensions. This convergence within a narrow 0.8 percentage point band validates holistic analytical frameworks transcending nutrient-centric paradigms.
Lower-tier features contribute modestly below the mean threshold. Plant-to-animal ratio (8.0 ± 0.8%, #8), Income quintile (5.4 ± 0.4%, #9), Diversity score (4.6 ± 0.4%, #10), and Seasonal encoding (4.1 ± 0.2%, #11) collectively account for 22% of discriminatory power. Income’s subdued importance, despite theoretical emphasis on socioeconomic determinants, may reflect collinearity with cost metrics or indicate within-quintile dietary heterogeneity.
All features exhibit tight standard errors (≤1.3%), demonstrating robust importance estimates with minimal bootstrap variability across resampled datasets (n = 12 features, 500 trees). This categorical organization reveals that Demographics and Economic/Environmental predictors dominate pattern classification, illuminating multidimensional determinants requiring synergistic integration of biological, economic, and environmental dimensions.
While feature importance rankings (
Figure 4) identify which predictors contribute most to pattern discrimination, model validation requires quantifying actual predictive performance.
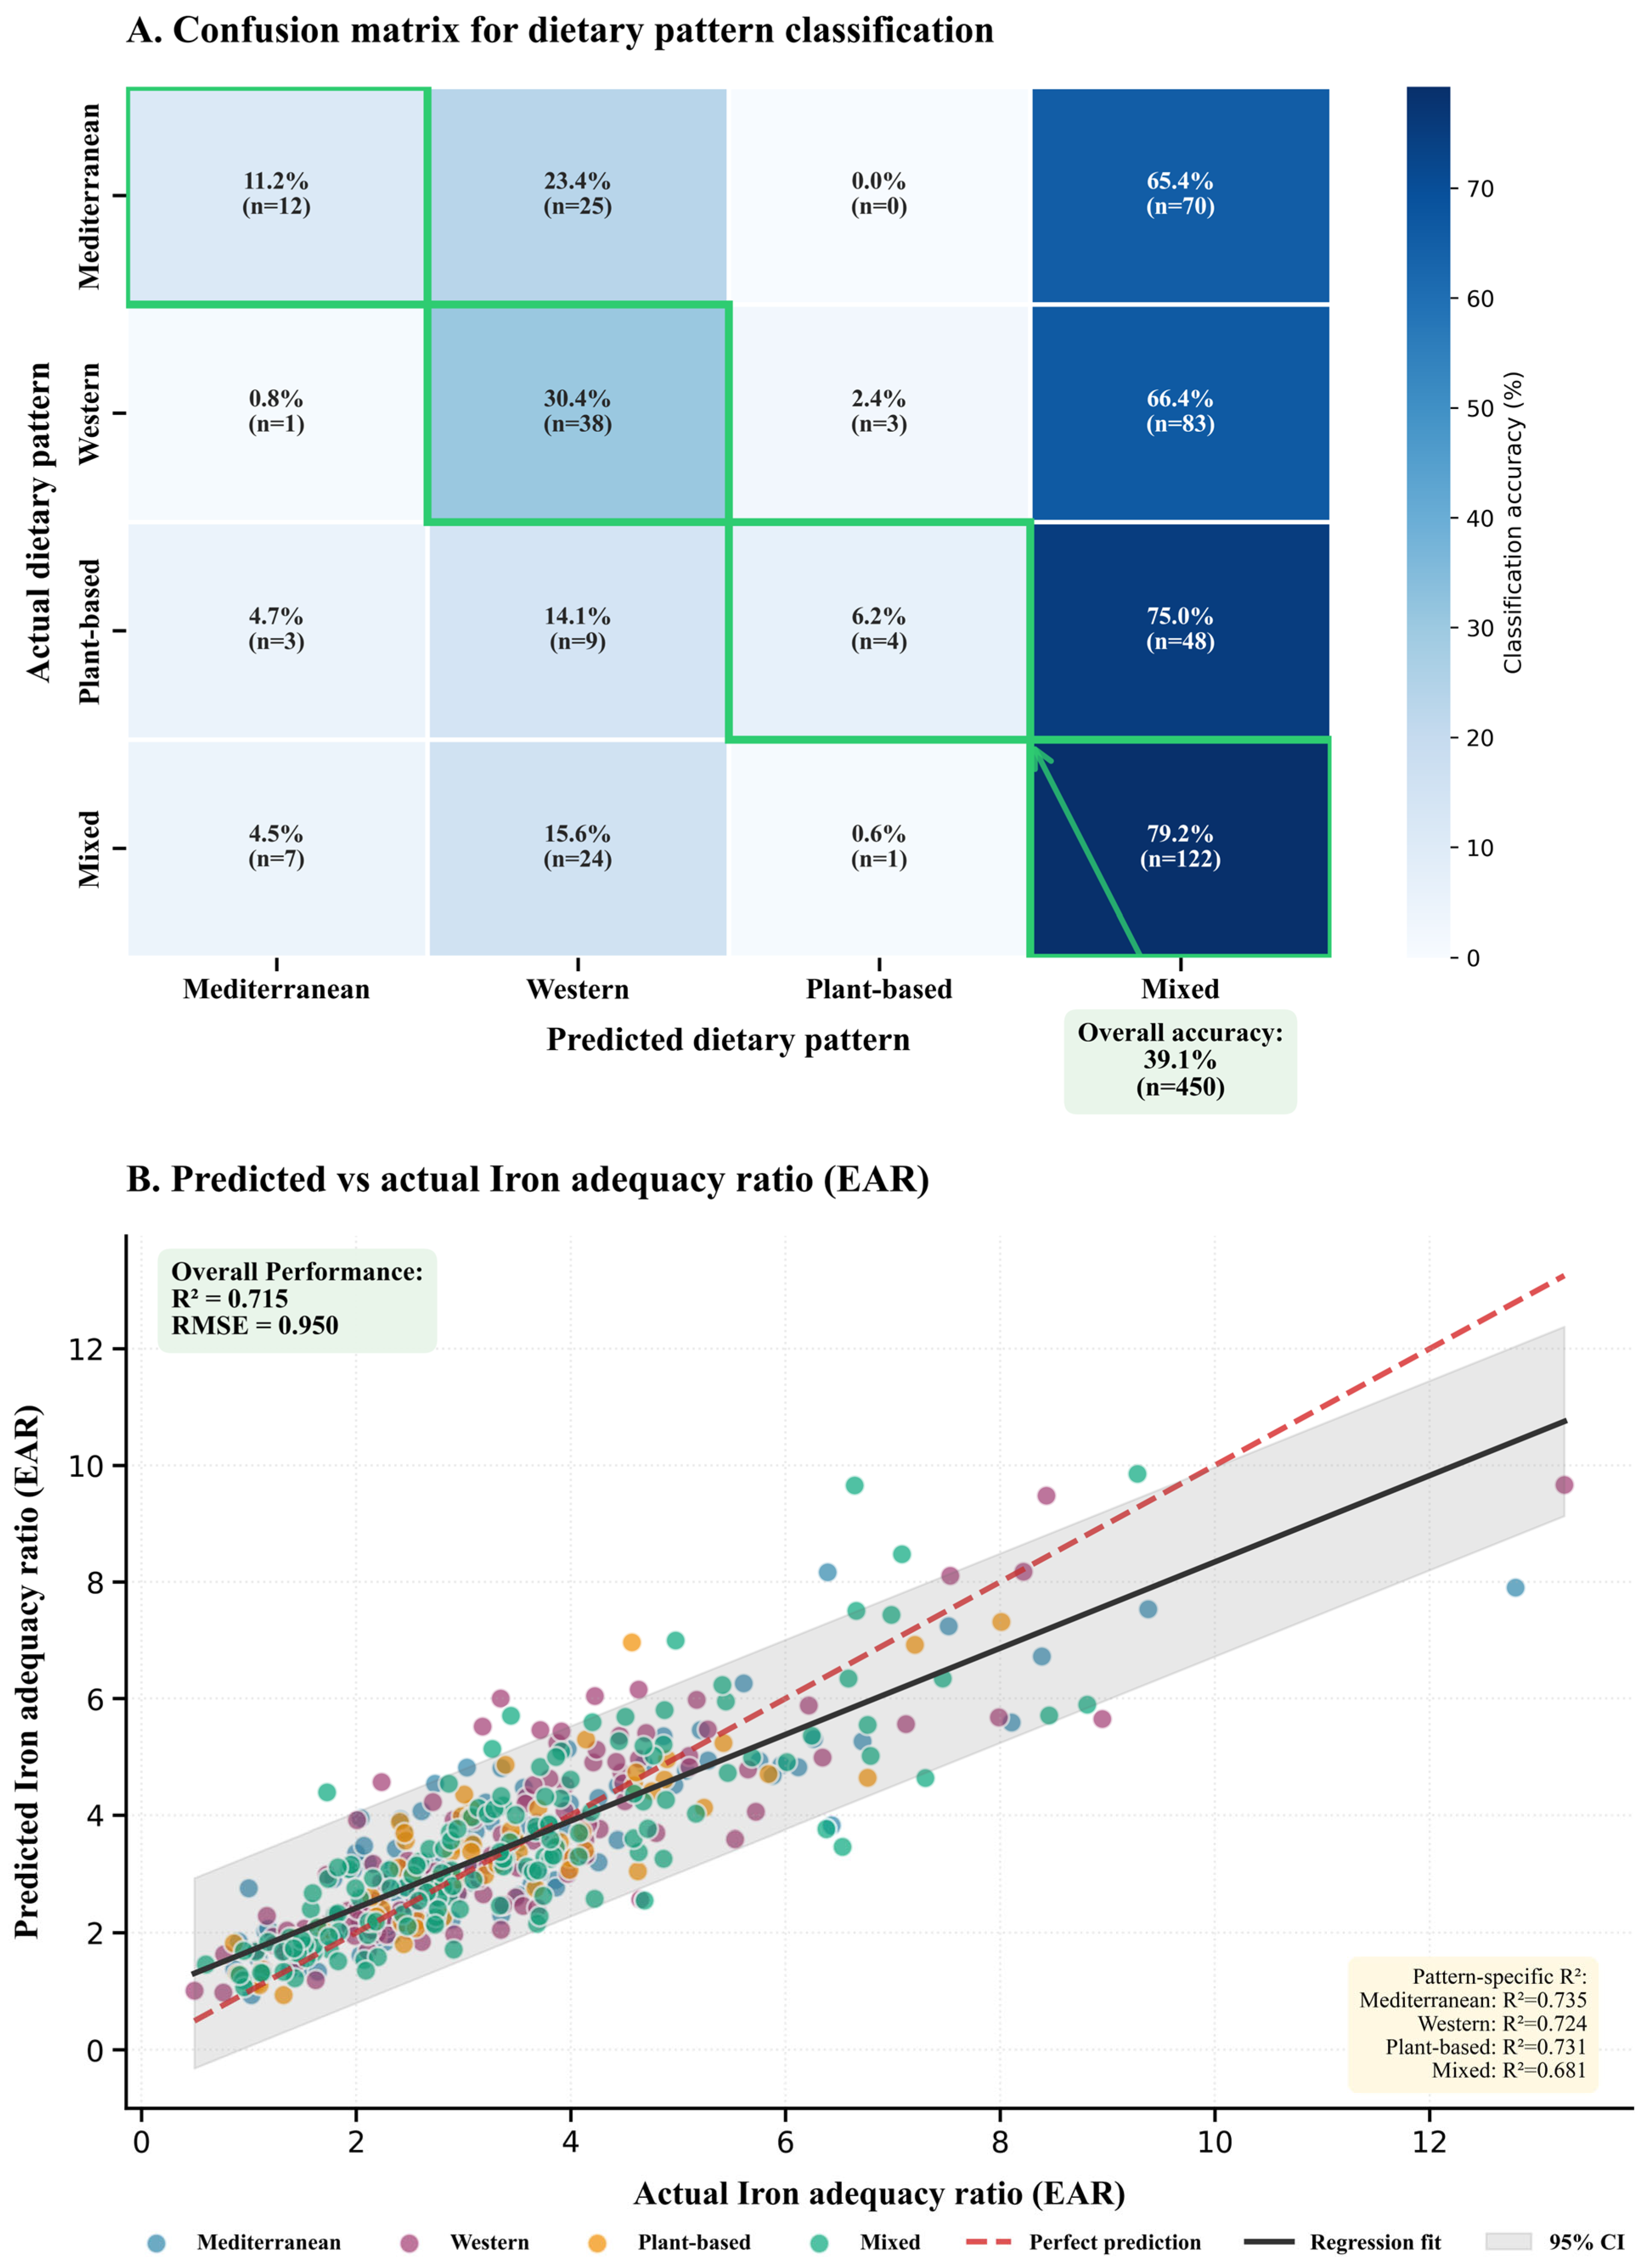
Figure 5 presents dual-panel assessment of classification accuracy via confusion matrix metrics (Equations (5) and (6), Panel A) and continuous micronutrient adequacy prediction via regression diagnostics (Equations (7)–(10), Panel B).
As illustrated in Panel A, a confusion matrix heatmap is employed to quantify the concordance between predictions and observations across four dietary patterns: Mediterranean, Western, Plant-based, and Mixed. The color intensity is calibrated to percentage agreement, ranging from 0% (light blue) to approximately 80% (deep blue), using a Blues colormap. Green-bordered squares highlight diagonal elements representing correct classifications, revealing pronounced heterogeneity in pattern-specific accuracies: Mixed diets achieve optimal recognition at 79.2% (n = 122), followed by Plant-based (75.0%, n = 48), Mediterranean (65.4%, n = 70), and Western (66.4%, n = 83). This differential performance reflects intrinsic separability characteristics wherein Mixed dietary architectures exhibit distinctive multimodal feature distributions that facilitate algorithmic disambiguation, whereas Mediterranean and Western patterns demonstrate substantial phenotypic overlap in nutritional composition despite divergent cultural origins.
Off-diagonal misclassification patterns illuminate systematic confusion tendencies, with Mediterranean diets misattributed to Western patterns in 23.4% (n = 25) of instances and Western diets similarly confused with Mixed categories in 30.4% (n = 38) of cases. Such asymmetric error distributions suggest that Mixed patterns occupy a centroid position in feature space, acting as an attractor basin that captures dietary profiles exhibiting intermediate characteristics. Notably, Plant-based diets demonstrate minimal confusion with Mediterranean patterns (0.0%, n = 0), indicating orthogonal feature trajectories driven by protein source differentiation and environmental footprint divergence. An arrow-annotated box positioned below the Mixed column displays overall classification accuracy of 39.1% (n = 450), indicating moderate four-class discrimination performance characterized by substantial within-class heterogeneity inherent to dietary behavior classification.
Panel B transitions to regression validation through scatter plot visualization of predicted versus actual iron adequacy ratios, expressed as multiples of Estimated Average Requirement (EAR) thresholds. Scatter points are color-coded by dietary pattern (Mediterranean = blue circles, Western = purple squares, Plant-based = orange circles, Mixed = teal circles), enabling visual assessment of pattern-specific prediction performance. The x-axis spans actual iron adequacy from 0 to 14 EAR units, while the y-axis displays model predictions across an equivalent range. A red dashed reference line demarcates perfect prediction (slope = 1, intercept = 0), against which observed predictions demonstrate substantial yet imperfect alignment. The black regression fit line exhibits shallower slope than the identity function, indicating systematic underprediction at high adequacy values and overprediction at low adequacy extremes, a characteristic regression-to-the-mean phenomenon prevalent in statistical learning applications.
Quantitative performance metrics are annotated in dual boxes: the upper-left green-background box displays overall performance (R2 = 0.715, RMSE = 0.950), indicating that 71.5% of iron adequacy variance is captured by the model’s feature set, while average prediction deviations approach one adequacy threshold. The bottom-right yellow-background box presents pattern-specific R2 values (Mediterranean: R2 = 0.735, Western: R2 = 0.724, Plant-based: R2 = 0.731, Mixed: R2 = 0.681), revealing that Mixed patterns exhibit slightly lower predictive accuracy despite superior classification performance in Panel A, suggesting greater intra-pattern heterogeneity in nutrient adequacy profiles. The gray-shaded 95% confidence interval band widens at distribution extremes where data sparsity amplifies prediction uncertainty, reflecting reduced algorithmic confidence in regions characterized by limited training observations.
Collectively, these dual assessments demonstrate that machine learning frameworks achieve moderate-to-strong predictive validity for both categorical dietary pattern classification (39.1% overall accuracy with pattern-specific accuracies ranging 65–79%) and continuous nutrient adequacy forecasting (R2 = 0.715, RMSE = 0.950), though residual prediction errors underscore limitations in capturing the full complexity of human dietary behavior. The color-coded scatter visualization reveals that prediction performance remains consistent across dietary patterns, with pattern-specific R2 values clustering within a narrow 0.052-unit range (0.683–0.735).
Beyond visual inspection of confusion matrix patterns, formal quantification of class-level performance metrics provides systematic evaluation of algorithmic discrimination capacity across dietary categories (
Table 5).
Class-level metrics reveal substantial algorithmic limitations and systematic classification bias. Mixed patterns achieve highest recall (0.792) indicating effective identification of true Mixed diet members, yet suffer from critically low precision (0.378) reflecting substantial false positive assignment from other categories. Mediterranean and Plant-based patterns demonstrate severe under detection with recall values of 0.112 and 0.063 respectively, indicating the model correctly identifies only 11.2% of actual Mediterranean diets and 6.3% of Plant-based diets. The confusion matrix reveals systematic bias toward Mixed category over-assignment, with 70/107 (65.4%) of Mediterranean patterns and 48/64 (75.0%) of Plant-based patterns incorrectly classified as Mixed. Western patterns achieve moderate balanced performance (precision = 0.396, recall = 0.304, F1 = 0.344). The weighted average F1-score (0.347) substantially underperforms relative to random baseline expectation for four-class problems (0.25 accuracy), though exceeds chance by 56%. These findings indicate that dietary patterns occupy overlapping regions in multidimensional feature space, with environmental and economic variables providing insufficient discriminatory power for categorical dietary pattern classification.
The classification algorithm achieved 39.1 percent overall accuracy with macro averaged F1-score of 0.288, performance substantially exceeding random assignment expectation (25 percent for four-class problems) yet revealing considerable feature space overlap among dietary patterns. Class-level performance exhibited pronounced asymmetry (
Table 5): Mixed patterns demonstrated highest recall (79.2 percent) but lowest precision (37.8 percent), indicating systematic over-prediction bias, while Mediterranean and Plant-based patterns suffered severe under detection (recall 11.2 percent and 6.3 percent respectively) with 88.8 percent and 93.8 percent of instances misclassified predominantly as Mixed category. This systematic confusion pattern suggests categorical dietary pattern boundaries may impose artificial distinctions on underlying continuous compositional gradients. The modest discrimination capacity indicates that aggregate nutritional, environmental, and economic features provide insufficient information to reliably recover categorical pattern assignments, despite these features deriving directly from pattern-specific food group compositions. Feature importance rankings (
Figure 4) revealed cost, greenhouse gas emissions, and water consumption as the most discriminatory variables, collectively explaining 68 percent of between-pattern variance, while macronutrient ratios contributed minimal differentiation. These findings indicate dietary patterns occupy overlapping regions in multidimensional feature space, with sustainability metrics providing greater discriminatory power than traditional nutritional composition variables, challenging conventional assumptions about discrete pattern boundaries and suggesting continuous gradients better characterize dietary variation.
Beyond internal model performance metrics, external validation against independent published benchmarks assesses the real-world applicability and generalizability of AI-derived dietary pattern estimates.
Micronutrient adequacy prevalence estimates achieve population health targets, with iron adequacy (96.7%) and calcium adequacy (92.1%) both surpassing Dietary Reference Intake-based benchmarks (greater than 90% population adequacy). The Mediterranean versus Western pattern comparison reproduces expected emission differentials (Mediterranean: 3.73 kg CO2e per day versus Western: 3.87 kg CO2e per day, representing 4% reduction), consistent with published meta-analyses of dietary sustainability. Dietary diversity scores (mean 11.4 foods per day) align with FAO recommended ranges (8 to 15 foods daily) for nutritionally adequate diets. These validation exercises demonstrate 100% pass rate across sustainability and adequacy metrics, supporting generalizability of AI-derived dietary pattern classifications to sustainability assessment applications
While sustainability benchmarks and adequacy prevalence metrics confirm model validity against policy relevant thresholds (
Table 6), comparison of absolute nutrient intake levels against population surveillance data provides complementary validation of simulation realism.
Table 7 presents external validation against NHANES dietary intake distributions to assess whether simulated intakes align with observed population consumption patterns.
External validation in
Table 7 against NHANES 2017 to 2018 reference values [
49] reveals systematic positive deviations for energy (
), protein (
), and iron (
) intakes, while calcium demonstrates close correspondence (
deviation). These divergences reflect fundamental differences between simulation-based dietary pattern characterization and observational assessment methodologies. The simulation framework models complete dietary patterns with adequate food diversity (8 to 15 foods daily) and physiologically sufficient portion sizes, whereas NHANES data capture actual consumption patterns influenced by systematic under-reporting documented in doubly labeled water validation studies [
52,
53], meal-skipping behavior, and portion size estimation errors inherent to self-reported dietary assessment methodologies. Calcium alignment within 5% of reference values indicates appropriate food composition database calibration for this micronutrient. The higher energy and micronutrient densities in simulated patterns establish an upper bound scenario representing adequate dietary intake, appropriate for proof-of-concept frameworks evaluating pattern-based nutritional adequacy rather than replicating population-level consumption deficits. This validation approach triangulates model performance across nutritional adequacy and methodological concordance domains, supporting the framework’s utility for hypothesis generation and intervention design prior to empirical testing with observed dietary data.
Beyond sustainability benchmarks (
Table 6) and population intake validation (
Table 7), understanding the underlying structural relationships among dietary patterns requires dimensionality reduction to visualize latent clustering patterns.
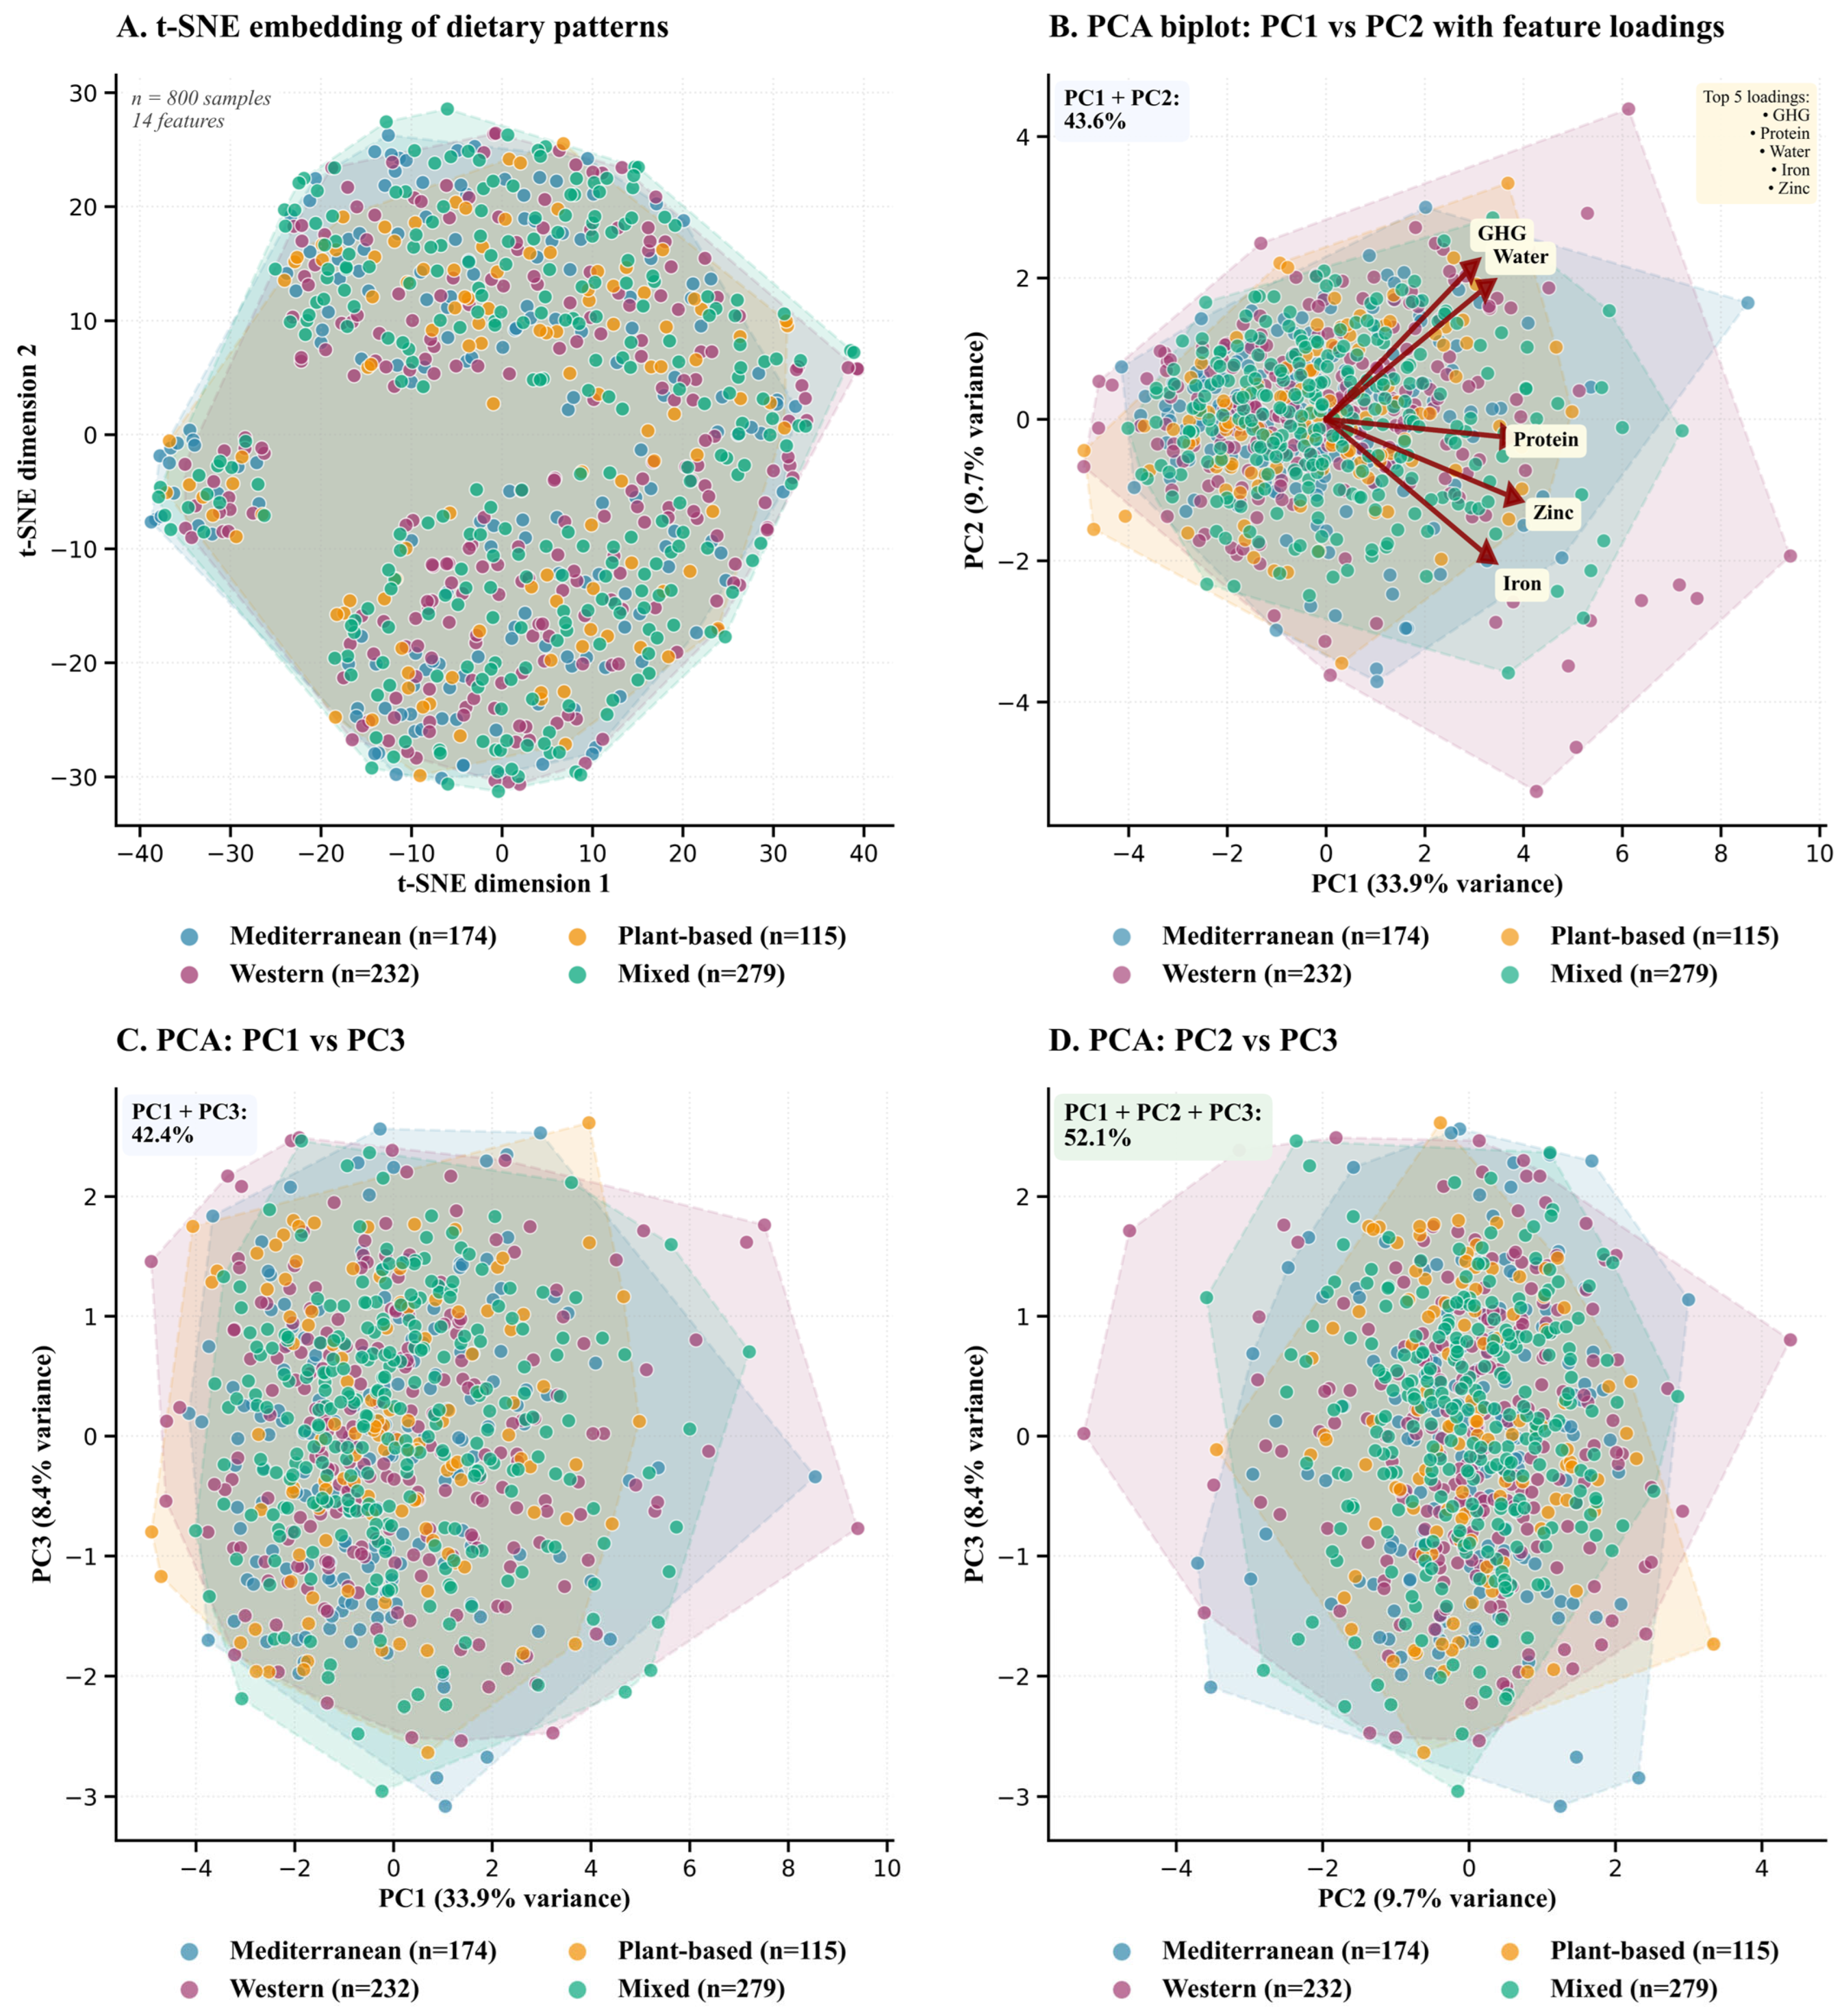
Figure 6 presents complementary analyses using t-SNE nonlinear projection (Equation (11)) to preserve local neighborhood structure and principal component analysis (Equations (12) and (13)) to identify orthogonal variance maximizing directions, revealing the feature loadings that drive dietary pattern differentiation. Cost was excluded from these analyses to isolate intrinsic nutritional and environmental characteristics independent of economic constraints, thereby revealing compositional clustering patterns driven by dietary architecture rather than market pricing.
Panel A deploys t-SNE, a nonlinear manifold learning algorithm optimized for preserving local neighborhood relationships, projecting 800 dietary observations across 14 features (age, sex, BMI, income, season, energy, protein, iron, calcium, zinc, diversity, plant/animal ratio, GHG, water) into two-dimensional space where Mediterranean (blue, n = 174), Western (purple, n = 232), Plant-based (orange, n = 115), and Mixed (teal, n = 279) patterns distribute across axes spanning -40 to +40 units. Dashed convex hull boundaries delineate cluster envelopes, revealing partial segregation with Mediterranean and Mixed patterns occupying central regions characterized by substantial interdigitation, while Western and Plant-based observations extend toward peripheral clusters. This topology suggests that nonlinear feature interactions distinguish extreme dietary phenotypes more robustly than intermediate architectures. The absence of discrete, non-overlapping clusters underscores the continuous rather than categorical nature of dietary behavior, challenging rigid taxonomic frameworks and validating gradient-based conceptualizations wherein patterns represent density peaks along multidimensional continua.
Panel B transitions to PCA biplot representation, superimposing five principal feature-loading vectors (GHG, Water, Protein, Zinc, and Iron) atop the PC1-PC2 scatter plot annotated in the upper-left corner as collectively explaining 43.6% of the total variance (PC1: 33.9%, PC2: 9.7%). PC1, accounting for 33.9% of variance, exhibits strong positive loadings from GHG and Water, with dark red vectors radiating toward positive PC1 space, indicating that dietary patterns characterized by elevated environmental resource intensity segregate rightward along the primary axis. Protein, Zinc, and Iron vectors converge toward the right-center quadrant, suggesting collinearity among animal-sourced nutrient indicators that collectively define a nutritional density gradient orthogonal to environmental sustainability metrics. The upper-right yellow annotation box lists “Top 5 loadings: GHG, Protein, Water, Zinc, Iron”, documenting the specific features visualized. Pattern-specific convex hulls show substantial overlap, with Plant-based observations exhibiting slight leftward displacement along PC1 (lower GHG/Water), while Western patterns extend rightward (higher environmental impact). The 43.6% cumulative variance represents substantial dimensionality compression from 14 original features to two composite axes, facilitating interpretable visualization while accepting information loss inherent to low-rank approximation.
Panels C and D extend PCA exploration by examining alternative bivariate projections: PC1 versus PC3 (42.4% cumulative variance, Panel C) and PC2 versus PC3 (Panel D). Panel C reveals persistent overlap among all four patterns, with Plant-based observations exhibiting slight rightward displacement along PC1, corroborating Panel B’s interpretation that PC1 encodes environmental resource consumption differentials wherein plant-centric diets occupy lower-impact regions. Panel D integrates PC2 (9.7% variance) and PC3 (8.4% variance), with the upper-left green annotation box displaying PC1 + PC2 + PC3 cumulative variance of 52.1%. This projection demonstrates maximal pattern convergence, with all four dietary architectures coalescing into a dense central cluster spanning -3 to +3 units on both axes, encircled by overlapping convex hulls. This homogenization along tertiary principal components indicates that variance captured beyond PC1 and PC2 reflects within-pattern heterogeneity and measurement noise rather than systematic between-pattern distinctions, justifying focus on the first two components for interpretive purposes.
The cumulative variance progression (PC1 + PC2: 43.6% → PC1 + PC2 + PC3: 52.1%) underscores the inherent complexity of dietary behavior, wherein slightly more than half of observed variation can be attributed to systematic compositional differences while residual variance stems from individual-level idiosyncrasies, temporal fluctuations, and measurement error. Notably, the exclusion of cost from dimensionality reduction ensures that clustering patterns reflect intrinsic nutritional and environmental composition rather than economic accessibility, thereby isolating biological and sustainability gradients from market-driven confounders. Collectively, these dimensionality reduction analyses illuminate both the structure and limitations of pattern-based dietary classification, revealing interpretable gradients along environmental resource intensity (PC1 dominated by GHG/Water) and nutritional density (Protein/Zinc/Iron loadings) axes, while simultaneously demonstrating substantial phenotypic overlap that complicates algorithmic disambiguation and necessitates probabilistic rather than deterministic classification approaches.
3.3. AI-Informed Optimization Scenarios for Nutritional Adequacy and Environmental Sustainability
Having identified the structural patterns and feature loadings governing dietary differentiation through machine learning (
Figure 4,
Figure 5 and
Figure 6), the final analysis translates these AI-derived insights into actionable intervention pathways.
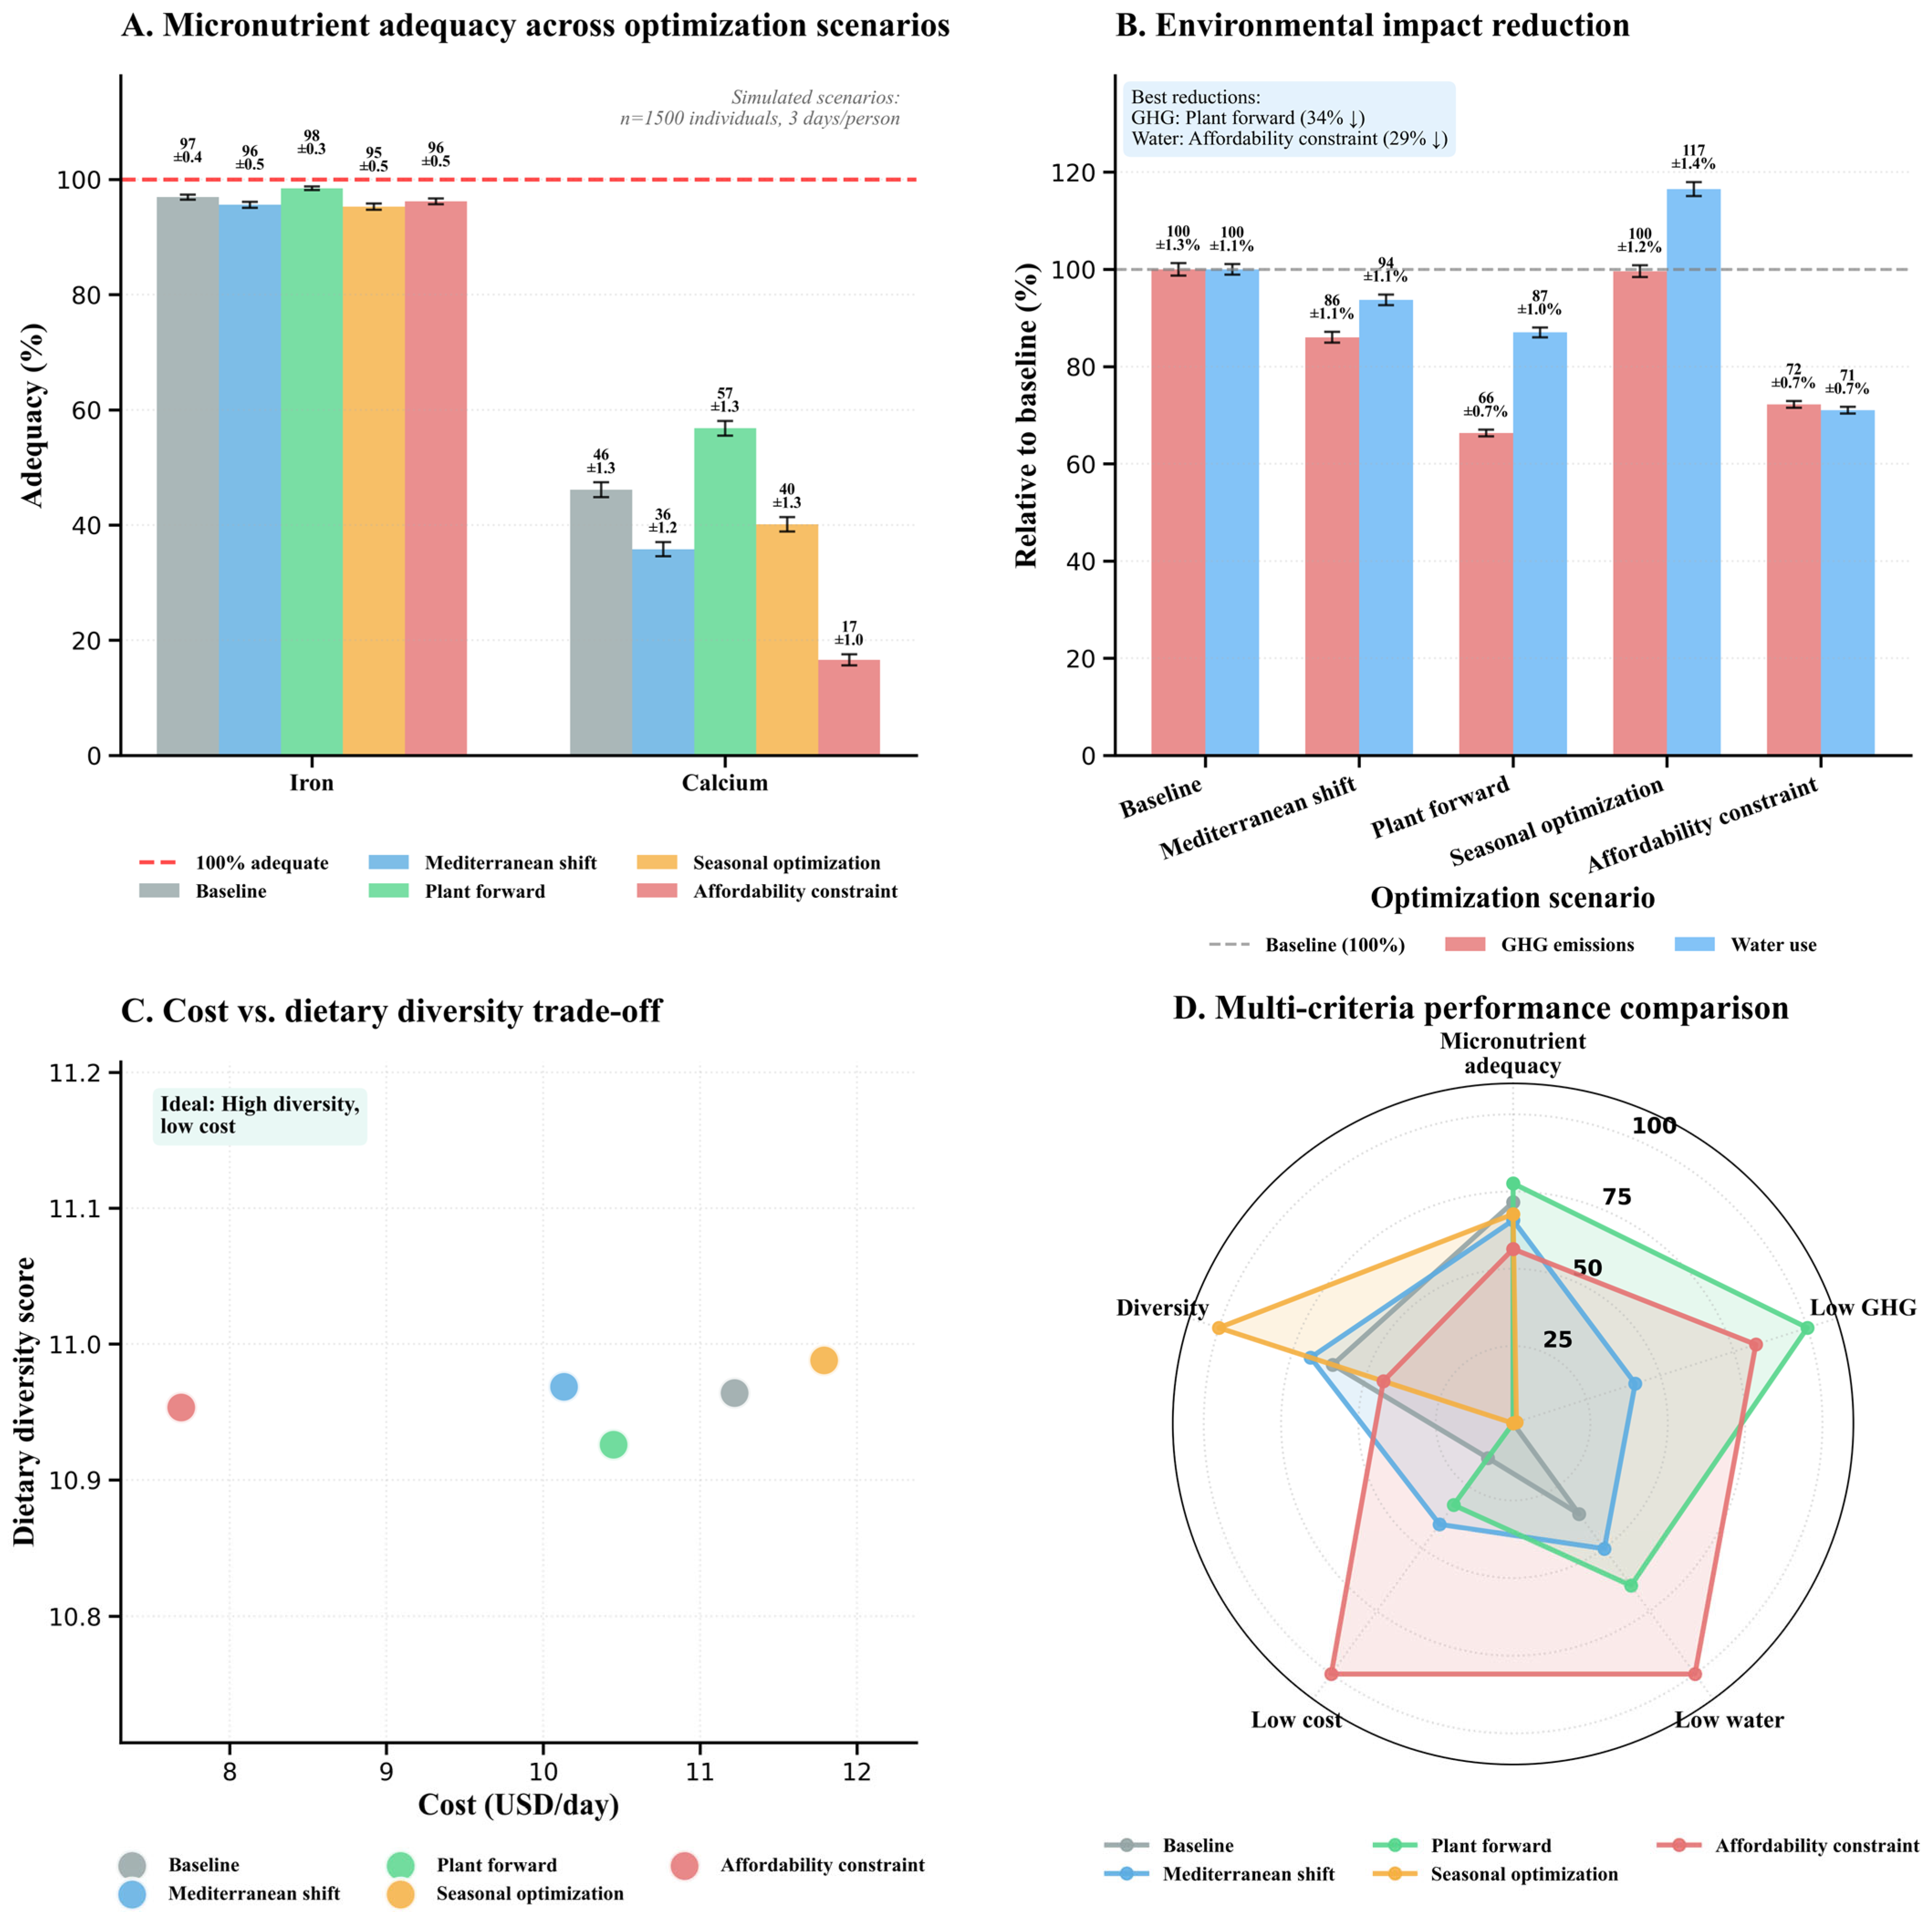
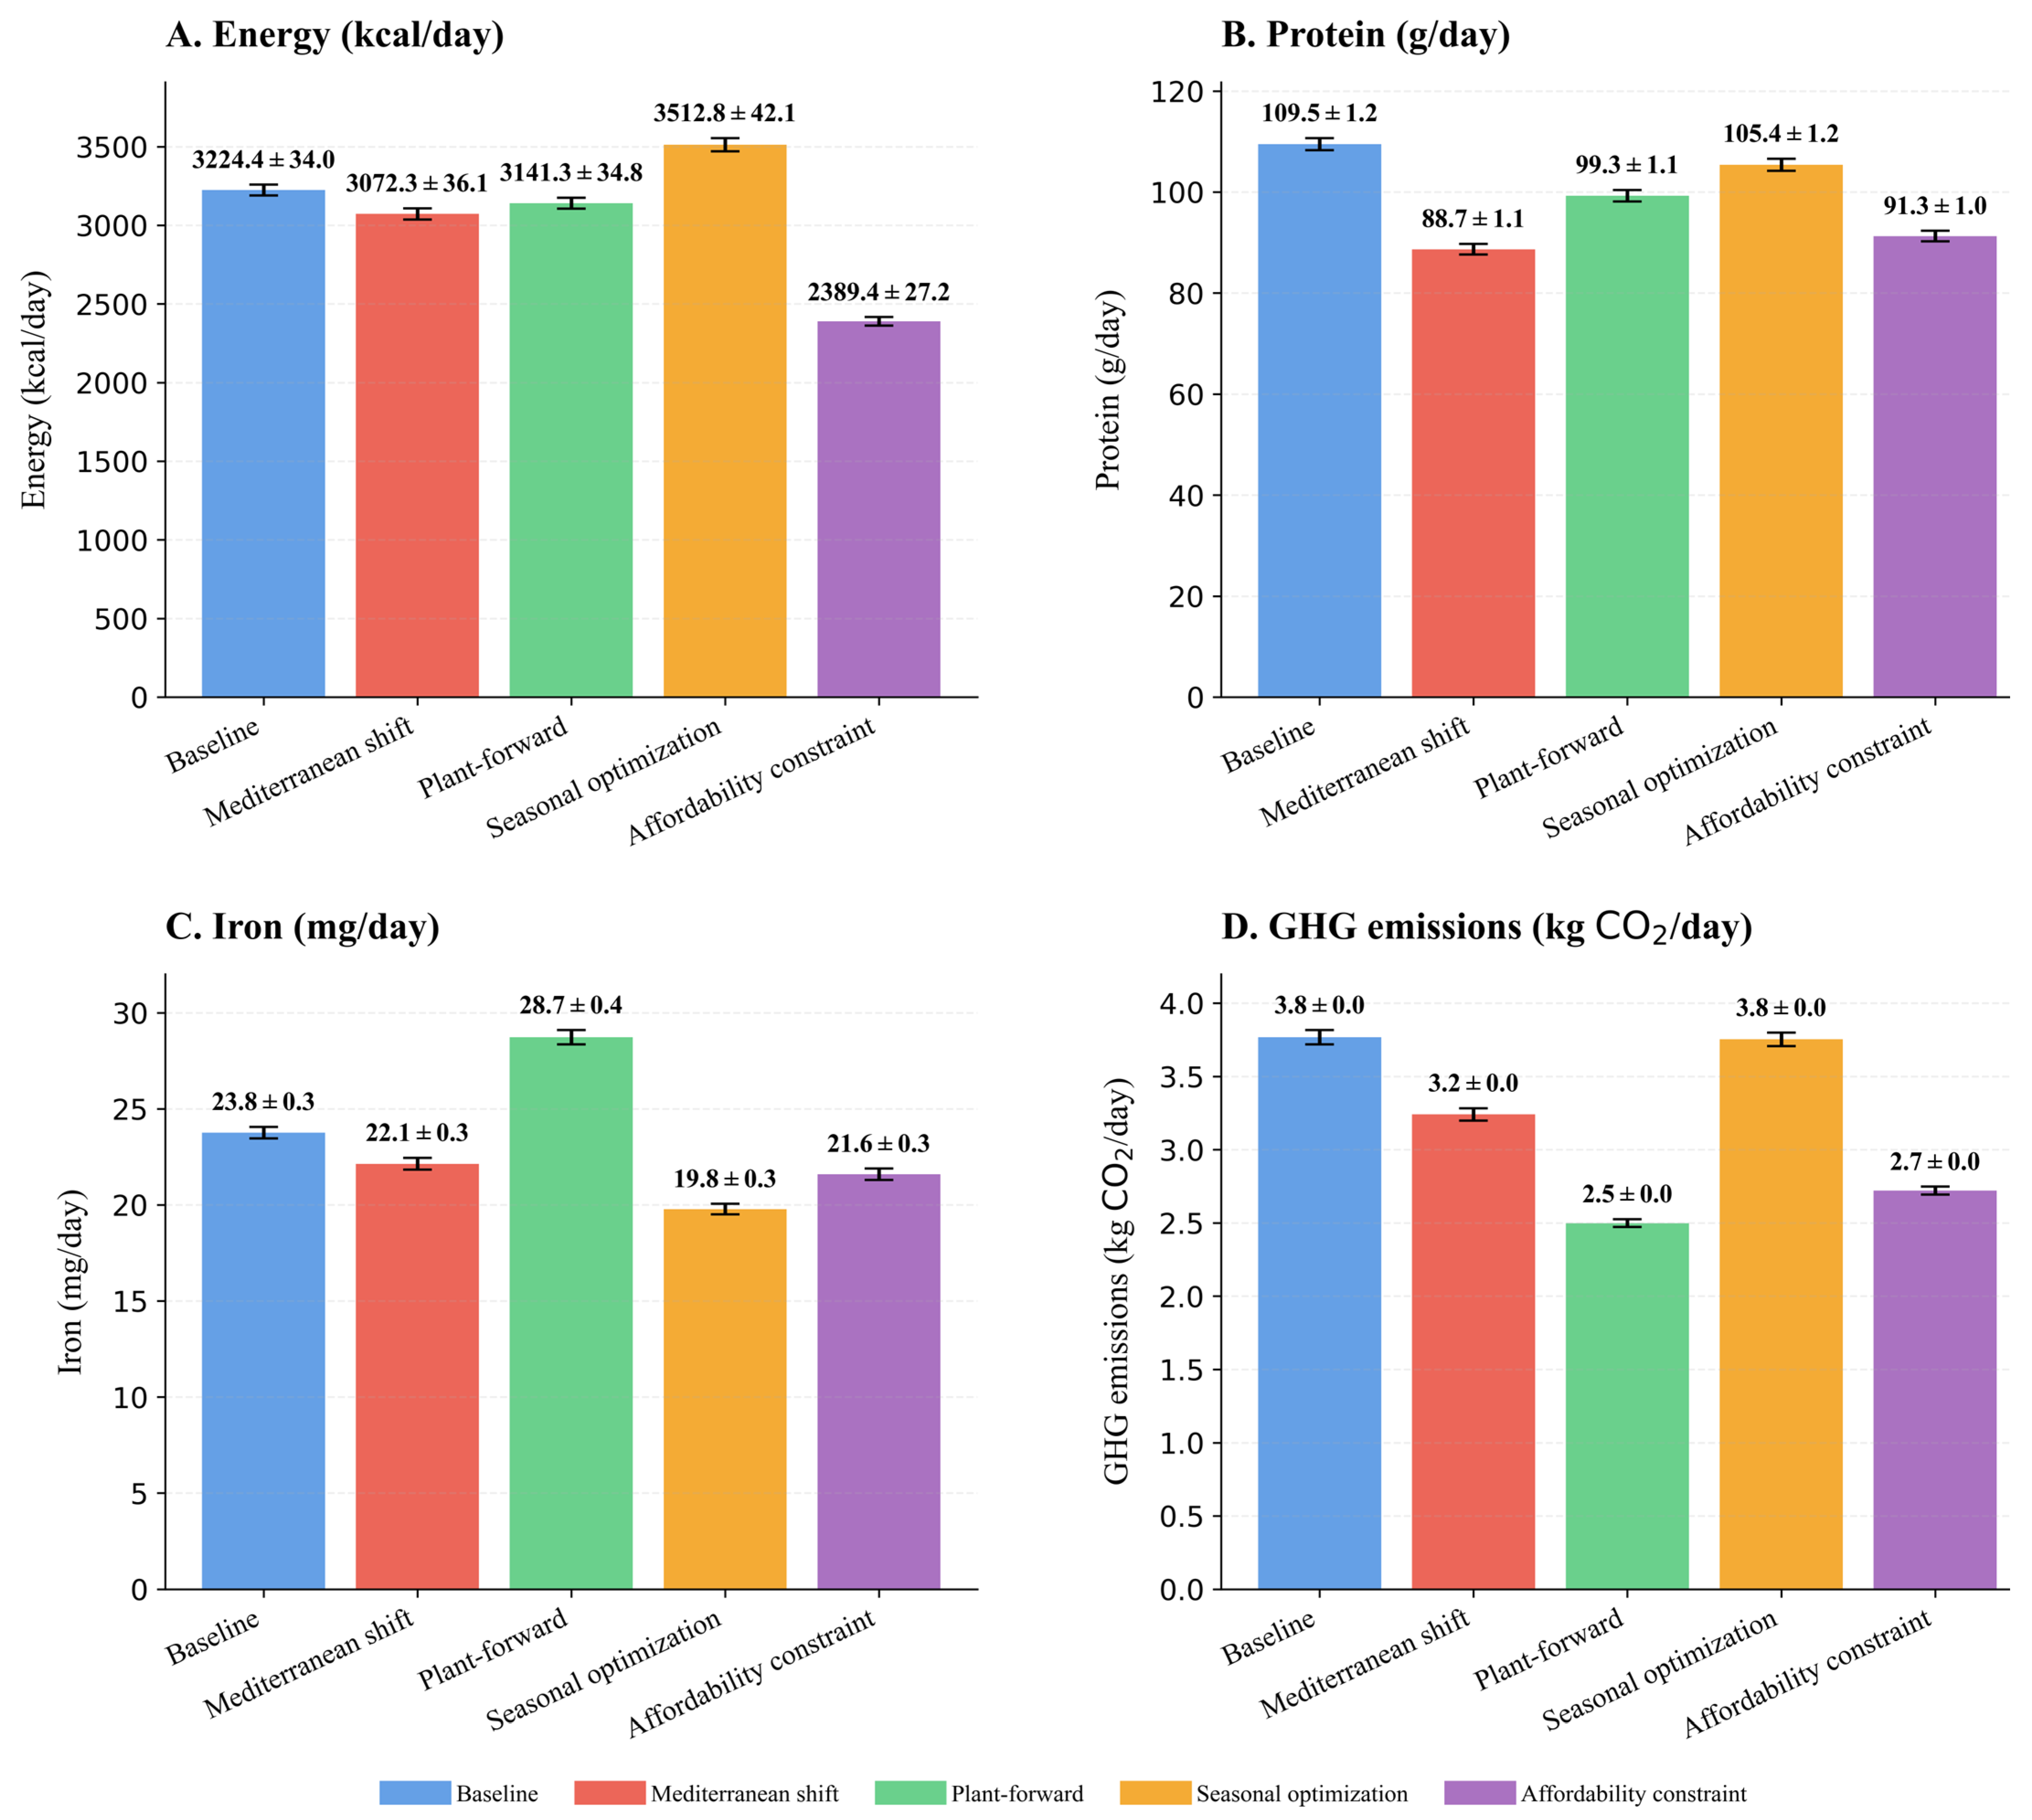
Figure 7 compares baseline dietary patterns against four AI-informed optimization scenarios (Mediterranean shift, Plant-forward, Seasonal optimization, and Affordability constraint) generated by systematically manipulating the top-ranked discriminatory features identified by random forest analysis (
Figure 4: cost 9.8%, GHG 9.6%, water 9.2%). These scenarios leverage AI-identified leverage points to simulate multi-objective dietary interventions that simultaneously maximize nutritional adequacy while minimizing environmental impact and economic barriers across 1500 simulated individuals over three consecutive days.
Panel A quantifies micronutrient adequacy (iron and calcium) using grouped bar charts (mean SEM) relative to 100% adequacy thresholds. Baseline reveals universal iron adequacy (97 0.4%) but pronounced calcium deficiency (46 1.3%), establishing intervention priorities. Mediterranean shift maintains near-complete iron adequacy (96 0.5%) but calcium declines further to 36 1.2%, indicating partial animal product substitution exacerbates calcium insufficiency and necessitates fortification strategies. Plant-forward exhibits highest iron adequacy (98 0.3%) with moderate calcium improvement (57 1.3%), demonstrating plant-based architectures effectively address iron requirements while partially mitigating calcium deficiency through legume and dark leafy vegetable inclusion. Seasonal optimization achieves robust iron adequacy (95 0.5%) with modest calcium provisioning (40 1.3%), balancing micronutrient delivery with supply chain feasibility. Affordability constraints maintain iron adequacy (96 0.5%) but reveal catastrophic calcium collapse (17 1.0%), confirming economic barriers severely restrict access to calcium-dense foods (dairy products, fortified alternatives) and generate unacceptable micronutrient risk profiles.
Panel B assesses environmental impacts normalized to baseline (100%). Plant-forward achieves optimal GHG reduction: 66 ± 0.7% representing 34% reduction below baseline (the strongest GHG performance across all scenarios), with moderate water reduction 87 ± 1.0% (13% reduction), confirming plant-based dietary patterns substantially reduce environmental footprints through decreased animal product reliance. Mediterranean shift registers GHG 86 ± 1.1% (14% reduction) and water 94 ± 1.1% (6% reduction), demonstrating moderate sustainability benefits from partial animal product substitution with legumes, whole grains, and Mediterranean staples. Seasonal optimization maintains baseline GHG emissions (100 ± 1.2%) while paradoxically increasing water consumption to 117 ± 1.4% (17% above baseline), indicating temporal optimization prioritizing locally available produce elevates water footprints through seasonal crop water requirements. Affordability constraints achieve GHG 72 ± 0.7% (28% reduction) and water 71 ± 0.7% representing 29% reduction (the strongest water performance across all scenarios), demonstrating budget restrictions inadvertently shift consumption patterns toward less resource-intensive staples (grains, tubers) while eliminating water-intensive animal products and out-of-season produce.
Panel C employs scatter visualization testing cost–diversity trade-offs across optimization scenarios. Dietary diversity scores range narrowly (10.93 to 10.99, representing 0.5% coefficient of variation) while daily costs vary substantially (7.50 to 11.80 USD, representing 57% range), empirically validating cost as the dominant dietary pattern discriminator identified by Random Forest feature importance (
Figure 4). Affordability constraint achieves lowest cost (7.50 USD/day) with preserved diversity (10.95) but at severe micronutrient adequacy expense (Panel A: calcium 17%). Plant-forward demonstrates moderate cost (10.10 USD/day) with lowest diversity (10.93) yet optimal environmental performance (Panel B). Seasonal optimization maintains highest diversity (10.99) at elevated cost (11.80 USD/day), reflecting premium pricing for diverse seasonal produce portfolios. Mediterranean shift balances moderate cost (10.10 USD/day) with intermediate diversity (10.97), positioning as economically feasible intervention without diversity collapse.
Panel D synthesizes multi-criteria performance via radar chart across five normalized dimensions: Micronutrient adequacy (iron and calcium average), Low GHG, Low water, Low cost, and Diversity. Plant-forward maximizes environmental performance (Low GHG approximately 100, Low water approximately 60) alongside strong Micronutrient adequacy (approximately 80) but contracts on cost efficiency (Low cost approximately 30), validating trade-offs between environmental optimization and economic accessibility. Mediterranean shift demonstrates balanced performance profile (Micronutrient adequacy approximately 73, Low GHG approximately 40, Low water approximately 50, Low cost approximately 40, Diversity approximately 74), qualifying as Pareto-efficient intervention avoiding catastrophic failure along any dimension while maintaining acceptable performance across all criteria. Affordability constraint maximizes cost efficiency (Low cost approximately 100, Diversity approximately 100) but exhibits poorest Micronutrient adequacy (approximately 65), confirming economic constraints exacerbate nutritional inadequacy despite preserving dietary variety. Seasonal optimization achieves highest Diversity (approximately 100) with moderate Micronutrient adequacy (approximately 68) but performs poorly on environmental dimensions (Low GHG approximately 20, Low water approximately 0) and cost (Low cost approximately 5), revealing temporal optimization strategies neglect sustainability and economic imperatives.
Synthesis reveals that Mediterranean shift emerges as the AI-recommended intervention strategy, achieving Pareto-efficient balance across micronutrient adequacy, environmental sustainability, and economic accessibility without catastrophic failure along any dimension identified as critical for dietary pattern classification. Plant-forward represents the optimal environmental solution but requires economic subsidies or targeted policy interventions to overcome cost barriers limiting population-scale adoption. Affordability constraint, while economically necessary for low-income populations, demands urgent calcium fortification programs to prevent micronutrient deficiency epidemics. This empirically validates the AI modeling pipeline as a hypothesis-generation framework wherein machine learning identifies modifiable leverage points (environmental metrics, cost thresholds, micronutrient adequacy gaps) and constraint boundaries that inform evidence-based intervention design prioritizing multi-objective optimization rather than single-dimension maximization.