Short Birth Intervals and Long-Term Stunting Risk in Indonesian Children: A Retrospective Cohort Study Using the Indonesian Family Life Survey


Abstract
1. Introduction
2. Materials and Methods
2.1. Study Design
2.2. Ethics Statement
2.3. Variables and Operational Definitions
2.4. Data Quality and Bias Control
2.5. Statistical Analysis
3. Results
3.1. Child Characteristics
3.2. Parental and Household Socioeconomic Characteristics
3.3. High-Risk Births (The Four Toos)
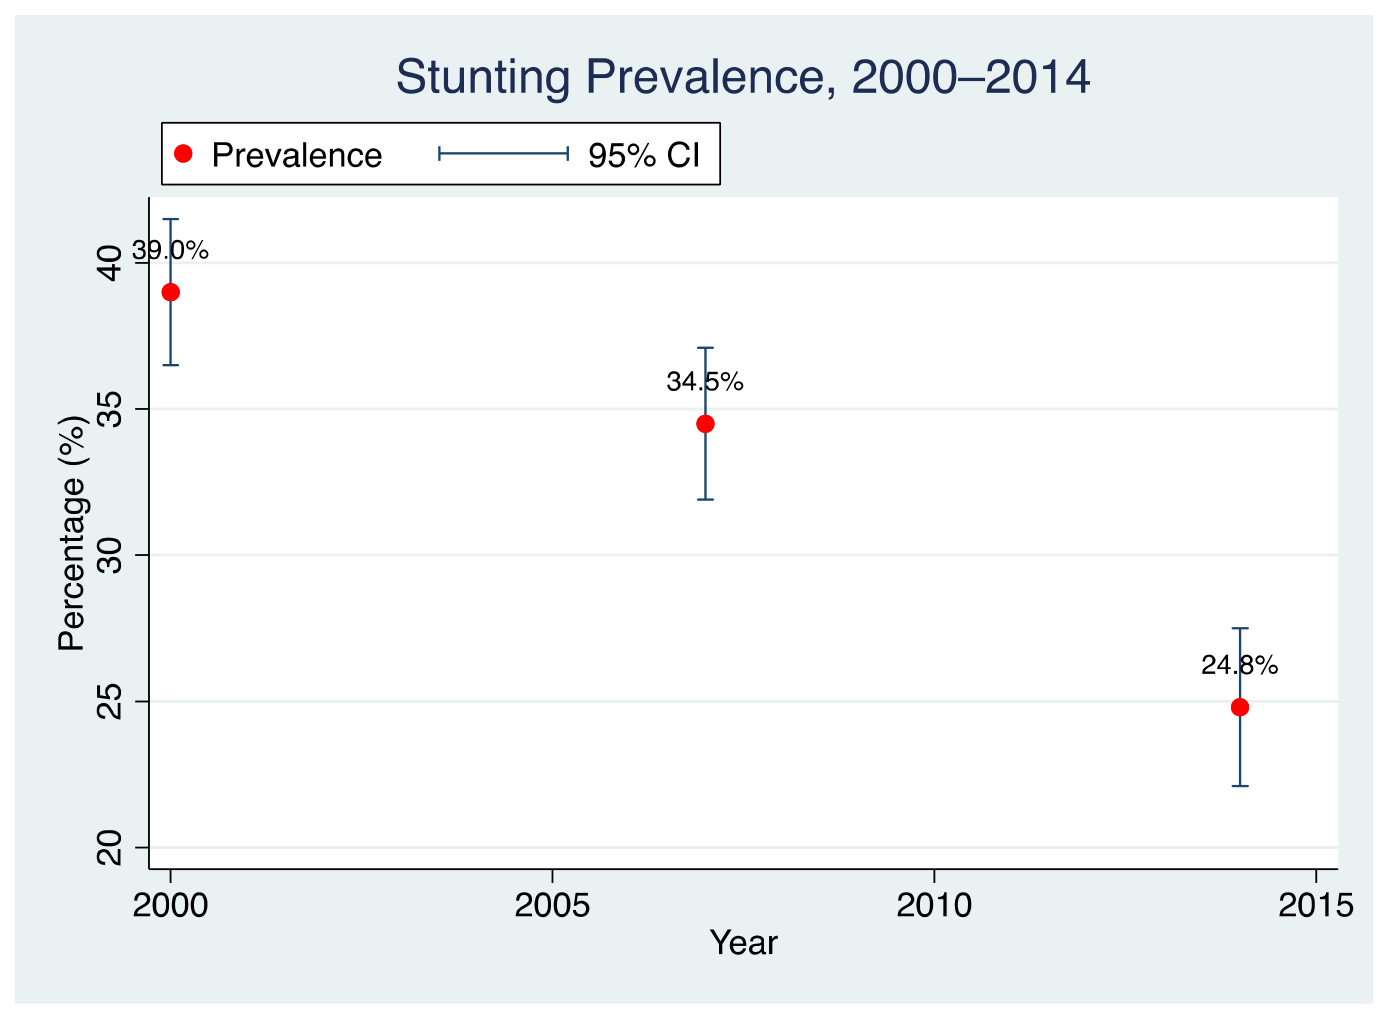
3.4. Prevalence of Stunting in 2000, 2007, and 2014
3.5. The Impact of the Four Toos Births on Stunting
4. Discussion
5. Conclusions
Author Contributions
Funding
Institutional Review Board Statement
Informed Consent Statement
Data Availability Statement
Acknowledgments
Conflicts of Interest
Abbreviations
| IFLS | Indonesia’s Family Life Survey |
| 4T | 4 (four) Too |
| WHO | WHO |
| DHS | The Demographic Health Survey |
| ARI | Acute infection of the respiratory tract |
| LBW | Low birth weight |
| FCS | Food consumption score |
| HAZ | Height-for-age Z-score |
| OR | Odds ratio |
| CI | Confidence interval |
| ICC | Intraclass correlation coefficient |
| MOR | Median odds ratio |
| WASH | Water, sanitation, and hygiene |
Appendix A

| Category | Variable | Operational Definition | Measurement Results | Year |
|---|---|---|---|---|
| Dependent variables | Stunting | Nutritional status based on length for age < –2 SD of the WHO Child Growth Standards median. | 1. HAZ < −2 SD 2. HAZ ≥ −2 SD | 2000, 2007, and 2014 |
| Main independent variables | Advanced maternal age | Maternal age during childbirth was classified as advanced when the patient was 35 years or older [13] | 0: No 1: Yes | 2000 |
| Young maternal age | Maternal age during childbirth is classified as younger than 20 years [13] | 0: No 1: Yes | 2000 | |
| High parity | Having four or more children. | 0: No 1: Yes | 2000 | |
| Short birth interval | The birth interval was classified as short (<24 months [13] | 0: No 1: Yes | 2000 | |
| Covariates | ||||
| Child characteristics | Child age | Child’s age, calculated as the duration from birth until the interview date. | Categorized as follows: a. 0–5 months, b. 6–11 months, c. 12–24 months, and d. >24 months | 2000 |
| Sex | Biological sex of the child. | 0: Male 1: Female | 2000 | |
| Preterm birth | Infants born alive before 37 weeks of pregnancy are completed. | 2000 | ||
| Low birth weight | WHO defines low birth weight as a weight at birth of 2500 g (5.5 pounds). | Numerical | 2000 | |
| Exclusive breastfeeding | Breast milk was exclusively given to infants for the first 6 months without supplementary food or drink. | 0: Yes 1: No | 2000 | |
| Early breastfeeding initiation | Placement of a newborn on the mother’s chest or abdomen immediately after birth to allow the infant to latch onto the breast and start nursing. | 0: Yes 1: No | 2000 | |
| Acute infection of the respiratory tract (ARI) | Presence or absence of ARI within the past 2 weeks. | 0: No 1: Yes | 2000 | |
| Diarrhea | Three or more stools that are sufficiently liquid to take the shape of the container in which they are placed in the last 2 weeks are passed in 24 h. Presence and duration of diarrhea in the last 2 weeks. | 0: No 1: Yes | 2000 | |
| Infection history | Infection defined as a history of cough, diarrhea, or fever in the last 2 weeks (yes, either of the three conditions) | 0: No 1: Yes | 2000 | |
| Outpatient visit | A visit to a health care facility, such as a clinic, primary care center, or hospital outpatient department, for medical consultation or treatment without an overnight stay. Outpatient visits include scheduled appointments for routine checkups, diagnoses, or follow-up care, as well as walk-in consultations. | 0: No 1: Yes | 2000 | |
| Birth attendant | Type of professional assistance during childbirth. | 1. Obstetricians 2. Midwives 3. Others | 2000 | |
| Place of delivery | Location where the respondent gave birth. | 1. Government hospital 2. Private hospital 3. Maternity clinic 4. Primary health center | 2000 | |
| Parental Characteristics | Maternal height | Maternal height was used as an indicator of nutritional status during the growth period, which was assessed through height measurement. | 0: >150 cm 1: ≤150 cm | 2000, 2007, and 2014 |
| Maternal Education | The highest education level completed by the mother. | 0: No formal education 1: Primary school 2: Secondary school 3: Higher education | 2000, 2007, and 2014 | |
| Maternal employment | Mother’s employment status categorized as employed or unemployed. | 0: Unemployed 1: Employed | 2000, 2007, and 2014 | |
| Paternal education | The parent completed the highest level of formal education, as verified by the certificate. | 0: Secondary school and lower 1: Secondary school | 2000, 2007, and 2014 | |
| Paternal employment | Primary occupation or activity occupying most of the father’s time, categorized as not working, studying, or employed (government/private sector, entrepreneur, farmer, etc.). | 0: No 1: Yes | 2000, 2007, and 2014 | |
| Paternal smoking | Whether the parent smoked actively and has smoked for at least one year. | 0: No 1: Yes | 2000, 2007, and 2014 | |
| Household characteristics | Percentage of household food expenditure | Total expenditure on food purchases over the past month, calculated using the following formula: (Total expenditure on food items, including staple foods, vegetables, dried foods, side dishes, seasonings, and other foods)/(Total food expenditure + Non-food expenditure, including electricity, water, fuel, telephone, household needs, recreation, and transportation) × 100% | 0: Good (below 60%) 1: Poor (60%) | 2000, 2007, and 2014 |
| Household asset ownership | Household ownership of valuable assets is an indicator of economic capability, which is converted into monetary terms (Indonesian rupiah). These assets include housing, land, vehicles, savings, jewelry, and electronic goods. | The total asset value, converted into rupiah, was categorized into five quintiles. | 2000, 2007, and 2014 | |
| Place of residence | The location of the household, categorized by urban or rural area. | 0: Rural 1: Urban | 2000, 2007, and 2014 | |
| Improved drinking water quality | Improved drinking water sources are defined based on the WHO/UNICEF Joint Monitoring Program (JMP) as those that are likely to be protected from outside contamination, particularly fecal matter. Improved water sources include household connections, public standpipes, boreholes, protected dug wells, protected springs, and rainwater collection. Unimproved water sources include unprotected wells, unprotected springs, surface water (e.g., river, dam, or lake), vendor-provided water, bottled water (unless water for other uses is available from an improved source), and tanker truck-provided water | 0: Yes 1: No | 2000, 2007, and 2014 | |
| Improved Sanitation | Improved sanitation facilities are defined based on the WHO/UNICEF Joint Monitoring Program (JMP) as those that hygienically separate human waste from human contact. Improved sanitation includes flushing or pour-flushing to a piped sewer system, septic tanks, pit latrines, ventilated improved pit latrines, or pit latrines with slab or composting toilets. Shared or public-use sanitation facilities are not improved. Moreover, flushing or pour-flushing elsewhere, pit latrines without slabs or open pits, bucket latrines, hanging latrines, or open defecation are not considered to be improved sanitation. | 0: Yes 1: No | 2000, 2007, and 2014 |
Appendix B
- n = minimum sample size (580 × 2 = 1160)
- Z1−α = Z value at the significance level (one-tailed α = 5%; Z = 1.64)
- Z1−β = Z value corresponding to the statistical power (1 − β = 90%)
- P1 = proportion of stunting among children born to women with one component of the “Four Too” high-risk fertility behavior (44.2%) [49]
- P2 = proportion of stunting among children born to women with more than one component of the “Four Too” high-risk fertility behavior (53.7%) [49]
Appendix C
| Transition Category | 2000–2007 n (%) | 2007–2014 n (%) | 2000–2014 n (%) |
|---|---|---|---|
| Remained normal | 688 (49.1) | 912 (65.1) | 601 (42.9) |
| Height faltering (normal → stunted) | 168 (12.0) | 132 (9.4) | 145 (10.4) |
| Catch-up growth (stunted → normal) | 238 (17.0) | 174 (12.4) | 356 (25.4) |
| Remained stunted | 307 (21.9) | 183 (13.1) | 299 (21.3) |
| Total | 1401 (100) | 1401 (100) | 1401 (100) |
References
- Kar, B.R.; Rao, S.L.; Chandramouli, B.A. Cognitive Development in Children with Chronic Protein Energy Malnutrition. Behav. Brain Funct. 2008, 4, 31. [Google Scholar] [CrossRef] [Scilit]
- Mendez, M.A.; Adair, L.S. Severity and Timing of Stunting in the First Two Years of Life Affect Performance on Cognitive Tests in Late Childhood12. J. Nutr. 1999, 129, 1555–1562. [Google Scholar] [CrossRef] [Scilit]
- Webb, K.; Horton, N.; Katz, D. Parental IQ and Cognitive Development of Malnourished Indonesian Children. Eur. J. Clin. Nutr. 2005, 59, 618–620. [Google Scholar] [CrossRef] [Scilit] [PubMed]
- WHO. Global Nutrition Targets 2025 Policy Brief; WHO: Geneva, Switzerland, 2014. [Google Scholar]
- Kemenkes, R.I. Hasil Survei Status Gizi Indonesia (SSGI) 2022; Kementerian Kesehatan Republik Indonesia: Jakarta, Indonesia, 2023.
- Rutstein, S.; Winter, R.; International, I. The Effects of Fertility Behavior on Child Survival and Child Nutritional Status: Evidence from the Demographic and Health Surveys, 2006 to 2012 [AS37]; USAID: Washington, DC, USA, 2014.
- Gosdin, L.; Martorell, R.; Bartolini, R.M.; Mehta, R.; Srikantiah, S.; Young, M.F. The Co-Occurrence of Anaemia and Stunting in Young Children. Matern. Child Nutr. 2018, 14, e12597. [Google Scholar] [CrossRef] [Scilit] [PubMed]
- Hajizadeh, M.; Nghiem, S. Does Unwanted Pregnancy Lead to Adverse Health and Healthcare Utilization for Mother and Child? Evidence from Low- and Middle-Income Countries. Int. J. Public Health 2020, 65, 457–468. [Google Scholar] [CrossRef] [Scilit] [PubMed]
- Rahman, M.M. Is Unwanted Birth Associated with Child Malnutrition in Bangladesh? Int. Perspect. Sex. Reprod. Health 2015, 41, 80–88. [Google Scholar] [CrossRef] [Scilit] [PubMed]
- Brown, W.; Ahmed, S.; Roche, N.; Sonneveldt, E.; Darmstadt, G.L. Impact of Family Planning Programs in Reducing High-Risk Births Due to Younger and Older Maternal Age, Short Birth Intervals, and High Parity. Semin. Perinatol. 2015, 39, 338–344. [Google Scholar] [CrossRef] [Scilit] [PubMed]
- Singh, P.; Singh, K.K. Trends, Patterns and Predictors of High-Risk Fertility Behaviour among Indian Women: Evidence from National Family Health Survey. BMC Public Health 2024, 24, 626. [Google Scholar] [CrossRef] [Scilit] [PubMed]
- Stover, J.; Ross, J. Changes in the Distribution of High-Risk Births Associated with Changes in Contraceptive Prevalence. BMC Public Health 2013, 13, S4. [Google Scholar] [CrossRef] [Scilit] [PubMed]
- Mulia, R. Determinants of High-Risk Births in Indonesia: Analysis of the 2017 Indonesia Demographic and Health Survey [Determinan Kelahiran Risiko Tinggi di Indonesia: Analisis Data Survei Demografi dan Kesehatan Indonesia Tahun 2017]. Ph.D. Dissertation, Faculty of Public Health, Universitas Indonesia, Depok, Indonesia, 2021. [Google Scholar]
- Rahman, M.; Haque, S.E.; Zahan, S.; Islam, J.; Rahman, M.; Asaduzzaman, M.D.; Haque, N.; Islam, A.Z.; Huda, D.; Mostofa, G. Maternal High-Risk Fertility Behavior and Association with Chronic Undernutrition among Children under Age 5 y in India, Bangladesh, and Nepal: Do Poor Children Have a Higher Risk? Nutrition 2018, 49, 32–40. [Google Scholar] [CrossRef] [Scilit] [PubMed]
- Tamirat, K.S.; Tesema, G.A.; Tessema, Z.T. Determinants of Maternal High-Risk Fertility Behaviors and Its Correlation with Child Stunting and Anemia in the East Africa Region: A Pooled Analysis of Nine East African Countries. PLoS ONE 2021, 16, e0253736. [Google Scholar] [CrossRef] [Scilit] [PubMed]
- Dewey, K.G.; Cohen, R.J. Does Birth Spacing Affect Maternal or Child Nutritional Status? A Systematic Literature Review. Matern. Child Nutr. 2007, 3, 151–173. [Google Scholar] [CrossRef] [Scilit] [PubMed]
- Shahjada, A.; Sharma, B.K.; Sharma, S.; Mahashabde, P.; Bachhotiya, A. Effects of Birth Interval on Nutritional Status of under Five Children in Periurban Area of Madhya Pradesh, India. Int. J. Med. Sci. Public Health 2014, 3, 723–726. [Google Scholar] [CrossRef] [Scilit]
- Seidu, A.A.; Hagan Jnr, J.E.; Budu, E.; Aboagye, R.G.; Okyere, J.; Sakyi, B.; Adu, C.; Ahinkorah, B.O. High-Risk Fertility Behaviour and Undernutrition among Children under-Five in Sub-Saharan Africa: A Cross-Sectional Study. BMJ Open 2023, 13, e066543. [Google Scholar] [CrossRef] [Scilit] [PubMed]
- Sethi, V.; Lakhara, K.; Kumar, D.; Maiti, K.D.; Bhattacharjee, S.; Dev, V.K.; Ahuja, A.; Sareen, N.; Agrawal, S. Severity and Determinants of Stunting in Children under Age 2 Years in Odisha (India): A Tribal v/s Non-Tribal Analysis. Asian Ethn. 2018, 19, 489–508. [Google Scholar] [CrossRef] [Scilit]
- Nankinga, O.; Kwagala, B.; Walakira, E.J. Maternal Employment and Child Nutritional Status in Uganda. PLoS ONE 2019, 14, e0226720. [Google Scholar] [CrossRef] [Scilit] [PubMed]
- Mtongwa, R.H.; Festo, C.; Elisaria, E. A Comparative Analysis of Determinants of Low Birth Weight and Stunting among under Five Children of Adolescent and Non-Adolescent Mothers Using 2015/16 Tanzania Demographic and Health Survey (TDHS). BMC Nutr. 2021, 7, 64. [Google Scholar] [CrossRef] [Scilit] [PubMed]
- Kusrini, I.; Laksono, A.D. Regional Disparities of Stunted Toddler in Indonesia. Indian J. Forensic Med. Toxicol. 2020, 14, 1685–1691. [Google Scholar]
- Rizal Permadi, M.; Hanim, D.; Indarto, D. Early Breastfeeding Initiation And Exclusive Breastfeeding as Risk Factors of Stunting Children 6-24 Months-Old. Penelit. Gizi Dan Makanan 2016, 39, 9–14. [Google Scholar]
- Magvanjav, O.; Undurraga, E.A.; Eisenberg, D.T.A.; Zeng, W.; Dorjgochoo, T.; Leonard, W.R.; Team, T.B.S.; Godoy, R.A. Sibling Composition and Children’s Anthropometric Indicators of Nutritional Status: Evidence from Native Amazonians in Bolivia. Ann. Hum. Biol. 2013, 40, 23–34. [Google Scholar] [PubMed]
- Vitolo, M.R.; Gama, C.M.; Bortolini, G.A.; Campagnolo, P.D.B.; Drachler, M.D.L. Some Risk Factors Associated with Overweight, Stunting and Wasting among Children under 5 Years Old. J. Pediatr. 2008, 84, 251–257. [Google Scholar] [CrossRef] [Scilit]
- Kuswanto, H.; Oktaviana, P.P.; Efendi, F.; Nelwati, N.; Malini, H. Prevalence of and Factors Associated with Female Child Marriage in Indonesia. PLoS ONE 2024, 19, e0305821. [Google Scholar] [CrossRef] [Scilit] [PubMed]
- RAND Corporation; Survey Meter. Indonesia Family Life Survey (IFLS)—Wave 3,4 and 5; RAND: Santa Monica, CA, USA, 2024. [Google Scholar]
- Prendergast, A.J.; Humphrey, J.H. The Stunting Syndrome in Developing Countries. Paediatr. Int. Child Health 2014, 34, 250–265. [Google Scholar] [CrossRef] [Scilit] [PubMed]
- Soliman, A.; De Sanctis, V.; Alaaraj, N.; Ahmed, S.; Alyafei, F.; Hamed, N.; Soliman, N. Early and Long-Term Consequences of Nutritional Stunting: From Childhood to Adulthood. Acta Biomed. 2021, 92, e2021168. [Google Scholar] [CrossRef] [Scilit] [PubMed]
- Gausman, J.; Kim, R.; Subramanian, S.V. Stunting Trajectories from Post-Infancy to Adolescence in Ethiopia, India, Peru, and Vietnam. Matern. Child Nutr. 2019, 15, e12835. [Google Scholar] [CrossRef] [Scilit] [PubMed]
- Svefors, P.; Rahman, A.; Ekström, E.C.; Khan, A.I.; Lindström, E.; Persson, L.Å.; Selling, K.E. Stunted at 10 Years. Linear Growth Trajectories and Stunting from Birth to Pre-Adolescence in a Rural Bangladeshi Cohort. PLoS ONE 2016, 11, e0149700. [Google Scholar] [CrossRef] [Scilit] [PubMed]
- Akombi, B.J.; Agho, K.E.; Hall, J.J.; Wali, N.; Renzaho, A.M.N.; Merom, D. Stunting, Wasting and Underweight in Sub-Saharan Africa: A Systematic Review. Int. J. Environ. Res. Public Health 2017, 14, 863. [Google Scholar] [CrossRef] [Scilit] [PubMed]
- Wamani, H.; Åstrøm, A.N.; Peterson, S.; Tumwine, J.K.; Tylleskär, T. Boys Are More Stunted than Girls in Sub-Saharan Africa: A Meta-Analysis of 16 Demographic and Health Surveys. BMC Pediatr. 2007, 7, 17. [Google Scholar] [CrossRef] [Scilit] [PubMed]
- Thurstans, S.; Opondo, C.; Seal, A.; Wells, J.; Khara, T.; Dolan, C.; Briend, A.; Myatt, M.; Garenne, M.; Sear, R.; et al. Boys Are More Likely to Be Undernourished than Girls: A Systematic Review and Meta-Analysis of Sex Differences in Undernutrition. BMJ Glob. Health 2020, 5, e004030. [Google Scholar] [CrossRef] [Scilit] [PubMed]
- Asresie, M.B.; Dagnew, G.W. Association of Maternal High-Risk Fertility Behavior and under-Five Mortality in Ethiopia: Community-Based Survey. PLoS ONE 2022, 17, e0267802. [Google Scholar] [CrossRef] [Scilit] [PubMed]
- Bolarinwa, O.A.; Hajjar, J.M.; Alawode, O.A.; Ajayi, K.V.; Roberts, A.T.; Yaya, S. Multiple High-Risk Fertility Behaviours and Children under Five Mortality Survivors among Ever-Married Women of Reproductive Age in Nigeria. Arch. Public Health 2023, 81, 175. [Google Scholar] [CrossRef] [Scilit] [PubMed]
- Conde-Agudelo, A.; Rosas-Bermudez, A.; Castaño, F.; Norton, M.H. Effects of Birth Spacing on Maternal, Perinatal, Infant, and Child Health: A Systematic Review of Causal Mechanisms. Stud. Fam. Plan. 2012, 43, 93–114. [Google Scholar] [CrossRef] [Scilit] [PubMed]
- Karra, M. Assessing the Impact of Birth on Child Health Trajectories; Boston University: Boston, MA, USA, 2018. [Google Scholar]
- Addo, O.Y.; Stein, A.D.; Fall, C.H.; Gigante, D.P.; Guntupalli, A.M.; Horta, B.L.; Kuzawa, C.W.; Lee, N.; Norris, S.A.; Prabhakaran, P. Maternal Height and Child Growth Patterns. J. Pediatr. 2013, 163, 549–554. [Google Scholar] [CrossRef] [Scilit] [PubMed]
- Han, Z.; Lutsiv, O.; Mulla, S.; McDonald, S.D. Maternal Height and the Risk of Preterm Birth and Low Birth Weight: A Systematic Review and Meta-Analyses. J. Obstet. Gynaecol. Can. 2012, 34, 721–746. [Google Scholar] [CrossRef] [Scilit] [PubMed]
- Özaltin, E.; Hill, K.; Subramanian, S.V. Association of Maternal Stature with Offspring Mortality, Underweight, and Stunting in Low- to Middle-Income Countries. JAMA 2010, 303, 1507–1516. [Google Scholar] [CrossRef] [Scilit] [PubMed]
- Likhar, A.; Patil, M.S. Importance of Maternal Nutrition in the First 1,000 Days of Life and Its Effects on Child Development: A Narrative Review. Cureus 2022, 14, e30083. [Google Scholar] [CrossRef] [Scilit] [PubMed]
- Black, R.E.; Victora, C.G.; Walker, S.P.; Bhutta, Z.A.; Christian, P.; de Onis, M.; Ezzati, M.; Grantham-McGregor, S.; Katz, J.; Martorell, R.; et al. Maternal and Child Undernutrition and Overweight in Low-Income and Middle-Income Countries. Lancet 2013, 382, 427–451. [Google Scholar] [CrossRef] [Scilit] [PubMed]
- Seidu, A.A.; Ahinkorah, B.O.; Anjorin, S.S.; Tetteh, J.K.; Hagan, J.E.; Zegeye, B.; Adu-Gyamfi, A.B.; Yaya, S. High-Risk Fertility Behaviours among Women in Sub-Saharan Africa. J. Public Health 2023, 45, 21–31. [Google Scholar] [CrossRef] [Scilit] [PubMed]
- Aryastami, N.K.; Shankar, A.; Kusumawardani, N.; Besral, B.; Jahari, A.B.; Achadi, E. Low Birth Weight Was the Most Dominant Predictor Associated with Stunting among Children Aged 12–23 Months in Indonesia. BMC Nutr. 2017, 3, 16. [Google Scholar] [CrossRef] [Scilit]
- De Silva, I.; Sumarto, S. Child Malnutrition in Indonesia: Can Education, Sanitation and Healthcare Augment the Role of Income? J. Int. Dev. 2018, 30, 837–864. [Google Scholar] [CrossRef] [Scilit]
- Kwami, C.S.; Godfrey, S.; Gavilan, H.; Lakhanpaul, M.; Parikh, P. Water, Sanitation, and Hygiene: Linkages with Stunting in Rural Ethiopia. Int. J. Environ. Res. Public Health 2019, 16, 3793. [Google Scholar] [CrossRef] [Scilit] [PubMed]
- Torlesse, H.; Cronin, A.A.; Sebayang, S.K.; Nandy, R. Determinants of Stunting in Indonesian Children: Evidence from a Cross-Sectional Survey Indicate a Prominent Role for the Water, Sanitation and Hygiene Sector in Stunting Reduction. BMC Public Health 2016, 16, 669. [Google Scholar] [CrossRef] [Scilit] [PubMed]
- Das, M.; Jana, A.; Muhammad, T. Understanding the Associations between Maternal High-Risk Fertility Behaviour and Child Nutrition Levels in India: Evidence from the National Family Health Survey 2015–2016. Sci. Rep. 2022, 12, 17742. [Google Scholar] [CrossRef] [Scilit] [PubMed]


| Variable | n (%) |
|---|---|
| Sex | |
| Male | 741 (52.9) |
| Female | 660 (47.1) |
| Age (months) | |
| <6 | 268 (19.1) |
| 6–11 | 260 (18.6) |
| 12–24 | 462 (33.0) |
| 25–36 | 244 (17.4) |
| 37–59 | 167 (11.9) |
| Birth Weight | |
| Normal (≥2500 g) | 1324 (94.5) |
| Low Birth Weight (LBW) (<2500 g) | 77 (5.5) |
| Preterm Birth | |
| No | 1275 (91.0) |
| Yes | 126 (9.0) |
| Early Initiation of Breastfeeding | |
| Yes | 1374 (98.1) |
| No | 27 (1.9) |
| Exclusive Breastfeeding | |
| Yes | 128 (9.1) |
| No | 1273 (90.9) |
| Health History | |
| Diarrhea | 249 (17.8) |
| Acute respiratory tract infection (ARI) | 976 (69.7) |
| Infectious disease (e.g., fever) | 1079 (77.0) |
| Outpatient Visits | |
| No | 964 (68.8) |
| Yes | 437 (31.2) |
| Delivery Assistance | |
| Obstetrician | 148 (10.6) |
| Midwife | 724 (51.7) |
| Traditional Birth Attendant/Other | 529 (37.8) |
| Delivery Facility | |
| Government Hospital | 98 (7.0) |
| Private Hospital | 74 (5.3) |
| Maternity Clinic | 447 (31.9) |
| Community Health Center | 66 (4.7) |
| Home/Traditional Attendant | 716 (51.1) |
| Variable | IFLS 2007 | IFLS 2014 |
|---|---|---|
| Food consumption score | ||
| Poor (<35) | 260 (18.6%) | 509 (36.3%) |
| Good (≥35) | 1 141 (81.4%) | 892 (63.7%) |
| Physical activity | ||
| Adequate | 314 (22.4%) | 607 (43.3%) |
| Inadequate | 1087 (77.6%) | 794 (56.7%) |
| Smoking habits | ||
| No | - | 1263 (90.2%) |
| Yes | - | 138 (9.9%) |
| Variables | IFLS 2000 | IFLS 2007 | IFLS 2014 |
|---|---|---|---|
| Father’s Employment | |||
| Unemployed | 22 (1.6) | 103 (7.4) | 145 (10.4) |
| Employed | 1379 (98.4) | 1298 (92.6) | 1256 (89.6) |
| Father’s Education | |||
| High School/College | 520 (37.1) | 520 (37.1) | 520 (37.1) |
| ≤Junior High School | 881 (62.9) | 881 (62.9) | 881 (62.9) |
| Father’s Smoking | |||
| No | 458 (32.7) | 405 (28.9) | 428 (30.6) |
| Yes | 943 (67.3) | 996 (71.1) | 973 (69.5) |
| Mother’s Employment | |||
| Unemployed | 882 (63.0) | 840 (60.0) | 731 (52.2) |
| Employed | 519 (37.0) | 561 (40.0) | 670 (47.8) |
| Mother’s Education | |||
| High School/College | 436 (31.1) | 436 (31.1) | 436 (31.1) |
| ≤Junior High School | 965 (68.9) | 965 (68.9) | 965 (68.9) |
| Maternal Height | |||
| At least 150 cm | 616 (44.0) | 579 (41.3) | 575 (41.0) |
| <150 cm | 785 (56.0) | 822 (58.7) | 826 (59.0) |
| Household Characteristics | |||
| Residence | |||
| Urban | 637 (45.5) | 726 (51.8) | 868 (62.0) |
| Rural | 764 (54.5) | 675 (48.2) | 533 (38.0) |
| Food expenditure ratio | |||
| <60% (Good) | 516 (36.8) | 813 (58.0) | 1084 (77.4) |
| ≥60% (Poor) | 885 (63.2) | 588 (42.0) | 317 (22.6) |
| Asset Quintile | |||
| Quintile 1 (Lowest) | 309 (22.1) | 218 (15.6) | 254 (18.1) |
| Quintile 2 | 267 (19.1) | 278 (19.8) | 264 (18.8) |
| Quintile 3 | 287 (20.5) | 317 (22.6) | 284 (20.3) |
| Quintile 4 | 275 (19.6) | 316 (22.6) | 305 (21.8) |
| Quintile 5 (highest) | 263 (18.8) | 272 (19.4) | 294 (21.0) |
| Sanitation | |||
| Improved | 885 (63.2) | 1041 (74.3) | 1156 (82.5) |
| Unimproved | 516 (36.8) | 360 (25.7) | 245 (17.5) |
| Drinking water source | |||
| Improved | 1241 (88.6) | 1251 (89.3) | 1278 (91.2) |
| Unimproved | 160 (11.4) | 150 (10.7) | 123 (8.8) |
| Characteristics | n (%) |
|---|---|
| Maternal Age at Birth (MAA) | |
| 20–35 years | 1089 (77.7) |
| Too Early (<20 years) | 178 (12.7) |
| Too Late (>35 years) | 134 (9.6) |
| Parity | |
| <4 children | 1174 (83.8) |
| Too Many (≥4 children) | 227 (16.2) |
| Birth Interval | |
| Minimum of 24 months | 1306 (93.2) |
| Too Close (<24 months) | 95 (6.8) |
| High-Risk Birth Status | |
| No risk factors | 895 (63.9) |
| At least 1 risk factor | 506 (36.1) |
| Number of Risk Factors | |
| 0 | 895 (63.9) |
| 1 | 384 (27.4) |
| At least 2 | 122 (8.7) |
| Variables | Null Model | Model 4 (Child Factors) | Model 4a (+Parental) | Model 4b (+Socioeconomic) | Model 4c (+Physical Activity/FCS) | Model 4d (Full) |
|---|---|---|---|---|---|---|
| Fixed effects (OR, 95% CI) | ||||||
| Intercept | 0.43 *** (0.39–0.47) | 0.28 *** (0.17–0.45) | 0.25 *** (0.14–0.47) | 0.29 *** (0.15–0.58) | 0.22 *** (0.11–0.45) | 0.23 *** (0.11–0.47) |
| Four Toos | ||||||
| Maternal age (<20 vs. 20–35 years) | - | 1.10 (0.86–1.40) | 1.09 (0.86–1.38) | 1.01 (0.79–1.30) | 1.03 (0.80–1.31) | 1.03 (0.81–1.32) |
| Maternal age (>35 years vs. 20–35 years) | - | 0.87 (0.63–1.18) | 0.85 (0.63–1.16) | 0.88 (0.64–1.21) | 0.88 (0.64–1.20) | 0.88 (0.64–1.20) |
| Birth interval (<24 months) | - | 1.63 ** (1.21–2.20) | 1.63 ** (1.21–2.19) | 1.61 ** (1.19–2.19) | 1.59 ** (1.17–2.16) | 1.60 ** (1.18–2.16) |
| Parity (≥4) | - | 1.18 (0.92–1.52) | 1.20 (0.93–1.54) | 1.16 (0.90–1.49) | 1.15 (0.89–1.48) | 1.15 (0.89–1.48) |
| Child factors | ||||||
| Age group (months) | ||||||
| <6 | Ref | |||||
| 6–11 | - | 1.23 (0.93–1.61) | 1.21 (0.92–1.59) | 1.20 (0.91–1.59) | 1.26 (0.96–1.67) | 1.27 (0.96–1.68) |
| 12–24 | - | 1.93 ** (1.51–2.45) | 1.92 ** (1.51–2.44) | 1.94 ** (1.52–2.47) | 2.11 ** (1.64–2.71) | 2.13 ** (1.66–2.75) |
| 25–36 | - | 2.01 ** (1.53–2.64) | 1.98 ** (1.51–2.59) | 2.00 ** (1.52–2.62) | 2.18 ** (1.64–2.88) | 2.21 ** (1.66–2.92) |
| 37–59 | - | 1.61 (1.19–2.17) | 1.57 (1.17–2.12) | 1.62 (1.20–2.20) | 1.79** (1.31–2.44) | 1.81 ** (1.33–2.48) |
| Female (sex) | - | 0.82 ** (0.70–0.96) | 0.83 ** (0.71–0.97) | 0.84 ** (0.71–0.98) | 0.84 ** (0.71–0.98) | 0.82 ** (0.69–0.96) |
| Low birth weight (yes) | - | 1.69 (1.20–2.39) | 1.61 (1.15–2.27) | 1.56 (1.11–2.21) | 1.55 (1.09–2.19) | 1.55 (1.10–2.20) |
| Parental factors | ||||||
| Maternal height (<150 cm) | - | - | 1.53 ** (1.31–1.79) | 1.50 ** (1.28–1.76) | 1.51 ** (1.28–1.77) | 1.50 ** (1.28–1.76) |
| Socioeconomic & environmental Factors | ||||||
| Unimproved sanitation | - | - | - | 1.36 ** (1.14–1.64) | 1.34 (1.12–1.60) | 1.33 (1.11–1.59) |
| Food expenditure (>60%) | - | - | - | 1.40 ** (1.20–1.65) | 1.38 ** (1.17–1.62) | 1.37 ** (1.16–1.61) |
| Residence (urban) | - | - | - | 0.77 (0.64–0.91) | 0.77 (0.65–0.92) | 0.78 (0.65–0.93) |
| Behavioral factors | ||||||
| Low physical activity | - | - | - | - | 1.23 ** (1.03–1.48) | 1.21 * (1.01–1.46) |
| Smoking | - | - | - | - | - | 0.66 † (0.43–1.03) |
| Random effects | ||||||
| Variance (hhid) | 0.70 | 0.40 | 0.35 | 0.34 | 0.30 | 0.31 |
| Variance (pidlink|hhid) | 0.51 | 0.14 | 0.13 | 0.17 | 0.21 | 0.22 |
| ICC | ||||||
| - hhid | 0.12 | 0.10 | 0.09 | 0.09 | 0.08 | 0.08 |
| - pidlink|hhid | 0.19 | 0.14 | 0.13 | 0.14 | 0.14 | 0.14 |
| Median odds ratio | 2.22 | 1.83 | 1.76 | 1.74 | 1.69 | 1.70 |
| Model statistics | ||||||
| Log likelihood | −2630.38 | −2557.69 | −2542.31 | −2507.68 | −2503.43 | −2501.67 |
| LR test (χ2) | - | 134.19 *** | 161.12 *** | 210.67 *** | 216.39 *** | 218.62 *** |
Disclaimer/Publisher’s Note: The statements, opinions and data contained in all publications are solely those of the individual author(s) and contributor(s) and not of MDPI and/or the editor(s). MDPI and/or the editor(s) disclaim responsibility for any injury to people or property resulting from any ideas, methods, instructions or products referred to in the content. |
© 2026 by the authors. Licensee MDPI, Basel, Switzerland. This article is an open access article distributed under the terms and conditions of the Creative Commons Attribution (CC BY) license.
Share and Cite
Meiyetriani, E.; Utomo, B.; Dariyani, S. Short Birth Intervals and Long-Term Stunting Risk in Indonesian Children: A Retrospective Cohort Study Using the Indonesian Family Life Survey. Nutrients 2026, 18, 2309. https://doi.org/10.3390/nu18142309
Meiyetriani E, Utomo B, Dariyani S. Short Birth Intervals and Long-Term Stunting Risk in Indonesian Children: A Retrospective Cohort Study Using the Indonesian Family Life Survey. Nutrients. 2026; 18(14):2309. https://doi.org/10.3390/nu18142309
Chicago/Turabian StyleMeiyetriani, Eflita, Budi Utomo, and Siti Dariyani. 2026. "Short Birth Intervals and Long-Term Stunting Risk in Indonesian Children: A Retrospective Cohort Study Using the Indonesian Family Life Survey" Nutrients 18, no. 14: 2309. https://doi.org/10.3390/nu18142309
APA StyleMeiyetriani, E., Utomo, B., & Dariyani, S. (2026). Short Birth Intervals and Long-Term Stunting Risk in Indonesian Children: A Retrospective Cohort Study Using the Indonesian Family Life Survey. Nutrients, 18(14), 2309. https://doi.org/10.3390/nu18142309