Selective Gut Microbiota Remodeling Induced by a Traditional Mexican Diet and Exercise Program Improves Metabolic Health and Intestinal Permeability in Adults with Obesity and Affective Symptoms

 ,
,  , , , , , , ,
  and
and
Abstract
1. Introduction
2. Materials and Methods
2.1. Participants
2.2. Structured Weight Loss Program
2.3. Assessment of Depressive and Anxious Symptoms
2.4. Physical Fitness Criteria
2.5. Laboratory Data Collection
2.6. Neurotrophic and Intestinal Permeability Biomarkers
2.7. Stool Sample Collection and DNA Extraction
2.8. Gut Microbiota Analysis
2.9. Bioinformatic and Statistical Analysis
2.10. Statistical Analysis
3. Results
3.1. Effects of the Intervention on Metabolic, Inflammatory, Gut Barrier Integrity, Neurotrophic Biomarkers, and BC
3.2. Gut Microbiota Structure
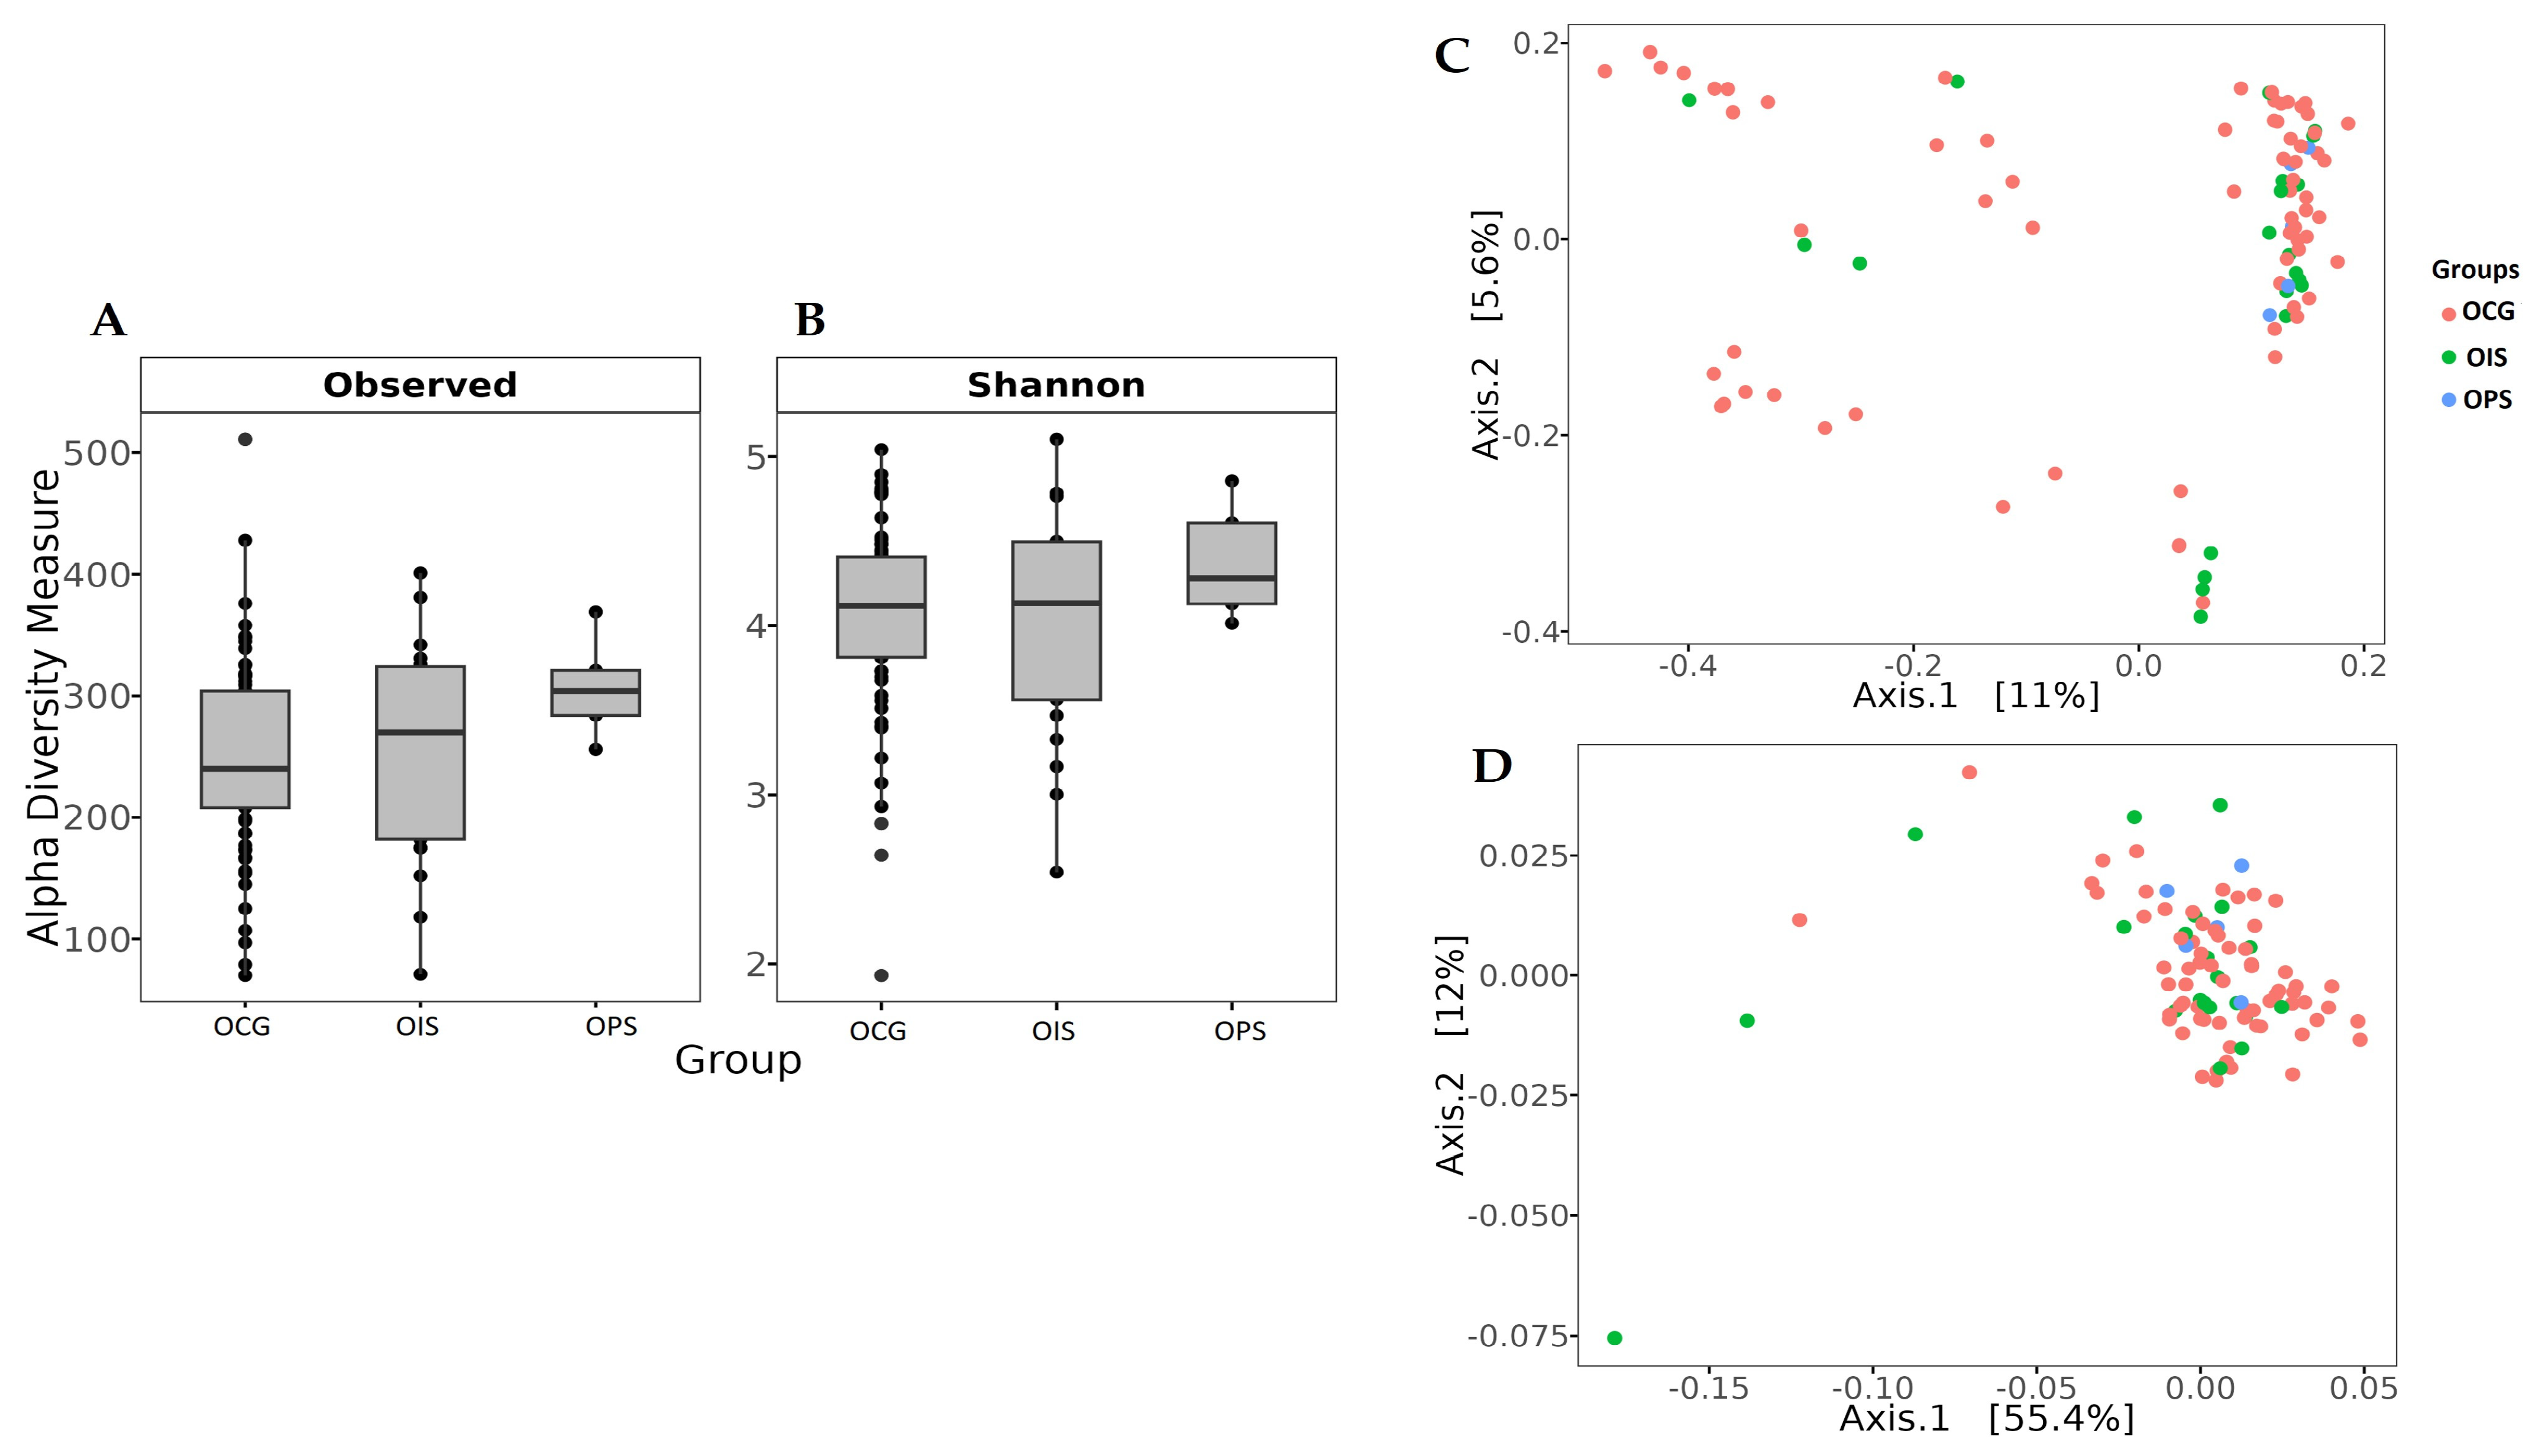
3.2.1. Alpha and Beta Diversity
3.2.2. Effects of the Weight Loss Program on the Overall Composition of the Gut Microbiota
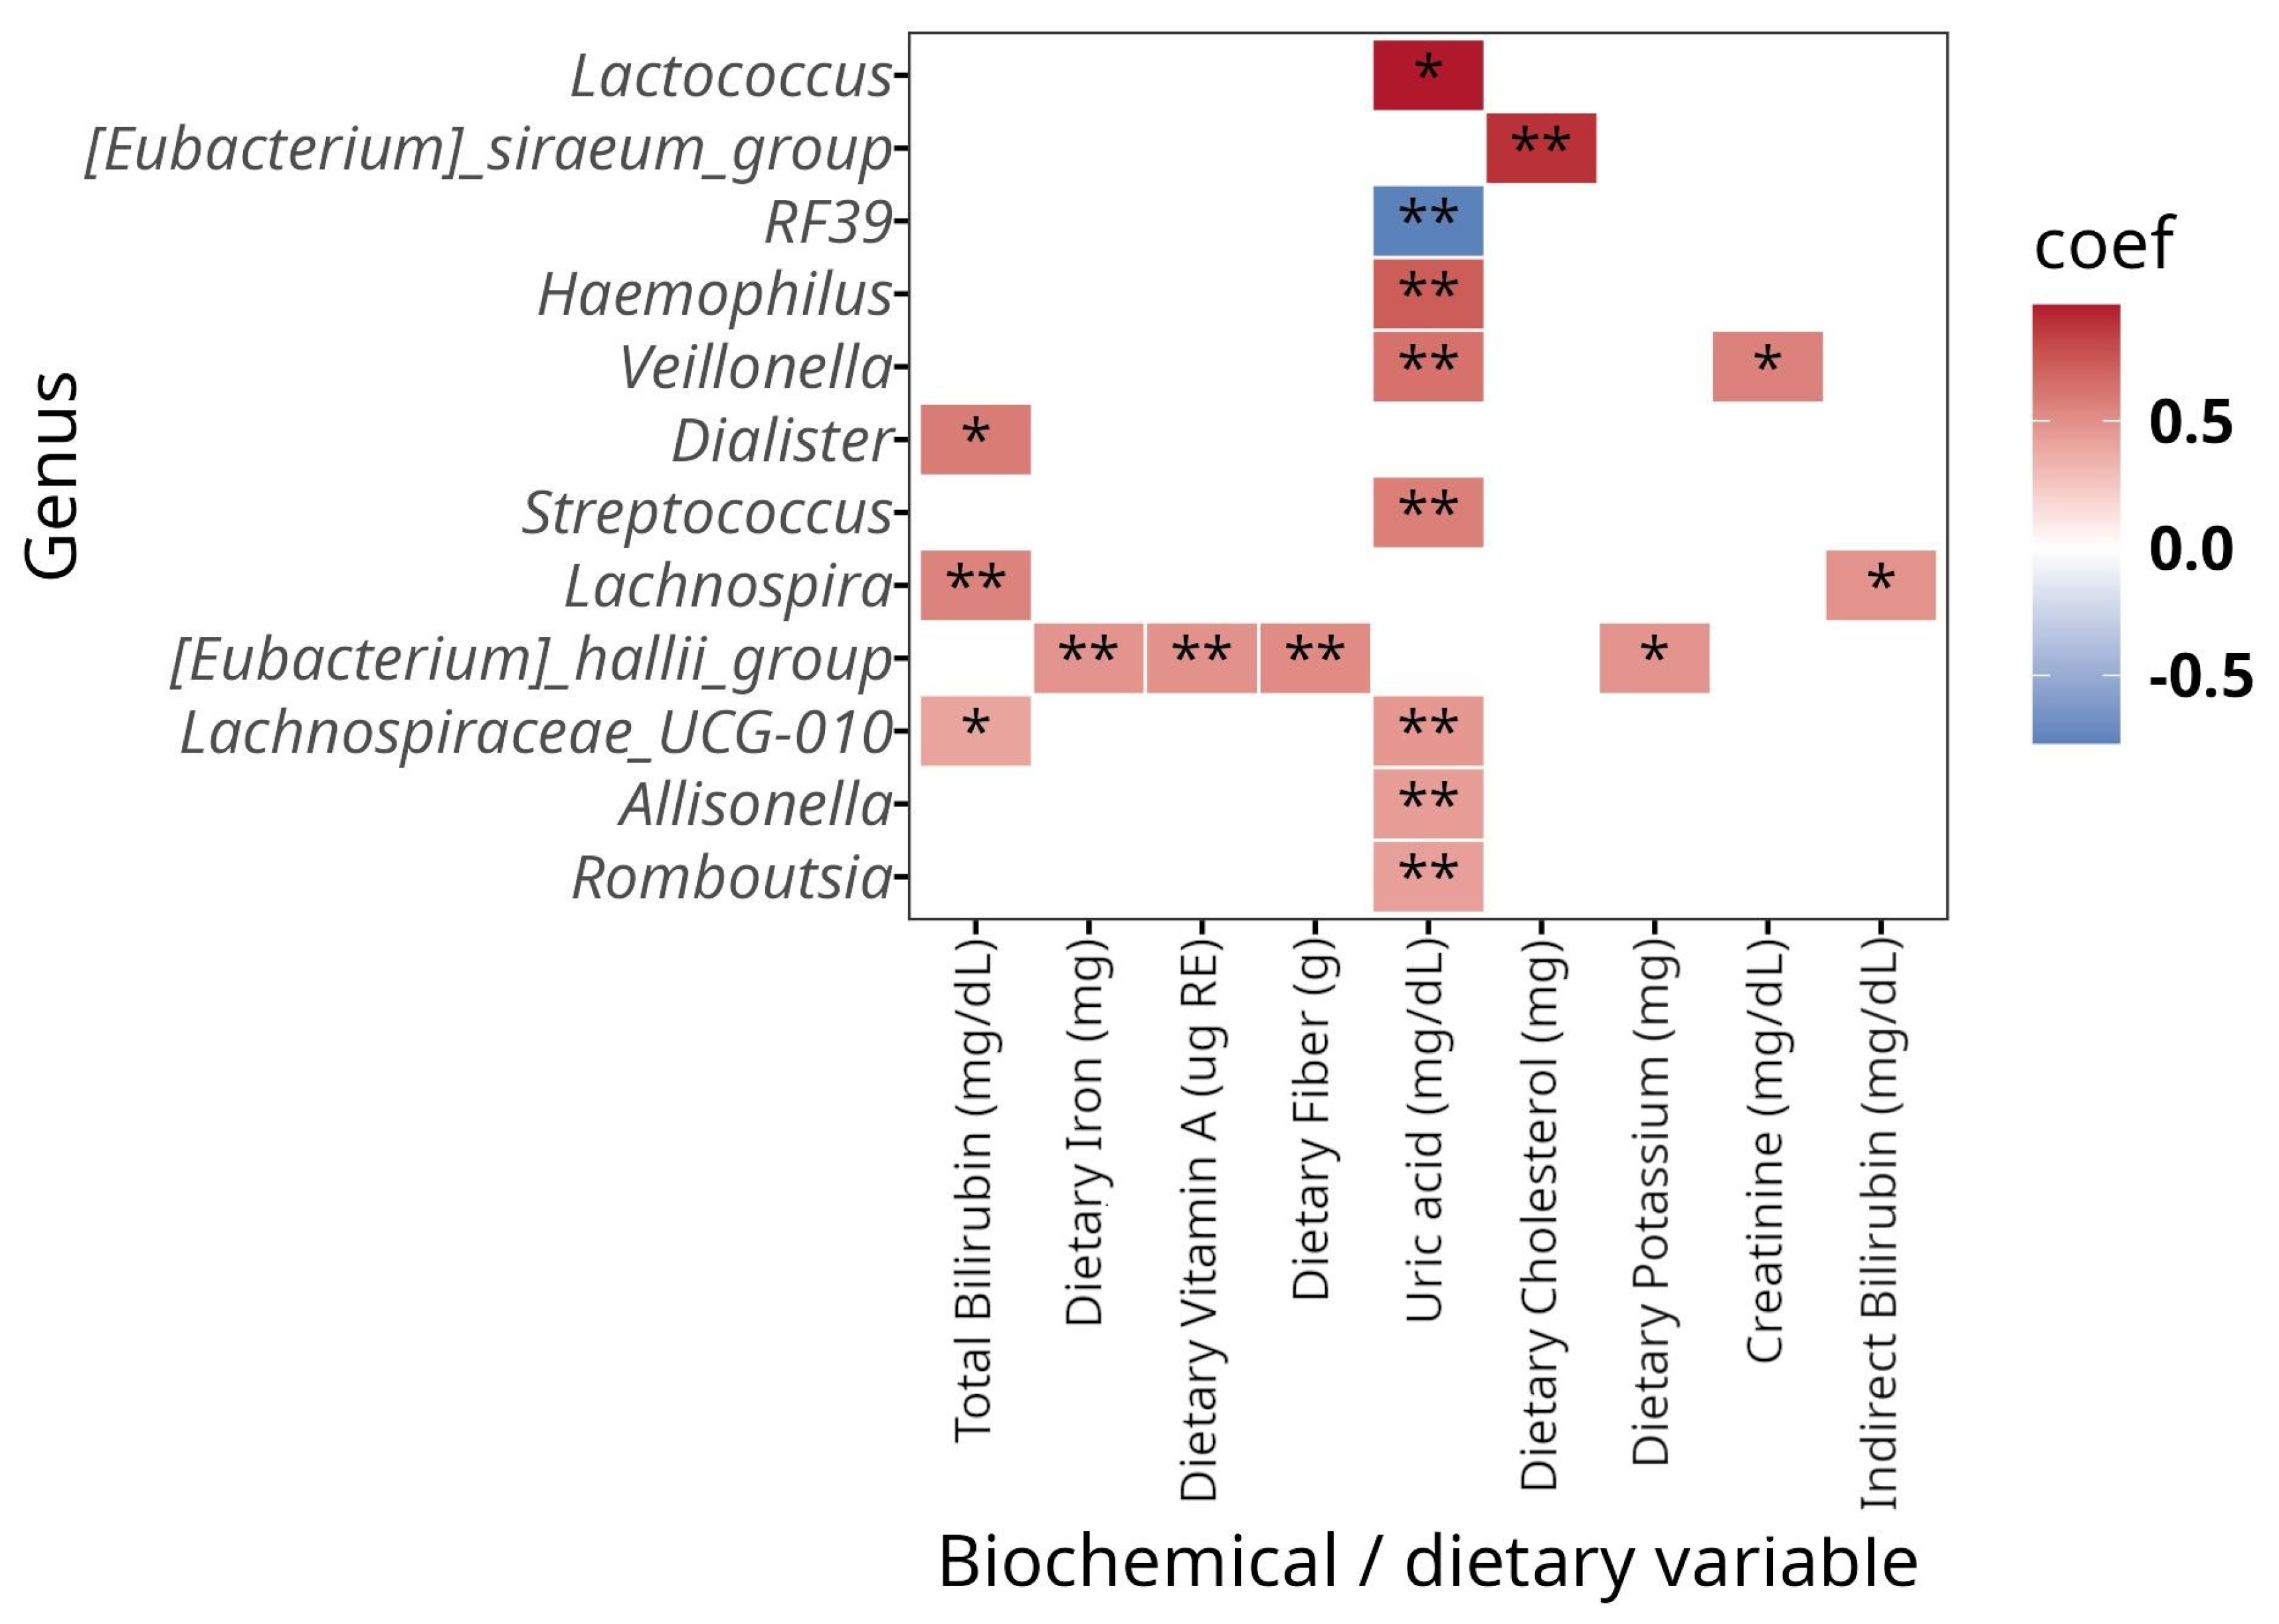
3.2.3. Associations Between Taxonomic Profile and Measured Variables
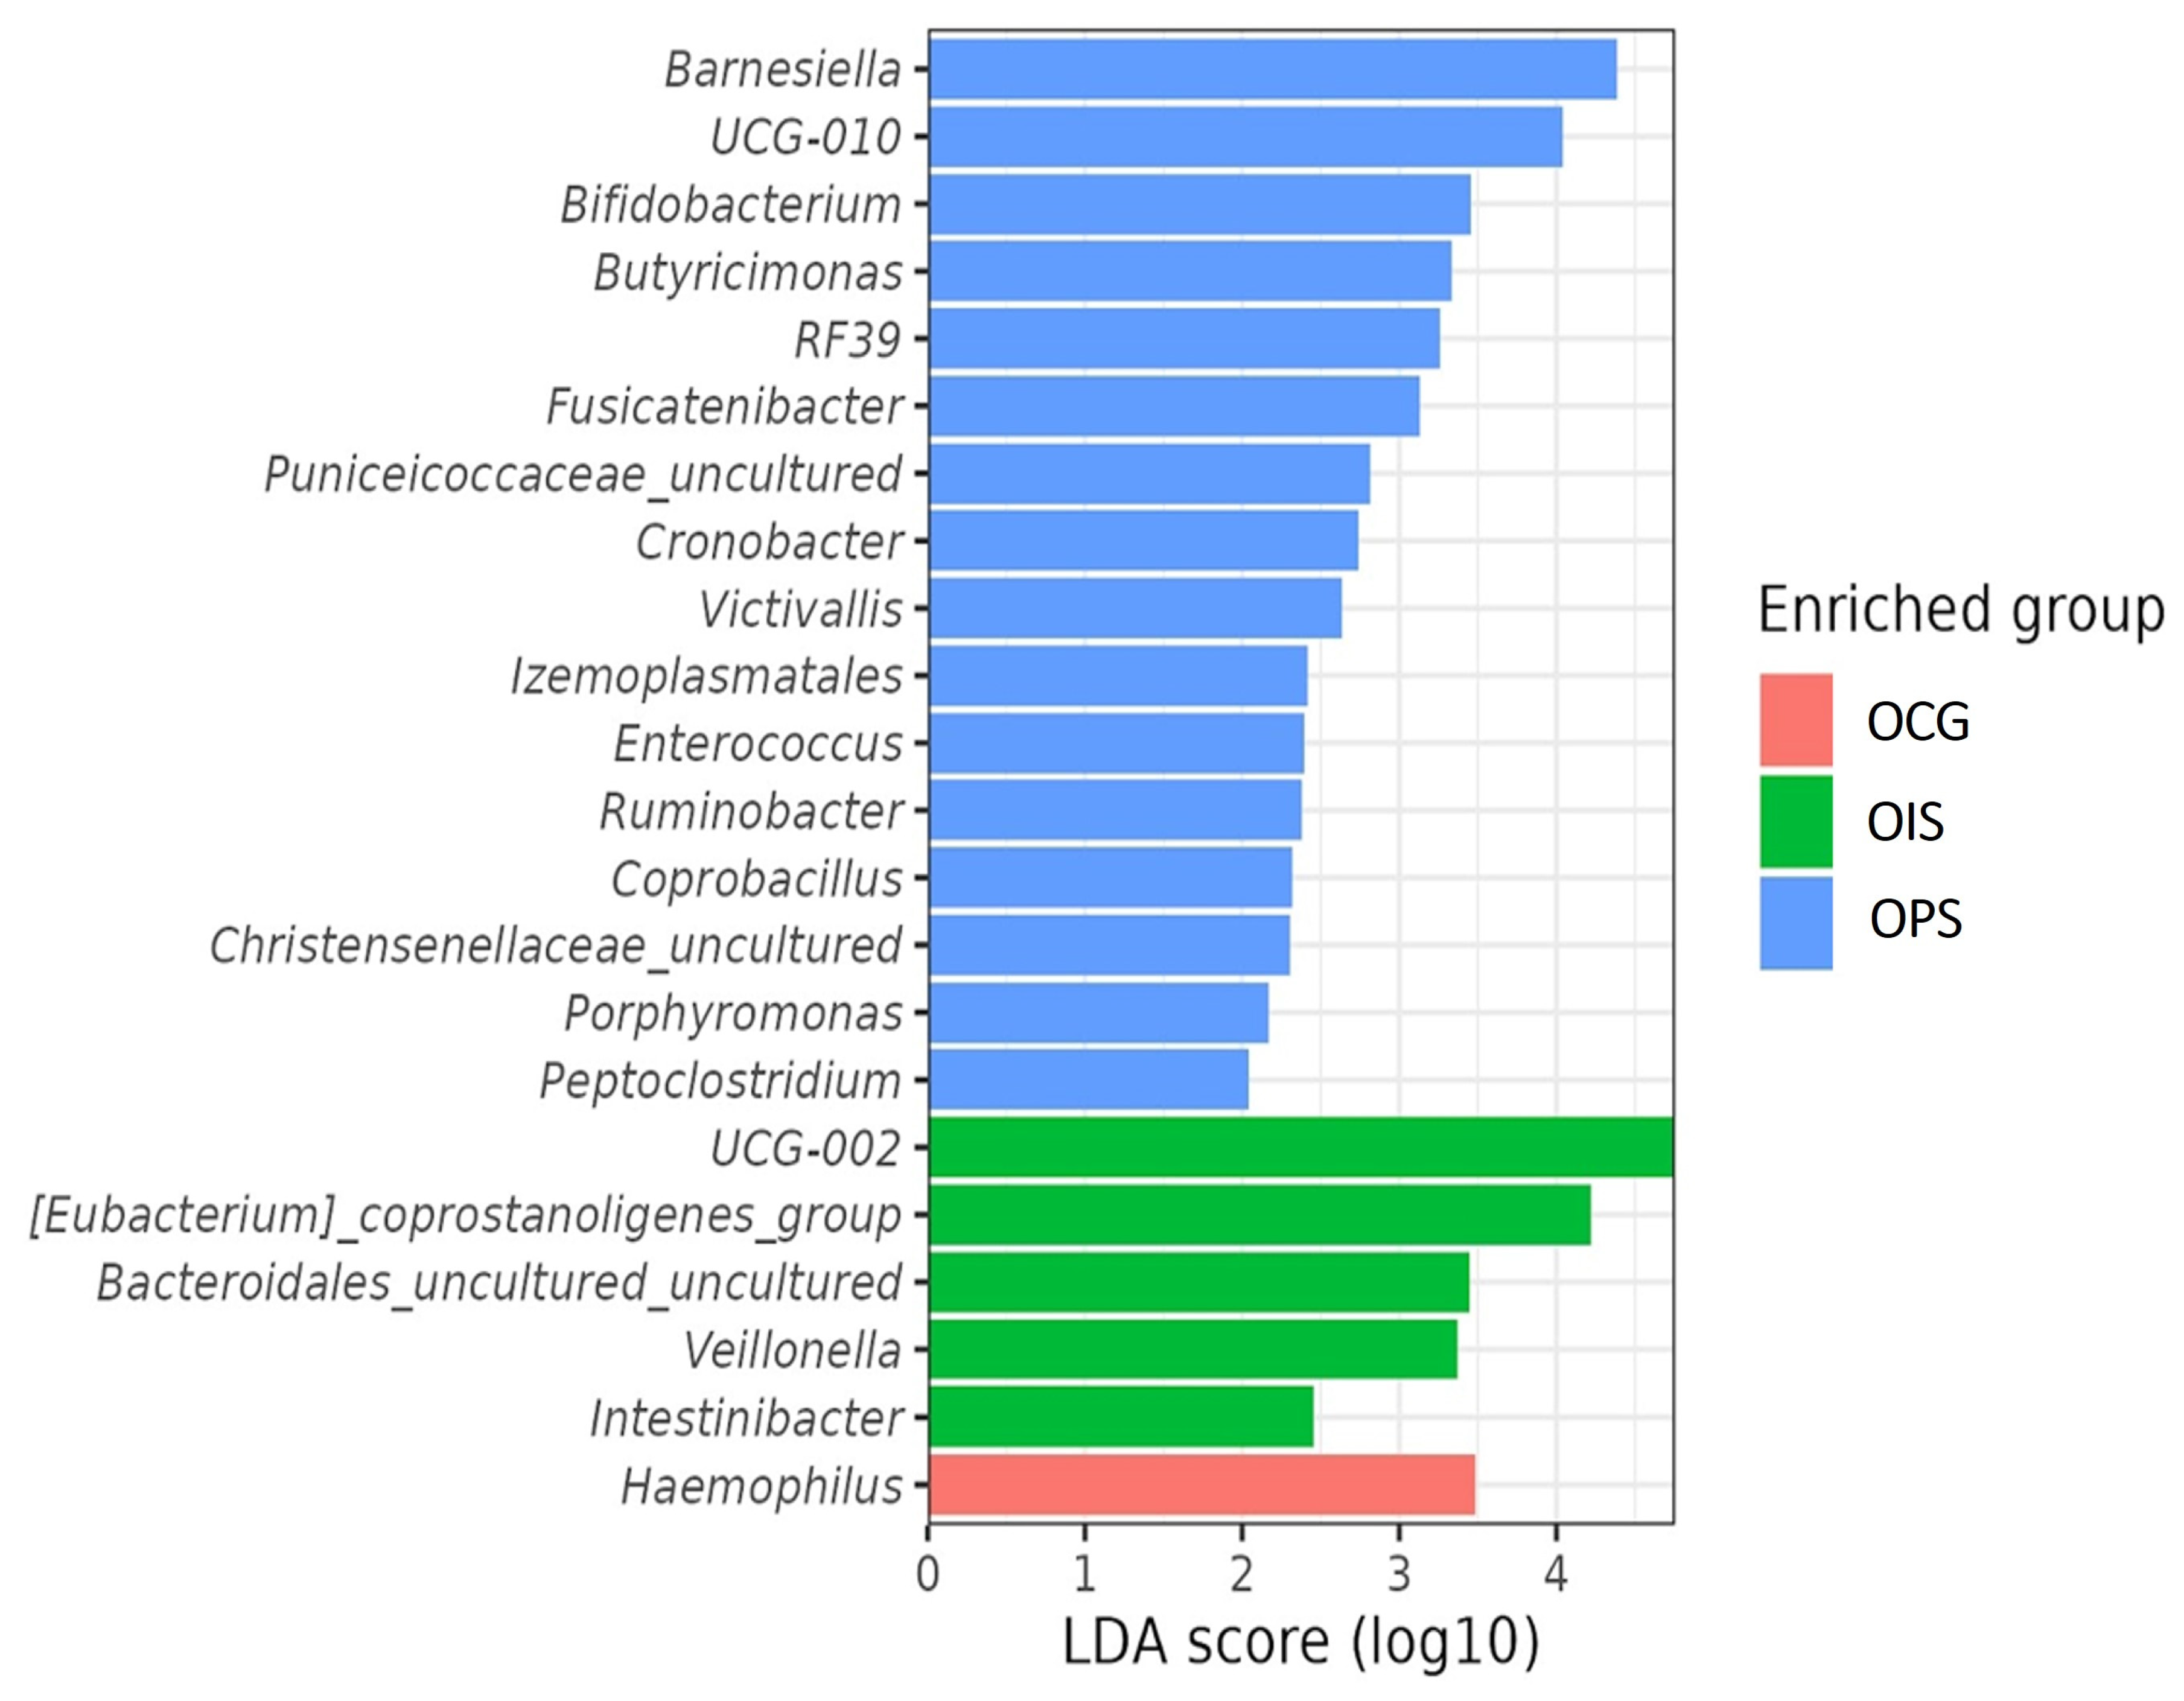
3.2.4. The Weight Loss Program Led to Enriched Taxa That Define Each Group
4. Discussion
5. Conclusions
Author Contributions
Funding
Institutional Review Board Statement
Informed Consent Statement
Data Availability Statement
Acknowledgments
Conflicts of Interest
Abbreviations
| ALT | Alanine aminotransferase |
| AST | Aspartate aminotransferase |
| ASVs | Amplicon sequence variants |
| BAI | Beck Anxiety Inventory |
| BDI | Beck Depression Inventory |
| BC | Body composition |
| BMI | Body mass index |
| BNDF | Brain-derived neurotrophic factor |
| CRP | C-reactive protein |
| FDR | False discovery rate |
| GGT | Gamma-Glutamyl Transferase |
| HPA | Hypothalamic–pituitary–adrenal |
| KYNA | Kynurenic acid |
| KYN | Kynurenine |
| KP | Kynurenine pathway |
| LMMs | Linear Mixed-Effects Models |
| LEfSe | Linear discriminant effect size |
| MACs | Microbiota-accessible carbohydrates |
| MRA | Median relative abundance |
| OCG | Group Control without symptoms |
| OIS | Group with improved symptoms |
| OPS | Group with persistent symptoms |
| OTUs | Operational taxonomic units |
| SCFAs | Short-chain fatty acids |
| SD | Standard deviation |
| TMD | Traditional Mexican diet |
| TRP | Tryptophan |
| WLP | Weight loss program |
Appendix A

| Time Point | Energy Kcal | Prot (g) | Lip (g) | CH (g) | SFA (g) | MFA (g) | PFA (g) | Chol (mg) | Sugar (g) | Fiber (g) | Vit A (µg RE) | Ca (mg) | Iron (mg) | Potassium (mg) | Sodium (mg) |
|---|---|---|---|---|---|---|---|---|---|---|---|---|---|---|---|
| Basal | 2133 | 112 | 70 | 246 | 19 | 20 | 9 | 614 | 37 | 14 | 554 | 842 | 26 | 1496 | 1834 |
| Final | 1426 | 90 | 40 | 176 | 10 | 12 | 6 | 329 | 28 | 24 | 1057 | 914 | 38 | 2591 | 1133 |
Appendix B

Appendix C
| OCG (n = 70) | OIS (n = 20) | OPS (n = 5) | ||||
|---|---|---|---|---|---|---|
| Variable | Before | After | Before | After | Before | After |
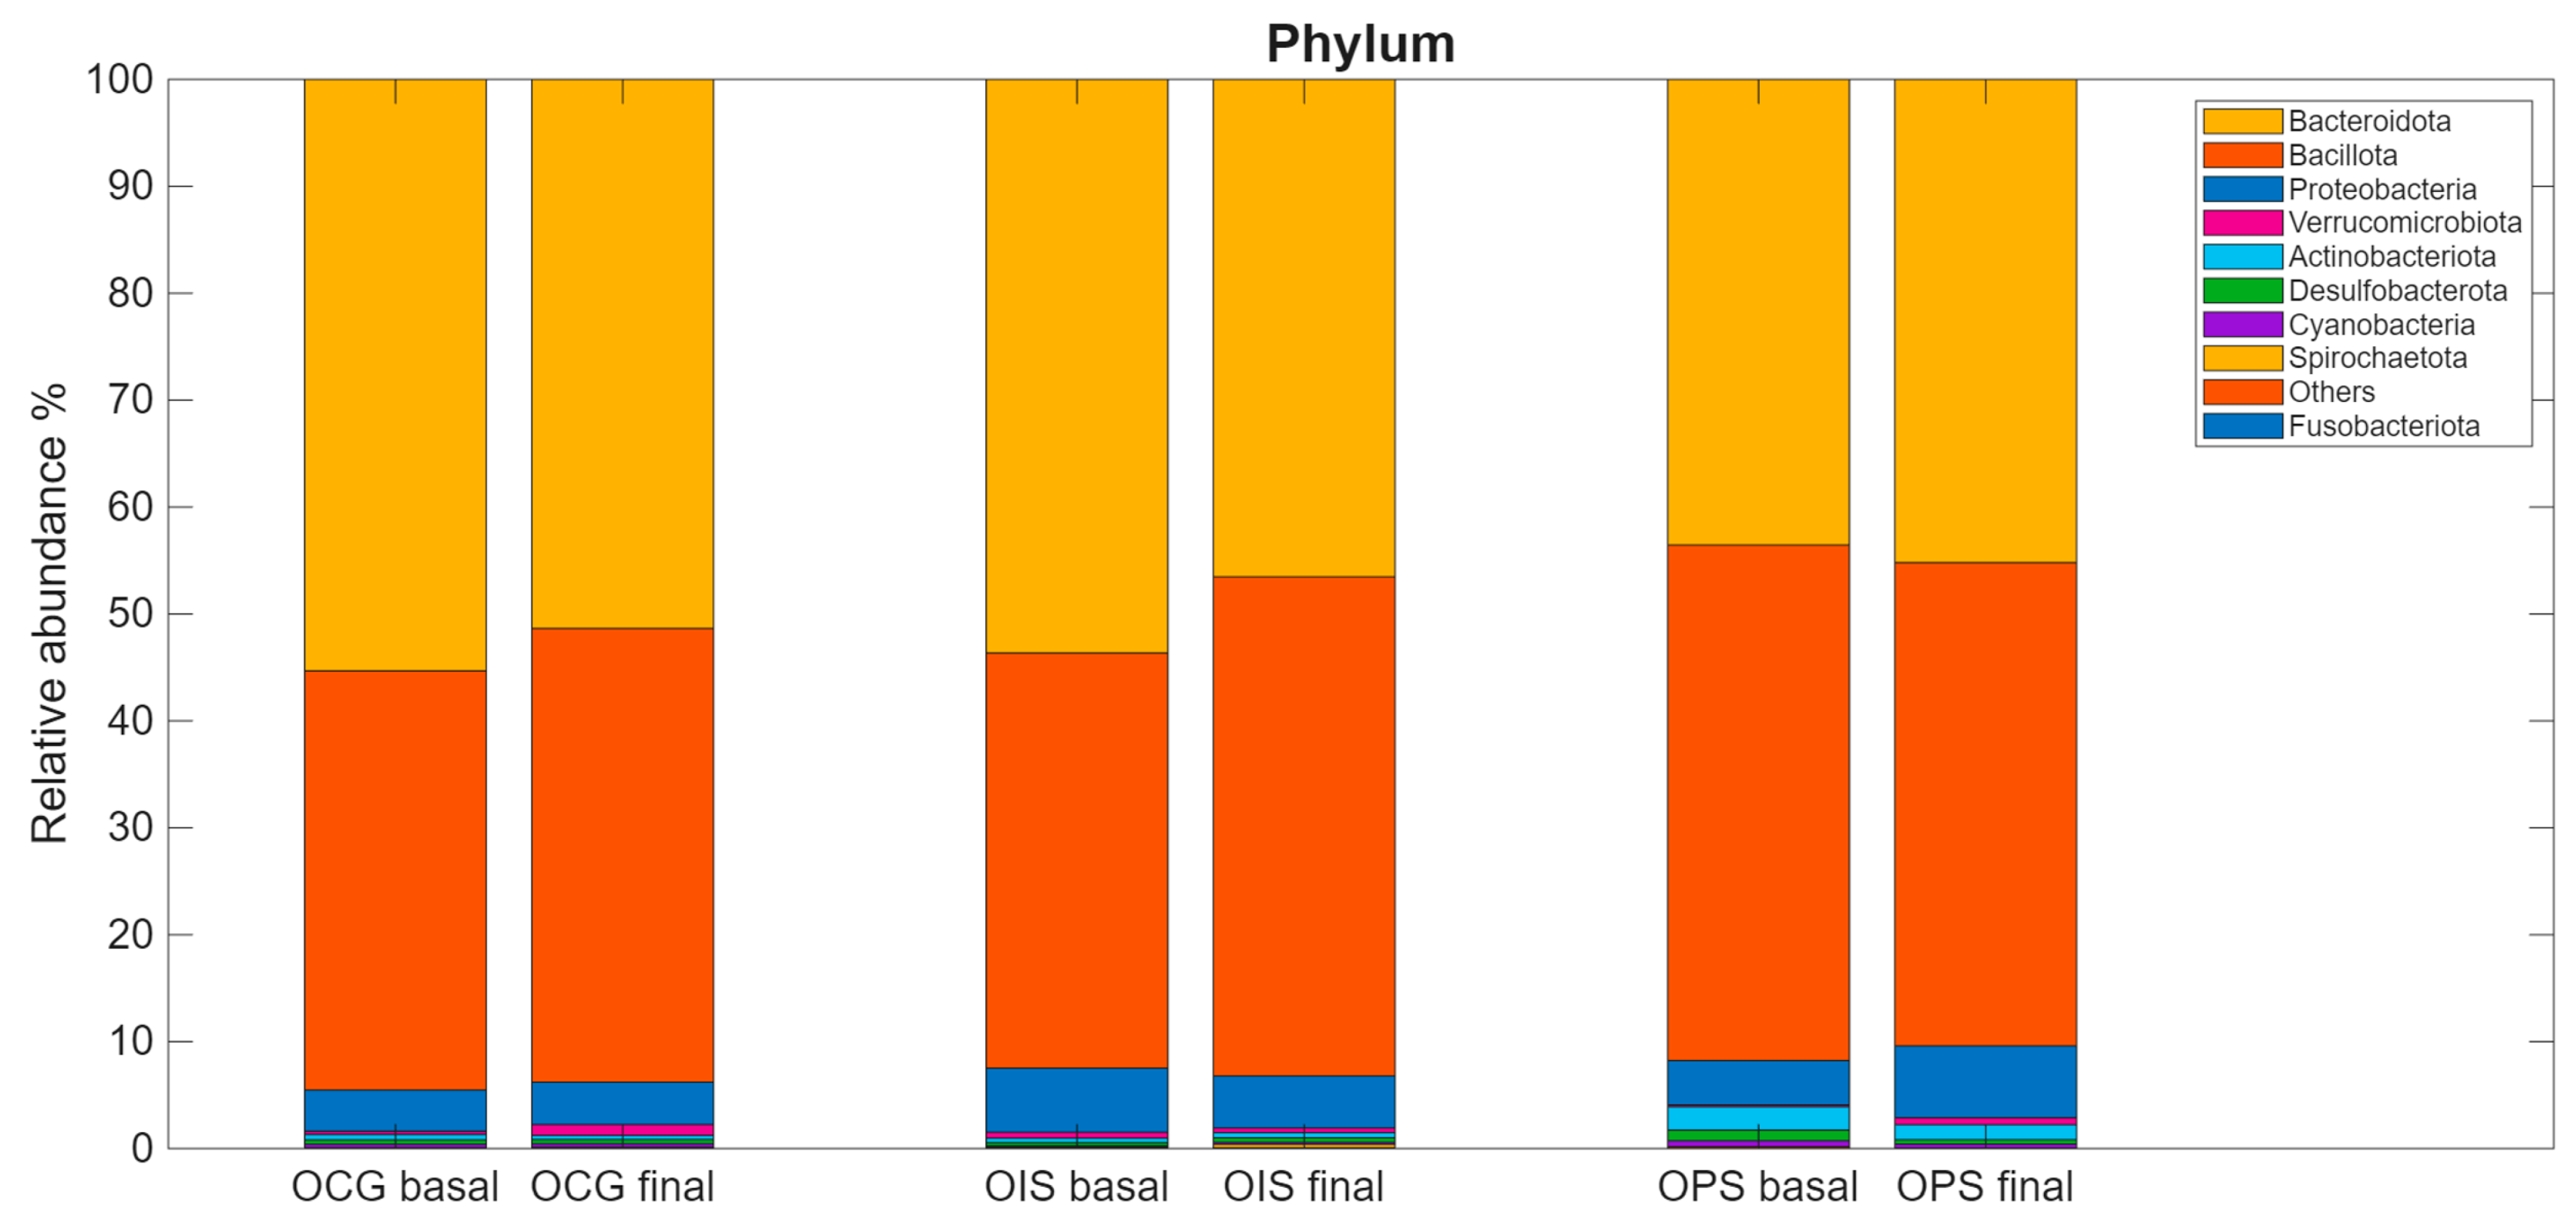
| Bacillota/Bacteroidota | 0.88 (0.69) | 1.53 (3.39) | 0.93 (0.75) | 1.78 (2.93) | 1.24 (0.62) | 1.05 (0.34) |
| Bacteroidota | 55.32 (15.86) | 51.36 (17.15) | 53.65 (18.39) | 46.52 (19.47) | 43.55 (11.57) | 45.2 (10.25) |
| Bacillota | 39.21 (16.17) | 42.43 (18.05) | 38.83 (16.57) | 46.7 (20.51) | 48.22 (14.07) | 45.2 (9.45) |
| Proteobacteria | 3.86 (7.17) | 3.97 (5.2) | 6 (9.47) | 4.86 (6.75) | 4.16 (5.17) | 6.72 (9.98) |
| Verrucomicrobiota | 0.29 (0.88) | 1.02 (3.04) | 0.54 (1.09) | 0.42 (1.22) | 0.17 (0.17) | 0.64 (0.92) |
| Actinobacteriota | 0.52 (0.67) | 0.38 (0.48) | 0.42 (0.62) | 0.49 (0.74) | 2.18 (3.93) | 1.4 (1.14) |
| Desulfobacterota | 0.42 (0.51) | 0.4 (0.71) | 0.31 (0.44) | 0.43 (0.71) | 0.99 (0.85) | 0.41 (0.47) |
| Cyanobacteria | 0.32 (0.99) | 0.31 (0.72) | 0.1 (0.29) | 0.19 (0.35) | 0.56 (0.95) | 0.37 (0.7) |
| Spirochaetota | 0 (0.02) | 0.05 (0.44) | 0.01 (0.02) | 0.31 (0.93) | 0 (0) | 0 (0) |
| Fusobacteriota | 0.02 (0.06) | 0.03 (0.06) | 0.1 (0.25) | 0.01 (0.02) | 0.01 (0.01) | 0.01 (0.01) |
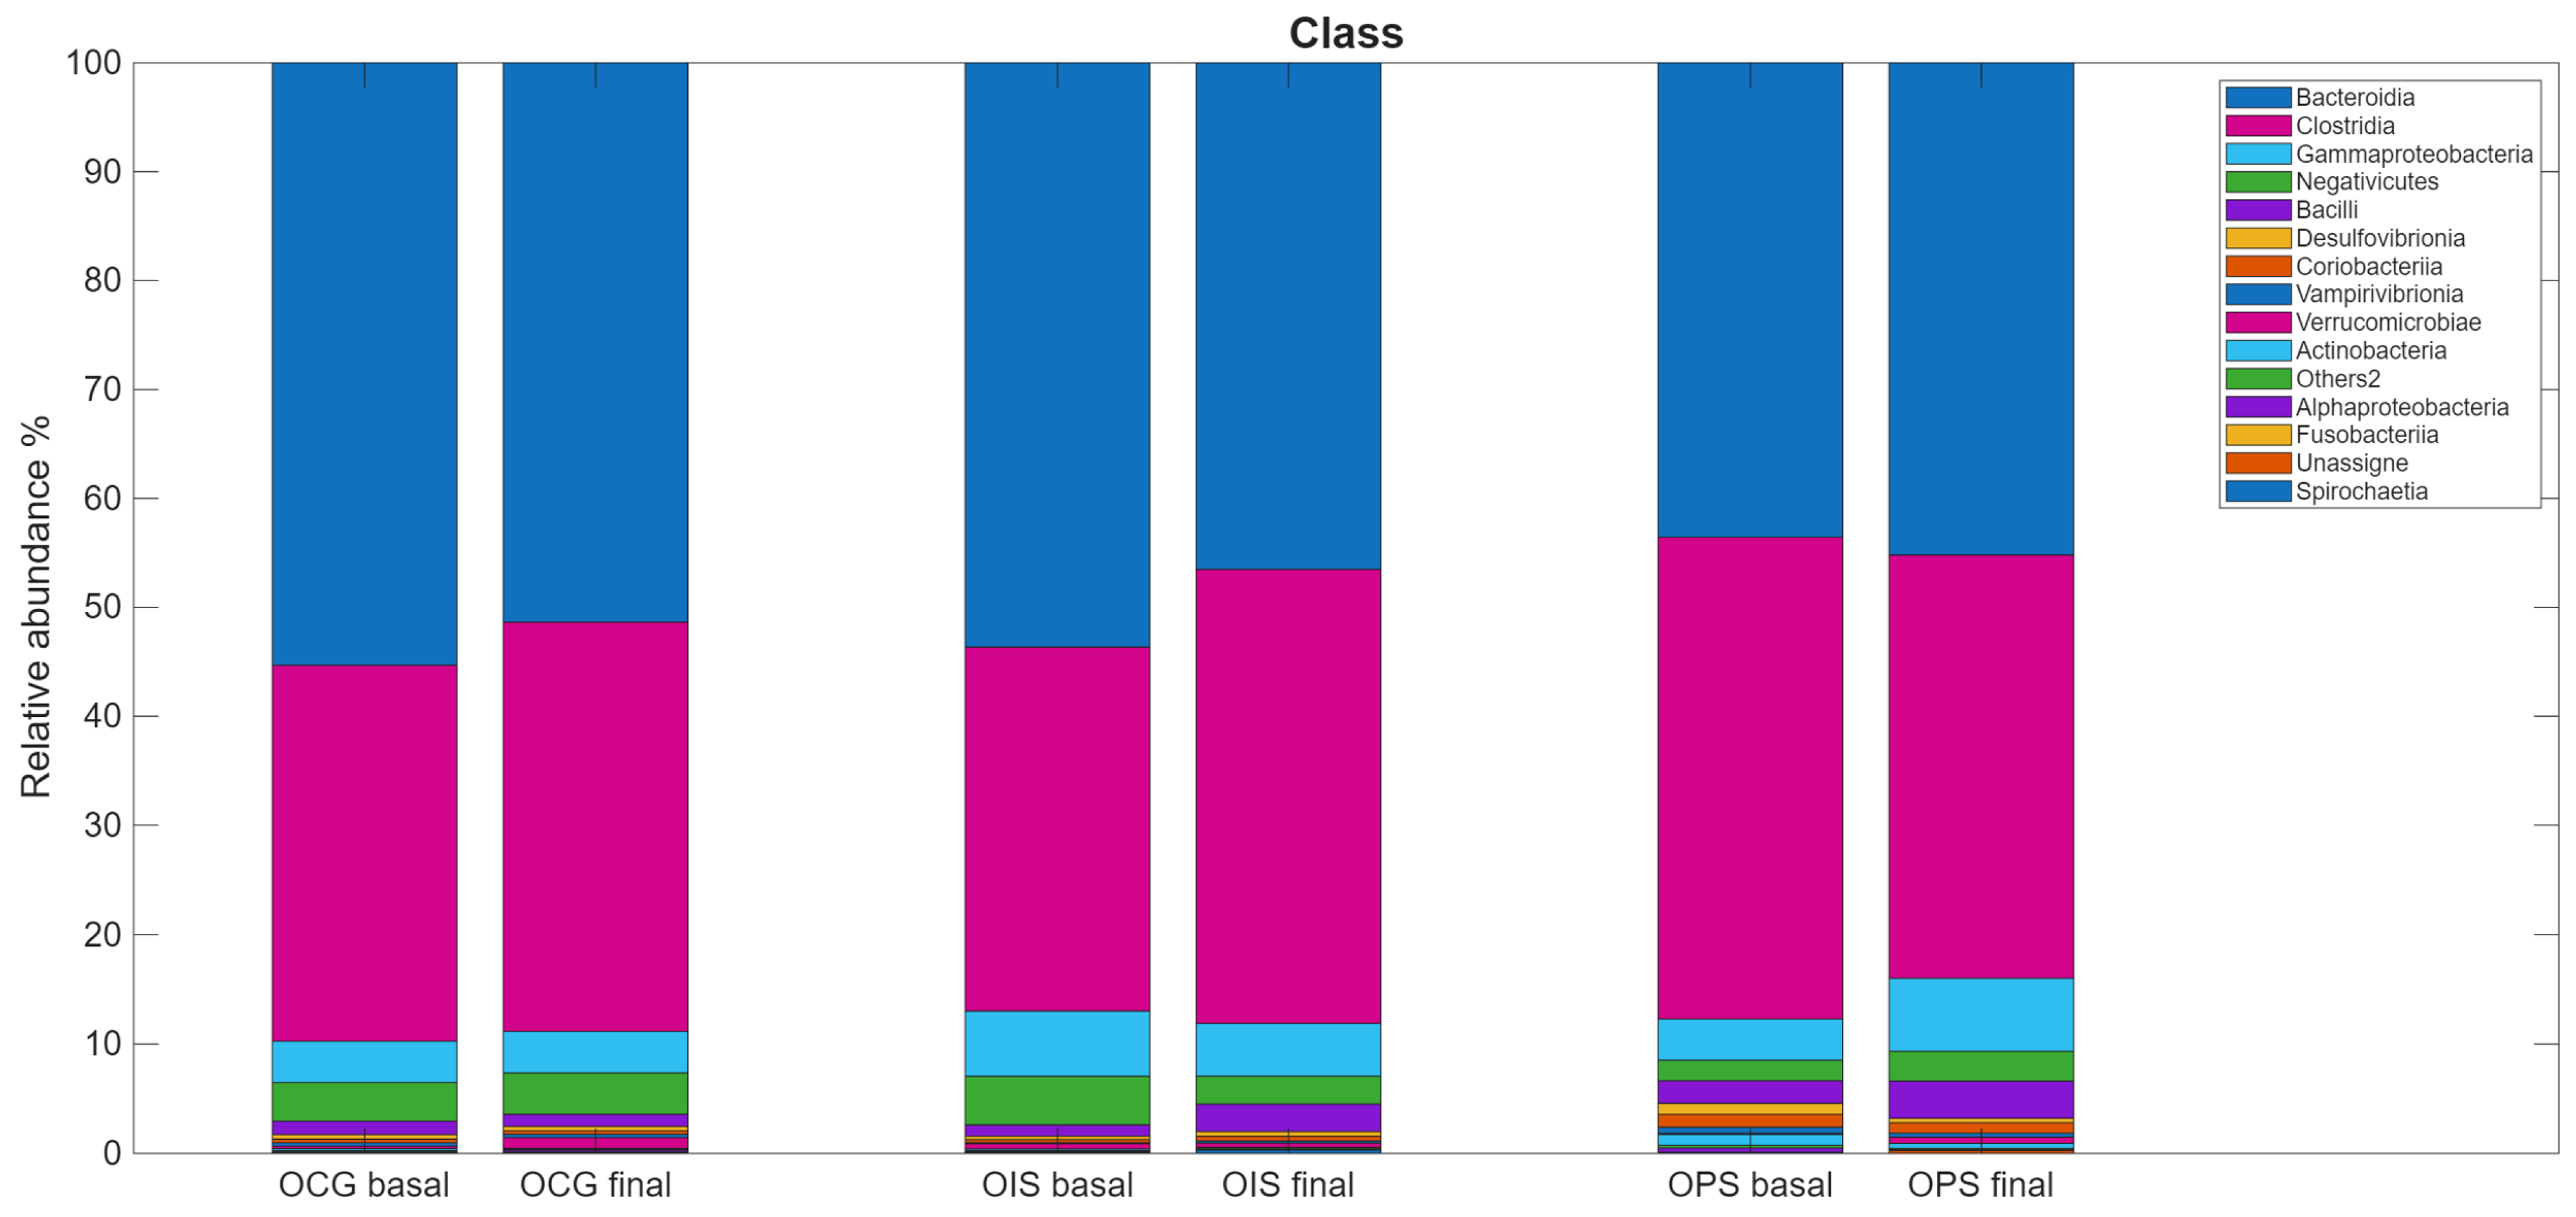
| Bacteroidia | 55.32 (15.86) | 51.36 (17.15) | 53.65 (18.39) | 46.52 (19.47) | 43.55 (11.57) | 45.2 (10.25) |
| Clostridia | 34.43 (15.84) | 37.49 (18.61) | 33.34 (15.76) | 41.6 (20.49) | 44.17 (13.09) | 38.8 (5.51) |
| Gammaproteobacteria | 3.77 (7.18) | 3.79 (5.14) | 5.96 (9.48) | 4.82 (6.75) | 3.77 (5.14) | 6.66 (9.84) |
| Negativicutes | 3.53 (3.47) | 3.77 (4.84) | 4.44 (3.72) | 2.55 (2.61) | 1.87 (1.58) | 2.72 (3.05) |
| Bacilli | 1.23 (1.14) | 1.11 (1.1) | 1.03 (1.21) | 2.51 (4.19) | 2.08 (1.35) | 3.41 (2.83) |
| Desulfovibrionia | 0.42 (0.51) | 0.4 (0.71) | 0.31 (0.44) | 0.43 (0.71) | 0.99 (0.85) | 0.41 (0.47) |
| Coriobacteriia | 0.33 (0.42) | 0.31 (0.46) | 0.28 (0.35) | 0.44 (0.7) | 1.19 (2.06) | 0.94 (0.73) |
| Vampirivibrionia | 0.32 (0.99) | 0.31 (0.72) | 0.1 (0.29) | 0.19 (0.35) | 0.56 (0.95) | 0.37 (0.7) |
| Verrucomicrobiae | 0.24 (0.86) | 0.99 (3.04) | 0.49 (1.08) | 0.39 (1.23) | 0.1 (0.11) | 0.56 (0.91) |
| Actinobacteria | 0.18 (0.34) | 0.07 (0.12) | 0.14 (0.38) | 0.06 (0.11) | 0.99 (1.87) | 0.46 (0.44) |
| Alphaproteobacteria | 0.08 (0.28) | 0.17 (0.62) | 0.04 (0.16) | 0.05 (0.16) | 0.39 (0.87) | 0.06 (0.14) |
| Fusobacteriia | 0.02 (0.06) | 0.03 (0.06) | 0.1 (0.25) | 0.01 (0.02) | 0.01 (0.01) | 0.01 (0.01) |
| Spirochaetia | 0 (0.02) | 0.05 (0.44) | 0.01 (0.02) | 0.3 (0.93) | 0 (0) | 0 (0) |
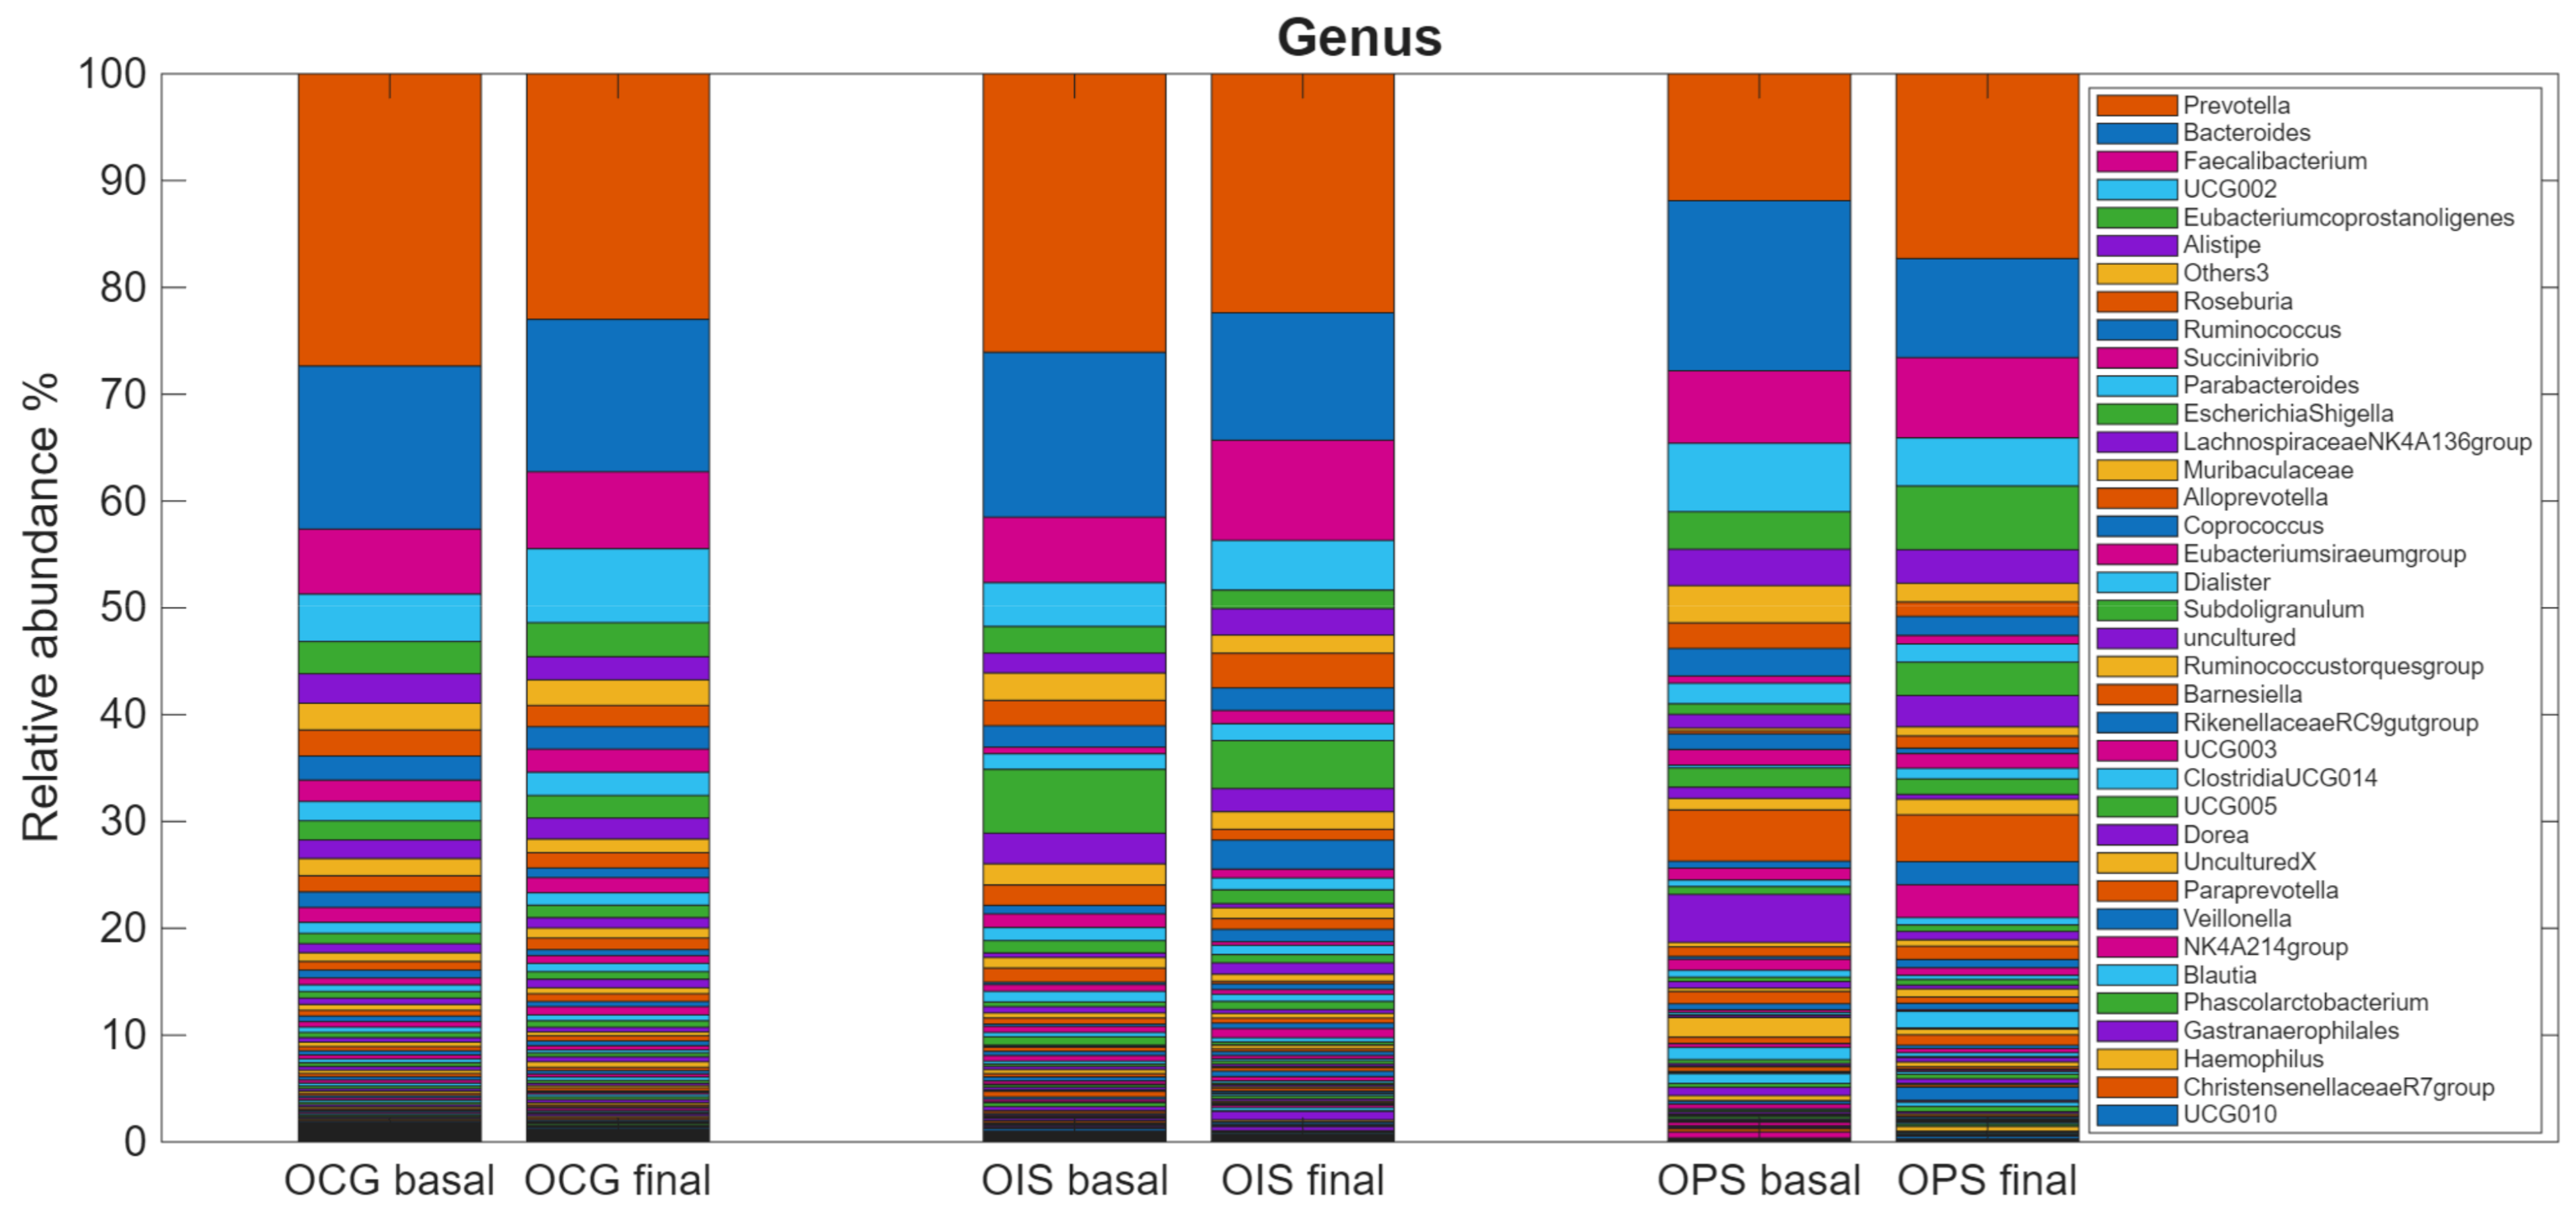
| Prevotella | 27.36 (21.84) | 22.99 (19.94) | 26.08 (23.35) | 22.37 (18.86) | 11.88 (7.52) | 17.3 (8.82) |
| Bacteroides | 15.26 (16.6) | 14.27 (17.57) | 15.43 (14.78) | 11.93 (17.6) | 15.92 (15.22) | 9.27 (5.94) |
| Faecalibacterium | 6.09 (5.15) | 7.2 (10.66) | 6.13 (4.19) | 9.38 (11.82) | 6.79 (3.55) | 7.51 (2.06) |
| UCG002 | 4.44 (4.12) | 6.93 (10.72) | 4.1 (3.02) | 4.65 (2.27) | 6.41 (4.64) | 4.51 (1.74) |
| Eubacterium coprostanoligenes group | 3.02 (2.93) | 3.19 (4.21) | 2.49 (2.28) | 1.74 (2.11) | 3.52 (2.88) | 5.97 (9.3) |
| Alistipes | 2.76 (3.62) | 2.16 (1.1) | 1.86 (2.5) | 2.48 (1.3) | 3.41 (3.53) | 3.14 (1.01) |
| Roseburia | 2.43 (2.89) | 1.99 (3.74) | 2.38 (3) | 3.25 (4.84) | 2.4 (1.37) | 1.35 (1.89) |
| Ruminococcus | 2.26 (1.94) | 2.1 (5.01) | 2 (1.85) | 2.11 (3.98) | 2.58 (3.03) | 1.78 (0.73) |
| Succinivibrio | 2 (6.47) | 2.16 (4.67) | 0.61 (0.93) | 1.24 (1.98) | 0.67 (0.65) | 0.79 (1.44) |
| Parabacteroides | 1.81 (1.56) | 2.18 (2.44) | 1.46 (1.03) | 1.58 (1.44) | 1.92 (0.56) | 1.71 (1.14) |
| Escherichia-Shigella | 1.79 (2.4) | 2.11 (2.29) | 5.98 (9.3) | 4.49 (4.52) | 0.99 (1.14) | 3.12 (2.94) |
| Lachnospiraceae NK4A136 group | 1.74 (2.1) | 1.97 (1.11) | 2.87 (4.33) | 2.16 (2.05) | 1.29 (0.95) | 2.93 (3.26) |
| Muribaculaceae | 1.61 (2.96) | 1.28 (1.43) | 1.97 (2.96) | 1.65 (1.93) | 0.26 (0.56) | 0.86 (0.56) |
| Alloprevotella | 1.51 (1.97) | 1.44 (3.08) | 1.92 (2.52) | 1.01 (1) | 0.27 (0.24) | 1.15 (1.96) |
| Coprococcus | 1.46 (1.52) | 0.9 (1.89) | 0.8 (0.91) | 2.73 (5.5) | 1.48 (0.86) | 0.5 (0.4) |
| Eubacterium siraeum group | 1.39 (1.93) | 1.42 (3.22) | 1.27 (1.28) | 0.82 (1.73) | 1.46 (1.22) | 1.37 (2.39) |
| Dialister | 1.03 (2.8) | 1.16 (1.85) | 1.23 (2.09) | 1.11 (3.58) | 0.26 (0.4) | 1 (1.29) |
| Subdoligranulum | 0.97 (1.71) | 1.16 (1.49) | 1.15 (1.7) | 1.3 (1.61) | 1.81 (1.29) | 1.46 (1) |
| Ruminococcus torques group | 0.82 (1.47) | 0.93 (1.37) | 0.98 (1.32) | 1.01 (1.59) | 1.08 (0.75) | 1.47 (2.88) |
| Barnesiella | 0.81 (1.93) | 1.09 (3.85) | 1.33 (4.19) | 1.01 (4.16) | 4.8 (5.1) | 4.38 (9.67) |
| Rikenellaceae RC9 gut group | 0.74 (1.83) | 0.55 (0.71) | 0.21 (0.31) | 1.16 (1.48) | 0.65 (0.91) | 2.15 (2.77) |
| UCG003 | 0.64 (0.67) | 0.73 (1.13) | 0.64 (0.46) | 0.33 (0.55) | 1.11 (1.11) | 3.07 (5.04) |
| Clostridia UCG014 | 0.62 (0.68) | 0.78 (0.84) | 0.99 (1.39) | 0.87 (1.03) | 0.62 (0.44) | 0.69 (0.76) |
| UCG005 | 0.62 (0.62) | 0.7 (0.63) | 0.44 (0.31) | 0.77 (0.56) | 0.73 (0.63) | 0.61 (0.23) |
| Dorea | 0.6 (1.4) | 0.81 (0.73) | 0.58 (0.65) | 1.07 (1.03) | 4.49 (5.73) | 0.79 (0.48) |
| Paraprevotella | 0.53 (0.71) | 0.72 (2.24) | 0.56 (1.09) | 0.24 (0.5) | 0.89 (0.53) | 1.25 (2.03) |
| Veillonella | 0.53 (1.2) | 0.49 (0.41) | 0.21 (0.4) | 0.55 (0.62) | 0.26 (0.37) | 0.77 (0.14) |
| NK4A214 group | 0.52 (0.57) | 0.76 (1.56) | 0.57 (0.48) | 0.44 (0.92) | 1.03 (1.22) | 0.71 (0.74) |
| Blautia | 0.49 (0.99) | 0.55 (0.73) | 0.41 (0.54) | 0.67 (0.73) | 0.64 (0.85) | 0.39 (0.21) |
| Phascolarctobacterium | 0.49 (0.57) | 0.61 (0.54) | 0.79 (1.28) | 0.76 (1.04) | 0.41 (0.3) | 0.53 (0.42) |
| Gastranaerophilales | 0.42 (1.58) | 0.43 (0.58) | 0.09 (0.29) | 0.36 (0.59) | 0.62 (0.94) | 0.35 (0.48) |
| Haemophilus | 0.42 (0.84) | 0.36 (0.49) | 0.1 (0.14) | 0.44 (0.74) | 0.31 (0.34) | 0.76 (0.46) |
| Christensenellaceae R7 group | 0.39 (0.56) | 0.49 (0.46) | 0.38 (0.54) | 0.47 (0.35) | 1.15 (1.56) | 0.6 (0.4) |
| UCG010 | 0.39 (0.43) | 0.44 (0.6) | 0.39 (0.36) | 0.52 (0.85) | 0.57 (0.29) | 0.59 (0.49) |
| Akkermansia | 0.38 (0.88) | 0.4 (1.28) | 0.52 (1.07) | 0.86 (1.75) | 0.23 (0.29) | 0.15 (0.19) |
| Streptococcus | 0.35 (0.46) | 0.28 (0.58) | 0.28 (0.6) | 0.4 (0.57) | 0.24 (0.11) | 1.56 (1.72) |
| Desulfovibrio | 0.35 (0.51) | 0.36 (1.43) | 0.21 (0.29) | 0.27 (0.55) | 0.08 (0.09) | 0.01 (0.01) |
| Catenibacterium | 0.3 (0.38) | 0.3 (0.34) | 0.3 (0.44) | 0.25 (0.33) | 0.59 (0.83) | 0.98 (1.6) |
| Butyrivibrio | 0.3 (0.71) | 0.31 (0.65) | 0.38 (0.87) | 0.38 (0.65) | 0.03 (0.05) | 0.3 (0.46) |
| Sutterella | 0.3 (0.37) | 0.29 (0.25) | 0.3 (0.33) | 0.31 (0.37) | 0.35 (0.44) | 0.39 (0.18) |
| Clostridium sensustricto1 | 0.29 (0.74) | 0.31 (0.72) | 0.08 (0.13) | 0.19 (0.35) | 1.15 (0.74) | 0.37 (0.7) |
| Odoribacter | 0.25 (0.23) | 0.26 (0.49) | 0.22 (0.38) | 0.3 (0.87) | 0.36 (0.39) | 0.1 (0.14) |
| Lachnospiraceae UCG004 | 0.22 (0.29) | 0.21 (0.33) | 0.24 (0.27) | 0.21 (0.3) | 0.2 (0.32) | 0.41 (0.33) |
| Eubacterium eligens group | 0.21 (0.38) | 0.22 (0.57) | 0.13 (0.15) | 0.12 (0.2) | 0.12 (0.09) | 0.45 (0.7) |
| Monoglobus | 0.21 (0.38) | 0.3 (0.56) | 0.53 (1.1) | 0.31 (0.46) | 0.43 (0.61) | 0.2 (0.18) |
| Megasphaera | 0.21 (0.54) | 0.14 (0.34) | 0.21 (0.64) | 0.52 (1.16) | 0.09 (0.18) | 0.1 (0.15) |
| Eubacterium ruminantium group | 0.21 (0.37) | 0.17 (0.24) | 0.24 (0.41) | 0.4 (0.88) | 0.12 (0.07) | 0.15 (0.14) |
| Bifidobacterium | 0.21 (0.46) | 0.24 (0.44) | 0.09 (0.12) | 0.19 (0.25) | 0.92 (1.91) | 0.23 (0.25) |
| Butyricimonas | 0.21 (0.3) | 0.26 (0.3) | 0.37 (0.77) | 0.16 (0.16) | 0.36 (0.27) | 0.44 (0.24) |
| Collinsella | 0.21 (0.55) | 0.29 (0.75) | 0.37 (0.98) | 0.17 (0.34) | 0.77 (1.56) | 0.45 (0.91) |
| Lachnospiraceae UCG001 | 0.17 (0.37) | 0.2 (0.26) | 0.05 (0.08) | 0.15 (0.19) | 0.47 (0.84) | 0.15 (0.19) |
| Eubacterium xylanophilum group | 0.16 (0.65) | 0.18 (0.31) | 0.22 (0.52) | 0.27 (0.35) | 0.06 (0.08) | 0.19 (0.4) |
| Holdemanella | 0.16 (0.23) | 0.24 (0.68) | 0.15 (0.22) | 0.11 (0.36) | 0.44 (0.75) | 0.15 (0.21) |
| RF39 | 0.15 (0.2) | 0.17 (0.36) | 0.13 (0.2) | 0.18 (0.3) | 0.14 (0.12) | 0.4 (0.36) |
| Acidaminococcus | 0.15 (0.28) | 0.13 (0.21) | 0.05 (0.09) | 0.27 (0.64) | 0.16 (0.17) | 0.5 (0.64) |
| Lachnoclostridium | 0.15 (0.34) | 0.2 (0.26) | 0.2 (0.34) | 0.2 (0.32) | 0.18 (0.16) | 0.16 (0.15) |
| Citrobacter | 0.14 (0.37) | 0.15 (0.26) | 0.03 (0.06) | 0.13 (0.23) | 0.02 (0.05) | 0.15 (0.12) |
| Allisonella | 0.13 (0.22) | 0.16 (0.21) | 0.06 (0.06) | 0.12 (0.15) | 0.08 (0.09) | 0.17 (0.1) |
| Parasutterella | 0.13 (0.52) | 0.11 (0.17) | 0.07 (0.18) | 0.23 (0.59) | 0.01 (0.02) | 0.04 (0.04) |
| Prevotellaceae NK3B31 group | 0.12 (0.24) | 0.05 (0.44) | 0.03 (0.07) | 0.3 (0.93) | 0 (0) | 0 (0) |
| Anaerostipes | 0.11 (0.17) | 0.17 (0.61) | 0.07 (0.12) | 0.05 (0.16) | 0.22 (0.2) | 0.06 (0.14) |
| Romboutsia | 0.11 (0.13) | 0 (0.01) | 0.16 (0.34) | 0.81 (3.58) | 0.14 (0.09) | 0 (0.01) |
| Lachnospira | 0.1 (0.16) | 0.11 (0.12) | 0.1 (0.17) | 0.18 (0.21) | 0.09 (0.05) | 0.09 (0.05) |
| Comamonas | 0.09 (0.17) | 0.16 (0.29) | 0.23 (0.84) | 0.19 (0.39) | 0.05 (0.07) | 0.05 (0.04) |
| Erysipelotrichaceae UCG003 | 0.09 (0.23) | 0.12 (0.54) | 0.04 (0.07) | 0.02 (0.04) | 0.34 (0.67) | 0.02 (0.02) |
| Klebsiella | 0.08 (0.56) | 0.07 (0.16) | 0.06 (0.16) | 0.08 (0.1) | 0 (0) | 0.16 (0.17) |
| Eubacterium ventriosum group | 0.08 (0.12) | 0.01 (0.05) | 0.09 (0.17) | 0.39 (1.56) | 0.14 (0.21) | 0.03 (0.06) |
| Oscillibacter | 0.08 (0.10) | 0.06 (0.12) | 0.05 (0.07) | 0.05 (0.09) | 0.03 (0.03) | 0.44 (0.42) |
| Slackia | 0.07 (0.21) | 0.08 (0.23) | 0.02 (0.03) | 0.09 (0.17) | 0.28 (0.39) | 0.05 (0.01) |
| Weissella | 0.05 (0.16) | 0.09 (0.42) | 0.06 (0.17) | 0 (0.01) | 0.02 (0.03) | 0.04 (0.1) |
| Bilophila | 0.05 (0.21) | 0.12 (0.38) | 0.1 (0.21) | 0.03 (0.08) | 0.58 (1.16) | 0.02 (0.04) |
| Clostridiavadin BB60 group | 0.05 (0.11) | 0.03 (0.14) | 0.06 (0.09) | 0.15 (0.4) | 0.02 (0.02) | 0.13 (0.21) |
| Mitsuokella | 0.05 (0.09) | 0.08 (0.16) | 0.08 (0.15) | 0.04 (0.08) | 0.08 (0.11) | 0.1 (0.1) |
| Lachnospiraceae UCG003 | 0.04 (0.14) | 0.02 (0.08) | 0.01 (0.02) | 0.12 (0.53) | 0 (0) | 0 (0) |
| Family XIIIUCG001 | 0.04 (0.08) | 0.04 (0.15) | 0.03 (0.07) | 0.02 (0.03) | 0.04 (0.05) | 0.26 (0.57) |
| Ruminococcus gnavus group | 0.03 (0.11) | 0.05 (0.11) | 0.08 (0.14) | 0.09 (0.3) | 0 (0.01) | 0.03 (0.04) |
| Prevotellaceae UCG003 | 0.03 (0.14) | 0.07 (0.23) | 0.11 (0.38) | 0.03 (0.07) | 0 (0) | 0.04 (0.05) |
| Fusobacterium | 0.02 (0.1) | 0.03 (0.06) | 0.06 (0.23) | 0.04 (0.05) | 0 (0.01) | 0.04 (0.08) |
| Anaerovibrio | 0.01 (0.06) | 0.01 (0.04) | 0 (0.01) | 0.07 (0.13) | 0 (0) | 0 (0) |
| Lactobacillus | 0.01 (0.06) | 0.02 (0.08) | 0 (0) | 0.05 (0.23) | 0.1 (0.13) | 0 (0) |
| Hungatella | 0.01 (0.04) | 0.03 (0.18) | 0.01 (0.05) | 0 (0.01) | 0 (0) | 0 (0) |
| Tyzzerella | 0.01 (0.02) | 0.02 (0.05) | 0.01 (0.02) | 0.01 (0.02) | 0 (0) | 0.01 (0.01) |
| Raoultella | 0.01 (0.03) | 0.03 (0.16) | 0 (0) | 0 (0) | 0.07 (0.15) | 0 (0) |
| Megamonas | 0 (0.02) | 0.01 (0.04) | 0 (0.01) | 0.01 (0.03) | 0 (0) | 0.09 (0.21) |
| Treponema | 0 (0) | 0 (0) | 0 (0.02) | 0.05 (0.24) | 0.01 (0.02) | 0 (0) |
| Asteroleplasma | 0 (0) | 0.01 (0.02) | 0 (0) | 0.02 (0.05) | 0 (0) | 0 (0.01) |
| Paeniclostridium | 0 (0) | 0 (0.03) | 0 (0) | 0 (0) | 0 (0) | 0 (0.01) |
References
- Atlantis, E.; Goldney, R.D.; Wittert, G.A. Obesity and depression or anxiety. BMJ 2009, 339, b3868. [Google Scholar] [CrossRef] [Scilit] [PubMed]
- WHO. Anxiety Disorders. Available online: https://www.who.int/news-room/fact-sheets/detail/anxiety-disorders (accessed on 22 May 2025).
- Shamah-Levy, T.; Lazcano-Ponce, E.C.; Cuevas-Nasu, L.; Romero-Martínez, M.; Gaona-Pineda, E.B.; Gómez-Acosta, L.M.; Mendoza-Alvarado, L.R.; Méndez-Gómez-Humarán, I. Encuesta Nacional de Salud y Nutrición Continua 2023; Instituto Nacional de Salud Pública: Cuernavaca, Mexico, 2024; ISBN 978-607-511-242-8. [Google Scholar]
- Campos-Nonato, I.; Galván-Valencia, O.; Hernández-Barrera, L.; Oviedo-Solís, C.; Barquera, S. Prevalence of obesity and associated risk factors in Mexican adults: Results of the Ensanut 2022. Salud Publica Mex. 2023, 65, S238–S247. [Google Scholar] [CrossRef] [Scilit] [PubMed]
- El Instituto Nacional de Estadística y Geografía (INEGI). Encuesta Nacional de Bienestar Autorreportado (ENBIARE) 2021. Available online: https://www.inegi.org.mx/contenidos/programas/enbiare/2021/doc/enbiare_2021_nota_tecnica.pdf (accessed on 6 July 2026).
- Luppino, F.S.; de Wit, L.M.; Bouvy, P.F.; Stijnen, T.; Cuijpers, P.; Penninx, B.W.; Zitman, F.G. Overweight, obesity, and depression: A systematic review and meta-analysis of longitudinal studies. Arch. Gen. Psychiatry 2010, 67, 220–229. [Google Scholar] [CrossRef] [Scilit] [PubMed]
- Gariepy, G.; Wang, J.; Lesage, A.D.; Schmitz, N. The longitudinal association from obesity to depression: Results from the 12-year National Population Health Survey. Obesity 2010, 18, 1033–1038. [Google Scholar] [CrossRef] [Scilit] [PubMed]
- Zhao, G.; Ford, E.S.; Dhingra, S.; Li, C.; Strine, T.W.; Mokdad, A.H. Depression and anxiety among US adults: Associations with body mass index. Int. J. Obes. 2009, 33, 257–266. [Google Scholar] [CrossRef] [Scilit] [PubMed]
- McIntyre, R.S. The Co-occurrence of Depression and Obesity: Implications for Clinical Practice and the Discovery of Targeted and Precise Mechanistically Informed Therapeutics. J. Clin. Psychiatry 2024, 85, 55135. [Google Scholar] [CrossRef] [Scilit] [PubMed]
- Cao, Y.; Cheng, Y.; Pan, W.; Diao, J.; Sun, L.; Meng, M. Gut microbiota variations in depression and anxiety: A systematic review. BMC Psychiatry 2025, 25, 443. [Google Scholar] [CrossRef] [Scilit] [PubMed]
- Foster, J.A.; McVey Neufeld, K.A. Gut-brain axis: How the microbiome influences anxiety and depression. Trends Neurosci. 2013, 36, 305–312. [Google Scholar] [CrossRef] [Scilit] [PubMed]
- Simpson, C.A.; Diaz-Arteche, C.; Eliby, D.; Schwartz, O.S.; Simmons, J.G.; Cowan, C.S.M. The gut microbiota in anxiety and depression—A systematic review. Clin. Psychol. Rev. 2021, 83, 101943. [Google Scholar] [CrossRef] [Scilit] [PubMed]
- Valles-Colomer, M.; Falony, G.; Darzi, Y.; Tigchelaar, E.F.; Wang, J.; Tito, R.Y.; Schiweck, C.; Kurilshikov, A.; Joossens, M.; Wijmenga, C.; et al. The neuroactive potential of the human gut microbiota in quality of life and depression. Nat. Microbiol. 2019, 4, 623–632. [Google Scholar] [CrossRef] [Scilit] [PubMed]
- Xiong, R.G.; Li, J.; Cheng, J.; Zhou, D.D.; Wu, S.X.; Huang, S.Y.; Saimaiti, A.; Yang, Z.J.; Gan, R.Y.; Li, H.B. The Role of Gut Microbiota in Anxiety, Depression, and Other Mental Disorders as Well as the Protective Effects of Dietary Components. Nutrients 2023, 15, 3258. [Google Scholar] [CrossRef] [Scilit] [PubMed]
- Alosaimi, N.; Sherar, L.B.; Griffiths, P.; Pearson, N. Clustering of diet, physical activity and sedentary behaviour and related physical and mental health outcomes: A systematic review. BMC Public Health 2023, 23, 1572. [Google Scholar] [CrossRef] [Scilit] [PubMed]
- Schuch, F.; Vancampfort, D.; Firth, J.; Rosenbaum, S.; Ward, P.; Reichert, T.; Bagatini, N.C.; Bgeginski, R.; Stubbs, B. Physical activity and sedentary behavior in people with major depressive disorder: A systematic review and meta-analysis. J. Affect. Disord. 2017, 210, 139–150. [Google Scholar] [CrossRef] [Scilit] [PubMed]
- Banyard, H.; Edward, K.L.; Garvey, L.; Stephenson, J.; Azevedo, L.; Benson, A.C. The Effects of Aerobic and Resistance Exercise on Depression and Anxiety: Systematic Review With Meta-Analysis. Int. J. Ment. Health Nurs. 2025, 34, e70054. [Google Scholar] [CrossRef] [Scilit] [PubMed]
- Corona-Cervantes, K.; Parra-Carriedo, A.; Hernández-Quiroz, F.; Martínez-Castro, N.; Vélez-Ixta, J.M.; Guajardo-López, D.; García-Mena, J.; Hernández-Guerrero, C. Physical and Dietary Intervention with Opuntia ficus-indica (Nopal) in Women with Obesity Improves Health Condition through Gut Microbiota Adjustment. Nutrients 2022, 14, 1008. [Google Scholar] [CrossRef] [Scilit] [PubMed]
- Poti, J.M.; Braga, B.; Qin, B. Ultra-processed Food Intake and Obesity: What Really Matters for Health-Processing or Nutrient Content? Curr. Obes. Rep. 2017, 6, 420–431. [Google Scholar] [CrossRef] [Scilit] [PubMed]
- de Noronha, S.I.S.R.; de Moraes, L.A.G.; Hassell, J.E., Jr.; Stamper, C.E.; Arnold, M.R.; Heinze, J.D. High-fat diet, microbiome-gut-brain axis signaling, and anxiety-like behavior in male rats. Biol. Res. 2024, 57, 23. [Google Scholar] [CrossRef] [Scilit] [PubMed]
- Lopresti, A.L.; Hood, S.D.; Drummond, P.D. A review of lifestyle factors that contribute to important pathways associated with major depression: Diet, sleep and exercise. J. Affect. Disord. 2013, 148, 12–27. [Google Scholar] [CrossRef] [Scilit] [PubMed]
- Applewhite, B.; Penninx, B.; Young, A.H.; Schmidt, U.; Himmerich, H.; Keeler, J.L. The effect of a low-calorie diet on depressive symptoms in individuals with overweight or obesity: A systematic review and meta-analysis of interventional studies. Psychol. Med. 2024, 54, 1671–1683. [Google Scholar] [CrossRef] [Scilit] [PubMed]
- De Filippis, F.; Pellegrini, N.; Vannini, L.; Jeffery, I.B.; La Storia, A.; Laghi, L.; Serrazanetti, D.I.; Di Cagno, R.; Ferrocino, I.; Lazzi, C.; et al. High-level adherence to a Mediterranean diet beneficially impacts the gut microbiota and associated metabolome. Gut 2016, 65, 1812–1821. [Google Scholar] [CrossRef] [Scilit] [PubMed]
- Gallegos-Carrillo, K.; Flores, Y.N.; Denova-Gutiérrez, E.; Quiterio, M.; Salmerón, J.; Ramírez-Palacios, P. Adherence to a Mexican traditional diet and its association with depressive symptoms in a cohort of Mexican adults. Nutrients 2018, 10, 1648. [Google Scholar] [CrossRef] [Scilit] [PubMed]
- Valerino-Perea, S.; Lara-Castor, L.; Armstrong, M.E.G.; Papadaki, A. Definition of the Traditional Mexican Diet and Its Role in Health: A Systematic Review. Nutrients 2019, 11, 2803. [Google Scholar] [CrossRef] [Scilit] [PubMed]
- El-Mostafa, K.; El Kharrassi, Y.; Badreddine, A.; Andreoletti, P.; Vamecq, J.; El Kebbaj, M.S.; Latruffe, N.; Lizard, G.; Nasser, B.; Cherkaoui-Malki, M. Nopal cactus (Opuntia ficus-indica) as a source of bioactive compounds for nutrition, health and disease. Molecules 2014, 19, 14879–14901. [Google Scholar] [CrossRef] [Scilit] [PubMed]
- Kaur, M.; Kaur, A.; Sharma, R. Pharmacological actions of Opuntia ficus-indica: A review. J. Appl. Pharm. Sci. 2012, 2, 15–18. [Google Scholar] [CrossRef] [Scilit]
- Mercado-Mercado, G.; Blancas-Benítez, F.J.; Zamora-Gasga, V.M.; Sáyago-Ayerdi, S.G. Mexican Traditional Plant-Foods: Polyphenols Bioavailability, Gut Microbiota Metabolism and Impact Human Health. Curr. Pharm. Des. 2019, 25, 3434–3456. [Google Scholar] [CrossRef] [Scilit] [PubMed]
- Wu, P.Y.; Chen, K.M.; Belcastro, F. Dietary patterns and depression risk in older adults: Systematic review and meta-analysis. Nutr. Rev. 2021, 79, 976–987. [Google Scholar] [CrossRef] [Scilit] [PubMed]
- Majumder, P.; Sharma, I.; Vostanis, P.; Bone, C. The effect of aerobic exercise in the maintenance treatment of depression. BJPsych Int. 2015, 12, S3–S6. [Google Scholar] [CrossRef] [Scilit] [PubMed]
- Verhoeven, J.E.; Han, L.K.M.; Lever-van Milligen, B.A.; Hu, M.X.; Révész, D.; Hoogendoorn, A.W.; Batelaan, N.M.; van Schaik, D.J.F.; van Balkom, A.J.L.M.; van Oppen, P.; et al. Antidepressants or running therapy: Comparing effects on mental and physical health in patients with depression and anxiety disorders. J. Affect. Disord. 2023, 329, 19–29. [Google Scholar] [CrossRef] [Scilit] [PubMed]
- Samudio-Cruz, M.A.; Cerqueda-García, D.; Cabrera-Ruiz, E.; Luna-Angulo, A.; Canizales-Quinteros, S.; Landa-Solis, C.; Martínez-Nava, G.A.; Carrillo-Mora, P.; Rangel-López, E.; Ríos-Martínez, J.; et al. Taxonomic Biomarkers of Gut Microbiota with Potential Clinical Utility in Mexican Adults with Obesity and Depressive and Anxiety Symptoms. Microorganisms 2025, 13, 1828. [Google Scholar] [CrossRef] [Scilit] [PubMed]
- Samudio-Cruz, M.A.; Luna-Angulo, A.; Cabrera-Ruiz, E.; Landa-Solis, C.; Rangel-López, E.; Carrillo-Mora, P.; Ríos-Martínez, J.; Toledo-Pérez, R.; Paniagua-Pérez, R.; Martínez-Canseco, C.J.; et al. The Bacterial Composition of the Gut Microbiota of Mexicans with Overweight and Obesity: A Systematic Review. Microorganisms 2025, 13, 1727. [Google Scholar] [CrossRef] [Scilit] [PubMed]
- Lizaur, A.B.P.; González, B.P. Sistema Mexicano de Alimentos Equivalentes, 5th ed.; Fomento de Nutrición y Salud A.C.: Mexico City, Mexico, 2024. [Google Scholar]
- Instituto Mexicano del Seguro Social. Prescripción de Ejercicios con Plan Terapéutico en el Adulto: Guía de Evidencias y Recomendaciones; Instituto Mexicano del Seguro Social: Mexico City, Mexico, 2013.
- Mendes, M.A.; da Silva, I.; Ramires, V.; Reichert, F.; Martins, R.; Ferreira, R.; Tomasi, E. Metabolic equivalent of task (METs) thresholds as an indicator of physical activity intensity. PLoS ONE 2018, 13, e0200701. [Google Scholar] [CrossRef] [Scilit] [PubMed]
- Bolyen, E.; Rideout, J.R.; Dillon, M.R.; Bokulich, N.A.; Abnet, C.C.; Al-Ghalith, G.A.; Alexander, H.; Alm, E.J.; Arumugam, M.; Asnicar, F.; et al. Reproducible, interactive, scalable and extensible microbiome data science using QIIME 2. Nat. Biotechnol. 2019, 37, 852–857. [Google Scholar] [CrossRef] [Scilit] [PubMed]
- Callahan, B.J.; McMurdie, P.J.; Rosen, M.J.; Han, A.W.; Johnson, A.J.A.; Holmes, S.P. DADA2: High-resolution sample inference from Illumina amplicon data. Nat. Methods 2016, 13, 581–583. [Google Scholar] [CrossRef] [Scilit] [PubMed]
- Rognes, T.; Flouri, T.; Nichols, B.; Quince, C.; Mahé, F. VSEARCH: A versatile open source tool for metagenomics. PeerJ 2016, 4, e2584. [Google Scholar] [CrossRef] [Scilit] [PubMed]
- Quast, C.; Pruesse, E.; Yilmaz, P.; Gerken, J.; Schweer, T.; Yarza, P.; Peplies, J.; Glöckner, F.O. The SILVA ribosomal RNA gene database project: Improved data processing and web-based tools. Nucleic Acids Res. 2013, 41, D590–D596. [Google Scholar] [CrossRef] [Scilit] [PubMed]
- Katoh, K.; Standley, D.M. MAFFT multiple sequence alignment software version 7: Improvements in performance and usability. Mol. Biol. Evol. 2013, 30, 772–780. [Google Scholar] [CrossRef] [Scilit] [PubMed]
- Price, M.N.; Dehal, P.S.; Arkin, A.P. FastTree 2—approximately maximum-likelihood trees for large alignments. PLoS ONE 2010, 5, e9490. [Google Scholar] [CrossRef] [Scilit] [PubMed]
- McMurdie, P.J.; Holmes, S. phyloseq: An R package for reproducible interactive analysis and graphics of microbiome census data. PLoS ONE 2013, 8, e61217. [Google Scholar] [CrossRef] [Scilit] [PubMed]
- Oksanen, J.; Blanchet, F.G.; Kindt, R.; Legendre, P.; Minchin, P.R.; O’Hara, R.B.; Simpson, G.L.; Solymos, P.; Stevens, M.H.H.; Wagner, H. Vegan: Community Ecology Package, 2.7-5; CRAN: Vienna, Austria, 2013.
- Nickols, W.A.; Kuntz, T.; Shen, J.; Maharjan, S.; Mallick, H.; Franzosa, E.A.; Thompson, K.N.; Nearing, J.T.; Huttenhower, C. MaAsLin 3: Refining and extending generalized multivariable linear models for meta-omic association discovery. Nat. Methods 2026, 23, 554–564. [Google Scholar] [CrossRef] [Scilit] [PubMed]
- O’Rourke, R.P.; Ma, N.; Savidge, T.C. The gut microbiome-kynurenine pathway interface in health and disease. Curr. Opin. Biotechnol. 2023, 81, 102924. [Google Scholar] [CrossRef] [Scilit] [PubMed]
- Zhou, M.; Fan, Y.; Xu, L.; Yu, Z.; Wang, S.; Xu, H.; Zhang, J.; Zhang, L.; Liu, W.; Wu, L.; et al. Microbiome and tryptophan metabolomics analysis in adolescent depression: Roles of the gut microbiota in the regulation of tryptophan-derived neurotransmitters and behaviors in human and mice. Microbiome 2023, 11, 145. [Google Scholar] [CrossRef] [Scilit] [PubMed]
- Glud, M.; Christiansen, T.; Larsen, L.H.; Richelsen, B.; Bruun, J.M. Changes in circulating BDNF in relation to sex, diet, and exercise: A 12-week randomized controlled study in overweight and obese participants. J. Obes. 2019, 2019, 4537274. [Google Scholar] [CrossRef] [Scilit] [PubMed]
- Hall, K.D.; Farooqi, I.S.; Friedman, J.M.; Klein, S.; Loos, R.J.F.; Mangelsdorf, D.J.; O’Rahilly, S.; Ravussin, E.; Redman, L.M.; Ryan, D.H.; et al. The energy balance model of obesity: Beyond calories in, calories out. Am. J. Clin. Nutr. 2022, 115, 1243–1254. [Google Scholar] [CrossRef] [Scilit] [PubMed]
- Magkos, F.; Fraterrigo, G.; Yoshino, J.; Luecking, C.; Kirbach, K.; Kelly, S.C.; de las Fuentes, L.; He, S.; Okunade, A.L.; Patterson, B.W.; et al. Effects of Moderate and Subsequent Progressive Weight Loss on Metabolic Function and Adipose Tissue Biology in Humans with Obesity. Cell Metab. 2016, 23, 591–601. [Google Scholar] [CrossRef] [Scilit] [PubMed]
- Vítek, L. Bilirubin and atherosclerotic diseases. Physiol. Res. 2017, 66, S11–S20. [Google Scholar] [CrossRef] [Scilit] [PubMed]
- Gleeson, M. Assessing immune function changes in exercise and diet intervention studies. Curr. Opin. Clin. Nutr. Metab. Care 2005, 8, 511–515. [Google Scholar] [CrossRef] [Scilit] [PubMed]
- Dalile, B.; Van Oudenhove, L.; Vervliet, B.; Verbeke, K. The role of short-chain fatty acids in microbiota-gut-brain communication. Nat. Rev. Gastroenterol. Hepatol. 2019, 16, 461–478. [Google Scholar] [CrossRef] [Scilit] [PubMed]
- Mailing, L.J.; Allen, J.M.; Buford, T.W.; Fields, C.J.; Woods, J.A. Exercise and the Gut Microbiome: A Review of the Evidence, Potential Mechanisms, and Implications for Human Health. Exerc. Sport. Sci. Rev. 2019, 47, 75–85. [Google Scholar] [CrossRef] [Scilit] [PubMed]
- Molinaro, A.; Wahlström, A.; Marschall, H.-U. Role of Bile Acids in Metabolic Control. Trends Endocrinol. Metab. 2018, 29, 31–41. [Google Scholar] [CrossRef] [Scilit] [PubMed]
- Sturgeon, C.; Fasano, A. Zonulin, a regulator of epithelial and endothelial barrier functions, and its involvement in chronic inflammatory diseases. Tissue Barriers 2016, 4, e1251384. [Google Scholar] [CrossRef] [Scilit] [PubMed]
- Kearns, R. The Kynurenine Pathway in Gut Permeability and Inflammation. Inflammation 2025, 48, 1063–1077. [Google Scholar] [CrossRef] [Scilit] [PubMed]
- Del Bo, C.; Bernardi, S.; Cherubini, A.; Porrini, M.; Gargari, G.; Hidalgo-Liberona, N.; González-Domínguez, R.; Zamora-Ros, R.; Peron, G.; Marino, M.; et al. A polyphenol-rich dietary pattern improves intestinal permeability, evaluated as serum zonulin levels, in older subjects: The MaPLE randomised controlled trial. Clin. Nutr. 2021, 40, 3006–3018. [Google Scholar] [CrossRef] [Scilit] [PubMed]
- Magne, F.; Gotteland, M.; Gauthier, L.; Zazueta, A.; Pesoa, S.; Navarrete, P.; Balamurugan, R. The Firmicutes/Bacteroidetes Ratio: A Relevant Marker of Gut Dysbiosis in Obese Patients? Nutrients 2020, 12, 1474. [Google Scholar] [CrossRef] [Scilit] [PubMed]
- Aslam, H.; Trakman, G.; Dissanayake, T.; Todd, E.; Harrison, P.; Alby, C.; Jabeen, T.; Gamage, E.; Travica, N.; Marshall, S.; et al. Dietary interventions and the gut microbiota: A systematic literature review of 80 controlled clinical trials. J. Transl. Med. 2026, 24, 39. [Google Scholar] [CrossRef] [Scilit] [PubMed]
- Meslier, V.; Laiola, M.; Roager, H.M.; De Filippis, F.; Roume, H.; Quinquis, B.; Giacco, R.; Mennella, I.; Ferracane, R.; Pons, N.; et al. Mediterranean diet intervention in overweight and obese subjects lowers plasma cholesterol and causes changes in the gut microbiome and metabolome independently of energy intake. Gut 2020, 69, 1258–1268. [Google Scholar] [CrossRef] [Scilit] [PubMed]
- Wang, R.; Cai, Y.; Lu, W.; Zhang, R.; Shao, R.; Yau, S.Y.; Stubbs, B.; McIntyre, R.S.; Su, K.P.; Xu, G.; et al. Exercise effect on the gut microbiota in young adolescents with subthreshold depression: A randomized psychoeducation-controlled Trial. Psychiatry Res. 2023, 319, 115005. [Google Scholar] [CrossRef] [Scilit] [PubMed]
- Schaub, A.C.; Schneider, E.; Vazquez-Castellanos, J.F.; Schweinfurth, N.; Kettelhack, C.; Doll, J.P.K.; Yamanbaeva, G.; Mählmann, L.; Brand, S.; Beglinger, C.; et al. Clinical, gut microbial and neural effects of a probiotic add-on therapy in depressed patients: A randomized controlled trial. Transl. Psychiatry 2022, 12, 227. [Google Scholar] [CrossRef] [Scilit] [PubMed]
- Deleu, S.; Machiels, K.; Raes, J.; Verbeke, K.; Vermeire, S. Short chain fatty acids and its producing organisms: An overlooked therapy for IBD? EBioMedicine 2021, 66, 103293. [Google Scholar] [CrossRef] [Scilit] [PubMed]
- Wang, J.; Xie, J.; He, F.; Wu, W.; Xu, K.; Ren, Y.; Chen, J.; Xie, P. Akkermansia muciniphila-derived SCFAs improve the depression-like behaviors of mice by inhibiting neuroinflammation. Pharmacol. Res. 2025, 220, 107938. [Google Scholar] [CrossRef] [Scilit] [PubMed]
- Benslimane, F.M.; Alser, M.; Elgamal, A.M.; Mohammed, L.I.; Zakaria, Z.Z.; Sokary, S.; Sohail, M.U.; Hammad, A.S.; Abbasi, S.A.; Al-Asmakh, M. Structured Exercise Modulates Gut Microbiota Composition and Protects Against Diet-Induced Dysbiosis in a Rat Model. Nutrients 2026, 18, 847. [Google Scholar] [CrossRef] [Scilit] [PubMed]
- Nie, K.; Ma, K.; Luo, W.; Shen, Z.; Yang, Z.; Xiao, M.; Tong, T.; Yang, Y.; Wang, X. Roseburia intestinalis: A Beneficial Gut Organism From the Discoveries in Genus and Species. Front. Cell. Infect. Microbiol. 2021, 22, 757718. [Google Scholar] [CrossRef] [Scilit] [PubMed]
- Silva, Y.P.; Bernardi, A.; Frozza, R.L. The Role of Short-Chain Fatty Acids From Gut Microbiota in Gut-Brain Communication. Front. Endocrinol. 2020, 11, 25. [Google Scholar] [CrossRef] [Scilit] [PubMed]
- Scheiman, J.; Luber, J.M.; Chavkin, T.A.; MacDonald, T.; Tung, A.; Pham, L.D.; Wibowo, M.C.; Wurth, R.C.; Punthambaker, S.; Tierney, B.T.; et al. Meta-omics analysis of elite athletes identifies a performance-enhancing microbe that functions via lactate metabolism. Nat. Med. 2019, 25, 1104–1109. [Google Scholar] [CrossRef] [Scilit] [PubMed]
- Allen, J.M.; Mailing, L.J.; Niemiro, G.M.; Moore, R.; Cook, M.D.; White, B.A.; Holscher, H.D.; Woods, J.A. Exercise Alters Gut Microbiota Composition and Function in Lean and Obese Humans. Med. Sci. Sports Exerc. 2018, 50, 747–757. [Google Scholar] [CrossRef] [Scilit] [PubMed]
- Zhang, Y.; Xu, D.; Cai, X.; Xing, X.; Shao, X.; Yin, A.; Zhao, Y.; Wang, M.; Fan, Y.N.; Liu, B.; et al. Gut Commensal Barnesiella Intestinihominis Ameliorates Hyperglycemia and Liver Metabolic Disorders. Adv. Sci. 2025, 12, e2411181. [Google Scholar] [CrossRef] [Scilit] [PubMed]
- Jaggar, M.; Rea, K.; Spichak, S.; Dinan, T.G.; Cryan, J.F. You’ve got male: Sex and the microbiota-gut-brain axis across the lifespan. Front. Neuroendocrinol. 2020, 56, 100815. [Google Scholar] [CrossRef] [Scilit] [PubMed]
- Kim, Y.S.; Unno, T.; Kim, B.Y.; Park, M.S. Sex Differences in Gut Microbiota. World J. Men’s Health 2020, 38, 48–60. [Google Scholar] [CrossRef] [Scilit] [PubMed]
- Hoffmann Sardá, F.A.; Giuntini, E.B.; Oliveira, A.; Souza, G.S.; Prado, S.B.R.; Taddei, C.R.; Tadini, C.C.; Bittinger, K.; Bushman, F.D.; Menezes, E.W.; et al. Baseline intestinal microbiota composition influences response to a real-world dietary fiber intervention. npj Biofilms Microbiomes 2025, 11, 203. [Google Scholar] [CrossRef] [Scilit] [PubMed]
- Binda, C.; Lopetuso, L.R.; Rizzatti, G.; Gibiino, G.; Cennamo, V.; Gasbarrini, A. Actinobacteria: A relevant minority for the maintenance of gut homeostasis. Dig. Liver Dis. 2018, 50, 421–428. [Google Scholar] [CrossRef] [Scilit] [PubMed]
- Waite, D.W.; Chuvochina, M.; Pelikan, C.; Parks, D.H.; Yilmaz, P.; Wagner, M.; Loy, A.; Naganuma, T.; Nakai, R.; Whitman, W.B.; et al. Proposal to reclassify the proteobacterial classes Deltaproteobacteria and Oligoflexia, and the phylum Thermodesulfobacteria into four phyla reflecting major functional capabilities. Int. J. Syst. Evol. Microbiol. 2020, 70, 5972–6016. [Google Scholar] [CrossRef] [Scilit] [PubMed]
- Kerff, F.; Pasco, J.A.; Williams, L.J.; Jacka, F.N.; Loughman, A.; Dawson, S.L. Associations Between Oral Microbiota Pathogens and Elevated Depressive and Anxiety Symptoms in Men. Depress. Anxiety 2025, 2025, 9961595. [Google Scholar] [CrossRef] [Scilit] [PubMed]
- Kolodziejczyk, A.A.; Zheng, D.; Elinav, E. Diet-microbiota interactions and personalized nutrition. Nat. Rev. Microbiol. 2019, 17, 742–753. [Google Scholar] [CrossRef] [Scilit] [PubMed]
- Koh, A.; De Vadder, F.; Kovatcheva-Datchary, P.; Bäckhed, F. From Dietary Fiber to Host Physiology: Short-Chain Fatty Acids as Key Bacterial Metabolites. Cell 2016, 165, 1332–1345. [Google Scholar] [CrossRef] [Scilit] [PubMed]
- Gao, K.; Mu, C.L.; Farzi, A.; Zhu, W.Y. Tryptophan Metabolism: A Link Between the Gut Microbiota and Brain. Adv. Nutr. 2020, 11, 709–723. [Google Scholar] [CrossRef] [Scilit] [PubMed]
- Kennedy, P.J.; Cryan, J.F.; Dinan, T.G.; Clarke, G. Kynurenine pathway metabolism and the microbiota-gut-brain axis. Neuropharmacology 2017, 112, 399–412. [Google Scholar] [CrossRef] [Scilit] [PubMed]
- Li, X.; Zhang, Z.H.; Zabed, H.M.; Yun, J.; Zhang, G.; Qi, X. An insight into the roles of dietary tryptophan and its metabolites in intestinal inflammation and inflammatory bowel disease. Mol. Nutr. Food Res. 2021, 65, e2000461. [Google Scholar] [CrossRef] [Scilit] [PubMed]
- Zmora, N.; Zilberman-Schapira, G.; Suez, J.; Mor, U.; Dori-Bachash, M.; Bashiardes, S.; Kotler, E.; Zur, M.; Regev-Lehavi, D.; Brik, R.B.; et al. Personalized Gut Mucosal Colonization Resistance to Empiric Probiotics Is Associated with Unique Host and Microbiome Features. Cell 2018, 174, 1388–1405.e1321. [Google Scholar] [CrossRef] [Scilit] [PubMed]
- Zavala-Medina, L.C.; Salas-Leiva, J.S.; Villegas-Mercado, C.E.; Arreguín-Cano, J.A.; Soto-Barreras, U.; Santana-Delgado, S.A.; Larrinua-Pacheco, A.D.; García-Vega, M.F.; Bermúdez, M. Oral Dysbiosis and Neuroinflammation: Implications for Alzheimer’s, Parkinson’s and Mood Disorders. Microorganisms 2026, 14, 143. [Google Scholar] [CrossRef] [Scilit] [PubMed]
- Zhu, H.; Huang, C.; Luo, Z.; Wu, L.; Cheng, X.; Wu, H. Porphyromonas gingivalis Induces Disturbance of Kynurenine Metabolism Through the Gut-Brain Axis: Implications for Alzheimer’s Disease. J. Dent. Res. 2025, 104, 439–448. [Google Scholar] [CrossRef] [Scilit] [PubMed]
- Cryan, J.F.; O’Riordan, K.J.; Cowan, C.S.M.; Sandhu, K.V.; Bastiaanssen, T.F.S.; Boehme, M.; Codagnone, M.G.; Cussotto, S.; Fulling, C.; Golubeva, A.V.; et al. The Microbiota-Gut-Brain Axis. Physiol. Rev. 2019, 99, 1877–2013. [Google Scholar] [CrossRef] [Scilit] [PubMed]
- Crovesy, L.; Masterson, D.; Rosado, E.L. Profile of the gut microbiota of adults with obesity: A systematic review. Eur. J. Clin. Nutr. 2020, 74, 1251–1262. [Google Scholar] [CrossRef] [Scilit] [PubMed]
- Johnson, R.J.; Nakagawa, T.; Sanchez-Lozada, L.G.; Shafiu, M.; Sundaram, S.; Le, M.; Ishimoto, T.; Sautin, Y.Y.; Lanaspa, M.A. Sugar, uric acid, and the etiology of diabetes and obesity. Diabetes 2013, 62, 3307–3315. [Google Scholar] [CrossRef] [Scilit] [PubMed]
- Lee, S.J.; Oh, B.K.; Sung, K.C. Uric acid and cardiometabolic diseases. Clin. Hypertens. 2020, 26, 13. [Google Scholar] [CrossRef] [Scilit] [PubMed]
- Lutsiv, T.; McGinley, J.N.; Neil-McDonald, E.S.; Weir, T.L.; Foster, M.T.; Thompson, H.J. Relandscaping the Gut Microbiota with a Whole Food: Dose-Response Effects to Common Bean. Foods 2022, 11, 1153. [Google Scholar] [CrossRef] [Scilit] [PubMed]
- Vítek, L. The role of bilirubin in diabetes, metabolic syndrome, and cardiovascular diseases. Front. Pharmacol. 2012, 3, 55. [Google Scholar] [CrossRef] [Scilit] [PubMed]
- Ridlon, J.M.; Kang, D.J.; Hylemon, P.B. Bile salt biotransformations by human intestinal bacteria. J. Lipid Res. 2006, 47, 241–259. [Google Scholar] [CrossRef] [Scilit] [PubMed]
- Blaak, E.E.; Canfora, E.E.; Theis, S.; Frost, G.; Groen, A.K.; Mithieux, G.; Nauta, A.; Scott, K.; Stahl, B.; van Harsselaar, J.; et al. Short chain fatty acids in human gut and metabolic health. Benef. Microbes 2020, 11, 411–455. [Google Scholar] [CrossRef] [Scilit] [PubMed]
- Vacca, M.; Celano, G.; Calabrese, F.M.; Portincasa, P.; Gobbetti, M.; De Angelis, M. The Controversial Role of Human Gut Lachnospiraceae. Microorganisms 2020, 8, 573. [Google Scholar] [CrossRef] [Scilit] [PubMed]
- Meijers, B.; Evenepoel, P.; Anders, H.J. Intestinal microbiome and fitness in kidney disease. Nat. Rev. Nephrol. 2019, 15, 531–545. [Google Scholar] [CrossRef] [Scilit] [PubMed]
- Flint, H.J.; Duncan, S.H.; Scott, K.P.; Louis, P. Links between diet, gut microbiota composition and gut metabolism. Proc. Nutr. Soc. 2015, 74, 13–22. [Google Scholar] [CrossRef] [Scilit] [PubMed]
- Just, S.; Mondot, S.; Ecker, J.; Wegner, K.; Rath, E.; Gau, L.; Streidl, T.; Hery-Arnaud, G.; Schmidt, S.; Lesker, T.R.; et al. The gut microbiota drives the impact of bile acids and fat source in diet on mouse metabolism. Microbiome 2018, 6, 134. [Google Scholar] [CrossRef] [Scilit] [PubMed]



| Groups | ||||
|---|---|---|---|---|
| OCG n = 77 | OIS n = 23 | OPS n = 6 | Total | |
| Males (%) | 65 (84.4) | 15 (65.2) | 3 (50) | 83 (78.3) |
| Females (%) | 12 (15.6) | 8 (34.8) | 3 (50) | 23 (21.7) |
| Age (years) Mean (±SD) | 40.1 (7.72) | 39.04 (5.69) | 33.83 (6.11) | 39.44 (7.32) |
| OCG | OIS | OPS | Group Inter S | Time B vs. A | Interaction GbT | ||||
|---|---|---|---|---|---|---|---|---|---|
| Intervention | Before | After | Before | After | Before | After | p-Value | p-Value | p-Value |
| Body composition analysis | |||||||||
| Weight (kg) | 97.26 (10.94) | 85.56 (9.72) | 95.58 (11.11) | 84.22 (7.88) | 98.69 (12.08) | 89.33 (9.07) | 0.462 | <0.001 | 0.920 |
| BMI (kg/m2) | 34.63 (3.06) | 30.47 (2.58) | 35.26 (3.34) | 31.61 (2.75) | 35.81 (4.49) | 32 (4.38) | 0.287 | <0.001 | 0.265 |
| Body Fat (%) | 37.40 (5.86) | 31.95 (7.51) | 39.78 (6.66) | 30.83 (7.27) | 41.15 (8.20) | 29.33 (5.68) | 0.863 | <0.001 | 0.083 |
| Fat-free mass (%) | 62.60 (5.86) | 68.14 (7.46) | 60.22 (6.66) | 69.17 (7.27) | 58.85 (8.20) | 70.83 (6.014) | 0.849 | <0.001 | 0.087 |
| Muscle mass (kg) | 32.49 (5.24) | 31.09 (4.98) | 30.48 (6.30) | 29.43 (6.11) | 31 (2) | 29.67 (2.58) | 0.306 | <0.001 | 0.410 |
| Serum biochemistry | |||||||||
| Glucose (mg/dL) | 95.18 (22.79) | 89.41 (8.95) | 91.45 (13.63) | 89.89 (6.80) | 85.90 (14.86) | 88.10 (8.17) | 0.755 | 0.978 | 0.834 |
| HDL-cholesterol (mg/dL) | 40.42 (9.6) | 42.92 (7.75) | 43.22 (11.60) | 47 (17.33) | 38.33 (11.07) | 40.17 (10.94) | 0.629 | 0.378 | 0.528 |
| LDL-cholesterol (mg/dL) | 149.85 (177.73) | 123.19 (26.96) | 137.48 (32.76) | 124.22 (27.16) | 86.17 (35.25) | 96.83 (22.86) | 0.691 | 0.764 | 0.864 |
| VLDL-cholesterol (mg/dL) | 35.61 (18.10) | 21.91 (10.28) | 32.26 (13.73) | 21.87 (8.06) | 25.17 (9.8) | 19.33 (4.76) | 0.812 | 0.001 | 0.88 |
| Total cholesterol (mg/dL) | 206.07 (28.75) | 187.99 (33.07) | 212.96 (34.95) | 190.22 (33.92) | 187.17 (80.80) | 156.33 (35.57) | 0.522 | <0.001 | 0.284 |
| TG (mg/dL) | 178.41 (90.30) | 109.59 (51.60) | 163.70 (69.20) | 113.17 (35.20) | 125.83 (47.90) | 96 (24.10) | 0.807 | <0.001 | 0.835 |
| BUN (mg/dL) | 16.09 (20.51) | 14.46 (3.10) | 22.42 (28.11) | 13.25 (4.69) | 24 (28.76) | 11.63 (3.42) | 0.992 | <0.001 | 0.944 |
| Creatinine (mg/dL) | 0.89 (0.15) | 0.92 (0.15) | 0.88 (0.16) | 0.87 (0.16) | 0.83 (0.18) | 0.85 (0.025) | 0.634 | 0.197 | 0.119 |
| CRP (mg/dL) | 0.52 (0.67) | 0.28 (0.30) | 0.76 (1.13) | 0.30 (0.22) | 0.82 (0.76) | 0.52 (0.81) | 0.273 | 0.006 | 0.316 |
| Uric acid (mg/dL) | 6.75 (1.62) | 6.50 (1.46) | 6.52 (1.80) | 6.25 (1.67) | 6.30 (1.85) | 5.38 (1.13) | 0.980 | 0.034 | 0.265 |
| Insulin (Uu/mL) | 12.31 (5.92) | 5.86 (4.15) | 12.70 (4.28) | 6.62 (3.59) | 13.08 (5.61) | 9.03 (9.31) | 0.649 | <0.001 | 0.750 |
| Cortisol (μg/dL) | 8.49 (3.43) | 9.31 (2.96) | 8.46 (2.44) | 8.93 (2.75) | 9.91 (2.96) | 8.33 (3.40) | 0.491 | 0.984 | 0.335 |
| Liver panel | |||||||||
| Total Bilirubin (mg/dL) | 1.07 (0.38) b | 1.08 (0.43) | 0.85 (0.26) | 0.87 (0.36) | 0.78 (0.31) | 0.82 (0.34) | 0.006 | 0.078 | 0.833 |
| Direct Bilirubin (mg/dL) | 0.26 (1.16) | 0.18 (0.15) | 0.10 (0.04) | 0.18 (0.23) | 0.10 (0.10) | 0.25 (0.20) | 0.737 | 0.771 | 0.713 |
| Indirect Bilirubin (mg/dL) | 0.97 (0.34) b | 0.94 (0.38) | 0.75 (0.25) | 0.80 (0.29) | 0.68 (0.24) | 0.72 (0.27) | 0.004 | 0.721 | 0.446 |
| AST (UI/L) | 36.66 (28.88) | 25.69 (21.67) | 27.09 (7.93) | 22.55 (4.75) | 48.50 (29.79) | 24.50 (3.56) | 0.146 | <0.001 | 0.083 |
| ALT (UI/L) | 57.97 (55.92) | 33.55 (45.96) | 36.05 (22.35) | 25.10 (7.34) | 81.50 (71.67) | 26.95 (9.12) | 0.107 | <0.001 | 0.085 |
| Total proteins (g/dL) | 7.30 (0.034) | 6.99 (0.41) | 7.26 (0.54) | 7.05 (0.39) | 7.43 (0.38) | 7.05 (0.22) | 0.814 | <0.001 | 0.500 |
| Albumin (g/dL) | 4.33 (0.23) b | 4.32 (0.26) | 4.18 (0.29) | 4.17 (0.28) | 4.12 (0.40) | 4.05 (0.25) | 0.004 | 0.481 | 0.832 |
| Globulins (g/dL) | 2.99 (0.35) | 2.66 (0.32) | 3.11 (0.32) | 2.88 (0.29) | 3.32 (0.27) | 3 (0.37) | 0.054 | <0.001 | 0.534 |
| Alb/Globulins | 1.48 (0.20) | 1.78 (1.2) | 1.35 (0.15) | 1.46 (0.18) | 1.25 (0.19) | 1.37 (0.25) | 0.001 | 0.267 | 0.686 |
| GGT (UI/L) | 45.35 (40.07) | 19.74 (11.62) | 38.18 (24.58) | 20.73 (16.05) | 53 (58.56) | 16.17 (5.23) | 0.633 | <0.001 | 0.428 |
| ALP (UI/L) | 66.11 (16.64) | 63.40 (16.79) | 68.50 (11.87) | 62.07 (14.17) | 71 (14.04) | 61.32 (9.03) | 0.713 | 0.003 | 0.276 |
| Neurotrophic and intestinal permeability biomarkers | |||||||||
| BDNF (ng/mL) | 3.57 (4.33) | 3.37 (3.57) | 4.93 (6.37) | 3.14 (3.54) | 2.11 (1.38) | 2.49 (1.11) | 0.564 | 0.623 | 0.555 |
| Zonulin (ng/mL) | 53.37 (17.86) | 39.51 (16.66) | 56.45 (20.04) | 36.43 (26.14) | 53.64 (26.25) | 17.42 (14.95) | 0.405 | <0.001 | 0.350 |
| Variable | OCG n = 70 | OIS n = 22 | OPS n = 5 | Group Inter S | Time B vs. A | Interaction GbT | |||
|---|---|---|---|---|---|---|---|---|---|
| Before | After | Before | After | Before | After | p-Value | p-Value | p-Value | |
| Bacillota/Bacteroidota | 0.77 (0.70) | 1.3 (3.26) | 0.81 (0.76) | 1.54 (2.79) | 1.03 (0.74) | 0.87 (0.52) | 0.681 | 0.353 | 0.749 |
| Bacteroidota | 48.85 (23.27) | 46.68 (22.08) | 46.64 (25.16) | 40.45 (24.16) | 36.29 (20.56) | 37.66 (20.60) | 0.477 | 0.458 | 0.727 |
| Bacillota | 34.62 (19.78) | 38.57 (21.13) | 33.76 (20.39) | 40.60 (24.93) | 40.18 (23.36) | 37.66 (20.29) | 0.720 | 0.584 | 0.593 |
| Proteobacteria | 3.40 (6.84) | 3.60 (5.08) | 5.21 (9.04) | 4.23 (6.49) | 3.46 (4.92) | 5.60 (9.33) | 0.520 | 0.492 | 0.649 |
| Verrucomicrobiota | 0.25 (0.83) | 1.02 (3.04) | 0.47 (1.03) | 0.42 (1.21) | 0.14 (0.16) | 0.64 (0.92) | 0.534 | 0.346 | 0.362 |
| Actinobacteriota | 0.51 (0.66) | 0.38 (0.48) | 0.41 (0.62) | 0.49 (0.73) | 2.18 (3.92) | 1.40 (1.14) | 0.005 | 0.094 | 0.223 |
| Desulfobacterota | 0.41 (0.51) | 0.40 (0.71) | 0.31 (0.44) | 0.42 (0.71) | 0.99 (0. 84) | 0.41 (0.46) | 0.030 | 0.257 | 0.148 |
| Cyanobacteria | 0.27 (0.93) | 0.28 (0.68) | 0.09 (0.27) | 0.16 (0.33) | 0.46 (0.87) | 0.30 (0.64) | 0.480 | 0.848 | 0.877 |
| Spirochaetota | 0.00 (0.01) | 0.04 (0.42) | 0.00 (0.01) | 0.27 (0.87) | 0.00 (0.00) | 0.00 (0.00) | 0.813 | 0.246 | 0.210 |
| Fusobacteriota | 0.02 (0.05) | 0.02 (0.05) | 0.09 (0.23) | 0.00 (0.01) | 0.00 (0.00) | 0.00 (0.01) | 0.066 | 0.131 | 0.018 |
| Bacteroidia | 48.85 (23.27) | 46.68 (22.08) | 46.64 (25.16) | 40.45 (24.16) | 36.29 (20.56) | 37.66 (20.60) | 0.477 | 0.458 | 0.727 |
| Clostridia | 30.40 (18.57) | 34.08 (20.79) | 28.99 (18.61) | 36.17 (23.82) | 36.80 (21.49) | 32.33 (16.58) | 0.645 | 0.710 | 0.463 |
| Bacilli | 1.08 (1.14) | 1.01 (1.09) | 0.89 (1.17) | 2.18 (3.99) | 1.73 (1.47) | 2.84 (2.88) | 0.220 | 0.048 | 0.008 |
| Gammaproteobacteria | 3.33 (6.85) | 3.44 (5.01) | 5.18 (9.04) | 4.18 (6.48) | 3.13 (4.84) | 5.55 (9.21) | 0.525 | 0.469 | 0.625 |
| Negativicutes | 3.11 (3.45) | 3.42 (4.73) | 3.86 (3.77) | 2.21 (2.58) | 1.55 (1.60) | 2.27 (2.94) | 0.408 | 0.857 | 0.229 |
| Verrucomicrobiae | 0.21 (0.81) | 0.90 (2.90) | 0.42 (1.01) | 0.34 (1.14) | 0.08 (0.11) | 0.47 (0.84) | 0.512 | 0.333 | 0.353 |
| Desulfovibrionia | 0.36 (0.50) | 0.36 (0.68) | 0.27 (0.42) | 0.37 (0.67) | 0.82 (0.85) | 0.34 (0.45) | 0.030 | 0.258 | 0.148 |
| Coriobacteriia | 0.29 (0.40) | 0.28 (0.44) | 0.23 (0.33) | 0.37 (0.66) | 0.98 (1.90) | 0.78 (0.75) | 0.013 | 0.661 | 0.316 |
| Vampirivibrionial | 0.27 (0.93) | 0.28 (0.68) | 0.09 (0.27) | 0.16 (0.33) | 0.46 (0.87) | 0.30 (0.64) | 0.480 | 0.848 | 0.877 |
| Alphaproteobacteria | 0.07 (0.26) | 0.15 (0.58) | 0.036 (0.15) | 0.04 (0.15) | 0.32 (0.79) | 0.05 (0.12) | 0.046 | 0.495 | 0.070 |
| Actinobacteria | 0.16 (0.32) | 0.060 (0.11) | 0.12 (0.35) | 0.050 (0.10) | 0.82 (1.72) | 0.38 (0.43) | 0.005 | 0.007 | 0.169 |
| Spirochaetia | 0.00 (0.01) | 0.05 (0.42) | 0.00 (0.02) | 0.26 (0.87) | 0.00 (0.00) | 0.00 (0.00) | 0.838 | 0.258 | 0.238 |
| Fusobacteriia | 0.02 (0.05) | 0.02 (0.05) | 0.09 (0.23) | 0.01 (0.02) | 0.01 (0.01) | 0.01 (0.01) | 0.066 | 0.131 | 0.018 |
| Prevotella | 24.16 (22.33) | 20.89 (20.12) | 22.67 (23.48) | 19.45 (19.14) | 9.90 (8.28) | 14.41 (10.58) | 0.708 | 0.923 | 0.874 |
| Bacteroides | 13.47 (16.35) | 12.97 (17.24) | 13.41 (14.72) | 10.37 (16.86) | 13.26 (15.08) | 7.72 (6.52) | 0.680 | 0.129 | 0.830 |
| Faecalibacterium | 5.37 (5.22) | 6.5 (10.36) | 5.33 (4.42) | 8.15 (11.45) | 5.65 (4.21) | 6.26 (3.57) | 0.964 | 0.670 | 0.556 |
| UCG002 | 3.92 (4.12) | 6.29 (10.40) | 3.56 (3.14) | 4.04 (2.64) | 5.34 (4.90) | 3.75 (2.40) | 0.603 | 0.538 | 0.263 |
| Eubacterium coprostanoligenes | 2.66 (2.92) | 2.90 (4.11) | 2.16 (2.28) | 1.50 (2.05) | 2.92 (2.95) | 4.97 (8.67) | 0.711 | 0.225 | 0.394 |
| Escherichia-Shigella | 1.58 (2.32) | 1.91 (2.26) | 5.19 (8.88) | 3.90 (4.47) | 0.82 (1.10) | 2.60 (2.92) | 0.004 | 0.762 | 0.351 |
| Alistipe | 2.43 (3.51) | 1.96 (1.22) | 1.61 (2.41) | 2.15 (1.47) | 2.84 (3.44) | 2.61 (1.56) | 0.311 | 0.618 | 0.204 |
| Roseburia | 2.14 (2.82) | 1.80 (3.61) | 2.06 (2.90) | 2.82 (4.63) | 1.99 (1.57) | 1.12 (1.77) | 0.916 | 0.562 | 0.397 |
| Ruminococcus | 1.99 (1.95) | 1.90 (4.81) | 1.74 (1.85) | 1.83 (3.76) | 2.14 (2.90) | 1.48 (0.97) | 0.792 | 0.626 | 0.927 |
| Lachnospiraceae NK4A136 | 1.56 (2.05) | 1.78 (1.19) | 2.49 (4.14) | 1.88 (2.04) | 1.07 (0.99) | 2.44 (3.15) | 0.267 | 0.614 | 0.239 |
| Parabacteroides | 1.59 (1.57) | 1.97 (2.40) | 1.27 (1.08) | 1.37 (1.44) | 1.60 (0.92) | 1.42 (1.23) | 0.514 | 0.878 | 0.845 |
| Succinivibrio | 1.76 (6.10) | 1.96 (4.48) | 0.52 (0.88) | 1.08 (1.88) | 0.56 (0.64) | 0.65 (1.32) | 0.607 | 0.807 | 0.947 |
| Muribaculaceae | 1.42 (2.83) | 1.16 (1.41) | 1.71 (2.83) | 1.43 (1.88) | 0.21 (0.51) | 0.71 (0.60) | 0.418 | 0.913 | 0.767 |
| Alloprevotella | 1.33 (1.90) | 1.30 (2.96) | 1.66 (2.43) | 0.87 (0.98) | 0.22 (0.24) | 0.95 (1.81) | 0.214 | 0.732 | 0.435 |
| Eubacterium siraeum group | 1.22 (1.87) | 1.29 (3.09) | 1.10 (1.26) | 0.71 (1.63) | 1.21 (1.24) | 1.14 (2.20) | 0.907 | 0.833 | 0.598 |
| Coprococcus | 1.28 (1.50) | 0.82 (1.82) | 0.69 (0.89) | 2.36 (5.19) | 1.22 (0.97) | 0.41 (0.41) | 0.218 | 0.676 | 0.011 |
| Barnesiella | 0.71 (1.82) | 0.99 (3.68) | 1.15 (3.91) | 0.88 (3.88) | 4.00 (4.96) | 3.65 (8.83) | 0.020 | 0.628 | 0.978 |
| Subdoligranulum | 0.85 (1.63) | 1.16 (1.49) | 1.00 (1.62) | 1.30 (1.60) | 1.50 (1.37) | 1.46 (1.00) | 0.064 | 0.652 | 0.523 |
| Dialister | 1.03 (2.79) | 1.16 (1.84) | 1.23 (2.08) | 1.10 (3.58) | 0.26 (0.40) | 0.99 (1.29) | 0.873 | 0.569 | 0.900 |
| Ruminococcus torques group | 0.81 (1.46) | 0.92 (1.37) | 0.98 (1.31) | 1.00 (1.59) | 1.07 (0.74) | 1.47 (2.87) | 0.984 | 0.878 | 0.579 |
| Dorea | 0.59 (1.40) | 0.80 (0.72) | 0.58 (0.64) | 1.06 (1.02) | 4.49 (5.73) | 0.79 (0.48) | <0.001 | 0.004 | <0.001 |
| Clostridia UCG014 | 0.62 (0.67) | 0.77 (0.83) | 0.98 (1.38) | 0.87 (1.02) | 0.61 (0.44) | 0.69 (0.75) | 0.207 | 0.794 | 0.601 |
| UCG003 | 0.64 (0.66) | 0.72 (1.12) | 0.64 (0.46) | 0.33 (0.55) | 1.10 (1.11) | 3.07 (5.04) | 0.398 | 0.016 | 0.044 |
| RikenellaceaeRC9 | 0.74 (1.83) | 0.55 (0.70) | 0.21 (0.30) | 1.16 (1.47) | 0.65 (0.91) | 2.15 (2.76) | 0.356 | 0.030 | 0.011 |
| UCG005 | 0.61 (0.62) | 0.70 (0.63) | 0.44 (0.31) | 0.77 (0.55) | 0.73 (0.62) | 0.61 (0.23) | 0.414 | 0.473 | 0.301 |
| NK4A21 group | 0.52 (0.57) | 0.76 (1.56) | 0.56 (0.48) | 0.44 (0.92) | 1.03 (1.22) | 0.70 (0.73) | 0.284 | 0.660 | 0.748 |
| Paraprevotella | 0.52 (0.70) | 0.72 (2.23) | 0.56 (1.09) | 0.24 (0.50) | 0.89 (0.53) | 1.24 (2.02) | 0.810 | 0.833 | 0.623 |
| Phascolarctobacterium | 0.49 (0.57) | 0.61 (0.53) | 0.78 (1.27) | 0.75 (1.04) | 0.41 (0.29) | 0.52 (0.42) | 0.330 | 0.921 | 0.882 |
| uncultured X | 0.55 (0.46) | 0.55 (0.88) | 0.48 (0.42) | 0.65 (0.70) | 0.42 (0.46) | 0.59 (0.36) | 0.530 | 0.609 | 0.582 |
| Blautia | 0.49 (0.98) | 0.55 (0.73) | 0.41 (0.53) | 0.66 (0.73) | 0.64 (0.84) | 0.39 (0.20) | 0.892 | 0.814 | 0.649 |
| Veillonella | 0.52 (1.19) | 0.48 (0.40) | 0.21 (0.40) | 0.54 (0.61) | 0.25 (0.36) | 0.76 (0.14) | 0.600 | 0.097 | 0.427 |
| Christensenellaceae R7 group | 0.39 (0.55) | 0.48 (0.46) | 0.38 (0.53) | 0.46 (0.35) | 1.14 (1.56) | 0.60 (0.40) | 0.136 | 0.134 | 0.331 |
| Akkermansia | 0.37 (0.88) | 0.39 (1.27) | 0.51 (1.07) | 0.85 (1.75) | 0.23 (0.28) | 0.14 (0.18) | 0.768 | 0.749 | 0.765 |
| UCG010 | 0.39 (0.42) | 0.44 (0.60) | 0.38 (0.35) | 0.51 (0.84) | 0.56 (0.28) | 0.59 (0.49) | 0.827 | 0.623 | 0.909 |
| Gastranaerophilales | 0.41 (1.58) | 0.43 (0.58) | 0.087 (0.29) | 0.36 (0.59) | 0.61 (0.93) | 0.34 (0.47) | 0.490 | 0.961 | 0.641 |
| Haemophilus | 0.41 (0.84) | 0.36 (0.49) | 0.10 (0.13) | 0.43 (0.74) | 0.31 (0.33) | 0.75 (0.46) | 0.232 | 0.084 | 0.286 |
| Streptococcus | 0.35 (0.45) | 0.28 (0.57) | 0.27 (0.60) | 0.39 (0.57) | 0.23 (0.11) | 1.56 (1.72) | 0.722 | 0.002 | 0.001 |
| Catenibacterium | 0.30 (0.38) | 0.29 (0.34) | 0.30 (0.43) | 0.25 (0.33) | 0.58 (0.83) | 0.98 (1.60) | 0.414 | 0.148 | 0.318 |
| Desulfovibrio | 0.34 (0.50) | 0.35 (1.43) | 0.21 (0.28) | 0.26 (0.54) | 0.08 (0.09) | 0.007 (0.01) | 0.202 | 0.831 | 0.957 |
| Butyrivibrio | 0.30 (0.71) | 0.30 (0.64) | 0.37 (0.87) | 0.37 (0.64) | 0.02 (0.04) | 0.29 (0.45) | 0.685 | 0.489 | 0.895 |
| Sutterella | 0.29 (0.36) | 0.29 (0.24) | 0.29 (0.33) | 0.30 (0.37) | 0.34 (0.43) | 0.38 (0.18) | 0.982 | 0.769 | 0.911 |
| Monoglobus | 0.21 (0.38) | 0.29 (0.55) | 0.52 (1.09) | 0.31 (0.45) | 0.42 (0.61) | 0.20 (0.17) | 0.216 | 0.260 | 0.435 |
| Clostridium sensu stricto1 | 0.28 (0.74) | 0.31 (0.71) | 0.079 (0.13) | 0.19 (0.35) | 1.14 (0.73) | 0.36 (0.70) | 0.003 | 0.216 | 0.146 |
| Collinsella | 0.20 (0.55) | 0.28 (0.74) | 0.37 (0.97) | 0.17 (0.34) | 0.76 (1.56) | 0.44 (0.91) | 0.149 | 0.481 | 0.392 |
| Odoribacter | 0.24 (0.22) | 0.26 (0.48) | 0.22 (0.38) | 0.30 (0.86) | 0.36 (0.38) | 0.097 (0.14) | 0.746 | 0.335 | 0.641 |
| Butyricimonas | 0.20 (0.30) | 0.26 (0.30) | 0.36 (0.76) | 0.15 (0.16) | 0.35 (0.26) | 0.43 (0.24) | 0.291 | 0.881 | 0.120 |
| Bifidobacterium | 0.20 (0.46) | 0.24 (0.44) | 0.088 (0.11) | 0.19 (0.25) | 0.92 (1.91) | 0.23 (0.25) | 0.008 | 0.318 | 0.020 |
| Lachnospiraceae UCG004 | 0.21 (0.29) | 0.21 (0.33) | 0.24 (0.26) | 0.21 (0.29) | 0.20 (0.32) | 0.40 (0.33) | 0.930 | 0.378 | 0.632 |
| Eubacterium ruminantium group | 0.20 (0.36) | 0.16 (0.23) | 0.23 (0.41) | 0.40 (0.88) | 0.11 (0.07) | 0.15 (0.14) | 0.747 | 0.755 | 0.256 |
| Megasphaera | 0.21 (0.54) | 0.13 (0.33) | 0.21 (0.63) | 0.52 (1.15) | 0.09 (0.18) | 0.10 (0.14) | 0.909 | 0.558 | 0.057 |
| Eubacterium eligens group | 0.21 (0.38) | 0.21 (0.57) | 0.13 (0.14) | 0.11 (0.20) | 0.11 (0.08) | 0.45 (0.70) | 0.748 | 0.358 | 0.463 |
| Holdemanella | 0.15 (0.22) | 0.23 (0.67) | 0.15 (0.22) | 0.11 (0.36) | 0.44 (0.75) | 0.15 (0.21) | 0.105 | 0.268 | 0.685 |
| Eubacterium xylanophilum group | 0.16 (0.64) | 0.18 (0.31) | 0.21 (0.52) | 0.27 (0.35) | 0.06 (0.08) | 0.19 (0.40) | 0.825 | 0.726 | 0.810 |
| Lachnoclostridium | 0.14 (0.33) | 0.19 (0.26) | 0.20 (0.34) | 0.19 (0.32) | 0.18 (0.15) | 0.16 (0.15) | 0.784 | 0.975 | 0.941 |
| Lachnospiraceae UCG001 | 0.16 (0.36) | 0.20 (0.25) | 0.05 (0.08) | 0.14 (0.19) | 0.46 (0.84) | 0.14 (0.18) | 0.050 | 0.780 | 0.042 |
| RF39 | 0.15 (0.19) | 0.16 (0.35) | 0.12 (0.19) | 0.17 (0.30) | 0.13 (0.11) | 0.39 (0.36) | 0.824 | 0.182 | 0.267 |
| Acidaminococcus | 0.14 (0.28) | 0.13 (0.20) | 0.05 (0.09) | 0.27 (0.64) | 0.15 (0.17) | 0.50 (0.64) | 0.295 | 0.035 | 0.023 |
| Romboutsia | 0.10 (0.13) | 0.001 (0.009) | 0.16 (0.33) | 0.80 (3.58) | 0.14 (0.09) | 0.00 (0.01) | 0.432 | 0.755 | 0.135 |
| Comamonas | 0.08 (0.16) | 0.15 (0.28) | 0.22 (0.83) | 0.19 (0.38) | 0.04 (0.06) | 0.05 (0.04) | 0.433 | 0.923 | 0.839 |
| Allisionella | 0.13 (0.22) | 0.16 (0.20) | 0.06 (0.05) | 0.12 (0.15) | 0.08 (0.09) | 0.17 (0.10) | 0.453 | 0.205 | 0.898 |
| Citrobacter | 0.14 (0.36) | 0.15 (0.26) | 0.03 (0.06) | 0.13 (0.23) | 0.02 (0.05) | 0.14 (0.12) | 0.323 | 0.300 | 0.610 |
| Anaerostipes | 0.11 (0.17) | 0.16 (0.60) | 0.07 (0.11) | 0.05 (0.16) | 0.22 (0.19) | 0.06 (0.13) | 0.185 | 0.789 | 0.571 |
| Parasutterella | 0.13 (0.51) | 0.10 (0.17) | 0.07 (0.18) | 0.22 (0.59) | 0.01 (0.02) | 0.03 (0.04) | 0.707 | 0.705 | 0.370 |
| Lachnospira | 0.10 (0.16) | 0.11 (0.12) | 0.10 (0.17) | 0.17 (0.20) | 0.09 (0.05) | 0.09 (0.05) | 0.911 | 0.595 | 0.413 |
| Paraprevotellaceae NK3B31 group | 0.12 (0.23) | 0.05 (0.44) | 0.03 (0.07) | 0.30 (0.93) | 0.05 (0.00) | 0.00 (0.00) | 0.140 | 0.535 | 0.117 |
| Erysipelotrichaceae UCG003 | 0.08 (0.22) | 0.11 (0.54) | 0.04 (0.07) | 0.02 (0.04) | 0.34 (0.66) | 0.01 (0.02) | 0.068 | 0.394 | 0.213 |
| Bilophila | 0.05 (0.21) | 0.11 (0.38) | 0.10 (0.21) | 0.03 (0.08) | 0.57 (1.16) | 0.02 (0.04) | 0.005 | 0.016 | 0.037 |
| Eubacterium ventriossum group | 0.08 (0.11) | 0.01 (0.050) | 0.087 (0.16) | 0.38 (1.56) | 0.14 (0.20) | 0.02 (0.06) | 0.960 | 0.971 | 0.088 |
| Klebsiella | 0.08 (0.55) | 0.07 (0.15) | 0.058 (0.16) | 0.08 (0.10) | 0.00 (0.00) | 0.16 (0.16) | 0.969 | 0.432 | 0.890 |
| Slackia | 0.07 (0.21) | 0.08 (0.23) | 0.02 (0.03) | 0.09 (0.16) | 0.28 (0.39) | 0.05 (0.01) | 0.053 | 0.324 | 0.149 |
| Oscillibacter | 0.08 (0.10) | 0.05 (0.12) | 0.05 (0.07) | 0.05 (0.10) | 0.03 (0.02) | 0.44 (0.42) | 0.508 | <0.001 | <0.001 |
| Mitsuokella | 0.05 (0.09) | 0.08 (0.16) | 0.08 (0.14) | 0.04 (0.08) | 0.07 (0.11) | 0.10 (0.10) | 0.422 | 0.653 | 0.213 |
| Weissella | 0.05 (0.16) | 0.09 (0.41) | 0.06 (0.17) | 0.00 (0.01) | 0.02 (0.03) | 0.04 (0.10) | 0.738 | 0.857 | 0.698 |
| Clostridiavadin BB60 | 0.05 (0.11) | 0.03 (0.13) | 0.06 (0.09) | 0.14 (0.40) | 0.02 (0.01) | 0.13 (0.21) | 0.477 | 0.194 | 0.140 |
| Prevotellaceae UCG003 | 0.03 (0.13) | 0.07 (0.22) | 0.11 (0.37) | 0.03 (0.07) | 0.00 (0.00) | 0.03 (0.05) | 0.225 | 0.938 | 0.275 |
| Ruminococcus navus group | 0.03 (0.10) | 0.047 (0.10) | 0.08 (0.13) | 0.09 (0.29) | 0.00 (0.01) | 0.025 (0.04) | 0.254 | 0.974 | 0.854 |
| Family XII UCG 001 | 0.04 (0.08) | 0.041 (0.15) | 0.03 (0.07) | 0.01 (0.03) | 0.03 (0.05) | 0.26 (0.57) | 0.958 | 0.020 | 0.083 |
| Lachnospiraceae UCG003 | 0.04 (0.14) | 0.02 (0.08) | 0.00 (0.02) | 0.12 (0.53) | 0.00 (0.00) | 0.00 (0.00) | 0.508 | 0.657 | 0.117 |
| Fusobacterium | 0.02 (0.10) | 0.03 (0.06) | 0.05 (0.22) | 0.04 (0.05) | 0.00 (0.01) | 0.04 (0.08) | 0.565 | 0.917 | .0586 |
| Lactobacillus | 0.01 (0.06) | 0.01 (0.08) | 0.00 (0.00) | 0.05 (0.23) | 0.1 (0.12) | 0.00 (0.00) | 0.005 | 0.469 | 0.100 |
| Anaerovibrio | 0.01 (0.05) | 0.01 (0.04) | 0.00 (0.01) | 0.06 (0.13) | 0.00 (0.00) | 0.00 (0.00) | 0.697 | 0.117 | 0.026 |
| Hungatella | 0.01 (0.04) | 0.03 (0.18) | 0.01 (0.05) | 0.00 (0.01) | 0.00 (0.0) | 0.00 (0.00) | 0.771 | 0.977 | 0.817 |
| Raoultella | 0.00 (0.03) | 0.028 (0.15) | 0.00 (0.00) | 0.00 (0.00) | 0.07 (0.15) | 0.00 (0.00) | 0.012 | 0.501 | 0.461 |
| Tyzzerella | 0.01 (0.02) | 0.02 (0.05) | 0.00 (0.01) | 0.01 (0.02) | 0.00 (0.00) | 0.01 (0.01) | 0.782 | 0.331 | 0.770 |
| Megamonas | 0.00 (0.01) | 0.01 (0.03) | 0.00 (0.01) | 0.01 (0.03) | 0.00 (0.0) | 0.09 (0.21) | 0.937 | 0.001 | 0.005 |
| Treponema | 0.00 (0.00) | 0.00 (0.00) | 0.00 (0.02) | 0.05 (0.23) | 0.01 (0.02) | 0.00 (0.00) | 0.048 | 0.303 | 0.266 |
| Asteroleplasma | 0.00 (0.00) | 0.01 (0.02) | 0.00 (0.00) | 0.02 (0.04) | 0.00 (0.00) | 0.00 (0.01) | 0.782 | 0.022 | 0.198 |
| Paeniclostridium | 0.00 (0.00) | 0.00 (0.03) | 0.00 (0.00) | 0.00 (0.00) | 0.00 (0.00) | 0.00 (0.01) | 0.998 | 0.706 | 0.896 |
Disclaimer/Publisher’s Note: The statements, opinions and data contained in all publications are solely those of the individual author(s) and contributor(s) and not of MDPI and/or the editor(s). MDPI and/or the editor(s) disclaim responsibility for any injury to people or property resulting from any ideas, methods, instructions or products referred to in the content. |
© 2026 by the authors. Licensee MDPI, Basel, Switzerland. This article is an open access article distributed under the terms and conditions of the Creative Commons Attribution (CC BY) license.
Share and Cite
Samudio-Cruz, M.A.; Cabrera-Ruiz, E.; Cerqueda-García, D.; Rodríguez-Sobrino, P.D.; Luna-Angulo, A.; Landa-Solís, C.; Canizales-Quinteros, S.; Valencia-León, J.F.; López-Contreras, B.; Carrillo-Mora, P.; et al. Selective Gut Microbiota Remodeling Induced by a Traditional Mexican Diet and Exercise Program Improves Metabolic Health and Intestinal Permeability in Adults with Obesity and Affective Symptoms. Nutrients 2026, 18, 2308. https://doi.org/10.3390/nu18142308
Samudio-Cruz MA, Cabrera-Ruiz E, Cerqueda-García D, Rodríguez-Sobrino PD, Luna-Angulo A, Landa-Solís C, Canizales-Quinteros S, Valencia-León JF, López-Contreras B, Carrillo-Mora P, et al. Selective Gut Microbiota Remodeling Induced by a Traditional Mexican Diet and Exercise Program Improves Metabolic Health and Intestinal Permeability in Adults with Obesity and Affective Symptoms. Nutrients. 2026; 18(14):2308. https://doi.org/10.3390/nu18142308
Chicago/Turabian StyleSamudio-Cruz, María Alejandra, Elizabeth Cabrera-Ruiz, Daniel Cerqueda-García, Pamela D. Rodríguez-Sobrino, Alexandra Luna-Angulo, Carlos Landa-Solís, Samuel Canizales-Quinteros, Jesús Fernando Valencia-León, Blanca López-Contreras, Paul Carrillo-Mora, and et al. 2026. "Selective Gut Microbiota Remodeling Induced by a Traditional Mexican Diet and Exercise Program Improves Metabolic Health and Intestinal Permeability in Adults with Obesity and Affective Symptoms" Nutrients 18, no. 14: 2308. https://doi.org/10.3390/nu18142308
APA StyleSamudio-Cruz, M. A., Cabrera-Ruiz, E., Cerqueda-García, D., Rodríguez-Sobrino, P. D., Luna-Angulo, A., Landa-Solís, C., Canizales-Quinteros, S., Valencia-León, J. F., López-Contreras, B., Carrillo-Mora, P., Lino-González, A. L., Rangel-López, E., Romero-Sánchez, M. T., Frías Aguirre, Y. N., Escobedo-Castro, Y. V., Pérez Rechy, S. H., Toledo-Pérez, R., Melgarejo-Ramírez, Y., & Sánchez Chapul, L. (2026). Selective Gut Microbiota Remodeling Induced by a Traditional Mexican Diet and Exercise Program Improves Metabolic Health and Intestinal Permeability in Adults with Obesity and Affective Symptoms. Nutrients, 18(14), 2308. https://doi.org/10.3390/nu18142308